cfma obesity costs 2015
TRANSCRIPT
THE
BIGPICTUR
E
PHYSICAL & FINANCIAL
COSTS OFOBESITY
BY CHRISTIAN MORENO & MICHAEL DAVIS
FROM HEALTH INSURANCE TO WORKERS’ COMP TO THE EMR,
The cost of obesity to the American health care system is undisputed. About 74% of the adult U.S. population age 20 years and older is either overweight or obese,1 and the medical costs associated with obesity are estimated at more than $200 billion – 20.6% of national spending on medical care.2
Overweight and obesity increase health care costs incre-mentally, up to $5,530 more per year for an extremely obese person.3
Obesity may impact every aspect of a contractor’s busi-ness – from health care costs to workers’ comp claims to its Experience Modification Rating (EMR) and OSHA incidence rates. If you are managing employee safety without factoring in the impact of obesity, then you are missing a major piece of the puzzle.
Tackling the obesity problem requires a fundamental shift in the type of programming your company offers, how it structures health benefits, and how much it is willing to shake up current company protocols to make its investment in employee health worthwhile.
Reconsider How Wellness ROI Is Calculated
How much you choose to invest on wellness/obesity reduc-tion depends on a variety of factors that are truly unique to your business:
• How risky is your workforce?
• How exposed are your employees to certain chronic conditions?
• What is your employee turnover rate?
Regardless of whether your company employs a reward-based incentive model or penalty-based health-contingent outcomes program, the best way to measure the return on your wellness investment has typically been to look at a pro-gram’s Total Net Value:
Total Net Value = Total Savings from Wellness Program /
Total Medical and Pharmacy Cost
While this formula is sufficient for most industries, it assumes health care costs are the sole contributor to the denominator in the equation. In essence, the same formula used for an IT firm is also used to determine the costs associated with obesity and its comorbidities for contractors.
But what if the formula used for employers in most other industries doesn’t apply to contractors? What may be more compelling than rising health care costs among this group are several recent studies that show a strong correlation between obesity and higher workers’ comp claims.
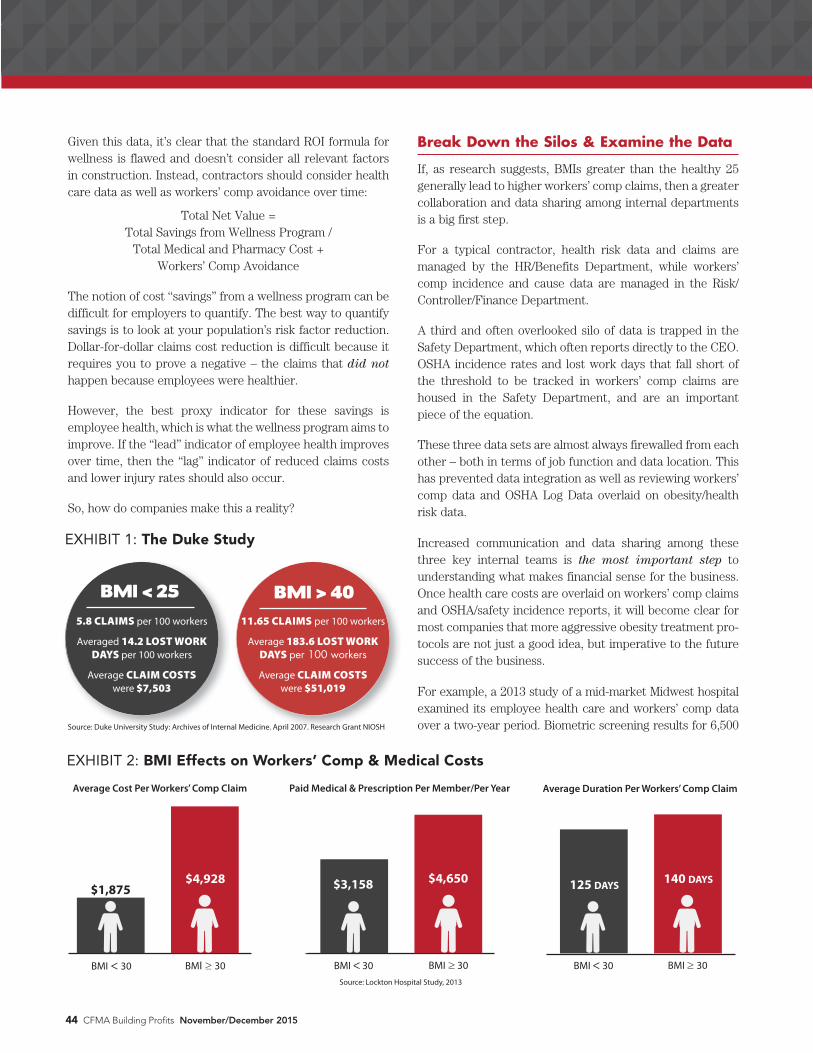
A study from Duke University tracked more than 11,000 workers and found twice as many workers’ comp claims among those with a body mass index (BMI) greater than 40 (obese) compared to those with a BMI less than 25 (healthy weight). Even more astounding was that average claim costs for obese workers were seven times higher than claim costs for workers with a BMI less than 25. And, the number of lost work days among obese workers is 14 times greater than those with a healthy BMI. (See Exhibit 1 on page 44.)
A National Institutes of Health (NIH) study of more than 42,000 workers revealed that obesity is a strong predictor of on-the-job injuries. Using workers with a healthy BMI (less than 25) as the baseline for the study, the NIH analyzed data and found that workers with a BMI of 25-30 had a 15% increase in on-the-job injuries; those with a BMI greater than 30 had a 48% increase in injuries.
A more specific subset of the NIH study evaluated firemen, who perform similar high-stress, labor-intensive work as con-tractors. Results showed a 289% increase in injuries for those with a BMI greater than 30.4
DO YOU UNDERSTAND THE TRUE IMPACT OF OBESITY TO YOUR BUSINESS?
Given this data, it’s clear that the standard ROI formula for wellness is flawed and doesn’t consider all relevant factors in construction. Instead, contractors should consider health care data as well as workers’ comp avoidance over time:
Total Net Value = Total Savings from Wellness Program /
Total Medical and Pharmacy Cost + Workers’ Comp Avoidance
The notion of cost “savings” from a wellness program can be difficult for employers to quantify. The best way to quantify savings is to look at your population’s risk factor reduction. Dollar-for-dollar claims cost reduction is difficult because it requires you to prove a negative – the claims that did not
happen because employees were healthier.
However, the best proxy indicator for these savings is employee health, which is what the wellness program aims to improve. If the “lead” indicator of employee health improves over time, then the “lag” indicator of reduced claims costs and lower injury rates should also occur.
So, how do companies make this a reality?
Break Down the Silos & Examine the Data
If, as research suggests, BMIs greater than the healthy 25 generally lead to higher workers’ comp claims, then a greater collaboration and data sharing among internal departments is a big first step.
For a typical contractor, health risk data and claims are managed by the HR/Benefits Department, while workers’ comp incidence and cause data are managed in the Risk/Controller/Finance Department.
A third and often overlooked silo of data is trapped in the Safety Department, which often reports directly to the CEO. OSHA incidence rates and lost work days that fall short of the threshold to be tracked in workers’ comp claims are housed in the Safety Department, and are an important piece of the equation.
These three data sets are almost always firewalled from each other – both in terms of job function and data location. This has prevented data integration as well as reviewing workers’ comp data and OSHA Log Data overlaid on obesity/health risk data.
Increased communication and data sharing among these three key internal teams is the most important step to understanding what makes financial sense for the business. Once health care costs are overlaid on workers’ comp claims and OSHA/safety incidence reports, it will become clear for most companies that more aggressive obesity treatment pro-tocols are not just a good idea, but imperative to the future success of the business.
For example, a 2013 study of a mid-market Midwest hospital examined its employee health care and workers’ comp data over a two-year period. Biometric screening results for 6,500
44 CFMA Building Profits November/December 2015
BMI < 25 BMI > 405.8 CLAIMS per 100 workers
Averaged 14.2 LOST WORK DAYS per 100 workers
Average CLAIM COSTS were $7,503
11.65 CLAIMS per 100 workers
Average 183.6 LOST WORK DAYS per 100 workers
Average CLAIM COSTS were $51,019
Source: Duke University Study: Archives of Internal Medicine. April 2007. Research Grant NIOSH
EXHIBIT 1: The Duke Study
BMI < 30 BMI ≥ 30
$1,875$4,928
Average Cost Per Workers’ Comp Claim
0
1
2
3
4
5
BMI < 30
$3,158 $4,650
Paid Medical & Prescription Per Member/Per Year
BMI < 30
125 DAYS 140 DAYS
Average Duration Per Workers’ Comp Claim
Source: Lockton Hospital Study, 2013
BMI ≥ 30 BMI ≥ 30
EXHIBIT 2: BMI Effects on Workers’ Comp & Medical Costs
employees were overlaid on workers’ comp/accident rates. As shown in Exhibit 2, results showed twice the cost for workers with a BMI greater than 30. The additional workers’ comp claim costs appears to be driven by 1) obesity making treatment more complicated and 2) the disability period being extended due to longer patient recovery time.
While the employer clearly saw a connection in the obesity and workers’ comp data, a deeper analysis suggests a strong correlation between the two.
Obesity is the driver to disease states such as chronic obstruc-tive pulmonary disease (COPD), diabetes, high blood pres-sure, high cholesterol, and coronary artery disease (CAD). If present (or absent) in a population, then a reasonably strong line can be drawn to the presence (or absence) of obesity. Combined with obesity and incidence/severity data, the chronic condition data allows for the triangulation of the potential source of additional risk.
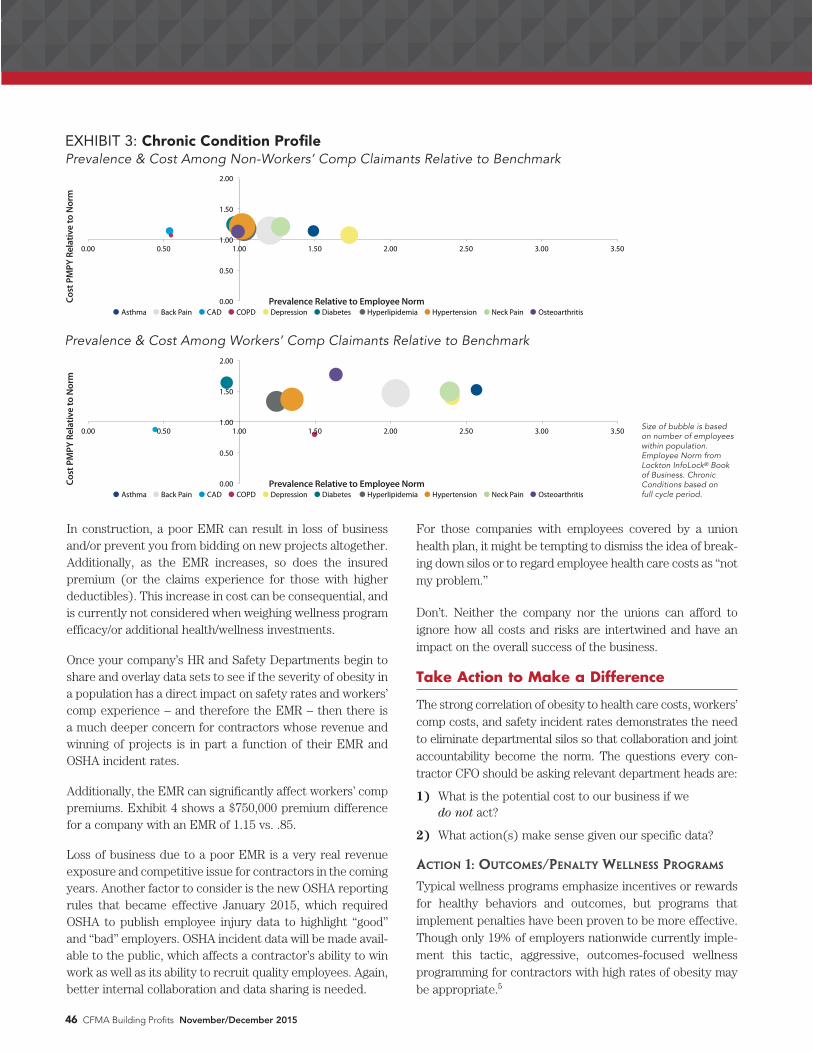
When we examine the chronic disease profile of nonchronic disease sufferers in the first bubble graph in Exhibit 3 on page 46, there is a close grouping to the norm in both cost and prevalence.
Similarly, when the workers’ comp claimants are examined in the second chart, there is a significantly larger propensity for the presence of chronic conditions. Put more simply:
If a worker is injured on the job, it is highly likely that
he/she also has a chronic condition(s) associated with
obesity.
A much deeper analysis of this employer would be necessary to make a case for causation over correlation. However, when the various data points of studies conducted on this topic are combined, a pattern of strong causal suggestions becomes apparent. If a causal relationship could be proven, there might be a slowing of/improvement in workers’ comp experience with a reduction in obesity in the workforce. Again, without specific data, this is a significant leap, but an important one to consider.
Don’t Forget About the EMR
The ramifications of high obesity rates extend far beyond health care costs, lost workdays, and workers’ comp claims. Outside influences and pressure from customers make safety performance a component of whether contractors are qualified to bid for projects.
November/December 2015 CFMA Building Profits 45
888.303.5338 www.eidebai l ly.com
Eide Bailly’s 1,200 construction and real estate clients are connected to a team of professionals who deliver tax,
assurance and consulting services specifically designed to help contactors grow with confidence.
Experience the Eide Bailly Difference. Call today to learn how we can help you with your business needs.
YOU SHOULDN’T HAVE TO CHOOSE BETWEEN
EXCEPTIONAL PEOPLE AND EXCEPTIONAL RESULTS.
OBESITY: PHYSICAL & FINANCIAL COSTS
In construction, a poor EMR can result in loss of business and/or prevent you from bidding on new projects altogether. Additionally, as the EMR increases, so does the insured premium (or the claims experience for those with higher deductibles). This increase in cost can be consequential, and is currently not considered when weighing wellness program efficacy/or additional health/wellness investments.
Once your company’s HR and Safety Departments begin to share and overlay data sets to see if the severity of obesity in a population has a direct impact on safety rates and workers’ comp experience – and therefore the EMR – then there is a much deeper concern for contractors whose revenue and winning of projects is in part a function of their EMR and OSHA incident rates.
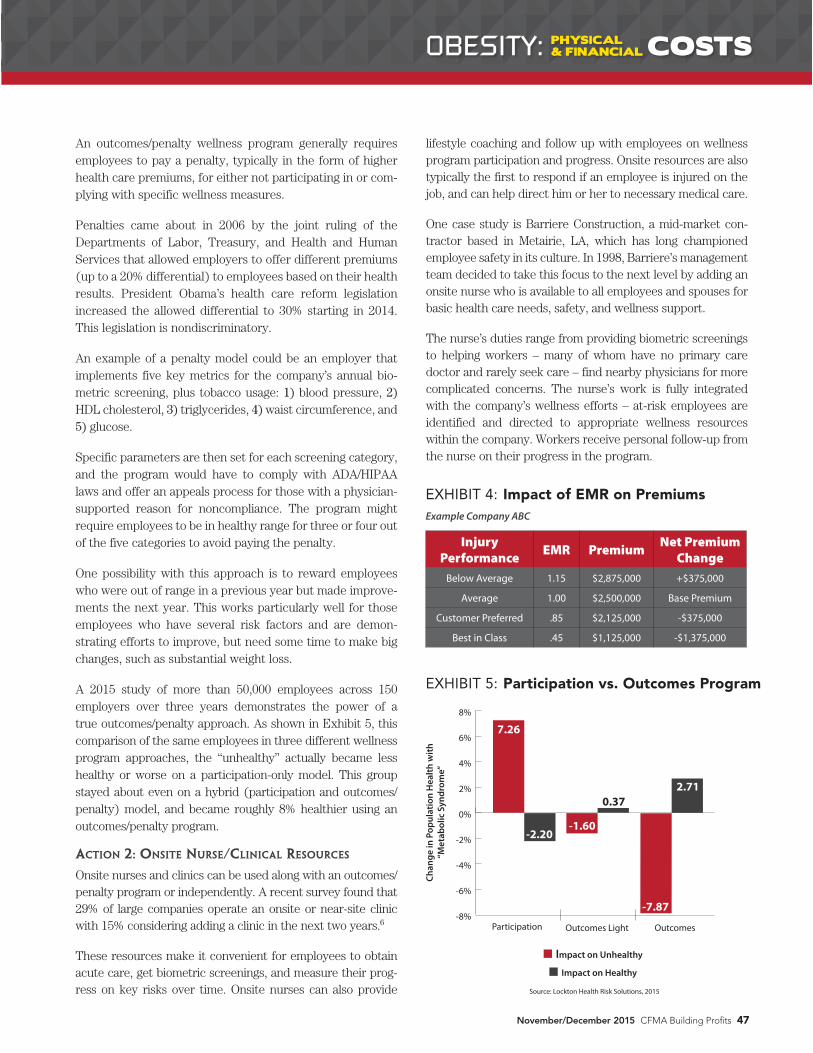
Additionally, the EMR can significantly affect workers’ comp premiums. Exhibit 4 shows a $750,000 premium difference for a company with an EMR of 1.15 vs. .85.
Loss of business due to a poor EMR is a very real revenue exposure and competitive issue for contractors in the coming years. Another factor to consider is the new OSHA reporting rules that became effective January 2015, which required OSHA to publish employee injury data to highlight “good” and “bad” employers. OSHA incident data will be made avail-able to the public, which affects a contractor’s ability to win work as well as its ability to recruit quality employees. Again, better internal collaboration and data sharing is needed.
For those companies with employees covered by a union health plan, it might be tempting to dismiss the idea of break-ing down silos or to regard employee health care costs as “not my problem.”
Don’t. Neither the company nor the unions can afford to ignore how all costs and risks are intertwined and have an impact on the overall success of the business.
Take Action to Make a Difference
The strong correlation of obesity to health care costs, workers’ comp costs, and safety incident rates demonstrates the need to eliminate departmental silos so that collaboration and joint accountability become the norm. The questions every con-tractor CFO should be asking relevant department heads are:
1) What is the potential cost to our business if we do not act?
2) What action(s) make sense given our specific data?
ACTION 1: OUTCOMES/PENALTY WELLNESS PROGRAMS
Typical wellness programs emphasize incentives or rewards for healthy behaviors and outcomes, but programs that implement penalties have been proven to be more effective. Though only 19% of employers nationwide currently imple-ment this tactic, aggressive, outcomes-focused wellness programming for contractors with high rates of obesity may be appropriate.5
46 CFMA Building Profits November/December 2015
Size of bubble is based on number of employees within population. Employee Norm from Lockton InfoLock® Book of Business. Chronic Conditions based on full cycle period.
0.00
0.50
1.00
1.50
2.00
0.00 0.50 1.00 1.50 2.00 2.50 3.00 3.50
Cost
PM
PY R
elat
ive
to N
orm
Prevalence Relative to Employee Norm
Asthma Back Pain CAD COPD Depression Diabetes Hyperlipidemia Hypertension Neck Pain Osteoarthritis
Cost
PM
PY R
elat
ive
to N
orm
EXHIBIT 3: Chronic Condition Profile Prevalence & Cost Among Non-Workers’ Comp Claimants Relative to Benchmark
Prevalence Relative to Employee Norm
Prevalence & Cost Among Workers’ Comp Claimants Relative to Benchmark
0.00
0.50
1.00
1.50
2.00
0.00 0.50 1.00 1.50 2.00 2.50 3.00 3.50
Cost
PM
PY R
elat
ive
to N
orm
Prevalence Relative to Employee Norm
Asthma Back Pain CAD COPD Depression Diabetes Hyperlipidemia Hypertension Neck Pain Osteoarthritis
Cost
PM
PY R
elat
ive
to N
orm
Prevalence Relative to Employee Norm
An outcomes/penalty wellness program generally requires employees to pay a penalty, typically in the form of higher health care premiums, for either not participating in or com-plying with specific wellness measures.
Penalties came about in 2006 by the joint ruling of the Departments of Labor, Treasury, and Health and Human Services that allowed employers to offer different premiums (up to a 20% differential) to employees based on their health results. President Obama’s health care reform legislation increased the allowed differential to 30% starting in 2014. This legislation is nondiscriminatory.
An example of a penalty model could be an employer that implements five key metrics for the company’s annual bio-metric screening, plus tobacco usage: 1) blood pressure, 2) HDL cholesterol, 3) triglycerides, 4) waist circumference, and 5) glucose.
Specific parameters are then set for each screening category, and the program would have to comply with ADA/HIPAA laws and offer an appeals process for those with a physician-supported reason for noncompliance. The program might require employees to be in healthy range for three or four out of the five categories to avoid paying the penalty.
One possibility with this approach is to reward employees who were out of range in a previous year but made improve-ments the next year. This works particularly well for those employees who have several risk factors and are demon-strating efforts to improve, but need some time to make big changes, such as substantial weight loss.
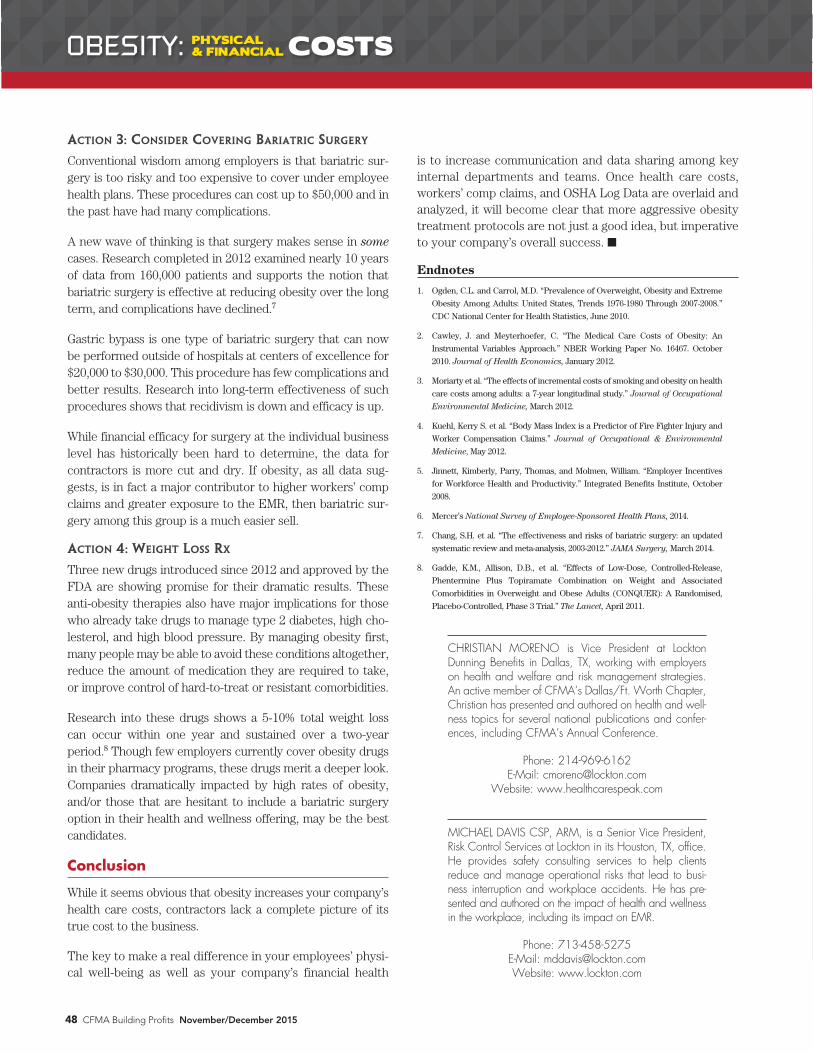
A 2015 study of more than 50,000 employees across 150 employers over three years demonstrates the power of a true outcomes/penalty approach. As shown in Exhibit 5, this comparison of the same employees in three different wellness program approaches, the “unhealthy” actually became less healthy or worse on a participation-only model. This group stayed about even on a hybrid (participation and outcomes/penalty) model, and became roughly 8% healthier using an outcomes/penalty program.
ACTION 2: ONSITE NURSE/CLINICAL RESOURCES
Onsite nurses and clinics can be used along with an outcomes/penalty program or independently. A recent survey found that 29% of large companies operate an onsite or near-site clinic with 15% considering adding a clinic in the next two years.6
These resources make it convenient for employees to obtain acute care, get biometric screenings, and measure their prog-ress on key risks over time. Onsite nurses can also provide
lifestyle coaching and follow up with employees on wellness program participation and progress. Onsite resources are also typically the first to respond if an employee is injured on the job, and can help direct him or her to necessary medical care.
One case study is Barriere Construction, a mid-market con-tractor based in Metairie, LA, which has long championed employee safety in its culture. In 1998, Barriere’s management team decided to take this focus to the next level by adding an onsite nurse who is available to all employees and spouses for basic health care needs, safety, and wellness support.
The nurse’s duties range from providing biometric screenings to helping workers – many of whom have no primary care doctor and rarely seek care – find nearby physicians for more complicated concerns. The nurse’s work is fully integrated with the company’s wellness efforts – at-risk employees are identified and directed to appropriate wellness resources within the company. Workers receive personal follow-up from the nurse on their progress in the program.
November/December 2015 CFMA Building Profits 47
EXHIBIT 4: Impact of EMR on Premiums
Injury Performance EMR Premium Net Premium
ChangeBelow Average 1.15 $2,875,000 +$375,000
Average 1.00 $2,500,000 Base Premium
Customer Preferred .85 $2,125,000 -$375,000
Best in Class .45 $1,125,000 -$1,375,000
Example Company ABC
Source: Lockton Health Risk Solutions, 2015
-8%
-6%
-4%
-2%
0%
2%
4%
6%
8%
Chan
ge in
Pop
ulat
ion
Hea
lth w
ith
“Met
abol
ic S
yndr
ome”
Impact on Unhealthy
Impact on Healthy
Participation Outcomes Light Outcomes
7.26
-2.20
0.37
-7.87
2.71
-1.60
OBESITY: PHYSICAL & FINANCIAL COSTS
EXHIBIT 5: Participation vs. Outcomes Program
ACTION 3: CONSIDER COVERING BARIATRIC SURGERY
Conventional wisdom among employers is that bariatric sur-gery is too risky and too expensive to cover under employee health plans. These procedures can cost up to $50,000 and in the past have had many complications.
A new wave of thinking is that surgery makes sense in some cases. Research completed in 2012 examined nearly 10 years of data from 160,000 patients and supports the notion that bariatric surgery is effective at reducing obesity over the long term, and complications have declined.7
Gastric bypass is one type of bariatric surgery that can now be performed outside of hospitals at centers of excellence for $20,000 to $30,000. This procedure has few complications and better results. Research into long-term effectiveness of such procedures shows that recidivism is down and efficacy is up.
While financial efficacy for surgery at the individual business level has historically been hard to determine, the data for contractors is more cut and dry. If obesity, as all data sug-gests, is in fact a major contributor to higher workers’ comp claims and greater exposure to the EMR, then bariatric sur-gery among this group is a much easier sell.
ACTION 4: WEIGHT LOSS RX
Three new drugs introduced since 2012 and approved by the FDA are showing promise for their dramatic results. These anti-obesity therapies also have major implications for those who already take drugs to manage type 2 diabetes, high cho-lesterol, and high blood pressure. By managing obesity first, many people may be able to avoid these conditions altogether, reduce the amount of medication they are required to take, or improve control of hard-to-treat or resistant comorbidities.
Research into these drugs shows a 5-10% total weight loss can occur within one year and sustained over a two-year period.8 Though few employers currently cover obesity drugs in their pharmacy programs, these drugs merit a deeper look. Companies dramatically impacted by high rates of obesity, and/or those that are hesitant to include a bariatric surgery option in their health and wellness offering, may be the best candidates.
Conclusion
While it seems obvious that obesity increases your company’s health care costs, contractors lack a complete picture of its true cost to the business.
The key to make a real difference in your employees’ physi-cal well-being as well as your company’s financial health
is to increase communication and data sharing among key internal departments and teams. Once health care costs, workers’ comp claims, and OSHA Log Data are overlaid and analyzed, it will become clear that more aggressive obesity treatment protocols are not just a good idea, but imperative to your company’s overall success.
Endnotes
1. Ogden, C.L. and Carrol, M.D. “Prevalence of Overweight, Obesity and Extreme
Obesity Among Adults: United States, Trends 1976-1980 Through 2007-2008.”
CDC National Center for Health Statistics, June 2010.
2. Cawley, J. and Meyterhoefer, C. “The Medical Care Costs of Obesity: An
Instrumental Variables Approach.” NBER Working Paper No. 16467. October
2010. Journal of Health Economics, January 2012.
3. Moriarty et al. “The effects of incremental costs of smoking and obesity on health
care costs among adults: a 7-year longitudinal study.” Journal of Occupational
Environmental Medicine, March 2012.
4. Kuehl, Kerry S. et al. “Body Mass Index is a Predictor of Fire Fighter Injury and
Worker Compensation Claims.” Journal of Occupational & Environmental
Medicine, May 2012.
5. Jinnett, Kimberly, Parry, Thomas, and Molmen, William. “Employer Incentives
for Workforce Health and Productivity.” Integrated Benefits Institute, October
2008.
6. Mercer’s National Survey of Employee-Sponsored Health Plans, 2014.
7. Chang, S.H. et al. “The effectiveness and risks of bariatric surgery: an updated
systematic review and meta-analysis, 2003-2012.” JAMA Surgery, March 2014.
8. Gadde, K.M., Allison, D.B., et al. “Effects of Low-Dose, Controlled-Release,
Phentermine Plus Topiramate Combination on Weight and Associated
Comorbidities in Overweight and Obese Adults (CONQUER): A Randomised,
Placebo-Controlled, Phase 3 Trial.” The Lancet, April 2011.
CHRISTIAN MORENO is Vice President at Lockton Dunning Benefits in Dallas, TX, working with employers on health and welfare and risk management strategies. An active member of CFMA’s Dallas/Ft. Worth Chapter, Christian has presented and authored on health and well-ness topics for several national publications and confer-ences, including CFMA’s Annual Conference.
Phone: 214-969-6162 E-Mail: [email protected]
Website: www.healthcarespeak.com
MICHAEL DAVIS CSP, ARM, is a Senior Vice President, Risk Control Services at Lockton in its Houston, TX, office. He provides safety consulting services to help clients reduce and manage operational risks that lead to busi-ness interruption and workplace accidents. He has pre-sented and authored on the impact of health and wellness in the workplace, including its impact on EMR.
Phone: 713-458-5275 E-Mail: [email protected] Website: www.lockton.com
48 CFMA Building Profits November/December 2015
OBESITY: PHYSICAL & FINANCIAL COSTS