ch 5 accountability and transparency: the sovereign wealth ...€¦ · wealth fund scoreboard as...
TRANSCRIPT

5Accountability andTransparency: The SovereignWealth Fund Scoreboard
As summarized at the end of chapter 4, most of the suggested approachesto address the five concerns about sovereign wealth funds discussed inchapter 3 are at best deficient and at worst counterproductive. In 2007,when I first began to think and write about making the world safer forSWFs, I proposed a collective effort to develop an internationally agreed-upon standard for SWFs (Truman 2007).1
I suggested, unrealistically but with good intentions, that the standardshould apply to the gamut of international investment activities of gov-ernments, starting with traditional foreign exchange reserves, coveringSWFs of all types, and including pension funds, investment holding com-panies, and miscellaneous international assets. My principal short-runfocus, however, was SWFs. In making this suggestion, I was motivatedand encouraged by similar international efforts to enhance transparencyand accountability, specifically in the context of the Asian financial crisesin the late 1990s (see box 5.1).
In the context of SWFs and the concerns summarized in chapter 3—mismanagement of SWF investments, pursuit of political or economicpower objectives, financial protectionism in anticipation of or in responseto the pursuit by SWFs of those objectives, financial market turmoil anduncertainty, and conflicts of interest—transparency primarily is a tool to
69
1. Some characterize the use of agreed-upon international standards as a “soft law” ap-proach to such issues (Rose 2008).
© Peterson Institute for International Economics | www.piie.com
70 SOVEREIGN WEALTH FUNDS: THREAT OR SALVATION?
enhance accountability. However, transparency and accountability canalso be treated as separate, but related, concepts. As part of my researchon SWFs, I considered what would be appropriate content for such an in-ternational standard. In the process, I developed a scoreboard for SWFsthat the Peterson Institute for International Economics released in October
Box 5.1 International transparency standards—Some history
In the wake of the Asian financial crises in the late 1990s, a group of systemically
significant economies formed the Group of 22 (G-22) in a collective effort to as-
semble the lessons from those crises. The G-22, which turned out to be the pre-
cursor of the Group of Twenty (G-20), sponsored three working groups, one of
which focused on the critical topic of enhancing transparency and accountability.1
In its report released in October 1998, the Working Group on Transparency and
Accountability concluded that “a lack of transparency and accountability exacer-
bated financial weaknesses at the firm and national levels and complicated efforts
to resolve the ensuing crisis” (Group of 22, 1998). The report observed, “Trans-
parency contributes to the efficient allocation of resources by ensuring that mar-
ket participants have sufficient information to identify risks and to distinguish one
firm’s, or one country’s, circumstances from another’s. Moreover, transparency
helps to inform market expectations, thereby helping to stabilize markets during
periods of uncertainty and also contributing to the effectiveness of announced
policies.” The report also said, “Accountability refers to the need to justify and
accept responsibility for decisions taken. Accountability imposes discipline on
decision-makers, thereby helping to improve the quality of decisions taken. Trans-
parency helps to promote accountability by obliging decision-makers to make
their decisions and the reasoning behind them known.”
The working group also gave a further boost to the development of the IMF’s
Special Data Dissemination Standard (SDDS) and General Data Dissemination Sys-
tem, including the establishment of the Reserves Template (IMF 2000) as part of
the SDDS. The working group recommended enhancement of various data collec-
tion and publication systems as well as establishment of a working party including
private-sector representatives “to examine the modalities of compiling and pub-
lishing data on the international exposures of investment banks, hedge funds, and
other institutional investors.” This last recommendation did not produce any spe-
cific results, but the underlying issues continued to inform debates about the
structure and functioning of the international financial architecture and are very
much a part of the discussion of lessons to be learned and applied in the aftermath
of the global economic and financial crisis of 2007–09.
1. The mandates of the other two working groups were on strengthening financial systems
and managing international financial crises.
© Peterson Institute for International Economics | www.piie.com

ACCOUNTABILITY AND TRANSPARENCY 71
2007.2 I subsequently revised the scoreboard and expanded the coverageof SWFs, and the results were released in April 2008 (Truman 2008a).3
This chapter starts with a further update and revision of the scoreboardfor SWFs along with a comparison of these 2009 results with those for 2007and 2008. (Further details about the scoreboard are provided in appendix5A.) Next, the new scoreboard results are compared with some other indicesand indicators. I then address some of the issues that have been raised aboutthis approach to SWF accountability. The chapter concludes with some ob-servations on how an agreed-upon international standard for SWFs will as-sist in addressing the five principal concerns about such investment vehicles.
The Scoreboard
Table 5.1 presents the results of my latest assessment of the accountabilityand transparency of 53 SWFs of 37 countries. The funds include 40 of thenonpension SWFs listed in table 2.1 along with the four pension reserveSWFs and nine other pension SWFs.4 With Doug Dowson and Daniel Xie, Ihave scored each fund on 33 elements based on systematic, regularly avail-able, public information.5 We asked simple questions that can be answered
2. The published version is Truman (2008c).
3. See also Edwin M. Truman, “ Sovereign Wealth Funds: New Challenges for a ChangingLandscape,” testimony before the Subcommittee on Domestic and International MonetaryPolicy, Trade and Technology, Financial Services Committee, US House of Representatives,September 10, 2008, available at www.piie.com (accessed on July 12, 2010).
4. We scored 20 of the 23 SWFs listed in table 2.1 with estimated total assets of more than$50 billion. The exceptions were Libya’s SWF, for which we had insufficient information; theholdings of the Saudi Arabian Monetary Agency (SAMA) which does not have an identifi-able structure independent from the central bank; and Queensland’s Investment Corpo-ration, which is a government-owned investment management firm. We treated the twoRussian SWFs as one observation, leaving a total of 19 large SWFs, including 11 nonpensionSWFs and eight pension SWFs. In addition to the three large nonpension entities listed intable 2.1, we did not score 26 other smaller nonpension entities, as explained in the footnotesin table 2.1, because they are not independent investment pools, are invested exclusively do-mestically, were too new, and/or insufficient information was available. The scoreboard cov-ers almost 90 percent of the total assets listed in table 2.1 and 85 percent of the internationalassets, with SAMA accounting for most of the difference.
5. For some of our facts, we relied on independent, published documents, such as those ofthe IMF or World Bank. However, in general, we required that the SWF produce an ongoingflow of systematic information. Consequently, more is known about some SWFs than is re-flected in our scoring, but that information is anecdotal and occasional rather than system-atic and regular. For the scoreboard, it is not sufficient that an individual SWF provides in-formation in ad hoc interviews with the press. To be fair, some SWFs state that they arewilling to respond to freedom of information or less formal requests for information. Oneexample is the Alberta Heritage Savings Trust Fund, and another is the State Oil Fund of theRepublic of Azerbaijan. Although we have tried to be rigorous and systematic in our evalu-ation of each fund, some degree of subjectivity necessarily is present in our procedure.
© Peterson Institute for International Economics | www.piie.com

72
Table 5.1 Sovereign wealth fund scoreboard (percent of maximum possible points)
Accountabilityand
Country Funda Structure Governance transparency Behavior Total
Norway Government Pension Fund-Global 100 100 100 75 97 United States California Public Employees’ Retirement System (P) 88 100 96 100 95 New Zealand Superannuation Fund (PR) 88 100 100 75 94 Canada Canada Pension Plan (P) 88 100 96 75 92 United States Alaska Permanent Fund 94 86 100 75 92
Wyoming Permanent Mineral Trust Fund 94 93 86 100 91 Canada Caisse de dépôt et placement du Québec (P) 88 100 89 75 89 France Fonds de réserve pour les retraites (P) 88 100 89 75 89 Ireland National Pensions Reserve Fund (PR) 88 100 86 63 86 Netherlands Stichting Pensioenfonds ABP (P) 88 86 86 75 85Timor-Leste Petroleum Fund 100 43 100 75 85 Japan Government Pension Investment Fund (P) 88 93 80 75 84 Canada Ontario Teachers’ Pension Plan (P) 88 86 89 50 83 Trinidad and Tobago Heritage and Stabilization Fund 100 64 93 50 83 Australia Future Fund (PR) 88 86 75 75 80 United States New Mexico Severance Tax Permanent Fund 94 50 89 75 80Thailand Government Pension Fund (P) 88 86 88 13 78 Azerbaijan State Oil Fund 94 57 89 25 76 Canada Alberta Heritage Savings Trust Fund 94 57 79 50 74 Singapore Temasek Holdings 88 79 68 50 73Chile Economic and Social Stabilization Fund 94 57 86 0 71 China National Social Security Fund (P) 81 43 82 50 70 Hong Kong Exchange Fund 88 43 79 50 70 Chile Pension Reserve Fund (PR) 81 57 86 0 68 United States Alabama Trust Fund 94 57 64 50 68 Kazakhstan National Fund 94 57 64 25 65 Singapore Government of Singapore Investment Corporation 81 71 61 38 65 Kuwait Kuwait Investment Authority 88 86 48 25 63 Korea Korea Investment Corporation 75 71 45 63 60 United Arab Emirates Mubadala Development Company 63 57 68 25 59 China China Investment Corporation 75 50 59 25 57
© Peterson Institute for International Economics | www.piie.com

73
Botswana Pula Fund 69 57 57 25 56 United Arab Emirates Dubai International Capital 75 86 36 25 55 Russia Reserve Fund and National Wealth Fund 81 29 50 25 50 São Tomé and Príncipe National Oil Account 100 57 29 0 48 Malaysia Khazanah Nasional 56 50 46 0 44 Mexico Oil Income Stabilization Fund 81 14 43 25 44 Kiribati Revenue Equalization Reserve Fund 81 57 7 0 35 Vietnam State Capital Investment Corporation 81 57 7 0 35 Bahrain Mumtalakat Holding Company 38 14 43 0 30 Algeria Revenue Regulation Fund 69 29 14 0 29Iran Oil Stabilization Fund 63 29 18 0 29 Nigeria Excess Crude Account 63 36 14 0 29 Venezuela Macroeconomic Stabilization Fund 69 14 18 0 27
National Development Fund 50 14 27 0 27 United Arab Emirates International Petroleum Investment Company 44 29 21 0 26 Oman State General Reserve Fund 63 0 18 0 23 Brunei Darussalam Brunei Investment Agency 44 0 25 0 21 United Arab Emirates Investment Corporation of Dubai 44 7 21 0 21 Sudan Oil Revenue Stabilization Account 50 0 14 0 18 Qatar Qatar Investment Authority 47 14 2 0 15United Arab Emirates Istithmar World 31 21 7 0 15
Abu Dhabi Investment Authority 25 14 4 0 11
Nonpension totalb 73 45 47 24 50 Pension totalb 87 87 88 62 84 SWF totalb 76 56 57 33 59
MemorandumUnited Kingdom Terra Firma 100 73 79 50 75 United States Harvard University Endowment 100 69 66 50 69
TIAA-CREF 100 88 86 75 84 Blackstone 100 54 75 50 70
Totalb 100 71 76 56 74
a. Pension funds (P) and reserve pension funds (PR) shown in italics.
b. For each category the value under total represents the average for all funds.
© Peterson Institute for International Economics | www.piie.com

74 SOVEREIGN WEALTH FUNDS: THREAT OR SALVATION?
either yes or no. A “yes” receives a point, but we allow for partial credit. A“no” receives no credit. At least one SWF must receive a positive score oneach element for that element to be included; normally several do.6
We group the elements in four categories: (1) structure of the fund, in-cluding its objectives, links to the government’s fiscal policy, and whetherthe fund is independent from the countries’ international reserves; (2) gov-ernance of the fund, including the roles of the government, the board of thefund and its managers, and whether the fund follows guidelines for cor-porate responsibility; (3) accountability and transparency of the fund in its investment strategy, investment activities, reporting, and audits; and (4) behavior of the fund in managing its portfolio and its risk managementpolicies, including the use of leverage and derivatives. Table 5.1 providesoverall scores for each fund and for each category. The scores are presentedas a percentage of the maximum possible points—33 for the total and ineach of the four categories (8, 7, 14, and 4, respectively).
The average score is 59 for all the SWFs scored, and 50 for the nonpen-sion SWFs alone.7 The median score is 64 for all funds, and 55 for the non-pension SWFs alone. Weighted by actual or estimated foreign assets (fromtable 2.1), the average is 58 for all funds, and 50 for the nonpension SWFs;the averages are slightly higher when weighted by total assets.
The results presented in table 5.1 point to a number of important sum-mary observations.
First, all SWFs are not the same. Nor is there one cluster of “good” fundsand another cluster of “bad” funds. It is remarkable how even knowl-edgeable researchers, such as Bortolotti et al. (2009), assert that all SWFslack transparency.8 The overall scores range from 97 to 11 out of a possible100. The rating of each fund can be improved. The distribution of scores isquite even, with the largest number of funds (10) in the 80s and the nextlargest number of funds (nine) in the 20s.
6. In the 2007 edition of the scoreboard, we included 33 SWFs of 28 countries that we scoredon 25 elements. In the 2008 edition, we included 46 SWFs of 35 countries that we scored on33 elements. For this edition we have added seven funds and two more countries and againwe have scored them on 33 elements; however, we dropped four elements from the 2008 edi-tion (one of which had been in the 2007 edition) because we felt they were more prescriptivethan descriptive, and we added four elements from the Santiago Principles discussed in thenext chapter. See appendix 5A for details.
7. This average can be thought of as a weighted average of the four categories, where theweights are the number of questions in each category relative to the total. The simple aver-age of the scores in the four categories comes out at three points lower for the two groups offunds individually and, thus, for the total of all SWFs. However, the simple correlation of thetwo methods of scoring is 0.98.
8. In the words of Bortolotti et al. (2009, 10), “Aside from a few notable exceptions (princi-pally the Norwegian pension and oil stabilization funds), SWFs have been extremely reluc-tant to disclose any information about their investment policies and returns.”
© Peterson Institute for International Economics | www.piie.com
ACCOUNTABILITY AND TRANSPARENCY 75
Second, the SWFs are in three broad groups: 14 funds with scores above80, 14 funds with scores at or below 30, and 25 funds in a middle group.The top group includes funds of two developing countries, Timor-Lesteand Trinidad and Tobago, as well as nine pension and three nonpensionSWFs from industrial countries.
The middle group includes funds of nonindustrial countries as diverseas Russia, Mexico, Kuwait, and Singapore. Singapore’s two funds haveclose to identical overall scores, but their scores differ on several individ-ual elements. This group also includes Australia’s Future Fund and theSWF of the province of Alberta, Canada, though both score above themean and median for SWFs as a whole.
The bottom group includes four funds from the United Arab Emirates,two from Dubai, and two from Abu Dhabi, one of which is the Abu DhabiInvestment Authority, which scores at the bottom using data from 2009.9
(However, see box 5.2, which updates the ADIA’s scores based on its 2009annual report published in March 2010.) The ADIA reportedly has an ex-cellent reputation in financial markets and participated in the Interna-tional Working Group of SWFs that drew up the Santiago Principles. Thelowest-ranking SWF from Dubai is Istithmar World, which has been ru-mored to be in the process of liquidation. Its difficulties are associated inlarge part with commercial real estate and preceded the problems of itsparent Dubai World.
Third, although each of the 13 representative pension SWFs scores 68 orhigher, that group of 24 funds also includes nine nonpension SWFs. Thus,it is not unreasonable to hold nonpension SWFs to the standard of ac-countability of pension funds. Chile’s pension and nonpension SWFs areboth in the group scoring 68 or better. On the other hand, China’s Na-tional Social Security Fund is there, but the CIC is somewhat lower at 57.
Fourth, of the 15 nonpension SWFs listed in table 2.1 that have esti-mated assets of more than $50 billion, we scored 12 of them with $2.6 tril-lion in estimated total assets and $2.3 trillion in estimated foreign assets ofnonpension SWFs, more than 70 percent of the respective totals listed inthe table.10 Norway’s SWF is in the top group. The bottom group includes
9. A sister organization to the ADIA is the Abu Dhabi Investment Council (ADIC), whichwas established in 2007. It invests primarily, but not exclusively, in the Abu Dhabi economy,particularly in financial institutions. The Investment Company Institute reports that theADIA receives 70 percent of Abu Dhabi’s fiscal surplus and the ADIC receives 30 percent(www.swfinstitute.org/fund/adia.php [accessed on April 26, 2010]). We do not rate theADIC on the scoreboard presented here, but in the 2007 and 2008 versions of the scoreboard,we rated it the same as the ADIA because at the time we could not distinguish the ADIAfrom the ADIC.
10. Excluded SWFs are those of Libya (because we did not have enough information to scorethe fund), the Queensland Investment Corporation (which is more of a public investmentmanagement firm), and in effect one of the Russian SWFs, which we scored as a single entity.
© Peterson Institute for International Economics | www.piie.com

76 SOVEREIGN WEALTH FUNDS: THREAT OR SALVATION?
four funds, two in the United Arab Emirates (one each from Abu Dhabiand Dubai), and one each from Algeria and Qatar. The remaining sevenare in the middle group. The simple average score for these funds is 52,slightly below the mean and median for all nonpension SWFs.
Fifth, we also scored, for purposes of comparison, four non-SWF in-vestment entities listed as memo items at the bottom of table 2.1. They arethe Teachers Insurance and Annuity Association—College Retirement Eq-uities Fund (TIAA-CREF), a private-sector retirement fund that is similarin many respects to public-sector pension funds; the Harvard UniversityEndowment, which managed a portfolio of $26 billion as of June 30, 2009,down from $37 billion a year earlier, on principles of long-term capitalpreservation and current-period return that are similar to those that mo-tivate some SWFs; the publicly traded Blackstone Corporation, whichspecializes in private equity investment; and Terra Firma, a UK privateequity firm that is not publicly traded. The average score for the four com-parators is 74. TIAA-CREF’s score (84) is equal to the average for the 13pension SWFs that we scored, though seven of them score higher. TheHarvard Endowment scores somewhat lower at 69 but above the meansfor nonpension and all SWFs that we scored. Blackstone scores about thesame, and Terra Firma a bit higher. Thus, the highest-scoring SWFs do aswell as these other four investment entities and vice versa. Moreover,based on this comparison, it is reasonable to expect the majority of theSWFs to score higher in the future. In these cases, the private sector is cre-ating a higher bar for the public sector.
Box 5.2 Updated scores for the Abu Dhabi Investment Authority
Subsequent to our completion of the SWF scoreboard presented in table 5.1 with
data available as of the end of 2009, the Abu Dhabi Investment Authority (ADIA) re-
leased its first-ever annual report on March 14, 2010 (ADIA 2010). Because of the
size and importance of the ADIA, we rescored that SWF. Its overall score increased
from 11 to 58, essentially matching the mean for all SWFs that we scored and 8 per-
centage points above the mean for the nonpension SWFs. The increase of 51 points
from the ADIA’s score on the 2007 SWF scoreboard is comparable with the largest
change for any fund, the Government of Singapore Investment Corporation.
On the structure component, the ADIA’s score increased to 75, roughly in line
with the mean of 76 for all SWFs and 73 for nonpension SWFs. On the governance
component, the ADIA’s new score of 86 was substantially higher than the mean of
56 for all SWFs and 45 for nonpension SWFs. On accountability and transparency,
the ADIA now scores 45, below the mean of 57 for all SWFs and approximately
equal to the average for all nonpension SWFs. Finally, on the behavior component,
the ADIA receives 25—below the average for all SWFs of 33, but in line with the av-
erage for nonpension SWFs.
© Peterson Institute for International Economics | www.piie.com

ACCOUNTABILITY AND TRANSPARENCY 77
Sixth, the difference in scores among different SWFs from the same coun-try, mentioned above, is not unique to China or Singapore. The scores forthe four Canadian funds range from 74 to 92, and the scores for the five USfunds range from 68 to 95. It also should be noted that despite the lowscores for many of the funds from the United Arab Emirates, one SWF fromAbu Dhabi (Mubadala Development Company) scores at the mean for allnonpension SWFs, and one from Dubai (Dubai International Capital) scoresonly slightly lower. This lack of intracountry uniformity suggests that theinfluence of the particular government owner of an SWF is not the only de-terminant of how a fund scores on the SWF scoreboard. It is one influence,but the history and nature of the fund’s operations are also relevant.
Seventh, there is a strong correlation of 0.959 between the total scoresfor the 53 SWFs and the category of accountability and transparency.Many commentators like to stress the transparency of SWFs, but in myview the central issue is their accountability to their own citizens (as director indirect owners of the assets), to citizens (including government offi-cials) in the countries in which they invest, and to participants in financialmarkets. Transparency is only a means to this end. Moreover, the group-ing of scores is essentially identical if one examines only the category ofaccountability and transparency.11
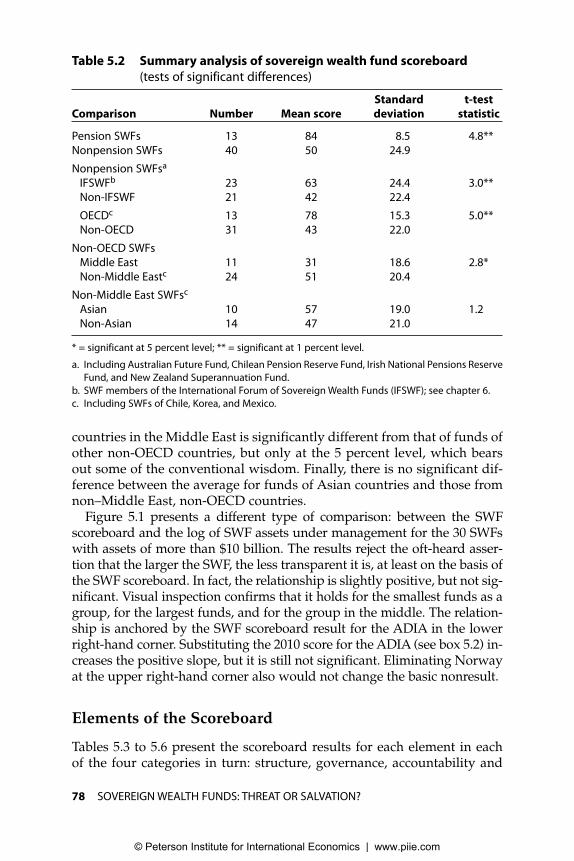
Table 5.2 presents a summary analysis of the SWF scoreboard resultscomparing various groups of funds. It shows the number of funds in eachgroup, the overall average and standard deviation for the group, and thet-test statistic of whether the means are significantly different. Confirmingthe visual inspection of table 5.1, the means for pension and nonpensionSWFs are significantly different at the 1 percent level. Relevant to the dis-cussion in chapter 6 on the Santiago Principles, the average for the 22SWFs that participated in that process, and are now part of the Interna-tional Forum of Sovereign Wealth Funds (IFSWF), is also significantly dif-ferent from the 21 other nonpension SWFs.12 The mean score for nonpen-sion SWFs of OECD countries is significantly different from that for thosenot owned by OECD countries.13 The average for funds of non-OECD
11. Eighteen SWFs score 86 or higher in the accountability and transparency category alone.They include a few that score relatively higher than on the SWF scoreboard as a whole, suchas Azerbaijan’s State Oil Fund and Chile’s two funds. On the other hand, Japan’s Govern-ment Pension Investment Fund scores relatively lower at only 80 in the accountability andtransparency category alone. Within this category, 16 funds score 29 or lower. They include13 of the 14 lowest-scoring funds on the SWF scoreboard as a whole. The exception isBahrain’s Mumtalakat Holding Company, which has a relatively higher score in this cate-gory than for the SWF scoreboard as a whole. On the other hand, São Tomé and Príncipe’sNational Oil Account and the SWFs of Kiribati and Vietnam score relatively lower.
12. In this comparison, we include the three pension reserve SWFs because they are mem-bers of the IFSWF and included in the definition of SWFs that that group uses.
13. This result holds if the funds of Chile, Korea, and Mexico are included in the non-OECDgroup.
© Peterson Institute for International Economics | www.piie.com
78 SOVEREIGN WEALTH FUNDS: THREAT OR SALVATION?
countries in the Middle East is significantly different from that of funds ofother non-OECD countries, but only at the 5 percent level, which bearsout some of the conventional wisdom. Finally, there is no significant dif-ference between the average for funds of Asian countries and those fromnon–Middle East, non-OECD countries.
Figure 5.1 presents a different type of comparison: between the SWFscoreboard and the log of SWF assets under management for the 30 SWFswith assets of more than $10 billion. The results reject the oft-heard asser-tion that the larger the SWF, the less transparent it is, at least on the basis ofthe SWF scoreboard. In fact, the relationship is slightly positive, but not sig-nificant. Visual inspection confirms that it holds for the smallest funds as agroup, for the largest funds, and for the group in the middle. The relation-ship is anchored by the SWF scoreboard result for the ADIA in the lowerright-hand corner. Substituting the 2010 score for the ADIA (see box 5.2) in-creases the positive slope, but it is still not significant. Eliminating Norwayat the upper right-hand corner also would not change the basic nonresult.
Elements of the Scoreboard
Tables 5.3 to 5.6 present the scoreboard results for each element in each of the four categories in turn: structure, governance, accountability and
Table 5.2 Summary analysis of sovereign wealth fund scoreboard
(tests of significant differences)
Standard t-test
Comparison Number Mean score deviation statistic
Pension SWFs 13 84 8.5 4.8**Nonpension SWFs 40 50 24.9
Nonpension SWFsa
IFSWFb 23 63 24.4 3.0**Non-IFSWF 21 42 22.4
OECDc 13 78 15.3 5.0**Non-OECD 31 43 22.0
Non-OECD SWFsMiddle East 11 31 18.6 2.8*Non-Middle Eastc 24 51 20.4
Non-Middle East SWFsc
Asian 10 57 19.0 1.2Non-Asian 14 47 21.0
* = significant at 5 percent level; ** = significant at 1 percent level.
a. Including Australian Future Fund, Chilean Pension Reserve Fund, Irish National Pensions Reserve
Fund, and New Zealand Superannuation Fund.
b. SWF members of the International Forum of Sovereign Wealth Funds (IFSWF); see chapter 6.
c. Including SWFs of Chile, Korea, and Mexico.
© Peterson Institute for International Economics | www.piie.com

ACCOUNTABILITY AND TRANSPARENCY 79
transparency, and behavior. The score for each element is the sum of thescores across SWFs as a percentage of the maximum possible score, whichis 53, the total number of funds. From the summary in table 5.1, SWFs asa group score highest on the eight elements in the structure category. Thepension SWFs score equally well on seven elements in the governance cat-egory and the 14 elements in the accountability and transparency cate-gory, but less well on the four elements grouped under behavior. The non-pension SWFs score about the same in the governance and accountabilitycategories, but decidedly less well under behavior.
Structure
The structure category (table 5.3) covers the basic organization of eachSWF. An SWF’s high score on the elements in this category provides con-fidence to the citizens of the home country and of countries where thefund may invest that the fund’s organization is transparent. This is a firststep in facilitating the process of holding the government and the fund ac-countable. On average, all SWFs that we have scored achieve a reasonablyrespectable 76, nonpension SWFs 73, and pension SWFs 87. Overall, themajority of funds comply with each element in this category in that thecombined score is greater than 50, including some partial scores (see ap-pendix 5A). The coefficient of variation (the mean divided by the standarddeviation, a measure of dispersion, across the eight elements) is the small-est of any category at 0.174.
Figure 5.1 Sovereign wealth fund scoreboard and fund asset size
SWF scoreboard
Source: Table 2.1 for total assets.
0
20
2.0 2.5 3.0 3.5 4.0 4.5 5.0 5.5 6.0 6.5
log total assets (billions of dollars)
y = 1.9861x + 45.292
SE = 3.98 R2 = 0.0088
40
60
80
10
30
50
70
90
100
© Peterson Institute for International Economics | www.piie.com

80 SOVEREIGN WEALTH FUNDS: THREAT OR SALVATION?
One might think that all SWFs would have a clearly defined objective,but this is not the case. Although the highest level of compliance is withthis element, only 95 percent of the maximum of 53 points (one for eachfund) is recorded because the statements of objectives for four SWFs arerather vague.14 The vast majority of SWFs also have clear legal frame-works, but our assessment of the public record is that seven do not.
Another relevant feature is whether there is a formal procedure tochange the SWF’s structure, which there is for about three-quarters of thefunds. It is unrealistic to think that, once established, a fund’s structureshould be immutable to political forces or changing circumstances. Animmutable structure is an invitation either to illegal activity or to over-turning the structure completely. The process of changing the structure ismore straightforward and less subject to caprice if it is initially groundedin law. Norway has altered the structure and orientation of its SWF sev-eral times since it was first established in 1990, but a number of SWFshave collapsed or have been liquidated in part because their structuresand requirements were excessively rigid.
The structure category includes whether the SWF has a clearly statedoverall investment strategy. Most funds do, but for nine no such state-ment is publicly available, and for another 10 the public statement is im-precise. On the other hand, to require that SWFs state formally that in-vestment decisions are based solely on economic grounds rather thanpolitical, foreign policy, or noncommercial considerations—as was sug-gested by Kimmitt (2008) and echoed by other US Treasury officials (Low-ery 2008)—is an empty statement because such a commitment would be
14. In this 2009 version of the SWF scoreboard, the funds are the Abu Dhabi Investment Au-thority, Oman’s State General Reserve Fund, Sudan’s Oil Revenue Stabilization Account,and Venezuela’s National Development Fund (Funden).
Table 5.3 Structure component (percent of maximum possible points)
Element Nonpension Pension Total
Objective stated 95 100 96
Legal framework 83 100 87
Changing the structure 73 96 78
Investment strategy 67 96 74
Fiscal treatment
Source of funding 88 100 91
Use of fund earnings 56 100 67
Integrated with fiscal and monetary policiesa 61 50 58
Separate from international reservesa 64 50 60
Total 73 87 76
a. These items do not apply to pension funds, and we assign a neutral half point.
© Peterson Institute for International Economics | www.piie.com
ACCOUNTABILITY AND TRANSPARENCY 81
very difficult to translate into an operational test. Instead of relying onempty policy statements, it is more informative to examine the overallstructure of the fund, its governance, and other aspects of its activities, asthe SWF scoreboard does.
Fiscal treatment is central to maintaining the macroeconomic stabilityof a country with an SWF. This involves several elements, including howan SWF receives its funding, when and under what circumstances itsprincipal and earnings are available to the government, and whetherthese flows are integrated with the budget. As detailed in IMF (2007c), forexample, basic principles of good public finance aim at limiting the pro-cyclical influence of an SWF on its country’s fiscal policy. It follows thatan SWF should not be used as a second budget, any nonadministrative ex-penditures by a country’s SWF should be integrated with the overall bud-get of the government, and the government should avoid explicitly and,if possible, implicitly borrowing against resources building up in the SWF.In addition, clear rules and principles in this area help to limit the poten-tial scope for corruption in the management of the SWF.
While the majority of SWFs clearly specify the source of their funding,this is not always the case: compliance is only 88 percent for the nonpen-sion SWFs. In the lead-up to the formulation and adoption of the SantiagoPrinciples for SWFs, representatives of the US Treasury argued that whereand how a fund obtains its foreign exchange should determine whether itshould be subject to such principles, for example, including funds fi-nanced either from foreign exchange market intervention or earningsfrom natural resource exports, but excluding those financed from othersources such as fiscal revenues or pension contributions.15 This approachis too narrow, however; the public policy issues raised by SWFs are pres-ent wherever such a fund obtains its resources.
Compliance in clearly indicating how the earnings and principal of anSWF are to be used is substantially lower than compliance regarding theSWF’s indicating its source of funding. A majority of funds have clear rulesabout how they are to interact with the government budget. In a numberof cases, those rules or guidelines are not rigorously followed, as in thecase, for example, of Norway and its Government Pension Fund-Global,which has tended to provide more financing to the Norwegian govern-ment than is called for in its guidelines.16 As detailed in the 2009 IMF Ar-ticle IV review of the Norwegian economy (IMF 2010, 23), “The experienceof recent years suggests that fiscal loosening during downturns tends to bemuch more aggressive than the corresponding tightening during good
15. David H. McCormick, testimony before the Joint Economic Committee, February 13, 2008.
16. This issue does not normally arise for pension SWFs. For that reason, we have scoredthem with a neutral half a point in order not to bias the relative overall scores of pension andnonpension SWFs.
© Peterson Institute for International Economics | www.piie.com
82 SOVEREIGN WEALTH FUNDS: THREAT OR SALVATION?
times, implying a slight expansionary bias relative to the 4-percent target”draw on the SWF’s capital on average over the business cycle.17
The last element in the structure category is whether the resources in theSWF are separate from the country’s international reserves. Only abouttwo-thirds of the nonpension funds have this feature.18 A lack of separa-tion between an SWF and the country’s international reserves creates am-biguity about the investment activities and objectives of the SWF as well asabout the management and quality of the government’s international re-serves. Such lack of separation also is inconsistent with the spirit, if not theletter, of the IMF’s Guidelines for Foreign Exchange Reserve Management (IMF2004). On the other hand, in the wake of the 2007–09 global economic andfinancial crisis fewer countries may feel that their reserves are excessive.Therefore, in establishing new SWFs countries might be reluctant to segre-gate their reserves from such funds.
Governance
The governance category (table 5.4) covers the respective roles of the gov-ernment, governing bodies, and SWF managers in the operations of a fundand also the use of corporate governance and ethical guidelines as part ofthose activities. Compliance with the elements in this category is far fromcomplete or uniform. On average, all SWFs score only 56 and nonpensionfunds score 45, but the pension funds score a more respectable 87. However,the dispersion of results on the seven elements as measured by the coeffi-cient of variation of 0.468 is the highest of any category, by a small margin.
In the context of establishing a sound governance structure, full com-pliance with the first four elements—clear roles of government, a gov-erning body or bodies, and managers, and whether the managers alonemake investment decisions—would indicate that the SWF operates atarm’s length from the government, presumably with an appropriate set ofchecks and balances. These checks and balances are the central focus ofthe next category (accountability and transparency). Unfortunately, fornine of the 40 nonpension funds, the role of government is not defined atall, and for another six that role is ambiguous, producing a score of 70.
The role of the governing body or bodies that set the actual strategy andpolicies for the SWF should also be clearly defined. This is not the case foreight of the nonpension funds.
17. Compared with the 4 percent norm, the average structural nonoil fiscal deficit as a per-cent of the SWF’s capital was 5 percent in 2004–05, 3.5 percent in 2006–08, and a projected5.7 percent for 2009 and 2010.
18. Again, this issue does not normally arise for pension SWFs, so we have scored themwith a neutral half a point in order not to bias the relative overall scores of pension and non-pension SWFs.
© Peterson Institute for International Economics | www.piie.com

ACCOUNTABILITY AND TRANSPARENCY 83
For nine funds, the role of managers also is not defined, and again for another three their role is ambiguous, for a score of 74. In less thanabout half of the nonpension SWFs, actual investment decisions may notbe made exclusively by managers but instead by the government or agovernment-controlled board. Similarly, for China’s pension SWF (theNational Social Security Fund) the managers are not solely responsible for investment decisions. This is a crucial element if the activities of SWFsare to be conducted at arm’s length from the government.
Of the dozen largest nonpension SWFs that we scored, five report thattheir investment decisions are made exclusively by investment managers.They are those of Australia, Kuwait, Norway, and the two Singaporefunds. When we constructed this edition of the SWF scoreboard, we couldfind no such statements for the seven other funds (those of Algeria, theCIC, Hong Kong, Qatar, Russia, the Abu Dhabi Investment Authority, andthe Investment Company of Dubai).
Only about a quarter of nonpension SWFs have publicly stated stan-dards for the internal ethics of the fund’s professional staff. Such stan-dards are one of the most obvious ways to signal a fund’s concern abouta wide range of destructive practices, including corruption. Most of thepension SWFs we looked at have such standards, but those we scoredfrom the province of Ontario, Canada, Chile, China, the Netherlands, andThailand do not.
Only a few SWFs (30 percent overall) make a public statement aboutadhering to guidelines for corporate social responsibility such as those de-veloped under the auspices of the OECD (2000). They include three non-pension SWFs (Norway’s Government Pension Fund-Global, Dubai In-ternational Capital, and the Alaska Permanent Fund) and four other suchfunds that make a general statement about exercising corporate responsi-bility. Eleven of 13 pension SWFs clearly state that they adhere to guide-lines of corporate responsibility.
A more controversial element in this category concerns the adoption ofethical investment guidelines in the operation of SWFs. In a world of en-dowments of nonprofit organizations such guidelines are often described
Table 5.4 Governance component (percent of maximum possible points)
Element Nonpension Pension Total
Role of government 70 100 77
Role of governing body 81 100 86
Role of managers 74 100 80
Decisions made by managers 45 92 57
Internal ethical standards 24 62 33
Guidelines for corporate responsibility 13 85 30
Ethical investment guidelines 10 73 25
Total 45 87 56
© Peterson Institute for International Economics | www.piie.com
84 SOVEREIGN WEALTH FUNDS: THREAT OR SALVATION?
as “socially responsible investing,” but more may be involved as well,such as active promotion of clean energy, as in the case of the NorwegianSWF, or sustainable development, which no SWF currently promotes.19 Itcould reasonably be argued that the objectives of an SWF should bemerely to implement its investment strategy and maximize financial re-turns subject to whatever risk management constraints have been estab-lished. In this case, the fund’s ethical investment guidelines would in-volve ignoring so-called ethical considerations per se. However, in somecases, an SWF may implicitly limit its investments in certain instruments,entities, activities, or countries without a clearly articulated set of guide-lines. The SWF scorecard says it is better to have stated guidelines even ifothers do not agree with the policy. At least four nonpension SWFs haveadopted such guidelines.20 Those who think that such a requirement isonerous should note that the pension SWFs score 73 on having a policywith respect to ethical investments.21 A recent study found that 21 percentof US colleges and universities follow some form of social investment pol-icy (NACUBO and Commonfund 2010).
Accountability and Transparency
Accountability to the citizens of the home country of an SWF and to the cit-izens and government of the countries in which it invests, as well as toparticipants in financial markets more generally, should be the principalmotivating objective of SWF best practices. Transparency about the fund’sstructure and operations is a means toward this broader end. Consequently,the elements included in this category are crucial to the overall complianceof an SWF with generally accepted standards. Table 5.5 provides a sum-mary of compliance on the 14 elements in this category. Average overallcompliance is about 57 (with a high of 79 on one element and a low of 36on another), but compliance by nonpension funds is less than 50 (with ahigh of 73 and a low of 26), while compliance by pension funds comes in at88 (with perfect scores on five elements). Overall, the dispersion of resultsfor these 14 elements is quite low, with a coefficient of variation of 0.233.
The four elements in the subcategory of investment strategy implemen-tation are designed to clarify how each SWF conducts its strategy. The firstelement is whether the fund publishes the broad categories of assets in
19. An example of such guidelines is the UN Principles for Responsible Investing.
20. They are Norway’s Government Pension Fund-Global, Kuwait Investment Authority,Dubai International Capital, and Wyoming’s Permanent Mineral Trust Fund. The Kuwait In-vestment Authority limits investments in certain countries.
21. The exceptions are Australia’s Future Fund, Chile’s Pension Reserve Fund, China’sNational Social Security Fund, and (with only partial credit) Japan’s Government PensionInvestment Fund.
© Peterson Institute for International Economics | www.piie.com

ACCOUNTABILITY AND TRANSPARENCY 85
which it invests, such as stocks, bonds, real estate, alternative investments,and foreign exchange. This is universally the case for the sample of pensionSWFs. About 20 percent of the nonpension SWFs provide no informationon the categories of assets in which they invest; about another 20 percent re-lease some information; and almost 60 percent match the pension SWFs.
Each of the pension SWFs, but less than half of the nonpension SWFs, re-ports the use of benchmarks in whole or in part to guide its investments.Credit ratings play a similar role: 11 of the 13 pension SWFs use them sys-tematically, sometimes imposed by law or regulation, and somewhat morethan a third of nonpension SWFs do so. It could be argued that these twoelements are largely descriptive of the investment and risk managementpractices of SWFs, but they provide some concrete, if indirect, evidence ofprofessionalism in the funds’ operations. Of course, the extent of the use ofbenchmarks and credit ratings depends in part on the nature of the SWFs’overall investment strategy.
The same cannot be said for the last element in this subcategory: whetherthe SWF identifies holders of individual investment mandates. Throughthis type of disclosure, the public both inside and outside the country cancheck on the records, quality, and reliability of those intermediaries. Dis-closure also limits the scope for sweetheart arrangements and corruption.Eleven of the 13 pension funds provide this information, and a 12th does
Table 5.5 Accountability and transparency component
(percent of maximum possible points)
Element Nonpension Pension Total
Investment strategy implementation
Categories of investments 67 100 75
Use of benchmarks 44 100 58
Use of credit ratings 40 85 51
Mandates published 45 88 56
Investment activities
Size of fund 73 100 79
Returns of fund 51 100 63
Location of investments 41 58 45
Specific investments 26 69 36
Currency composition 30 62 38
Reports
Annual reports 59 100 69
Quarterly reports 34 85 46
Audits
Regular audits 60 96 69
Audits published 40 92 53
Audits independent 56 96 66
Total 47 88 57
© Peterson Institute for International Economics | www.piie.com

86 SOVEREIGN WEALTH FUNDS: THREAT OR SALVATION?
in part. The nonpension funds score less than 50 as a group, but 20 of themdo provide this information or state that they do not grant mandates.
Investment activities are the next subcategory under accountability andtransparency. Average compliance with the five elements included in thissubcategory ranges from high to quite low. First is whether the SWFmakes public its size. One might think it is obviously appropriate andnecessary to do so, but eight nonpension funds do not, and another sixprovide only partial information, resulting in an overall score of only 79,and 73 for the nonpension SWFs alone.
What is the rationale for such nondisclosure? Some argue, as with a coun-try’s foreign exchange reserves, that the size of an SWF is a state secret. Butthat approach to reserve management went out of fashion more than adecade ago in the wake of the Tequila crisis and the Asian financial crisis.The adoption of the reserve template as part of the IMF’s Special Data Dis-semination Standard (Kester 2001) codified this change. A related argumentis that if a country’s enemies know the size of its asset holdings, includingin its SWF, the country might be more vulnerable to military attack. How-ever, as in the case of Kuwait following the 1990–91 Gulf War, the foreignassets of an SWF are not within the country.22 The most plausible argumentis that the citizens of the country, knowing how large the assets of the SWFare, will mobilize politically to obtain immediate access to them. A less re-spectable version of this argument, which applies as well to the next ele-ment (disclosing the SWF’s returns), is that public release of the SWF’s in-vestment record would embarrass the authorities. This is a political issue inmany jurisdictions, as those involved with the Alaska Permanent Fund andWyoming’s Permanent Mineral Trust Fund have testified (Cowper 2007,Lummis 2007), but nondisclosure as a strategy to deal with such pressuresis likely to exacerbate them over the long term. About half of nonpensionSWFs do not disclose their annual returns or their disclosure is incomplete,but half also provide some or substantial overall information.
Only a dozen nonpension and four pension SWFs fully disclose the ge-ographic location of their foreign assets. Four nonpension SWFs disclosethe specific assets in their portfolios, though several others provide someinformation on key investments. A majority of pension SWFs comply withthis element.
One of the issues with respect to the potential role of SWFs contribut-ing to financial market turbulence and uncertainty is their effect on ex-change rates as they convert foreign exchange, predominantly held in dol-lar assets but also disproportionately in euro assets, into a portfolio of
22. The Kuwait Investment Authority operates under prohibitions and penalties for public dis-closure of information, but it nevertheless now makes public the size of its General ReserveFund, which is invested primarily in Kuwait, and its much larger Future Generation Fund,which is invested primarily outside the country. Overall, the Kuwait Investment Authority is at63 on the scoreboard—slightly above the median and the mean score for all nonpension SWFs.
© Peterson Institute for International Economics | www.piie.com
ACCOUNTABILITY AND TRANSPARENCY 87
assets more diversified with respect to currency composition. A simpleway to address this concern is to publish information on the currencycomposition of countries’ SWF assets, as more than two dozen countriesdo with respect to their foreign exchange assets. Surprisingly, nine of the40 nonpension SWFs disclose in detail the currency composition of theirportfolios and another seven provide some information; eight pensionSWFs do so. But, why don’t all SWFs follow the example of the few? Oneanswer is that the practices of each SWF evolved in isolation and manyfunds until recently were unaware of the practices of others.23Annual re-ports, in principle, should contain much of the information covered by theelements in the subcategories of investment strategy implementation andinvestment activities in the scoreboard. However, 11 nonpension SWFs donot issue annual reports at all and only 18 funds issue reasonably com-plete reports to the public, producing a combined score of 59.
About two-thirds of the SWFs that issue complete annual reports alsoissue quarterly reports on their operations. Views differ on the desirabil-ity of quarterly financial reporting. Some argue that it promotes too muchfocus on short-term returns. The principal argument for quarterly report-ing by an SWF is transparency. The fund should be able to withstand theinfluence of excessive short-term emphasis given that it is not subject tothe disciplines of the financial market, but rather only to those of the po-litical market. A fund also should be able to do so without tipping its handabout implementing its investment strategy. Reports are normally issuedwith a lag of a month or two. Not surprisingly, each of the 13 pensionSWFs issues an annual report, and only one does not issue any quarterlyreport (Canada’s Caisse de Dépôt et Placement du Québec). Two othersissue only partial quarterly reports.
The final group of elements in this category focuses on audits. Regularaudits, preferably independent and published, are a central element of ac-countability and transparency. For this reason, the scoreboard includes amaximum of three points in this area: Is the fund audited? Is the audit pub-lished? Are the auditors independent of the fund and its management?
Fifteen nonpension SWFs are not subject to audit as far as can be ascer-tained from the public record, and for two others the audit appears to beless than complete. As a result, nonpension SWFs score a combined 60 onthis element while the pension SWFs score 96. For seven nonpensionfunds where there is some type of audit, it is not published at all, pro-ducing a score of only 40. Twenty-two nonpension SWFs report that theyare independently audited, for a score of 66, including Norway’s Govern-ment Pension Fund-Global, which shifted to a fully independent audit in2008. If the auditing is internal, it takes away some of the objectivity.
23. See the discussion of table 5.9.
© Peterson Institute for International Economics | www.piie.com

88 SOVEREIGN WEALTH FUNDS: THREAT OR SALVATION?
However, we allow full credit if it is done by a separately constituted gov-ernment auditing authority. Almost all pension SWFs have full scores onthese three elements.
Behavior
The last category focuses on the investment behavior of the funds (table5.6). It combines aspects of risk management with features that may be ofconcern to market participants because of the potentially large scale ofSWF investment activities. Overall compliance averages 33; the nonpen-sion funds score 24, and the pension funds score 62. In this category withthe fewest elements, the coefficient of variation is 0.464, essentially thesame as for the governance category.
The first element is whether an SWF has a publicly stated risk manage-ment policy. Almost all of the pension SWFs do; the exceptions are Chile’sPension Reserve Fund and Thailand’s Government Pension Fund. On theother hand, only 11 of the 40 nonpension SWFs do the same, includingthose in China, Korea, Singapore, Timor-Leste, and Norway, as well asmost of the US SWFs.
An aspect of risk management policy is whether a fund has a policy onthe use of leverage, which four of the nonpension SWFs and half of thepension SWFs do. It should be noted again that having a policy of limit-ing the use of leverage is not the same as having no involvement withleverage, as is claimed by some who depict the activities of SWFs as be-nign and long-term in orientation. Several funds do take on leverage.
A similar question is whether a fund has a publicly stated policy on theuse of derivatives, which is the case for a larger proportion (more than athird) of nonpension, and almost all pension, SWFs. Most, but not all, fundsthat have a policy on the use of derivatives—12 of 15 nonpension SWFs and11 of 12 pension SWFs—say that derivatives are used primarily for hedging.
The final element of this category and the scoreboard is whether thefund has a rule or guideline for how it adjusts its portfolio. Six nonpensionSWFs do so in some form, producing a score of 14. For example, Norway’sGovernment Pension Fund-Global states that it uses new inflows of re-sources to make adjustments in its portfolio in light of market changes thatmove the portfolio away from its benchmarks—in other words, a policy ofportfolio rebalancing. New Mexico’s Severance Tax Permanent Fund andWyoming’s Permanent Mineral Trust Fund follow similar guidelines, andthe Korea Investment Corporation uses something close. Interestingly, alarger proportion of the pension SWFs have guidelines that are a matter ofpublic record.
This review of the various elements of the SWF scoreboard points totwo broad conclusions. First, there is a diversity of compliance. This al-most certainly reflects the diversity of political and cultural origins of the
© Peterson Institute for International Economics | www.piie.com

ACCOUNTABILITY AND TRANSPARENCY 89
various funds. Second, the pension SWFs reviewed have a higher level ofcompliance with each element. This suggests that there is a more fully de-veloped implicit global standard for pension funds. This record suggeststhat in the future nonpension funds may conform to a greater degree withthe elements of the SWF scoreboard presented here.
Evidence of Progress
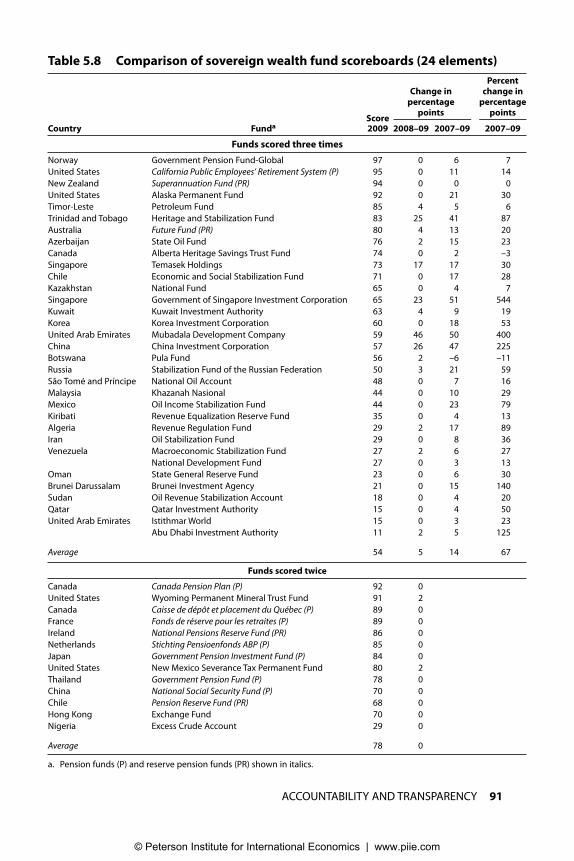
Tables 5.7 to 5.9 address the question of whether there has been anychange, which I would interpret as progress, over the past three years inhow SWFs score on the elements included in the SWF scoreboard. Tables5.7 and 5.8 provide a perspective on the evolution of the individual fundsand table 5.9 of the elements in the scoreboard.24
The top part of table 5.7 focuses on the 33 funds that have been scoredthree times. They were scored on a different number of elements eachtime, but that does not introduce much of a bias in relative performance,as can be seen by comparing tables 5.7 and 5.8. The latter provides scoresfor the funds on the 24 elements that have been included in all three score-boards. In the bottom of tables 5.7 and 5.8, results are presented for the 13funds that have been scored twice.
Without controlling for the slightly different list of elements, the averageimprovement in table 5.7 for the funds that have been scored three timessince they were first scored in 2007 is 12 points. The average improvement
24. In general, the evolution of the scores reflects changes instituted by the SWFs them-selves. For a few funds, the evolution reflects our obtaining more complete information. Inthat latter respect, one could argue that progress by the funds has been exaggerated. How-ever, in most cases, the funds themselves responded to earlier editions of the scoreboard andpointed us to or provided additional public information. I would regard this as a measureof progress in that the funds took the responsibility. In a very few cases, managers of thefund have shared with us some of the information that we think should be available regu-larly and publicly but is available only to those who ask. An example is the Alberta HeritageSavings Trust Fund. However, this approach is hardly consistent with the overall purpose ofour exercise and receives no credit. The Alberta fund, maybe partly as a result, scores abovethe mean and median for all SWFs at 74, but not as well as other Canadian entities.
Table 5.6 Behavior component (percent of maximum possible points)
Element Nonpension Pension Total
Risk management policy 30 85 43
Policy on leverage 16 38 22
Policy on derivatives 38 88 50
Portfolio adjustment 14 35 19
Total 24 62 33
© Peterson Institute for International Economics | www.piie.com

90 SOVEREIGN WEALTH FUNDS: THREAT OR SALVATION?
Table 5.7 Comparison of sovereign wealth fund scoreboards (all elements)
PercentChange in change in
percentage percentage
Scorepoints points
Country Funda 2009 2008–09 2007–09 2007–09
Funds scored three times
Norway Government Pension Fund-Global 97 5 5 5
United States California Public Employees’ Retirement System (P) 95 8 14 18
New Zealand Superannuation Fund (PR) 94 3 4 4
United States Alaska Permanent Fund 92 0 22 32
Timor-Leste Petroleum Fund 85 5 –2 –2
Trinidad and Tobago Heritage and Stabilization Fund 83 30 34 70
Australia Future Fund (PR) 80 5 18 30
Azerbaijan State Oil Fund 76 –2 10 15
Canada Alberta Heritage Savings Trust Fund 74 1 2 –2
Singapore Temasek Holdings 73 27 19 35
Chile Economic and Social Stabilization Fund 71 0 9 15
Kazakhstan National Fund 65 2 7 12
Singapore Government of Singapore Investment Corporation 65 24 56 624
Kuwait Kuwait Investment Authority 63 15 15 31
Korea Korea Investment Corporation 60 9 24 66
United Arab Emirates Mubadala Development Company 59 45 47 392
China China Investment Corporation 57 19 33 137
Botswana Pula Fund 56 1 0 0
Russia Stabilization Fund of the Russian Federation 50 –1 12 32
São Tomé and Príncipe National Oil Account 48 0 –1 –1
Malaysia Khazanah Nasional 44 6 6 16
Mexico Oil Income Stabilization Fund 44 –3 16 57
Kiribati Revenue Equalization Reserve Fund 35 6 5 16
Algeria Revenue Regulation Fund 29 2 11 60
Iran Oil Stabilization Fund 29 6 7 31
Venezuela Macroeconomic Stabilization Fund 27 5 5 24
National Development Fund 27 6 3 10
Oman State General Reserve Fund 23 3 3 14
Brunei Darussalam Brunei Investment Agency 21 3 11 112
Sudan Oil Revenue Stabilization Account 18 –2 –2 –9
Qatar Qatar Investment Authority 15 6 7 89
United Arab Emirates Istithmar World 15 3 2 17
Abu Dhabi Investment Authority 11 3 7 165
Average 54 7 12 64
Funds scored twice
Canada Canada Pension Plan (P) 92 2
United States Wyoming Permanent Mineral Trust Fund 91 2
Canada Caisse de dépôt et placement du Québec (P) 89 2
France Fonds de réserve pour les retraites (P) 89 2
Ireland National Pensions Reserve Fund (PR) 86 5
Netherlands Stichting Pensioenfonds ABP (P) 85 5
Japan Government Pension Investment Fund (P) 84 2
United States New Mexico Severance Tax Permanent Fund 80 –5
Thailand Government Pension Fund (P) 78 –2
Hong Kong Exchange Fund 70 5
China National Social Security Fund (P) 70 –2
Chile Pension Reserve Fund (PR) 68 2
Nigeria Excess Crude Account 29 3
Average 78 1
a. Pension funds (P) and reserve pension funds (PR) shown in italics.
© Peterson Institute for International Economics | www.piie.com
ACCOUNTABILITY AND TRANSPARENCY 91
Table 5.8 Comparison of sovereign wealth fund scoreboards (24 elements)
PercentChange in change in
percentage percentage
Scorepoints points
Country Funda 2009 2008–09 2007–09 2007–09
Funds scored three times
Norway Government Pension Fund-Global 97 0 6 7
United States California Public Employees’ Retirement System (P) 95 0 11 14
New Zealand Superannuation Fund (PR) 94 0 0 0
United States Alaska Permanent Fund 92 0 21 30
Timor-Leste Petroleum Fund 85 4 5 6
Trinidad and Tobago Heritage and Stabilization Fund 83 25 41 87
Australia Future Fund (PR) 80 4 13 20
Azerbaijan State Oil Fund 76 2 15 23
Canada Alberta Heritage Savings Trust Fund 74 0 2 –3
Singapore Temasek Holdings 73 17 17 30
Chile Economic and Social Stabilization Fund 71 0 17 28
Kazakhstan National Fund 65 0 4 7
Singapore Government of Singapore Investment Corporation 65 23 51 544
Kuwait Kuwait Investment Authority 63 4 9 19
Korea Korea Investment Corporation 60 0 18 53
United Arab Emirates Mubadala Development Company 59 46 50 400
China China Investment Corporation 57 26 47 225
Botswana Pula Fund 56 2 –6 –11
Russia Stabilization Fund of the Russian Federation 50 3 21 59
São Tomé and Príncipe National Oil Account 48 0 7 16
Malaysia Khazanah Nasional 44 0 10 29
Mexico Oil Income Stabilization Fund 44 0 23 79
Kiribati Revenue Equalization Reserve Fund 35 0 4 13
Algeria Revenue Regulation Fund 29 2 17 89
Iran Oil Stabilization Fund 29 0 8 36
Venezuela Macroeconomic Stabilization Fund 27 2 6 27
National Development Fund 27 0 3 13
Oman State General Reserve Fund 23 0 6 30
Brunei Darussalam Brunei Investment Agency 21 0 15 140
Sudan Oil Revenue Stabilization Account 18 0 4 20
Qatar Qatar Investment Authority 15 0 4 50
United Arab Emirates Istithmar World 15 0 3 23
Abu Dhabi Investment Authority 11 2 5 125
Average 54 5 14 67
Funds scored twice
Canada Canada Pension Plan (P) 92 0
United States Wyoming Permanent Mineral Trust Fund 91 2
Canada Caisse de dépôt et placement du Québec (P) 89 0
France Fonds de réserve pour les retraites (P) 89 0
Ireland National Pensions Reserve Fund (PR) 86 0
Netherlands Stichting Pensioenfonds ABP (P) 85 0
Japan Government Pension Investment Fund (P) 84 0
United States New Mexico Severance Tax Permanent Fund 80 2
Thailand Government Pension Fund (P) 78 0
China National Social Security Fund (P) 70 0
Chile Pension Reserve Fund (PR) 68 0
Hong Kong Exchange Fund 70 0
Nigeria Excess Crude Account 29 0
Average 78 0
a. Pension funds (P) and reserve pension funds (PR) shown in italics.
© Peterson Institute for International Economics | www.piie.com

92 SOVEREIGN WEALTH FUNDS: THREAT OR SALVATION?
in the core set of 24 elements is 14 points—table 5.8—but each of the 24elements is worth an additional 1.13 points.
The SWFs that have shown the largest increases in scores come from avariety of countries. The list is led by Singapore’s GIC, the Mubadala De-velopment Company of the United Arab Emirates (Abu Dhabi), Trinidadand Tobago’s Heritage and Stabilization Fund, the CIC (which took over
Table 5.9 Comparison of sovereign wealth fund scoreboard elements
(24 elements)
Change in Percent change in
Score,percentage points percentage points
Element 2009 2008–09 2007–09 2007–09
Structure
Objective stated 94 0 6 7
Source of funding 86 3 6 8
Use of fund earnings 58 2 6 12
Integrated with budget 67 3 13 24
Investment strategy 69 7 16 30
Changes in the structure 73 6 33 85
Separate from international 79 0 0 0
reserves
Total 75 3 11 23
Governance
Role of government 71 8 18 34
Guidelines for corporate 20 0 6 44
responsibility
Role of managers 74 3 3 4
Ethical investment guidelines 12 0 3 33
Total 44 3 8 29
Accountability and transparency
Published mandates 52 3 35 209
Returns of fund 55 10 22 66
Published audits 45 12 21 88
Annual reports 64 9 20 47
Independent audits 65 6 20 43
Categories of investments 63 12 20 46
Regular audits 70 6 15 28
Location of investments 40 8 15 61
Specific investments 25 2 14 136
Quarterly reports 41 5 10 32
Currency composition 35 5 9 35
Size of fund 76 3 8 11
Total 53 7 17 67
Behavior
Portfolio adjustment 14 6 9 200
Overall total 56 5 14 53
© Peterson Institute for International Economics | www.piie.com
ACCOUNTABILITY AND TRANSPARENCY 93
the Central Huijin Investment Company, which we scored in 2007), andthe Korean Investment Corporation. The score of the Alaska PermanentFund also increased by more than 20 points. Table 5.8 shows that on a con-sistent set of questions the list of funds showing substantial improve-ments is essentially the same, and is identical for the four funds with thelargest increases in scores.
Among the funds that scored 80 or higher in the latest edition of the SWFscoreboard are several that have improved their scores since 2007, includingAustralia’s Future Fund, the California Public Employees’ Retirement Sys-tem (CalPERS), and even the top-scoring Government Pension Fund-Globalof Norway. This illustrates the earlier point that every fund can improve.
The bottom portion of table 5.7 shows less improvement in part becausenine of the 13 funds are pension SWFs that were incorporated into the sec-ond edition scoreboard exercise to provide more of a comparison with thenonpension SWFs. Generally the pension funds score higher, providingless scope for improvement, notwithstanding the results for CalPERS andthe Australian Future Fund shown in the top panel.25 Similarly, the sevenfunds added in the latest edition of the scoreboard have an average scoreof 49, less than the averages for the other two groups.26 The bottom por-tion of table 5.8 shows that there was very little overall improvement inthe scores of the 13 funds that were scored only twice.
Turning to the areas of increased compliance or adherence to the score-board as it was originally constructed, table 5.9 focuses on the 24 elementsin the 2007 edition that are in the latest edition and how the performanceof the original 33 funds has evolved on those elements. As noted in con-nection with the discussion of table 5.8 and the record of the 33 funds, theincrease in scores is significant if not overwhelming.
Focusing on the two-year change in 2007–09, increases were recorded inevery element, with the exception of treating the SWF separately from thehome country’s international reserves. The governments have made sub-stantial changes in other elements included in the structure category, inparticular with respect to provisions for changing that structure, articulat-ing an overall investment strategy, and integrating the SWF’s operationswith the budget. There has been an accompanying increase in clarifyingthe role of government in the management of the funds.
The most dramatic changes have been in the area of accountability andtransparency, where for six elements the change has been more than 20percentage points. Even in the area of portfolio adjustment there have beensome improvements.
25. An inspection of table 5.8 reveals that the small improvement shown for New Zealand’sSuperannuation Fund reflects changes in the list of elements between 2007 and 2009 ratherthan a change with respect to the core 24 elements.
26. The added group of funds includes the lowest-scoring Dubai International Capital at 21and the highest scoring Ontario Teachers’ Pension Fund at 83.
© Peterson Institute for International Economics | www.piie.com
94 SOVEREIGN WEALTH FUNDS: THREAT OR SALVATION?
Why have these changes occurred? As noted earlier, the activities of thefunds have increased in salience in their home countries. The authoritiesappear to have responded with an increase in overall accountability andtransparency. In addition, during this period the international profile ofSWFs increased and the Santiago Principles were developed. The author-ities appear to have responded to these developments. Finally, I knowfrom personal contacts that the authorities responsible for a number of thefunds have reacted to the publication of the first two editions of the SWFscoreboard in late 2007 and early 2008.
Comparison with Other Indices and Indicators
In the next chapter, I compare the results of the SWF scoreboard presentedhere with the international standard for SWFs that was agreed upon bythe IWG in September 2008—what are known as the Santiago Principlesor Generally Accepted Principles and Practices of SWFs. However, theSantiago Principles have just begun to influence the behavior of the au-thorities of countries with SWFs. Meanwhile, the results of one other mea-sure of SWF practices, the Linaburg-Maduell Transparency Index, can becompared with the scoreboard I have developed. In addition, it is usefulto compare the results of the scoreboard with other indicators of the na-tional environments in which SWFs operate.
The Linaburg-Maduell Transparency Index is produced by the Sover-eign Wealth Fund Institute and scores SWFs on 10 principles (Linaburgand Maduell 2010). Each fund receives a score of either one or zero oneach principle with a minimum overall score of one. The developers listthe principles but do not provide substantial information about how theirprinciples are applied. Indeed, they state on their website, “There are dif-ferent levels of depth in regard to each principle, judgment of these prin-ciples is left to the discretion of the Sovereign Wealth Fund Institute.”27
Seven of the 10 principles overlap, in whole or in part, with about half ofthe elements in the scoreboard presented in this chapter.28 There is nooverlap with three principles.29
27. If a background or technical paper on the Linaburg-Maduell index exists, it has not beenreleased to the general public. The index is at www.swfinstitute.org/research/transparencyindex.php (accessed on April 26, 2010).
28. In some cases the overlap appears to be very clear with one or more of the elements inthe scoreboard. In other cases, it is less clear. And in some cases, Linaburg and Maduell in-clude in a principle an aspect that is not captured by any of the elements in the scoreboard.For example, total management compensation is included in a principle along with totalportfolio market value and returns.
29. The three other Linaburg-Maduell principles are whether the fund manages its ownwebsite, whether it provides an address and contact information, and whether, if applicable,
© Peterson Institute for International Economics | www.piie.com
ACCOUNTABILITY AND TRANSPARENCY 95
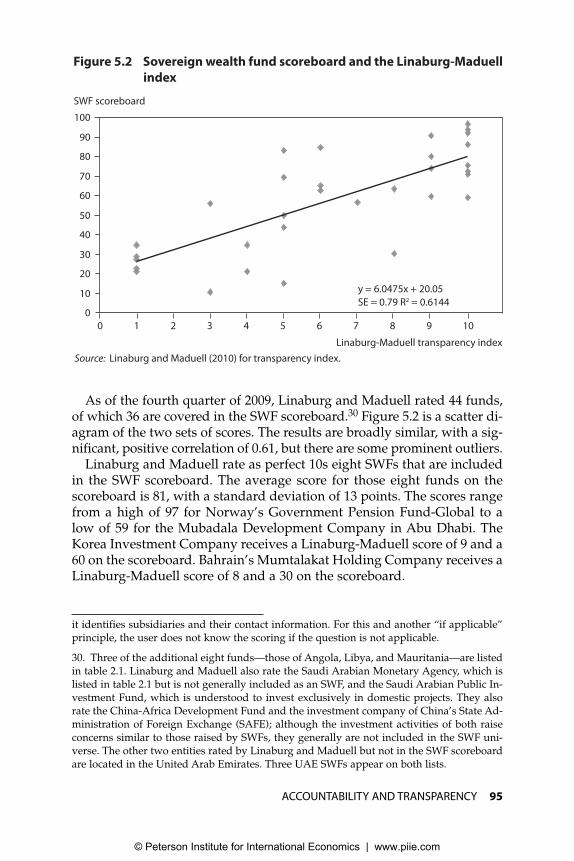
As of the fourth quarter of 2009, Linaburg and Maduell rated 44 funds,of which 36 are covered in the SWF scoreboard.30 Figure 5.2 is a scatter di-agram of the two sets of scores. The results are broadly similar, with a sig-nificant, positive correlation of 0.61, but there are some prominent outliers.
Linaburg and Maduell rate as perfect 10s eight SWFs that are includedin the SWF scoreboard. The average score for those eight funds on thescoreboard is 81, with a standard deviation of 13 points. The scores rangefrom a high of 97 for Norway’s Government Pension Fund-Global to alow of 59 for the Mubadala Development Company in Abu Dhabi. TheKorea Investment Company receives a Linaburg-Maduell score of 9 and a60 on the scoreboard. Bahrain’s Mumtalakat Holding Company receives aLinaburg-Maduell score of 8 and a 30 on the scoreboard.
it identifies subsidiaries and their contact information. For this and another “if applicable”principle, the user does not know the scoring if the question is not applicable.
30. Three of the additional eight funds—those of Angola, Libya, and Mauritania—are listedin table 2.1. Linaburg and Maduell also rate the Saudi Arabian Monetary Agency, which islisted in table 2.1 but is not generally included as an SWF, and the Saudi Arabian Public In-vestment Fund, which is understood to invest exclusively in domestic projects. They alsorate the China-Africa Development Fund and the investment company of China’s State Ad-ministration of Foreign Exchange (SAFE); although the investment activities of both raiseconcerns similar to those raised by SWFs, they generally are not included in the SWF uni-verse. The other two entities rated by Linaburg and Maduell but not in the SWF scoreboardare located in the United Arab Emirates. Three UAE SWFs appear on both lists.
Figure 5.2 Sovereign wealth fund scoreboard and the Linaburg-Maduell index
SWF scoreboard
Source: Linaburg and Maduell (2010) for transparency index.
0
20
0 1 2 3 4 5 6 7 8 9 10
Linaburg-Maduell transparency index
y = 6.0475x + 20.05
SE = 0.79 R2 = 0.6144
40
60
80
10
30
50
70
90
100
© Peterson Institute for International Economics | www.piie.com

96 SOVEREIGN WEALTH FUNDS: THREAT OR SALVATION?
At the other extreme, Linaburg and Maduell rate eight SWFs on thescoreboard as 1. On the SWF scoreboard, their mean score is 31, with astandard deviation of 10 points and scores on the scoreboard rangingfrom 21 for the Brunei Development Agency to 35 for Kiribati’s RevenueEqualization Reserve Fund. The Abu Dhabi Investment Authority is ratedat 3 by Linaburg and Maduell but received the lowest score of 11 on theSWF scoreboard as of the end of 2009.31 Trinidad and Tobago’s Heritageand Stabilization Fund receives a score of only 5 from Linaburg andMaduell but 83 on the scoreboard. The Petroleum Fund for Timor-Leste israted at 6 by Linaburg and Maduell but 85 on the scoreboard.
The Linaburg-Maduell index is self-described as focusing on trans-parency. The SWF scoreboard focuses on the broader concept of account-ability to the general public in the home and host country as well as tomarkets. This may account for some of the differences. The Linaburg-Maduell judgmental weighting algorithm may also account for the morepronounced differences between the two sets of results.32
Figure 5.3 provides another a type of comparison with the results of the SWF scoreboard. It presents a summary of the results assembled in theHill & Knowlton and Penn Schoen Berland (2010) survey of perceptions ofSWFs and their reputation. The reputation variable, shown on the x-axis,is constructed from the sum of answers to three questions about the fundsof 18 countries: Does transparency/accountability/good governance ap-ply to the funds of these countries? The SWF scoreboard results are shownon the y-axis, averaging the results for countries with more than one SWFand treating Abu Dhabi and Dubai as separate countries. As depicted inthe figure, there is a significant positive relationship between the SWFscoreboard result and the reputation of the SWFs of the countries. How-ever, the relationship is not very tight, and the figure labels some of theoutliers. Norway, Kuwait, China, Kazakhstan, and Botswana score betterthan the average relationship, and Dubai and Qatar score worse.
As has been emphasized throughout this study, SWFs are a collectivedescription of government investment vehicles with diverse objectives ina wide range of countries with different histories and cultures. Neverthe-less, in their international investments they are part of one global finan-cial system and each feels pressure to conform to evolving global norms.We examined the statistical relationship between several representations
31. Both the SWF scoreboard and the Linaburg-Maduell index as of the fourth quarter of2009 do not reflect the publication of the ADIA’s annual report in March 2010 (see box 5.2).
32. Galani and Nixon (2008) developed an SWF risk index that focuses on the economic andpolitical risks associated with 20 funds. They score funds on only three dimensions: trans-parency of investment criteria, extent of control of investments, and the nature of the homecountry’s political system. Not surprisingly, Norway’s Government Pension Fund-Globalreceives the highest score and China’s CIC receives the lowest, though the scale is inverted.As of mid-2010, the index had not been updated.
© Peterson Institute for International Economics | www.piie.com

ACCOUNTABILITY AND TRANSPARENCY 97
of those global norms for the 37 home countries to funds included in thescoreboard and each fund’s score. We ran simple regressions of the form:
Si = c + bIi + ui,
where S is the fund’s score on the scoreboard, I is the country’s score onsome other index, i refers to a particular fund or average of funds in eachcountry, and u is an error term.33 The results are summarized in table 5.10using the scores of the 40 nonpension SWFs as the dependent variable.The first set of tests, shown on the left-hand side of the table, was pre-formed with the total SWF scores as the dependent variable.
The strongest relationship is between the World Bank’s governance indi-cator for voice and accountability and the SWF scoreboard results. This isreassuring given the emphasis in the scoreboard on accountability. Asmight be expected, and as others have found (Setser 2008b), a high score onthe Heritage Foundation’s well-known index of economic freedom also issignificantly correlated with the relevant country’s SWF score. The WorldBank’s indicator of the ease of doing business is in the same ballpark, and
33. Where the SWF scoreboard includes more than one fund from the country, we averagedthe scores for the dependent variable. We also adjusted the independent variables to a scaleof 100 so that the coefficients could be interpreted as the effect of a change of a single pointin that independent variable on the SWF scoreboard.
Figure 5.3 Sovereign wealth fund scoreboard and reputation
SWF scoreboard
Source: Hill & Knowlton and Penn Schoen Berland (2010) for reputation.
0
20
20 40 60 80 100 120 140 160 180
reputation
y = 0.3443x + 18.853
SE = 0.11 R2 = 0.3613
40
60
80
10
30
50
70
90
100
KazakhstanKuwait
Dubai
Qatar
Norway
Botswana
Nigeria
China
© Peterson Institute for International Economics | www.piie.com

98 SOVEREIGN WEALTH FUNDS: THREAT OR SALVATION?
most other elements of the set of World Bank governance indicators are inthe same range of significance. The exceptions are the indicator of politicalstability, which has no significance, and control of corruption, whose sig-nificance is only at the 10 percent level. Interestingly, the relationship ofTransparency International’s corruption perceptions index with the score-board results is also significant but only at that lower level. The World Eco-nomic Forum’s global competitiveness index does not appear to be signif-icantly related to the SWF scoreboard results.
The right-hand panel focuses just on the category of accountability andtransparency on the SWF scoreboard as the dependent variable. The pat-tern is not substantially altered. While the R-squares are essentially thesame, the significance of the Heritage Foundation’s index of economic free-dom, the World Bank’s indicator of regulatory quality, and TransparencyInternational’s corruption perceptions index are each increased a notch.Including the 13 pension SWFs on the scoreboard boosts the correlationsacross the board because those observations tend to be more heavily con-centrated in the funds and countries that score highly on both variables.
These results are consistent with findings by Aizenman and Glick (2009)using, in part, a subsample of 26 countries with SWFs in the 2008 SWFscoreboard (Truman 2008a) and the World Bank governance indicators.Aizenman and Glick find a weak positive correlation between the overall
Table 5.10 Sovereign wealth fund scoreboard index and other
indicators
Dependent variable
Accountability and
Scoreboard total transparency subset
Independent Standard Standard
variable indicator Coefficient error R2 Coefficient error R2
Transparency International 0.344* 0.170 0.12 0.499** 0.222 0.14
corruption perceptions index
Heritage index of economic 0.567** 0.239 0.12 0.982*** 0.341 0.18
freedom
World Economic Forum global 0.341 0.332 0.05 0.425 0.459 0.05
competitiveness index
World Bank
Ease of doing business 0.299** 0.142 0.15 0.429** 0.183 0.17
Worldwide governance indicators
Voice and accountability 0.764*** 0.165 0.40 0.908*** 0.239 0.32
Government effectiveness 0.466** 0.176 0.18 0.659** 0.238 0.20
Regulatory quality 0.438** 0.176 0.16 0.689*** 0.238 0.23
Rule of law 0.398** 0.190 0.13 0.516** 0.248 0.12
Control of corruption 0.364* 0.183 0.12 0.497* 0.243 0.12
Political stability 0.323 0.203 0.08 0.34 0.273 0.05
* = significant at 10 percent level; ** = significant at 5 percent level; *** = significant at 1 percent level.
© Peterson Institute for International Economics | www.piie.com

ACCOUNTABILITY AND TRANSPARENCY 99
scoreboard result for these countries and the average of the six World Bankgovernance indicators, but it is not significant. However, they find a strongrelationship between the overall governance score and the probability thata country will have an SWF and a strong positive correlation between the2008 SWF scoreboard result and the World Bank governance componentindicator of voice and accountability. Table 5.10 in effect replicates this re-sult for the updated SWF scoreboard. Aizenman and Glick interpret theirresults through the prism of a few fuel-producing countries with olderSWFs that have reasonably good governance scores but weaker voice andaccountability scores. They link the latter not only to the strength of gov-ernance in the countries but also to relatively low levels of democracy, suchas in Russia, Kazakhstan, Azerbaijan, and Timor-Leste. At the same time,some of the countries with newer SWFs may have relatively low democ-racy scores but higher SWF scoreboard results. The authors speculate thatcountries with newer funds have a greater incentive to foster more global-ization by fostering more transparency and accountability in their funds.A supporting observation is the fact that these four countries were moreengaged with the IMF and World Bank, and thus with international normsand standards, when they were setting up their funds.
Arguments against the Scoreboard Approach
A number of arguments have been put forward disparaging an agreed-upon global standard such as the SWF scoreboard presented in this chap-ter. They fall under four headings: unnecessary, undesirable, inappropri-ate, and unenforceable.
As was discussed in chapter 3, observers such as El-Erian (2008) thinkthat the scoreboard approach sets up an unnecessary arbitrary standard forSWFs, which are entities that knowledgeable market participants are fullycapable of assessing on their own. That argument not only flies in the faceof the general demand for greater transparency and accountability that hasbeen a feature of, and positive trend in, global finance for more than adecade, but it also rings a bit hollow in 2010 when markets and importantplayers in markets have lost some of their luster, and along with it the will-ingness of outsiders to trust existing institutions to be entirely self-policing.
It also is argued that the scoreboard approach is undesirable because itwould hamper funds from discharging their obligation to maximize returnsto their beneficiaries, the residents of their home countries.34 The way one
34. Interestingly, the survey by Norton Rose (2008) described in chapter 3 found that morethan 60 percent of non-SWF respondents thought that the imposition by a jurisdiction of dis-closure and transparency requirements would discourage SWF investments there, whilemore than 70 percent of SWF respondents said it would not, of course depending on the na-ture of the requirements.
© Peterson Institute for International Economics | www.piie.com

100 SOVEREIGN WEALTH FUNDS: THREAT OR SALVATION?
hears this argument is that forcing SWFs to disclose their investment strate-gies and intentions will undercut their profit opportunities.35 For example,Lou Jiwei of the CIC was quoted in late 2007 as saying, “We will increasetransparency without harming the commercial interests of CIC. That is tosay it will be a gradual process. Transparency is a really tough issue. If weare transparent on everything, the wolves will eat us up.” 36 More aggres-sively against the rising demands for increased transparency, Bader M. Al-Sa’ad of the Kuwait Investment Authority said in January 2008, “We areconcerned about what they mean when they call for transparency. Do wehave to announce every investment before we make it?” 37
It is reasonable to ask whether SWFs that have higher figures on thescoreboard have lower returns. This is not an easy question to answerwithout access to a dataset covering many funds over an extended periodof time standardized on their portfolio preferences. Those data are not inthe public domain. We looked at a limited amount of data for a small sub-set of the funds in terms of their 2007 returns—not a very satisfactory setof evidence. What we found was that there was no correlation one way orthe other between the 2007 financial performances of SWFs and how theyranked on the 2009 SWF scoreboard. For 11 pension SWFs, the coefficienton the total scoreboard’s score as the independent variable was negativebut not significantly different from zero. For a dozen nonpension SWFs,the coefficient was positive, but also not significantly different from zero.Using the accountability and transparency score alone produced similarresults.
We do have some indirect evidence on the importance of an SWF’s per-formance on the scoreboard. Kotter and Lel (2010), using a dataset of 358announced investments in 40 countries by 22 SWFs of 15 countries from1988 to February 2009, find that the announcements are associated with apositive initial impact on stock prices, looking principally at a two-daywindow. This finding is not surprising; studies involving other types oflarge investors yield similar results, and those results can be explained byanything from insider information to market respect for the due diligenceof the investor. What is more surprising and relevant in the context of theSWF scoreboard is that the stock-price effect is stronger and statisticallysignificant for the funds that have a better record of accountability and
35. A related argument is that SWFs will increase the frequency and rapidity of their ad-justments to market conditions as a result of having to disclose their short-term results andcontribute to greater market volatility. The appropriate response is that opacity has neverhelped markets and the owners and managers of SWFs should be able to do the right thingfor their citizens and the financial system as a whole without having to retreat into darkness.
36. As quoted in Marin Arnold, “China Fund Warns on National Security,” Financial Times,December 11, 2007, 4.
37. Henny Sender, “KIA Chief Focuses on Long-Term Opportunities,” Financial Times, Janu-ary 2, 2008, 20.
© Peterson Institute for International Economics | www.piie.com
ACCOUNTABILITY AND TRANSPARENCY 101
transparency as indicated by their scores on that component of the 2008edition of the SWF scoreboard (Truman 2008a).38
Bortolotti et al. (2009) look at similar evidence for a slightly larger sam-ple of SWF investments, which is still a very small portion of total SWFportfolios—$141 billion, or less than 5 percent of the overall total even fora narrow definition of SWFs. They find that SWFs tend to invest in listedcompanies that have a history of low returns compared with investmentsin matched targets and with other standards. They find, as do Kotter and Lel (2010), that those investments are significantly associated withimmediate positive returns. For Bortolotti et al., this effect is not signifi-cantly enhanced or reduced by an SWF’s score on the 2008 edition of thescoreboard or any of its components. The reason for the apparent conflictwith the Kotter-Lel results may be that Bortolotti et al. introduce as a sep-arate independent variable whether the investment is in a financial insti-tution.39 Finally, Bortolotti et al. look at longer-term returns of up to 24months and find that those returns are substantially negative comparedwith matched targets and with other standards. Although a fund’s scoreon the governance component of the 2008 edition of the scoreboard has a significant positive influence, its score on the accountability and trans-parency component goes the other way at least at the 6- and 12-monthtime horizons, providing a bit of evidence that transparency may hurt re-turns. Bortolotti et al. (2009, 28) conclude that poor stock picking by SWFs“could be a consequence of political pressures which led SWFs to investin distressed industries in order to minimize target-country regulatoryand political opposition.” It should be noted that a quarter of their over-all sample of 1,216 investments involved domestic investments, but thisdid not show up as a significant explanatory variable.
Is it inappropriate to ask SWFs to practice a high degree of accountabilityand transparency under something like the SWF scoreboard approach?The results of Bortoloti et al. are insufficient to support that case. My an-swer is no for three reasons.
First, no one is asking a fund to reveal its investment intentions, andthus to set itself up for front running. The approach involves only ex postreporting. Moreover, a large fund can hardly disguise its investments, andmany now announce their significant investments, providing the infor-mation for the limited number of statistical studies of the effects of thoseinvestments.
Second, these are governmental institutions, and they should be held tothe highest standards even if it proves to be embarrassing to their boards
38. Separate regressions with each of the 33 elements of the 2008 SWF scoreboard producestatistical significant results for 14 of those elements, and all 14 are included in the updatedscoreboard presented in this chapter.
39. Kotter and Lel find that their results are robust to excluding those investments.
© Peterson Institute for International Economics | www.piie.com

102 SOVEREIGN WEALTH FUNDS: THREAT OR SALVATION?
and managers when they incur losses. As I have argued (Truman 2007),over the longer run an established track record of accountability and dis-closure protects managers from unjustified criticism. Many officials ofSWFs with whom I have spoken over the past three years have confirmedthis judgment.
Third, as for the rest of the argument that hedge funds and private eq-uity firms do not practice such accountability and transparency, the pen-dulum is swinging in that direction. I have long argued that hedge fundsand private equity firms should provide more public disclosure. JohnGieve, speaking in early 2008 as the deliberations of the IWG were aboutto begin, turned this argument around saying that there should be a levelplaying field. He reminded his listeners that efforts were then under wayin the United Kingdom to promote greater transparency on the part ofhedge funds and private equity funds.40
Those efforts produced a report on transparency and disclosure by UKportfolio companies and private equity firms (Walker Group 2007) and areport on hedge fund standards (Large Group 2008). The Walker Groupreport prescribed the types of information that should be in the publicannual reports of portfolio companies under the UK Companies Act of2006 and recommended that private equity firms publish annual reviewson their websites communicating specific types of information, includinginvestment strategies, portfolios, and partners. The Large Group report(2008) on hedge funds went into much greater detail, but limited its callfor public disclosure to a call for hedge fund managers “to carry on theirwebsites an appropriate amount of information about themselves” andfor the sector as a whole to provide more generic information about thesector and individual firms. The UK groups also put forward the use-ful concept of “comply or explain” why you are not complying, whichshould be adopted by the owners of SWFs.
A parallel exercise in the United States instigated by the President’sWorking Group on Financial Markets produced two reports on hedgefunds in April 2008 (Asset Managers’ Committee 2008, Investors’ Commit-tee 2008). These reports, while going into considerable detail about disclo-sures to counterparties and information that should be made available toinvestors, did not directly address the issue of standards of public disclo-sure. Thus, they did not go as far in this direction as was recommended forthe United States or globally in the wake of the Long-Term Capital Man-agement episode (President’s Working Group on Financial Markets 1999,Financial Stability Board 2000). However, those recommendations were notfully implemented because of resistance from representatives of financialinstitutions. In 2004, the SEC moved toward regulating hedge funds more
40. John Gieve, “Sovereign Wealth Funds and Global Imbalances,” speech to the SovereignWealth Management Conference, London, March 14, 2008, available at www.bankofengland.co.uk (accessed on July 12, 2010).
© Peterson Institute for International Economics | www.piie.com

ACCOUNTABILITY AND TRANSPARENCY 103
formally by issuing a rule requiring them to register as investment advi-sors. This rule was struck down by the courts in 2006, responding to thehedge funds. In a similar vein of resistance to regulation, in the middle ofthe global economic and financial crisis of 2007–09, the Institute of Interna-tional Finance (2009b) released a report that cautioned against the unin-tended consequences of substantially increased disclosure under pillar 2 ofthe Basel II capital framework that applies to regulating the banking sector.
I am confident that when all the dust settles from the global economicand financial crisis, hedge funds and private equity firms, as well as morecomprehensively regulated financial institutions, will be subject to a greatdeal more in the way of public disclosure requirements than was the case in2007 before the crisis broke. Although the exact modalities have yet to beestablished, and they may not be consistent with nondiscrimination and alevel playing field, both the United States and the European Union will sub-ject hedge funds or alternative investment managers to a higher degree ofdisclosure as well as oversight than has been the case.
These actions with respect to hedge funds and similar entities are occur-ring despite the fact that many argue, with considerable merit, that hedgefunds and private equity firms had little to do with the crisis. Indeed, Mal-laby (2010) argues that in the case of hedge funds, incentives were betteraligned than they were in large, publicly traded financial institutions thatcame under severe stress to the point of collapse during the crisis.
What about the enforceability of a scoreboard approach to best practicesfor SWFs? It is necessary to recognize that SWFs are owned and controlledby sovereign governments. International leverage over sovereign govern-ments is constrained by that reality unless a country wants to impose aunilateral prohibition on such investments. In that context, various inter-national agreements and conventions operate as restraints on the otherside.41 Thus, the principal mechanism of enforcement is peer pressure,possibly reinforced by naming and shaming. In general, countries withlow scores on international indicators do not like the negative publicityassociated with those scores and often respond by trying to raise them.The evidence on improved scores on the SWF scoreboard adduced earlierin this chapter supports this argument. More importantly in this context,each country with an SWF has an interest in encouraging “compliance,”for want of a better word, by other countries with SWFs lest they all be-come tarred with the same brush. This fact reinforces the positive role thattransparency about relative performance on the SWF scoreboard can play.
41. US Senator Evan Bayh advocated unilateral enforcement of best practices by the UnitedStates; countries seeking to invest in the United States would be prohibited from doing so un-less they could demonstrate that they adhered to best practices that would be enshrined in USlaw. It is not clear how the United States would verify compliance with this type of nationalstandard without the cooperation of other countries. See Evan Bayh, “Time for SovereignWealth Rules,” Wall Street Journal, February 13, 2008.
© Peterson Institute for International Economics | www.piie.com

104 SOVEREIGN WEALTH FUNDS: THREAT OR SALVATION?
Finally, host countries are not entirely without some leverage. TheUnited States and other similarly situated countries might reasonably de-cide to take account of a country’s voluntary compliance with the inter-national best practices for SWFs as one of a number of factors consideredin making determinations about whether a particular fund’s investmentshould be blocked because of a threat to national security. For example, ina March 13, 2008 letter sent to US Treasury Secretary Henry Paulson, Rep-resentatives Barney Frank, Carolyn Maloney, and Luis Gutierrez sug-gested that a country’s compliance with aspects of SWF best practicescould be used by the CFIUS as a factor in determining whether it shouldgrant that country a waiver from a full investigation of an investment bya government-owned pension fund under the FINSA. A record and a rep-utation can matter. It is just not enough in this regard for a fund to haveestablished a reputation with market participants alone.
The Scoreboard and Concerns about Sovereign Wealth Funds
Chapter 3 identified five concerns about SWFs: mismanagement of theirinvestments; pursuit of political or economic power objectives; financialprotectionism in anticipation of, or in response to, the pursuit by SWFs ofpolitical or economic power objectives; market turmoil and uncertainty;and conflicts of interest. I argued in that chapter that the various ap-proaches to dealing with these concerns were either off the mark, infea-sible, or counterproductive. How does an agreed-upon international stan-dard for SWFs such as the SWF scoreboard approach measure up?
With respect to the home country’s mismanagement of the investmentsof its SWFs, the scoreboard approach helps to limit the scope of the prob-lem. The scoreboard is built on the concept of accountability and trans-parency, exploiting the disinfecting and inoculating effects of sunshine. Al-though it is not possible to exclude the possibility of mismanagement andcorruption in the activities of SWFs, the more that is known about them,the more difficult it is for that mismanagement or corruption to occur.
On the pursuit of political or economic power objectives, I have arguedthat politics is inherent in any government-owned or -controlled economicor financial institution. However, if that institution is accountable not onlyto its own government and citizens but also to the governments and citi-zens of countries hosting its investments—which would be aided by theSWF scoreboard approach—then the temptation and scope to use theSWF to achieve this type of objective is reduced. Countries do not in gen-eral set up an SWF with a high degree of transparency and accountabilityto undertake activities that would not be welcome in the countries inwhich they are investing. I am not saying that countries’ motives are al-ways pure, only that they are disinclined to advertise their impurities.
© Peterson Institute for International Economics | www.piie.com

ACCOUNTABILITY AND TRANSPARENCY 105
On financial protectionism in anticipation of, or in response to, the pur-suit by an SWF of political or economic power objectives, that risk wouldbe reduced to the extent that the home countries were more accountableand transparent about the operations of their SWFs. As El-Erian (2008, 197)put it while defending the inherent respectability of SWFs, “the risk is thatthe absence of adequate safeguards at the level of the SWF—as opposed to that of the recipient country—will end up feeding general protectionistpressures into the global economy. The specific risk is a proliferation ofcapital account protectionism and negative externalities in the form of fur-ther delays in completing the next stages of trade liberalization.” Hostcountries would have less to fear and, hence, less to protect against.
Market participants would be similarly aided with respect to concernsabout potential turbulence and uncertainty on account of SWF activities.Some of the funds are large and could move markets. If the SWFs canestablish an open record of credible accountability, then this potentialsource of disturbance or at least uncertainty would be reduced if not elim-inated. This is the rationale behind the scoreboard element focused onwhether an SWF has a stated guideline for adjusting its portfolio. As wesaw, very few SWFs currently have such a guideline.
Finally, with respect to conflicts of interest, those conflicts involving thefunds and agents acting for them in markets should be reduced by thepromotion of standards covering their interactions. This is part of the ra-tionale behind the scoreboard element focused on whether an SWF pub-lishes the list of recipients of its mandates. As we saw, compliance withthis element is not perfect, but it has increased substantially over the pastseveral years. On the potentially more serious conflicts between homeand host governments over the activities of SWFs, the fact that they canjointly agree upon an international standard should promote better un-derstanding and trust among them, or at least reduce misunderstandingand distrust. This is the case whether the standard is described as a score-board, a code of conduct, a set of best practices, or the IWG’s GenerallyAccepted Principles and Practices to which I turn in the next chapter, aslong as that standard is robust and compliance with it is high.
© Peterson Institute for International Economics | www.piie.com

106 SOVEREIGN WEALTH FUNDS: THREAT OR SALVATION?
Appendix 5AScoreboard for Sovereign Wealth Funds
This appendix and its accompanying table 5A.1 present the individual el-ements of the scoreboard described in chapter 5. The scoreboard hasevolved since the first edition in 2007, as summarized below.
For each of the 33 elements, posed as questions, if the answer is an un-qualified yes, we score it as 1. If the answer is no, we score it as 0. How-ever, partial scores of 0.25, 0.50, and 0.75 are recorded for many elements,indicated by (p) in the descriptions below.
The four categories in the scoreboard are listed below with subcate-gories where relevant. The words in bold are keyed to the presentation ofresults in table 5A.1.
Structure
1. Is the SWF’s objective clearly stated? (p)
2. Is there a clear legal framework for the SWF? This element wasincorporated into the 2008 scoreboard from Santiago Principle 1.1(see chapter 6).
3. Is the procedure for changing the structure of the SWF clear? (p)
4. Is the overall investment strategy clearly stated? (p)
Fiscal Treatment
5. Is the source of the SWF’s funding clearly specified? (p)
6. Is the nature of the subsequent use of the principal and earnings ofthe fund clearly specified? (p)
7. Are the SWF’s operations appropriately integrated with fiscal andmonetary policies? (p)
8. Is the SWF separate from the country’s international reserves?
Governance
9. Is the role of the government in setting the investment strategy ofthe SWF clearly established? (p)
10. Is the role of the governing body of the SWF clearly established?(p) This element was incorporated into the 2008 scoreboard fromSantiago Principle 8 (see chapter 6).
© Peterson Institute for International Economics | www.piie.com

ACCOUNTABILITY AND TRANSPARENCY 107
11. Is the role of the managers in executing the investment strategyclearly established? (p)
12. Are decisions on specific investments made by the managers? (p)
13. Does the SWF have internal ethical standards for its managementand staff? (p) This element was incorporated into the 2008 score-board from Santiago Principle 13 (see chapter 6).
14. Does the SWF have in place, and make publicly available, guide-lines for corporate responsibility that it follows? (p)
15. Does the SWF have ethical investment guidelines that it follows? (p)
Transparency and Accountability
Investment Strategy Implementation
16. Do regular reports on investments by the SWF include informationon the categories of investments? (p)
17. Does the strategy use benchmarks? (p)
18. Does the strategy use credit ratings? (p)
19. Are the holders of investment mandates identified? (p)
Investment Activities
20. Do regular reports on the investments by the SWF include the sizeof the fund? (p)
21. Do regular reports on the investments by the SWF include infor-mation on its returns? (p)
22. Do regular reports on the investments by the SWF include infor-mation on the geographic location of investments? (p)
23. Do regular reports on the investments by the SWF include infor-mation on the specific investments? (p)
24. Do regular reports on the investments by the SWF include infor-mation on the currency composition of investments? (p)
Reports
25. Does the SWF provide at least an annual report on its activities andresults? (p)
26. Does the SWF provide quarterly reports? (p)
© Peterson Institute for International Economics | www.piie.com
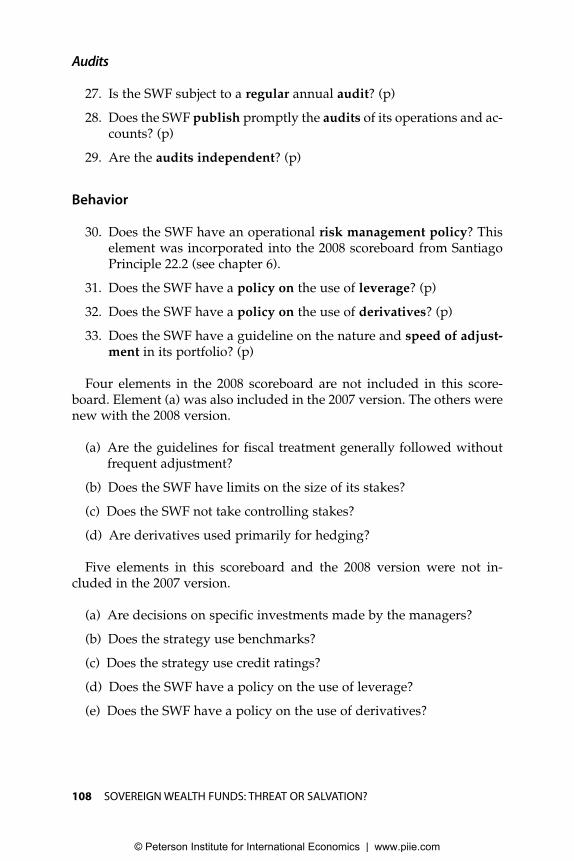
108 SOVEREIGN WEALTH FUNDS: THREAT OR SALVATION?
Audits
27. Is the SWF subject to a regular annual audit? (p)
28. Does the SWF publish promptly the audits of its operations and ac-counts? (p)
29. Are the audits independent? (p)
Behavior
30. Does the SWF have an operational risk management policy? Thiselement was incorporated into the 2008 scoreboard from SantiagoPrinciple 22.2 (see chapter 6).
31. Does the SWF have a policy on the use of leverage? (p)
32. Does the SWF have a policy on the use of derivatives? (p)
33. Does the SWF have a guideline on the nature and speed of adjust-ment in its portfolio? (p)
Four elements in the 2008 scoreboard are not included in this score-board. Element (a) was also included in the 2007 version. The others werenew with the 2008 version.
(a) Are the guidelines for fiscal treatment generally followed withoutfrequent adjustment?
(b) Does the SWF have limits on the size of its stakes?
(c) Does the SWF not take controlling stakes?
(d) Are derivatives used primarily for hedging?
Five elements in this scoreboard and the 2008 version were not in-cluded in the 2007 version.
(a) Are decisions on specific investments made by the managers?
(b) Does the strategy use benchmarks?
(c) Does the strategy use credit ratings?
(d) Does the SWF have a policy on the use of leverage?
(e) Does the SWF have a policy on the use of derivatives?
© Peterson Institute for International Economics | www.piie.com

10
9
Table 5A.1 Scoreboard for sovereign wealth funds
Structure
Fiscal treatment
1 2 3 4 5 6 7 8
Separate
Changing Source Use of Integrated from
Objective Legal the Investment of fund with international Sub-
Country Fund stated framework structure strategy funding earnings policies reserves total
Algeria Revenue Regulation Fund 1 1 1 0 1 0.5 0 1 5.5
Australia Future Fund (PR) 1 1 1 1 1 1 0.5 0.5 7
Azerbaijan State Oil Fund 1 1 1 0.5 1 1 1 1 7.5
Bahrain Mumtalakat Holding Company 1 0 0 1 1 0 0 0 3
Botswana Pula Fund 1 1 0 1 0.5 1 1 0 5.5
Brunei Brunei Investment Agency 1 1 1 0 0.5 0 0 0 3.5
Canada Alberta Heritage Savings Trust Fund 1 1 1 1 1 1 1 0.5 7.5
Caisse de dépôt et placement du Québec (P) 1 1 1 1 1 1 0.5 0.5 7
Canada Pension Plan (P) 1 1 1 1 1 1 0.5 0.5 7
Ontario Teachers’ Pension Plan (P) 1 1 1 1 1 1 0.5 0.5 7
Chile Economic and Social Stabilization Fund 1 1 1 0.5 1 1 1 1 7.5
Pension Reserve Fund (PR) 1 1 1 0.5 1 1 0.5 0.5 6.5
China China Investment Corporation 1 0 0 1 1 1 1 1 6
National Social Security Fund (P) 1 1 0.5 1 1 1 0.5 0.5 6.5
France Fonds de réserve pour les retraites (P) 1 1 1 1 1 1 0.5 0.5 7
Hong Kong Exchange Fund 1 1 1 1 1 1 1 0 7
Iran Oil Stabilization Fund 1 1 0.5 0 1 0.5 0 1 5
Ireland National Pensions Reserve Fund (PR) 1 1 1 1 1 1 0.5 0.5 7
Japan Government Pension Investment Fund (P) 1 1 1 1 1 1 0.5 0.5 7
(continued on next page)
© Peterson Institute for International Economics | www.piie.com
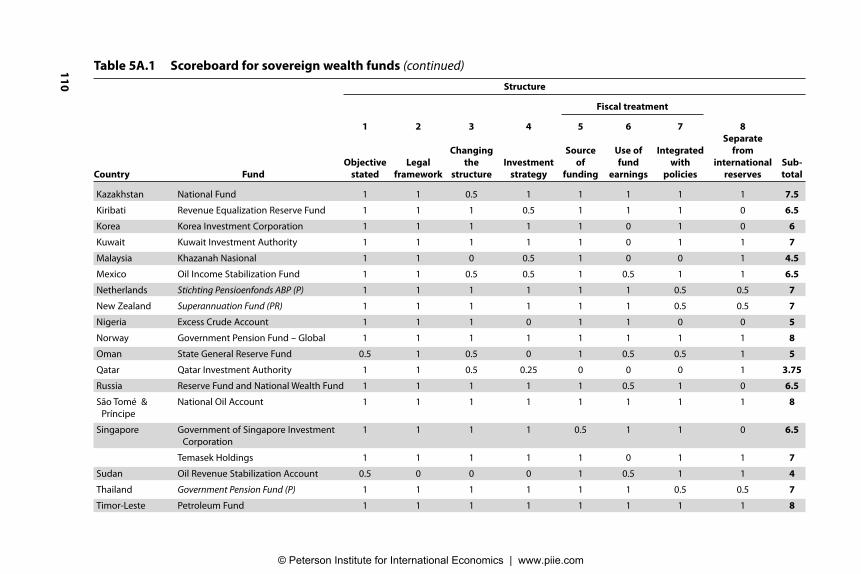
Kazakhstan National Fund 1 1 0.5 1 1 1 1 1 7.5
Kiribati Revenue Equalization Reserve Fund 1 1 1 0.5 1 1 1 0 6.5
Korea Korea Investment Corporation 1 1 1 1 1 0 1 0 6
Kuwait Kuwait Investment Authority 1 1 1 1 1 0 1 1 7
Malaysia Khazanah Nasional 1 1 0 0.5 1 0 0 1 4.5
Mexico Oil Income Stabilization Fund 1 1 0.5 0.5 1 0.5 1 1 6.5
Netherlands Stichting Pensioenfonds ABP (P) 1 1 1 1 1 1 0.5 0.5 7
New Zealand Superannuation Fund (PR) 1 1 1 1 1 1 0.5 0.5 7
Nigeria Excess Crude Account 1 1 1 0 1 1 0 0 5
Norway Government Pension Fund – Global 1 1 1 1 1 1 1 1 8
Oman State General Reserve Fund 0.5 1 0.5 0 1 0.5 0.5 1 5
Qatar Qatar Investment Authority 1 1 0.5 0.25 0 0 0 1 3.75
Russia Reserve Fund and National Wealth Fund 1 1 1 1 1 0.5 1 0 6.5
São Tomé & National Oil Account 1 1 1 1 1 1 1 1 8
Príncipe
Singapore Government of Singapore Investment 1 1 1 1 0.5 1 1 0 6.5
Corporation
Temasek Holdings 1 1 1 1 1 0 1 1 7
Sudan Oil Revenue Stabilization Account 0.5 0 0 0 1 0.5 1 1 4
Thailand Government Pension Fund (P) 1 1 1 1 1 1 0.5 0.5 7
Timor-Leste Petroleum Fund 1 1 1 1 1 1 1 1 8
11
0
Table 5A.1 Scoreboard for sovereign wealth funds (continued)
Structure
Fiscal treatment
1 2 3 4 5 6 7 8
Separate
Changing Source Use of Integrated from
Objective Legal the Investment of fund with international Sub-
Country Fund stated framework structure strategy funding earnings policies reserves total
© Peterson Institute for International Economics | www.piie.com

11
1
Trinidad & Heritage and Stabilization Fund 1 1 1 1 1 1 1 1 8
Tobago
UAE Abu Dhabi Investment Authority 0.5 0 0 1 0 0 0 0.5 2
Dubai International Capital 1 0 1 1 0.5 1 1 0.5 6
International Petroleum Investment 1 0 1 0 1 0 0 0.5 3.5
Company
Investment Corporation of Dubai 1 1 0 0 1 0 0 0.5 3.5
Istithmar World 1 0 0 0.5 0.5 0 0 0.5 2.5
Mubadala Development Company 1 1 0.5 1 1 0 0 0.5 5
United States Alabama Trust Fund 1 1 1 1 1 1 1 0.5 7.5
Alaska Permanent Fund 1 1 1 1 1 1 1 0.5 7.5
California Public Employees’ Retirement 1 1 1 1 1 1 0.5 0.5 7
System (P)
New Mexico Severance Tax Permanent 1 1 1 1 1 1 1 0.5 7.5
Fund
Wyoming Permanent Mineral Trust Fund 1 1 1 1 1 1 1 0.5 7.5
Venezuela Macroeconomic Stabilization Fund 1 1 1 0.5 1 0 0 1 5.5
National Development Fund 0.5 1 1 0 0.5 0 0 1 4
Vietnam State Capital Investment Corporation 1 1 1 1 1 0.5 0 1 6.5
Nonpension 38 33 29 26.75 35 22.5 24.5 25.5 5.86
totala
Pension totala 13 13 12.5 12.5 13 13 6.5 6.5 6.92
SWFs totala 51 46 41.5 39.25 48 35.5 31 32 6.12
Memorandum
United Kingdom Terra Firma 1 1 1 1 1 1 0.5 0.5 7
United States Harvard University Endowment 1 1 1 1 1 1 0.5 0.5 7
TIAA-CREF 1 1 1 1 1 1 0.5 0.5 7
Blackstone 1 1 1 1 1 1 0.5 0.5 7
Totala 4 4 4 4 4 4 2 2 7
a. For each element, the total is the sum for the relevant funds. For the subtotals category and the grand total, the figures are for the individual fund.
Note: Pension funds (P) and reserve pension funds (PR) shown in italics.
(continued on next page)
© Peterson Institute for International Economics | www.piie.com

11
2 Table 5A.1 Scoreboard for sovereign wealth funds (continued)
Governance
9 10 11 12 13 14 15
Role of Decisions Internal Guidelines for Ethical
Role of governing Role of made by ethical corporate investment Sub-
Country Fund government body managers managers standards responsibility guidelines total
Algeria Revenue Regulation Fund 1 0 1 0 0 0 0 2
Australia Future Fund (PR) 1 1 1 1 1 1 0 6
Azerbaijan State Oil Fund 1 1 1 1 0 0 0 4
Bahrain Mumtalakat Holding Company 0 1 0 0 0 0 0 1
Botswana Pula Fund 1 1 1 1 0 0 0 4
Brunei Brunei Investment Agency 0 0 0 0 0 0 0 0
Canada Alberta Heritage Savings Trust Fund 1 1 1 1 0 0 0 4
Caisse de dépôt et placement du Québec (P) 1 1 1 1 1 1 1 7
Canada Pension Plan (P) 1 1 1 1 1 1 1 7
Ontario Teachers’ Pension Plan (P) 1 1 1 1 0 1 1 6
Chile Economic and Social Stabilization Fund 1 1 1 1 0 0 0 4
Pension Reserve Fund (PR) 1 1 1 1 0 0 0 4
China China Investment Corporation 1 1 1 0 0 0.5 0 3.5
National Social Security Fund (P) 1 1 1 0 0 0 0 3
France Fonds de réserve pour les retraites (P) 1 1 1 1 1 1 1 7
Hong Kong Exchange Fund 1 1 1 0 0 0 0 3
Iran Oil Stabilization Fund 0.5 1 0.5 0 0 0 0 2
Ireland National Pensions Reserve Fund (PR) 1 1 1 1 1 1 1 7
Japan Government Pension Investment Fund (P) 1 1 1 1 1 1 0.5 6.5
Kazakhstan National Fund 1 1 1 1 0 0 0 4
© Peterson Institute for International Economics | www.piie.com

11
3
Kiribati Revenue Equalization Reserve Fund 1 1 1 1 0 0 0 4
Korea Korea Investment Corporation 1 1 1 1 1 0 0 5
Kuwait Kuwait Investment Authority 1 1 1 1 1 0 1 6
Malaysia Khazanah Nasional 0.5 1 1 0.5 0 0.5 0 3.5
Mexico Oil Income Stabilization Fund 0.5 0 0.5 0 0 0 0 1
Netherlands Stichting Pensioenfonds ABP (P) 1 1 1 1 0 1 1 6
New Zealand Superannuation Fund (PR) 1 1 1 1 1 1 1 7
Nigeria Excess Crude Account 0.5 1 1 0 0 0 0 2.5
Norway Government Pension Fund – Global 1 1 1 1 1 1 1 7
Oman State General Reserve Fund 0 0 0 0 0 0 0 0
Qatar Qatar Investment Authority 0 1 0 0 0 0 0 1
Russia Reserve Fund and National Wealth Fund 1 0 1 0 0 0 0 2
São Tomé & National Oil Account 1 1 1 1 0 0 0 4
Príncipe
Singapore Government of Singapore Investment 1 1 1 1 1 0 0 5
Corporation
Temasek Holdings 1 1 1 1 1 0.5 0 5.5
Sudan Oil Revenue Stabilization Account 0 0 0 0 0 0 0 0
Thailand Government Pension Fund (P) 1 1 1 1 0 1 1 6
Timor-Leste Petroleum Fund 1 1 1 0 0 0 0 3
Trinidad & Heritage and Stabilization Fund 1 1 1 1 0.5 0 0 4.5
Tobago
UAE Abu Dhabi Investment Authority 0 1 0 0 0 0 0 1
Dubai International Capital 1 1 1 0 1 1 1 6
International Petroleum Investment 0.5 0.5 1 0 0 0 0 2
Company
Investment Corporation of Dubai 0.5 0 0 0 0 0 0 0.5
(continued on next page)
© Peterson Institute for International Economics | www.piie.com

11
4
Table 5A.1 Scoreboard for sovereign wealth funds (continued)
Governance
9 10 11 12 13 14 15
Role of Decisions Internal Guidelines for Ethical
Role of governing Role of made by ethical corporate investment Sub-
Country Fund government body managers managers standards responsibility guidelines total
Istithmar World 0 1 0.5 0 0 0 0 1.5
Mubadala Development Company 1 1 1 0 1 0 0 4
United States Alabama Trust Fund 1 1 1 1 0 0 0 4
Alaska Permanent Fund 1 1 1 1 1 1 0 6
California Public Employees’ Retirement 1 1 1 1 1 1 1 7
System (P)
New Mexico Severance Tax Permanent 1 1 1 0.5 0 0 0 3.5
Fund
Wyoming Permanent Mineral Trust Fund 1 1 1 1 1 0.5 1 6.5
Venezuela Macroeconomic Stabilization Fund 0 1 0 0 0 0 0 1
National Development Fund 0 1 0 0 0 0 0 1
Vietnam State Capital Investment Corporation 1 1 1 1 0 0 0 4
Nonpension 28 32.5 29.5 18 9.5 5 4 3.16
totala
Pension totala 13 13 13 12 8 11 9.5 6.12
SWFs totala 41 45.5 42.5 30 17.5 16 13.5 3.89
Memorandum
United Kingdom Terra Firma 0.5 1 1 1 0 0.25 1 4.75
United States Harvard University Endowment 0.5 1 1 1 0 1 0 4.5
TIAA-CREF 0.5 1 1 1 1 1 0.25 5.75
Blackstone 0.5 1 1 1 0 0 0 3.5
Totala 2 4 4 4 1 2.25 1.25 4.625
a. For each element, the total is the sum for the relevant funds. For the subtotals category and the grand total, the figures are for the individual fund.
Note: Pension funds (P) and reserve pension funds (PR) shown in italics.
© Peterson Institute for International Economics | www.piie.com
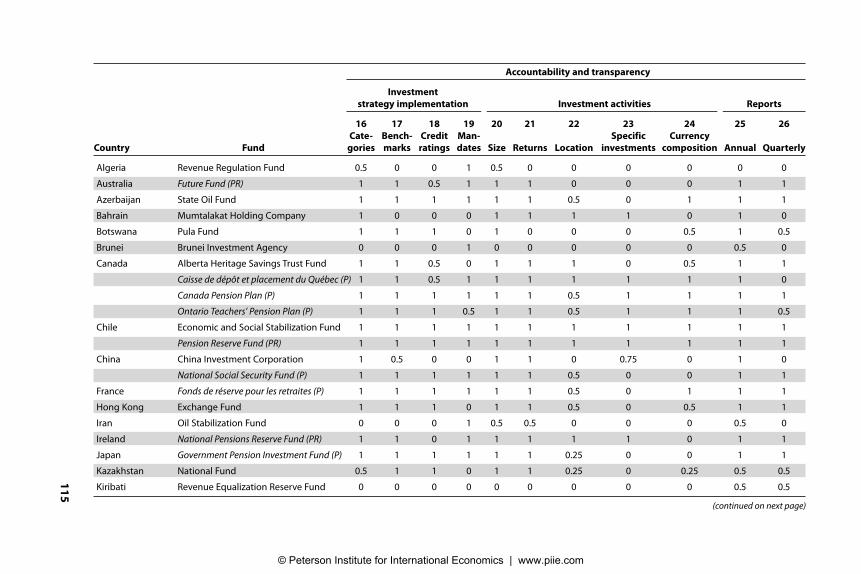
11
5
Accountability and transparency
Investment
strategy implementation Investment activities Reports
16 17 18 19 20 21 22 23 24 25 26
Cate- Bench- Credit Man- Specific Currency
Country Fund gories marks ratings dates Size Returns Location investments composition Annual Quarterly
Algeria Revenue Regulation Fund 0.5 0 0 1 0.5 0 0 0 0 0 0
Australia Future Fund (PR) 1 1 0.5 1 1 1 0 0 0 1 1
Azerbaijan State Oil Fund 1 1 1 1 1 1 0.5 0 1 1 1
Bahrain Mumtalakat Holding Company 1 0 0 0 1 1 1 1 0 1 0
Botswana Pula Fund 1 1 1 0 1 0 0 0 0.5 1 0.5
Brunei Brunei Investment Agency 0 0 0 1 0 0 0 0 0 0.5 0
Canada Alberta Heritage Savings Trust Fund 1 1 0.5 0 1 1 1 0 0.5 1 1
Caisse de dépôt et placement du Québec (P) 1 1 0.5 1 1 1 1 1 1 1 0
Canada Pension Plan (P) 1 1 1 1 1 1 0.5 1 1 1 1
Ontario Teachers’ Pension Plan (P) 1 1 1 0.5 1 1 0.5 1 1 1 0.5
Chile Economic and Social Stabilization Fund 1 1 1 1 1 1 1 1 1 1 1
Pension Reserve Fund (PR) 1 1 1 1 1 1 1 1 1 1 1
China China Investment Corporation 1 0.5 0 0 1 1 0 0.75 0 1 0
National Social Security Fund (P) 1 1 1 1 1 1 0.5 0 0 1 1
France Fonds de réserve pour les retraites (P) 1 1 1 1 1 1 0.5 0 1 1 1
Hong Kong Exchange Fund 1 1 1 0 1 1 0.5 0 0.5 1 1
Iran Oil Stabilization Fund 0 0 0 1 0.5 0.5 0 0 0 0.5 0
Ireland National Pensions Reserve Fund (PR) 1 1 0 1 1 1 1 1 0 1 1
Japan Government Pension Investment Fund (P) 1 1 1 1 1 1 0.25 0 0 1 1
Kazakhstan National Fund 0.5 1 1 0 1 1 0.25 0 0.25 0.5 0.5
Kiribati Revenue Equalization Reserve Fund 0 0 0 0 0 0 0 0 0 0.5 0.5
(continued on next page)
© Peterson Institute for International Economics | www.piie.com

Korea Korea Investment Corporation 0.5 0.5 1 0 1 0.25 0 0 0 0.5 0
Kuwait Kuwait Investment Authority 1 0.5 1 0 1 0.5 0.25 0 0 0.5 0
Malaysia Khazanah Nasional 0.5 1 0 0 1 1 1 0.5 0 0.5 0
Mexico Oil Income Stabilization Fund 0 0 0 0 1 1 0 0 1 0.5 0.5
Netherlands Stichting Pensioenfonds ABP (P) 1 1 1 0 1 1 0.5 1 1 1 0.5
New Zealand Superannuation Fund (PR) 1 1 1 1 1 1 1 1 1 1 1
Nigeria Excess Crude Account 0 0 0 1 0.5 0 0 0 0.5 0 0
Norway Government Pension Fund – Global 1 1 1 1 1 1 1 1 1 1 1
Oman State General Reserve Fund 0 0 0 0 0 0 0 0 0 0.5 0
Qatar Qatar Investment Authority 0 0 0 0 0 0 0 0 0.25 0 0
Russia Reserve Fund and National Wealth Fund 1 0 1 1 1 0.5 0.5 0 1 0.5 0.5
São Tomé & National Oil Account 0.5 0 0 1 0.5 0 0 0 0 0 0
Príncipe
Singapore Government of Singapore Investment 1 1 0.5 0 0 0.5 1 0 0 1 0.5
Corporation
Temasek Holdings 1 0.5 0 0.5 1 1 1 0.5 0 1 0
Sudan Oil Revenue Stabilization Account 0 0 0 1 1 0 0 0 0 0 0
Thailand Government Pension Fund (P) 1 1 1 1 1 1 0.25 1 0 1 1
Timor-Leste Petroleum Fund 1 1 1 1 1 1 1 1 1 1 1
Trinidad & Heritage and Stabilization Fund 1 1 1 1 1 1 1 0 1 1 1
Tobago
UAE Abu Dhabi Investment Authority 0.25 0.25 0 0 0 0 0 0 0 0 0
11
6
Table 5A.1 Scoreboard for sovereign wealth funds (continued)
Accountability and transparency
Investment
strategy implementation Investment activities Reports
16 17 18 19 20 21 22 23 24 25 26
Cate- Bench- Credit Man- Specific Currency
Country Fund gories marks ratings dates Size Returns Location investments composition Annual Quarterly
© Peterson Institute for International Economics | www.piie.com

11
7
Dubai International Capital 1 0 0 0.5 1 0 1 1 0 0.5 0
International Petroleum Investment 1 0 0 0.5 0.5 0 0 1 0 0 0
Company
Investment Corporation of Dubai 1 0 0 0 0 0 1 1 0 0 0
Istithmar World 0.25 0 0 0 0.5 0 0.25 0 0 0 0
Mubadala Development Company 1 0.5 0 0.5 1 1 1 0.5 0 1 0
United States Alabama Trust Fund 1 1 1 0 1 1 0 0 0 1 0
Alaska Permanent Fund 1 1 1 1 1 1 1 1 1 1 1
California Public Employees’ Retirement 1 1 1 1 1 1 0.5 1 1 1 1
System (P)
New Mexico Severance Tax Permanent 1 1 1 1 1 1 0.5 0 1 1 1
Fund
Wyoming Permanent Mineral Trust Fund 1 1 1 1 1 1 0.5 0 0.5 1 1
Venezuela Macroeconomic Stabilization Fund 0.5 0 0 1 1 0 0 0 0 0 0
National Development Fund 0.25 0 0 0 1 0 0 0 0 1 0.5
Vietnam State Capital Investment Corporation 1 0 0 0 0 0 0 0 0 0 0
Nonpension 26.75 17.75 16 18 29 20.25 16.25 10.25 12 23.5 13.5
totala
Pension totala 13 13 11 11.5 13 13 7.5 9 8 13 11
SWFs totala 39.75 30.75 27 29.5 42 33.25 23.75 19.25 20 36.5 24.5
Memorandum
United Kingdom Terra Firma 1 0 0 0.5 1 1 1 1 1 1 0.5
United States Harvard University Endowment 1 1 1 0 1 1 0.25 0 0 1 0
TIAA-CREF 1 1 1 0 1 1 1 1 0 1 1
Blackstone 1 0 0 0.5 1 1 1 0.5 0.5 1 1
Totala 4 2 2 1 4 4 3.25 2.5 1.5 4 2.5
a. For each element, the total is the sum for the relevant funds. For the subtotals category and the grand total, the figures are for the individual fund.
Note: Pension funds (P) and reserve pension funds (PR) shown in italics.
(continued on next page)
© Peterson Institute for International Economics | www.piie.com
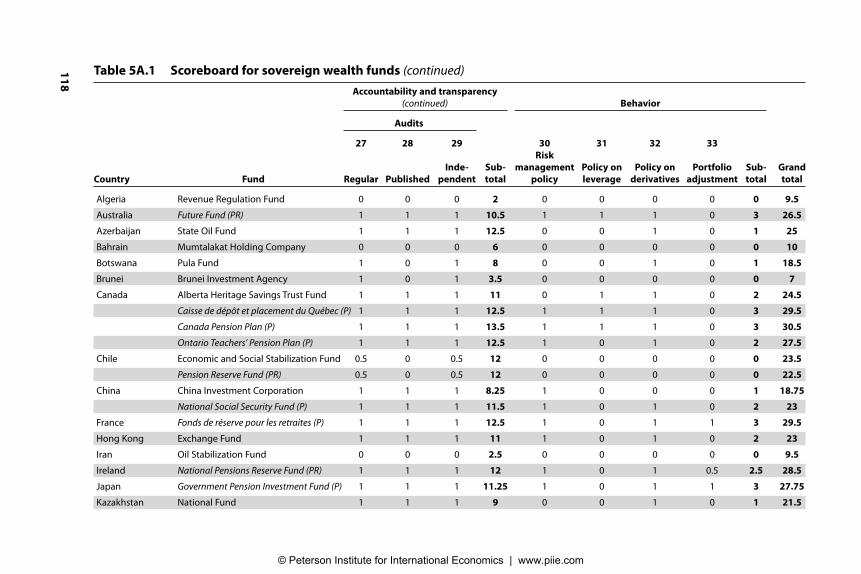
11
8
Table 5A.1 Scoreboard for sovereign wealth funds (continued)
Accountability and transparency
(continued) Behavior
Audits
27 28 29 30 31 32 33
Risk
Inde- Sub- management Policy on Policy on Portfolio Sub- Grand
Country Fund Regular Published pendent total policy leverage derivatives adjustment total total
Algeria Revenue Regulation Fund 0 0 0 2 0 0 0 0 0 9.5
Australia Future Fund (PR) 1 1 1 10.5 1 1 1 0 3 26.5
Azerbaijan State Oil Fund 1 1 1 12.5 0 0 1 0 1 25
Bahrain Mumtalakat Holding Company 0 0 0 6 0 0 0 0 0 10
Botswana Pula Fund 1 0 1 8 0 0 1 0 1 18.5
Brunei Brunei Investment Agency 1 0 1 3.5 0 0 0 0 0 7
Canada Alberta Heritage Savings Trust Fund 1 1 1 11 0 1 1 0 2 24.5
Caisse de dépôt et placement du Québec (P) 1 1 1 12.5 1 1 1 0 3 29.5
Canada Pension Plan (P) 1 1 1 13.5 1 1 1 0 3 30.5
Ontario Teachers’ Pension Plan (P) 1 1 1 12.5 1 0 1 0 2 27.5
Chile Economic and Social Stabilization Fund 0.5 0 0.5 12 0 0 0 0 0 23.5
Pension Reserve Fund (PR) 0.5 0 0.5 12 0 0 0 0 0 22.5
China China Investment Corporation 1 1 1 8.25 1 0 0 0 1 18.75
National Social Security Fund (P) 1 1 1 11.5 1 0 1 0 2 23
France Fonds de réserve pour les retraites (P) 1 1 1 12.5 1 0 1 1 3 29.5
Hong Kong Exchange Fund 1 1 1 11 1 0 1 0 2 23
Iran Oil Stabilization Fund 0 0 0 2.5 0 0 0 0 0 9.5
Ireland National Pensions Reserve Fund (PR) 1 1 1 12 1 0 1 0.5 2.5 28.5
Japan Government Pension Investment Fund (P) 1 1 1 11.25 1 0 1 1 3 27.75
Kazakhstan National Fund 1 1 1 9 0 0 1 0 1 21.5
© Peterson Institute for International Economics | www.piie.com

11
9
Kiribati Revenue Equalization Reserve Fund 0 0 0 1 0 0 0 0 0 11.5
Korea Korea Investment Corporation 1 0.5 1 6.25 1 0 1 0.5 2.5 19.75
Kuwait Kuwait Investment Authority 1 0 1 6.75 0 1 0 0 1 20.75
Malaysia Khazanah Nasional 1 0 0 6.5 0 0 0 0 0 14.5
Mexico Oil Income Stabilization Fund 0.5 0.5 1 6 0 0 1 0 1 14.5
Netherlands Stichting Pensioenfonds ABP (P) 1 1 1 12 1 0 1 1 3 28
New Zealand Superannuation Fund (PR) 1 1 1 14 1 1 1 0 3 31
Nigeria Excess Crude Account 0 0 0 2 0 0 0 0 0 9.5
Norway Government Pension Fund – Global 1 1 1 14 1 0.5 0.5 1 3 32
Oman State General Reserve Fund 1 0 1 2.5 0 0 0 0 0 7.5
Qatar Qatar Investment Authority 0 0 0 0.25 0 0 0 0 0 5
Russia Reserve Fund and National Wealth Fund 0 0 0 7 0 0 1 0 1 16.5
São Tomé & National Oil Account 1 0 1 4 0 0 0 0 0 16
Príncipe
Singapore Government of Singapore Investment 1 1 1 8.5 1 0 0.5 0 1.5 21.5
Corporation
Temasek Holdings 1 1 1 9.5 1 0 1 0 2 24
Sudan Oil Revenue Stabilization Account 0 0 0 2 0 0 0 0 0 6
Thailand Government Pension Fund (P) 1 1 1 12.25 0 0 0.5 0 0.5 25.75
Timor-Leste Petroleum Fund 1 1 1 14 1 0 1 1 3 28
Trinidad & Heritage and Stabilization Fund 1 1 1 13 1 0 0 1 2 27.5
Tobago
UAE Abu Dhabi Investment Authority 0 0 0 0.5 0 0 0 0 0 3.5
Dubai International Capital 0 0 0 5 1 0 0 0 1 18
International Petroleum Investment 0 0 0 3 0 0 0 0 0 8.5
Company
Investment Corporation of Dubai 0 0 0 3 0 0 0 0 0 7
Istithmar World 0 0 0 1 0 0 0 0 0 5
(continued on next page)
© Peterson Institute for International Economics | www.piie.com

12
0
Table 5A.1 Scoreboard for sovereign wealth funds (continued)
Accountability and transparency
(continued) Behavior
Audits
27 28 29 30 31 32 33
Risk
Inde- Sub- management Policy on Policy on Portfolio Sub- Grand
Country Fund Regular Published pendent total policy leverage derivatives adjustment total total
Mubadala Development Company 1 1 1 9.5 1 0 0 0 1 19.5
United States Alabama Trust Fund 1 1 1 9 0 1 1 0 2 22.5
Alaska Permanent Fund 1 1 1 14 1 1 1 0 3 30.5
California Public Employees’ Retirement 1 1 1 13.5 1 1 1 1 4 31.5
System (P)
New Mexico Severance Tax Permanent 1 1 1 12.5 0 1 1 1 3 26.5
Fund
Wyoming Permanent Mineral Trust Fund 1 1 1 12 1 1 1 1 4 30
Venezuela Macroeconomic Stabilization Fund 0 0 0 2.5 0 0 0 0 0 9
National Development Fund 1 0 0 3.75 0 0 0 0 0 8.75
Vietnam State Capital Investment Corporation 0 0 0 1 0 0 0 0 0 11.5
Nonpension 24 16 22.5 6.64 12 6.5 15 5.5 0.98 16.64
totala
Pension totala 12.5 12 12.5 12.31 11 5 11.5 4.5 2.46 27.81
SWFs totala 36.5 28 35 8.03 23 11.5 26.5 10 1.34 19.38
Memorandum
United Kingdom Terra Firma 1 1 1 11 1 0 0.5 0.5 2 24.75
United States Harvard University Endowment 1 1 1 9.25 1 0 1 0 2 22.75
TIAA-CREF 1 1 1 12 1 1 1 0 3 27.75
Blackstone 1 1 1 10.5 1 0 1 0 2 23
Totala 4 4 4 10.69 4 1 3.5 0.5 2.25 24.56
a. For each element, the total is the sum for the relevant funds. For the subtotals category and the grand total, the figures are for the individual fund.
Note: Pension funds (P) and reserve pension funds (PR) shown in italics.
© Peterson Institute for International Economics | www.piie.com