ch. 6: monitoring cycles, jobs, and the price level the business cycle measures of labor market...
Post on 19-Dec-2015
216 views
TRANSCRIPT

Ch. 6: MONITORING CYCLES, JOBS, AND THE PRICE LEVEL
• The business cycle
• Measures of labor market activity
• Unemployment–Sources–Duration–Groups affected most
• Measuring the price level & inflation rate.

• Business cycle – periodic but irregular up-and-down movement in
production and jobs.
• NBER defines phases and turning points– Recession
• significant decline in activity spread across the economy,• lasts more than a few months• visible in industrial production, employment, real income, and
wholesale-retail trade. • begins just after the economy reaches a peak of activity• ends as the economy reaches its trough.
– Expansion occurs between trough and peak– Bus. Cycle dates: http://www.nber.org/cycles.html/
Jobs and Wages
• Current Population Survey– The U.S. Census Bureau conducts monthly
surveys to determine the status of the labor force in the United States.
– Approximately 60,000 households interviewed monthly.
– Four months in, eight months out, four months in.

Population
Working Age Population (over 16,
Noninstitutionalized)
Young, Institutionalized
Labor Force
Employed
Out of labor force
Unemployed
Jobs and Wages
• To be considered unemployed, a person must be:–without work and have made specific efforts to
find a job within the past four weeks, or–waiting to be called back to a job from which
he or she was laid off, or–waiting to start a new job within 30 days.
Jobs and Wages
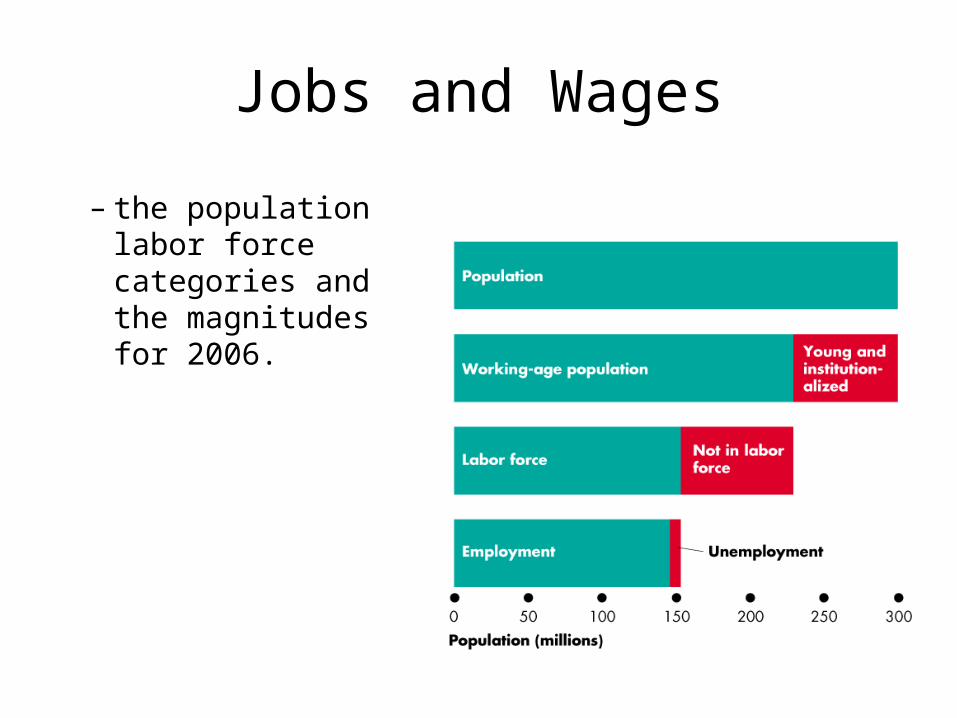
– the population labor force categories and the magnitudes for 2006.

Jobs and Wages
forcelabor
unemployedratentunemployme
populationageworking
employedratiopopulationemployment
#
populationageworking
forcelaborrateionparticipatforcelabor

Trends in Employment Measures

Cyclical behavior of employment statistics.
• Are each of the following, pro- or counter-cyclical? – Unemployment rate– LFPR
• Effect of discouraged workers
– Employment-population ratio

Trends in employment statistics
• The LFPR – increased from 59% in the 1960s to 67% in the
1990s.– for men has declined, but for women has
increased. – fell for older workers since the 1950s, but has
recently begun to rise.• The employment-population ratio
– increased from 55% in the early 1960s to 67% in 2000.
– declined for men and increased for women.

Jobs and Wages
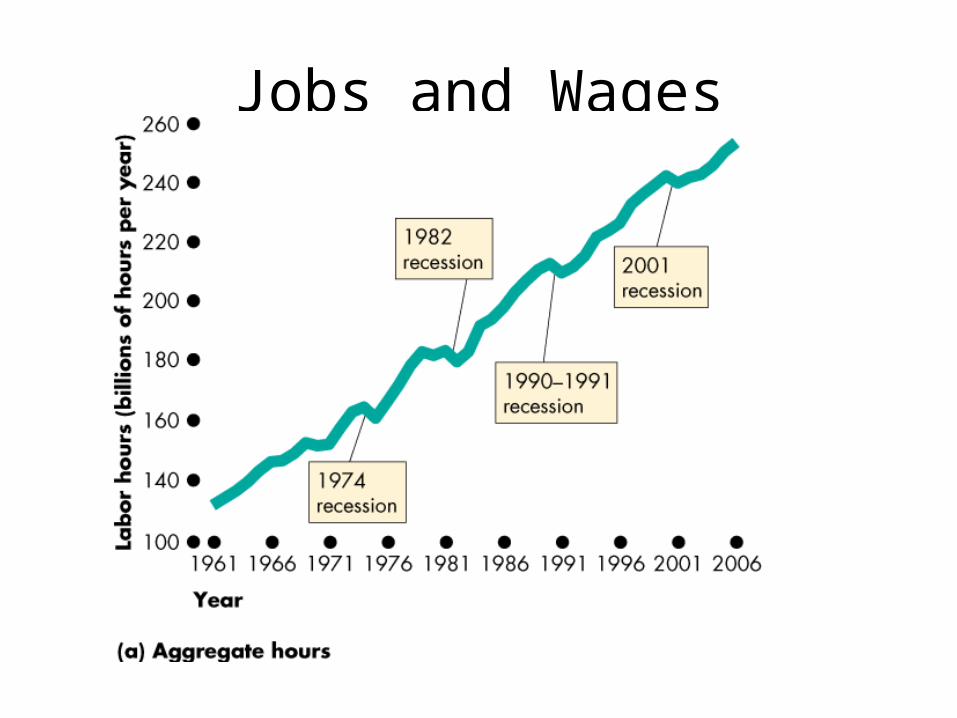
• Aggregate Hours– the total number of hours worked by all
workers during a year. – increased since 1960 but less rapidly than the
total number of workers because the average workweek has shortened.
Jobs and Wages
Jobs and Wages
• Real Wage Rate– the quantity of goods and services that can be
purchased with an hour’s work. – the money wage rate divided by the price level
(more later)
• Three measures– Hourly earnings in manufacturing– Total wages and salaries per hour– Total wages, salaries, & supplements per hour

Jobs and Wages
• Real Wage Rate– compensation in
2000 dollars per hour of work.
Unemployment and Full Employment
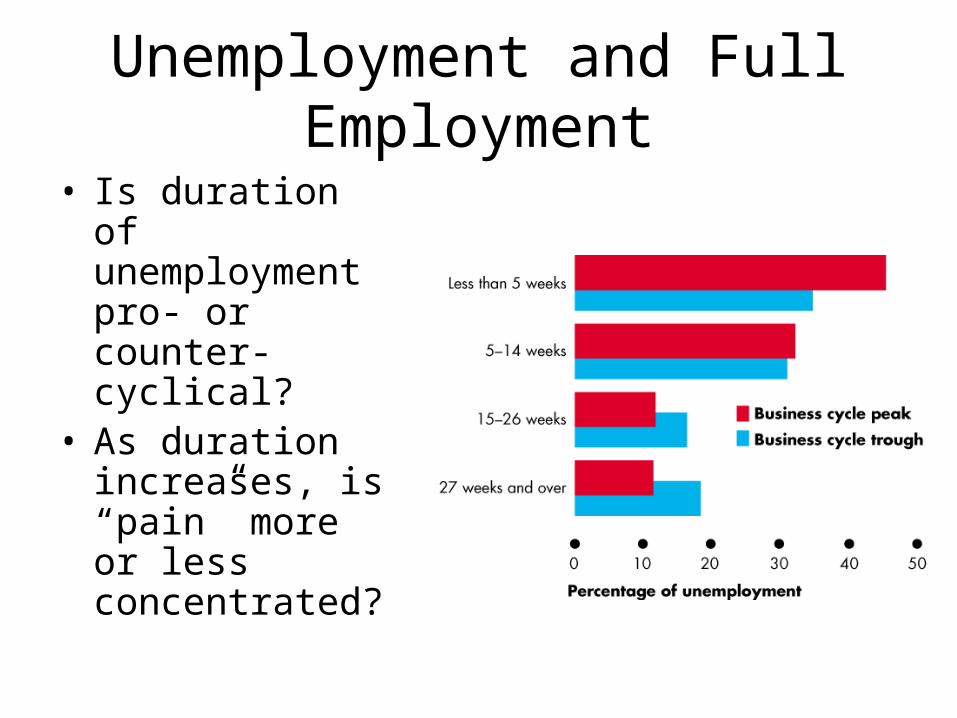
• Is duration of unemployment pro- or counter-cyclical?
• As duration increases, is “pain” more or less concentrated?

Unemployment and Full Employment
• Types of Unemployment– Frictional– Structural– Cyclical

Unemployment and Full Employment
• Full Employment– no cyclical unemployment – when all unemployment is frictional or structural.
• Natural rate of unemployment. – unemployment rate at full employment – estimated to have been around 6 percent on average
in U.S.– Higher in 1970s, lower in 1990s
• Baby boom• Women
• UI Generosity

Unemployment and Full Employment
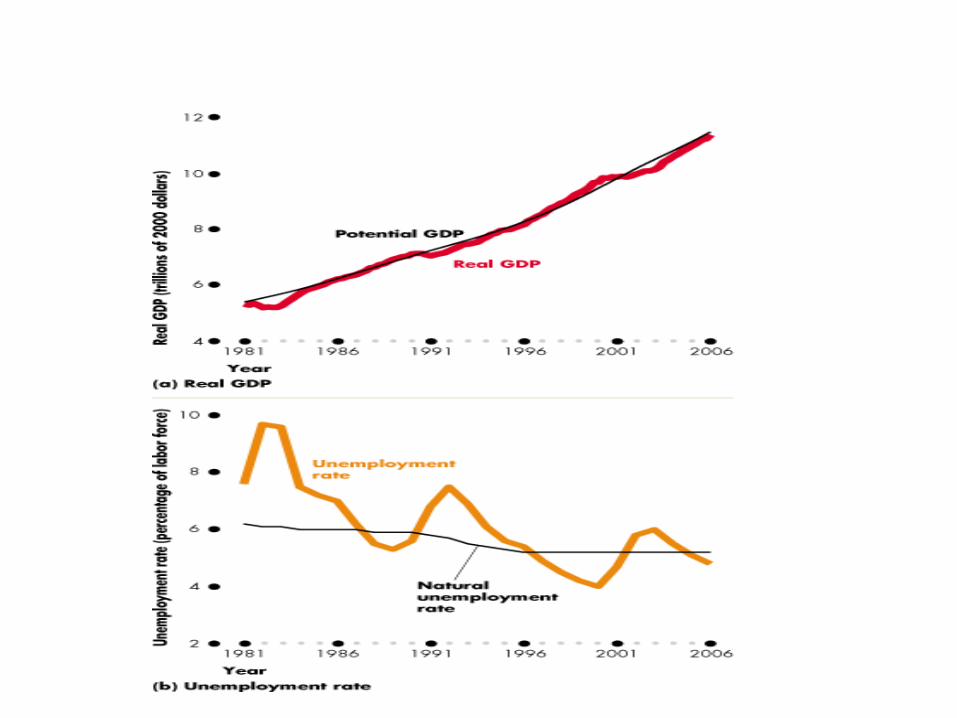
• Potential GDP – Quantity of real GDP produced at full
employment. – corresponds to the capacity of the economy to
produce output on a sustained basis; – Actual GDP fluctuates around potential GDP
with the business cycle. – If unemployment is below natural rate, will
actual GDP be above or below potential?
The Consumer Price Index
– The price level is the “average” level of prices and is measured by using a price index.
– CPI measures the average level of the prices of goods and services consumed by an urban family.
– The GDP deflator is another price index, reflecting the average price of all goods and services produced.
The Consumer Price Index
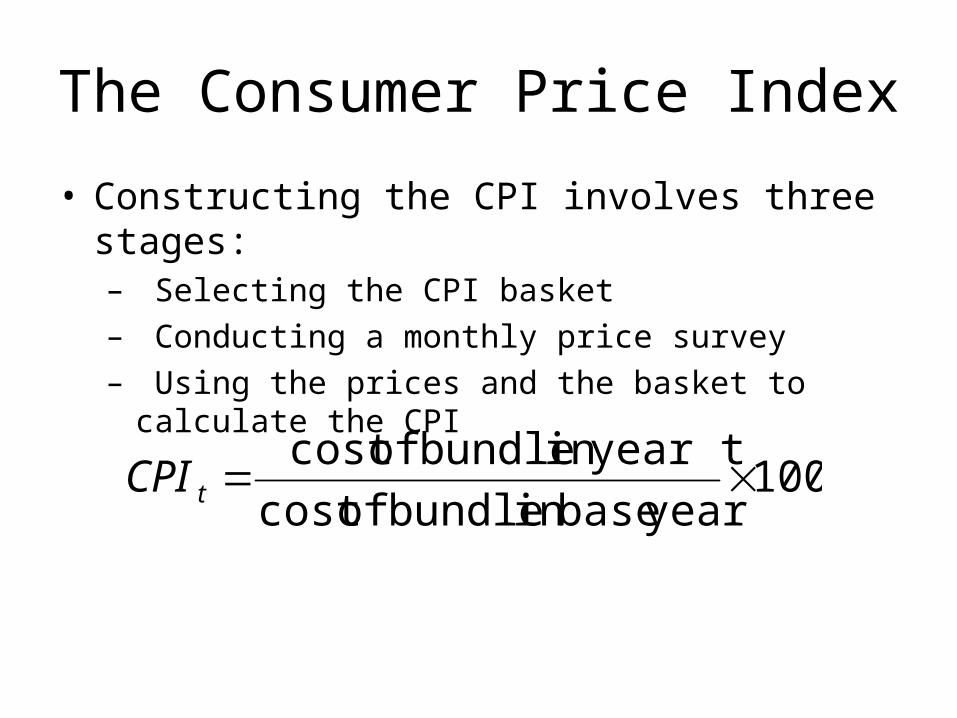
• Constructing the CPI involves three stages:– Selecting the CPI basket– Conducting a monthly price survey– Using the prices and the basket to calculate the CPI
100year basein bundle ofcost
year tin bundle ofcost tCPI

The Consumer Price Index
– The CPI basket.

The Consumer Price Index
– The CPI basket is based on a Consumer Expenditure Survey.
– The current CPI based on a 1993-95 survey, although the reference base period is still 1982-84.
– Every month, BLS employees check the prices of 80,000 goods and services in 30 metropolitan areas.
– The CPI is calculated using the prices and the contents of the basket.
The Consumer Price Index
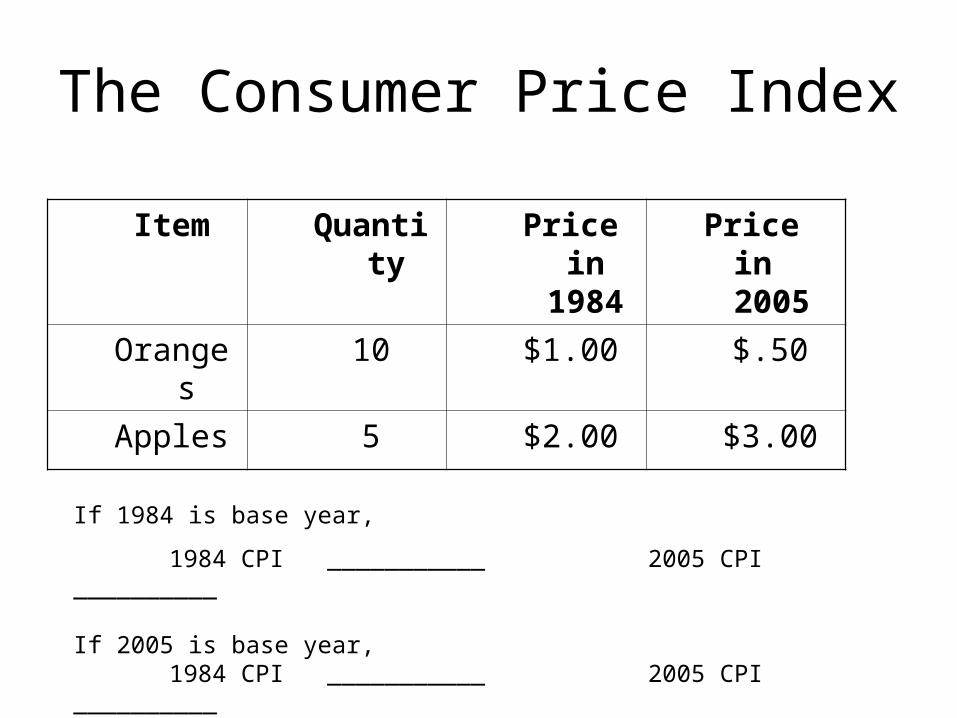
Item Quantity Price in 1984
Price in 2005
Oranges 10 $1.00 $.50
Apples 5 $2.00 $3.00
If 1984 is base year,
1984 CPI ___________ 2005 CPI __________
If 2005 is base year, 1984 CPI ___________ 2005 CPI __________
The Consumer Price Index
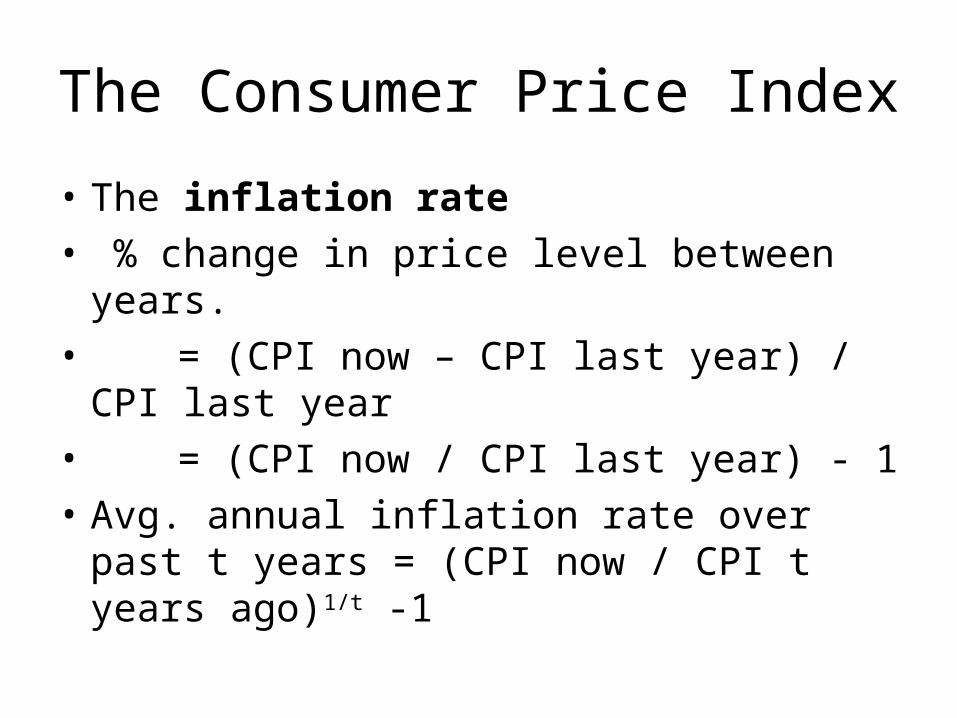
• The inflation rate
• % change in price level between years.
• = (CPI now – CPI last year) / CPI last year
• = (CPI now / CPI last year) - 1
• Avg. annual inflation rate over past t years = (CPI now / CPI t years ago)1/t -1

Adjusting for changes in price level
100Index Price
Value Nominal Value Real
t
tt
•In base year, how do nominal and real wages compare?
•Suppose that between 2005 and 2006 nominal wages rise from $10 to $11 and the CPI rises from 140 to 150
•What was the inflation rate?
•Growth in nominal wages?
•Growth in real wages?

Inflation Questions
Using BLS data on average prices, answer the following
• Inflation rate between 2004 and 2005.
• Average annual rate of inflation between 1990 and 2005.
• If a person earned $10 per hour in 1990, how much would they have to earn in 2005 to have the same real wage?
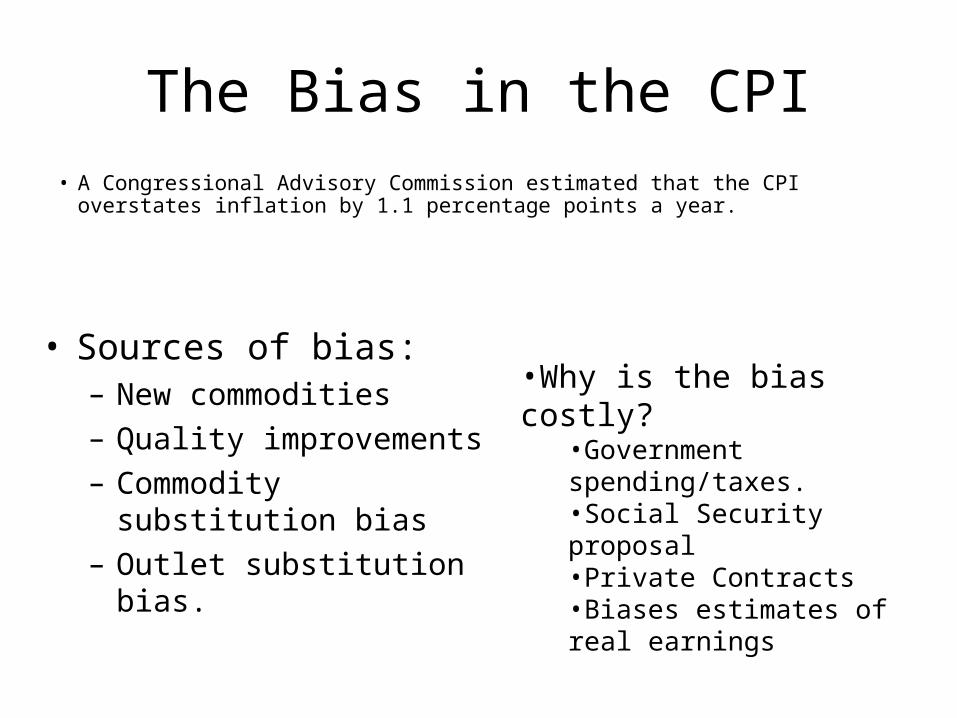
The Bias in the CPI• A Congressional Advisory Commission estimated that the CPI overstates inflation
by 1.1 percentage points a year.
• Sources of bias:– New commodities– Quality improvements– Commodity substitution
bias– Outlet substitution bias.
•Why is the bias costly?•Government spending/taxes.•Social Security proposal•Private Contracts•Biases estimates of real earnings