ch. 8 1. know what design frequency means know how to delineate a drainage area on a topographic...
TRANSCRIPT

1
Highway Drainage-Hydrology
Ch. 8
2
Know what design frequency means
Know how to delineate a drainage area on a topographic map
Objectives

3
Bridges: >=20 feet in span Small Drainage Structures < 20 ft
Small Drainage Structures

4
Cross drainage structures
Roadside Surface Drainage System:GuttersDitchesClosed roadway system
Roadside Surface Drainage System

5
The highway from rainfall and runoff
Adjacent land from discharge of artificially collected and concentrated flow from highway channels
Floodplains
Water quality and natural resources
Legal Aspects-Protect:

6
Keep existing drainage patterns (don’t divert)
Return drainage patterns to existing conditions
Establish natural patterns w/in ROW Take d/s PE’s to the pt where velocities
have returned to their natural state Take u/s PE’s to provide storage for
headwater Improve d/s structures or create u/s storage
areas Improve existing structures which become
inadequate by loss of u/s storage areas
Guidance for draining surface waters:
7
Wetlands Wild, Scenic & Recreational Rivers Coastal Zone Floodplains Water quality Endangered Species Fish & Wildlife
State & Fed Laws/Regs
8
Determine the maximum (peak) runoff volume (in cfs) for a given design frequency
------hydrology Size structure to carry the design flow ------hydraulics
Drainage design

9
HydrologyOccurrence, distribution, and movement of
water
10
Probability that a design storm will occur
◦ Q10 would occur theoretically once every 10 years (each year there would be a 10% probability that a storm will exceed the Q10 flow).
◦ Q50 would occur theoretically once every 50 years (each year there would be a 2% probability that a storm will exceed the Q50 flow).
Design Storm
11
Not economically feasible to design for all floods for every structure for any type of road
Design Frequencies
12
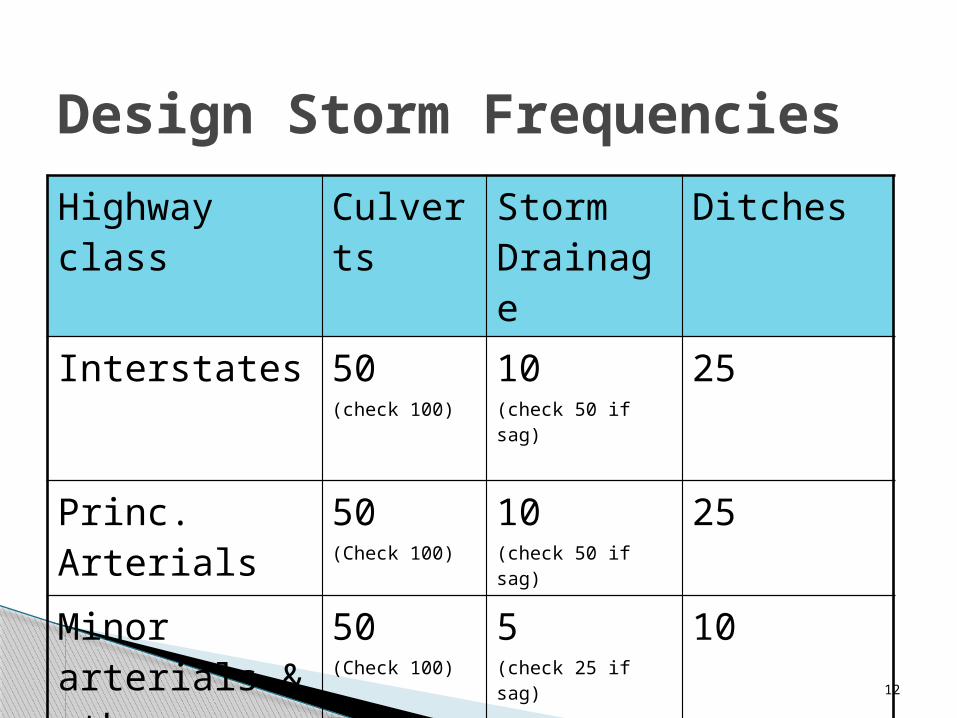
Design Storm Frequencies
Highway class
Culverts
Storm Drainage
Ditches
Interstates 50(check 100)
10(check 50 if sag)
25
Princ. Arterials
50(Check 100)
10(check 50 if sag)
25
Minor arterials & other
50(Check 100)
5(check 25 if sag)
10

13
Construction on new Reconstruction on
existing
3R
Maintenance
Culvert replacement or relining
Complete analysis Analysis for structures
w/ flooding history or service life < design life
Analysis for structures w/ flooding history or in need of replacement
None needed
Complete analysis
Type of Project vs Extent of Analysis

14
1. Preliminary Research
2. Field trip
3. Determine Peak Flows
Hydrologic Analysis

15
Obtain topo maps Determine soils Obtain flood insurance data Obtain existing data Obtain aerial photos Check field reconnaissance notes,
historical records, record plans Calculate preliminary flow rates
1. Preliminary Research

16
a. Drainage patterns and areasb. Land Usec. Soil Typesd. Existing & previous floodse. Location of detention structures
2. Initial Field Trip
17
Check that patterns coincide w/ what you have determined preliminarily
a. Drainage Patterns

18
Wooded, Crops, Pasture Urban, Suburban or Rural Undeveloped or Developed If developed (% paved or roof area, %
grass) Potential for future development
b. Land Use
19
Confirm soil types Any soils subject to erosion? Any channel banks that may need to be
protected? Rocks, clays, silts, wetlands, fragipan?
c. Soils

20
Determine HWE Interview locals Check for deposition & scour Check debris – velocity Regional DEC office
d. Flood conditions
21
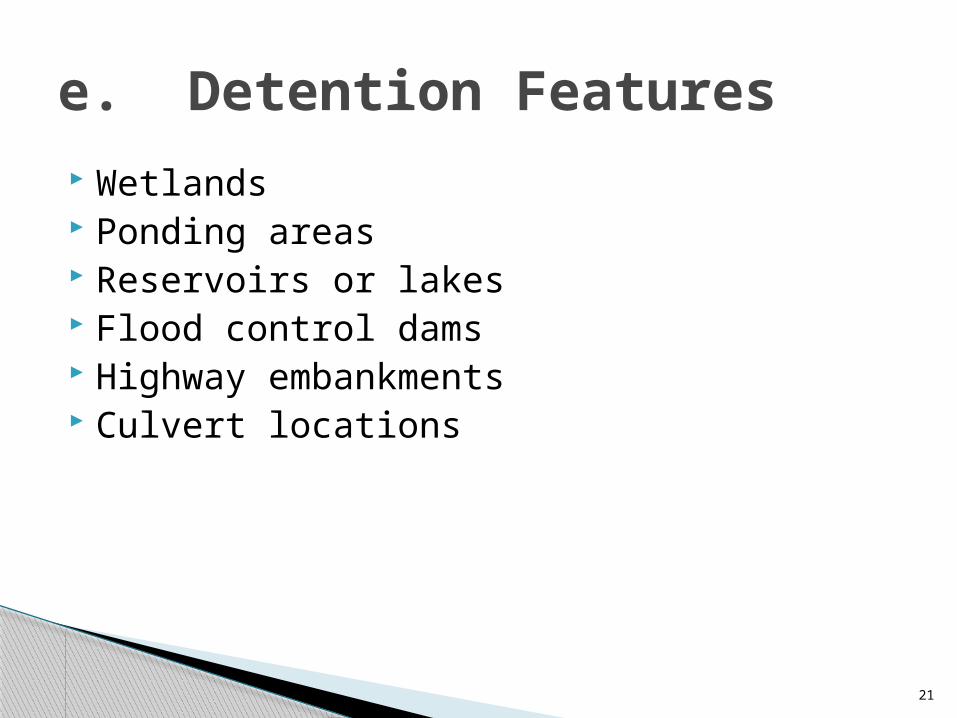
Wetlands Ponding areas Reservoirs or lakes Flood control dams Highway embankments Culvert locations
e. Detention Features
22
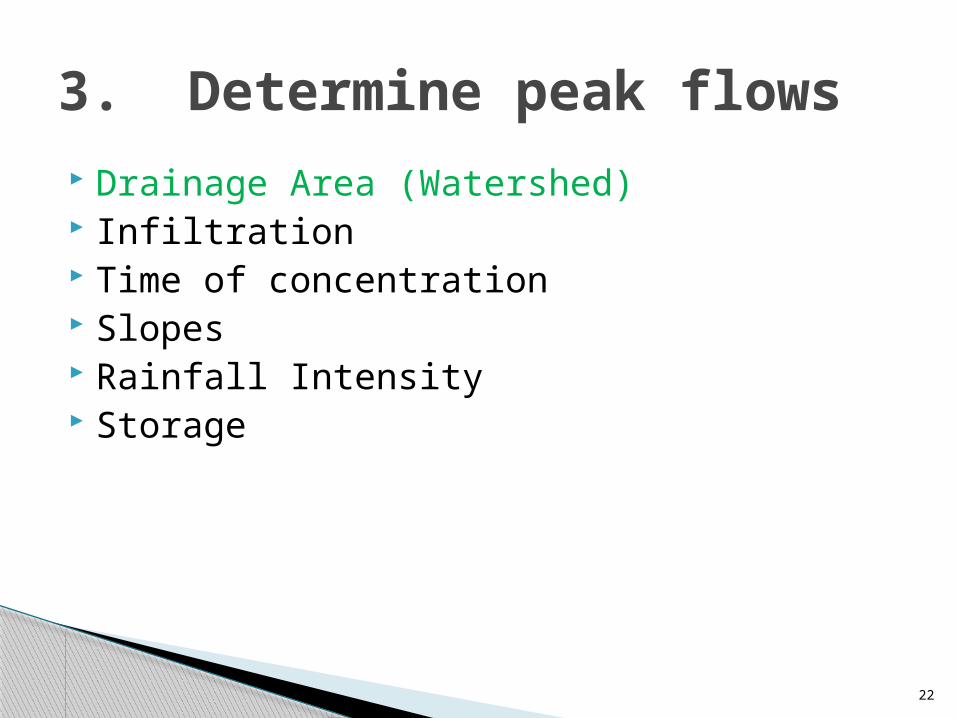
Drainage Area (Watershed) Infiltration Time of concentration Slopes Rainfall Intensity Storage
3. Determine peak flows

When water runs off your property where does it go?
23
We All Live in a Watershed

Any particular point on a water channel (stream, ditch, gutter, etc.) has an associated watershed area
The boundaries of a watershed are ridge lines (high points)
You can identify ridge lines by contour lines on topographic maps
24
Watershed

Pollutants can enter waterbodies
◦ Silt from construction sites, farms, erosion ◦ Septic system waste◦ Fertilizers, pesticides◦ Road salt◦ Other pollutants (industry/commercial)
25
Importance of Watersheds

SPDES (stormwater pollution discharge and elimination system)
Watershed action plans
Public Involvement (stewardship)
26
Watershed Protection

27
Contour Maps-Lines showing constant elevation

28
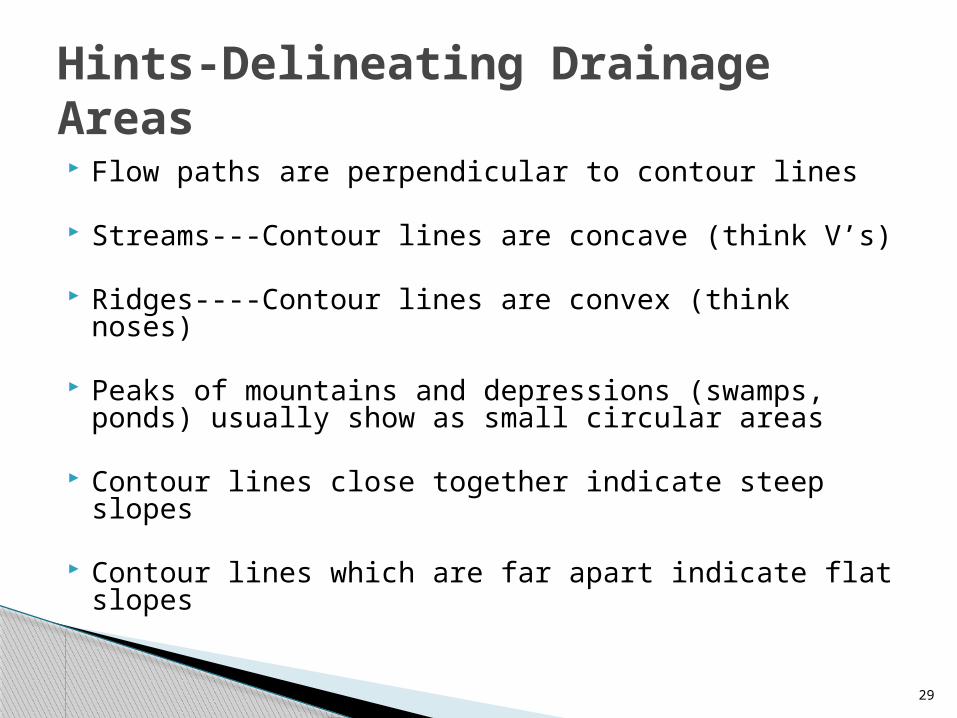
Flow paths are perpendicular to contour lines
Streams---Contour lines are concave (think V’s)
Ridges----Contour lines are convex (think noses)
Peaks of mountains and depressions (swamps, ponds) usually show as small circular areas
Contour lines close together indicate steep slopes
Contour lines which are far apart indicate flat slopes
29
Hints-Delineating Drainage Areas
30

31
32
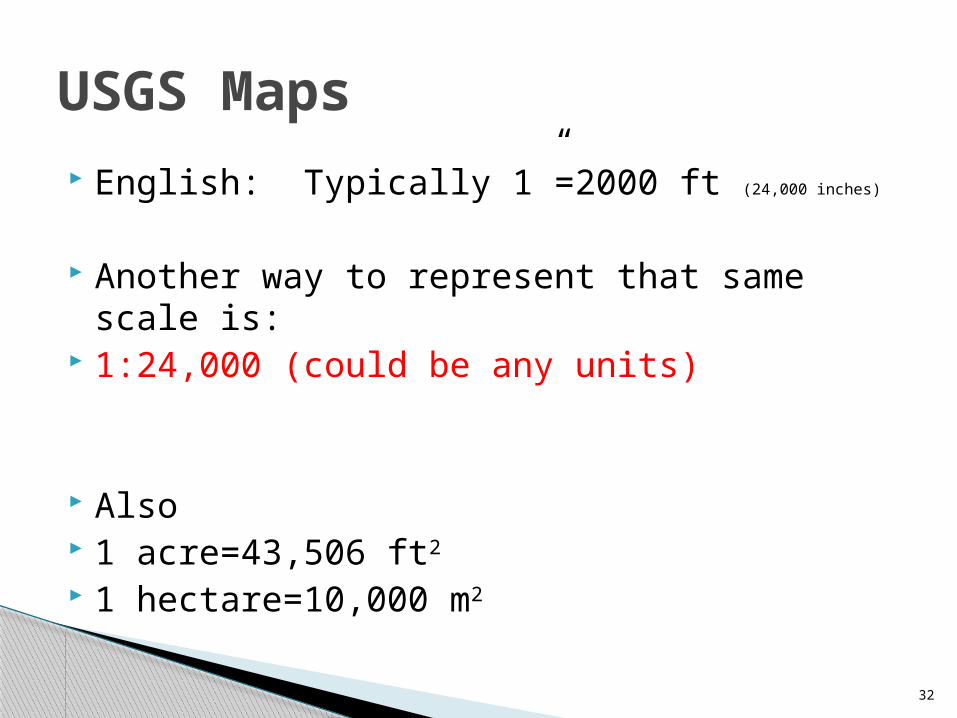
English: Typically 1”=2000 ft (24,000 inches)
Another way to represent that same scale is:
1:24,000 (could be any units)
Also 1 acre=43,506 ft2
1 hectare=10,000 m2
USGS Maps
33
Measuring Drainage Areas Stripping Method Grid Method Planimeter Software Programs (GIS)

Stripping/Grid Methods
34http://www.globalsecurity.org/military/library/policy/army/fm/5-430-00-1/fig6-13.gif

Planimeter
35

Software
36
http://gis.esri.com/library/userconf/proc99/proceed/papers/pap676/p6764.gif

Dowloading USGS Maps *.pdf
http://store.usgs.gov/b2c_usgs/b2c/start.do
37
Other Sources http://www.nh.nrcs.usda.gov/technical/WS_delineation.html http://www.epa.gov/owow/watershed/ http://www.dec.ny.gov/lands/25563.html
38