ch02 mendelism- the basic principles of inheritance
TRANSCRIPT
Basic Genetics (SQBS 2753)
Mendelian InheritanceMendelian Inheritance
Azman Abd Samad
1
Mendel and The Laws Of InheritanceMendel and The Laws Of Inheritance
• Gregor Johann Mendel (1822-1884) -Gregor Johann Mendel (1822 1884) father of genetics
• Austrian monk• Austrian monk• Conducted landmark studies from 1856-
1864 th d f1864, - thousands of crosses• Kept meticulously accurate records that
included quantitative analysis
Mendel Chose Pea Plants as His E i t l O iExperimental Organism
• HybridizationHybridization– The mating or crossing between two individuals that
have different characteristics• Tall plant X dwarf plant
• HybridsTh ff i th t lt f h ti– The offspring that result from such a mating
– Presumed to be a blending of the parent traitsOften observed to be different than either parent– Often observed to be different than either parent (hybrid vigor)
• Mendel observed them to be like one of the parents with respect to some traits – no blending
Mendel studied the inheritance of lt ti t it i l talternative traits in pea plants
• Mendel inferred laws of genetics thatMendel inferred laws of genetics that allowed predictions about which traits would appear disappear and thenwould appear, disappear, and then reappear
This work was done in his garden at a– This work was done in his garden at a monastery
• Mendel's paper "Experiments in plant• Mendel s paper Experiments in plant hybrids" was published in 1866 and became the cornerstone of modernbecame the cornerstone of modern genetics
4
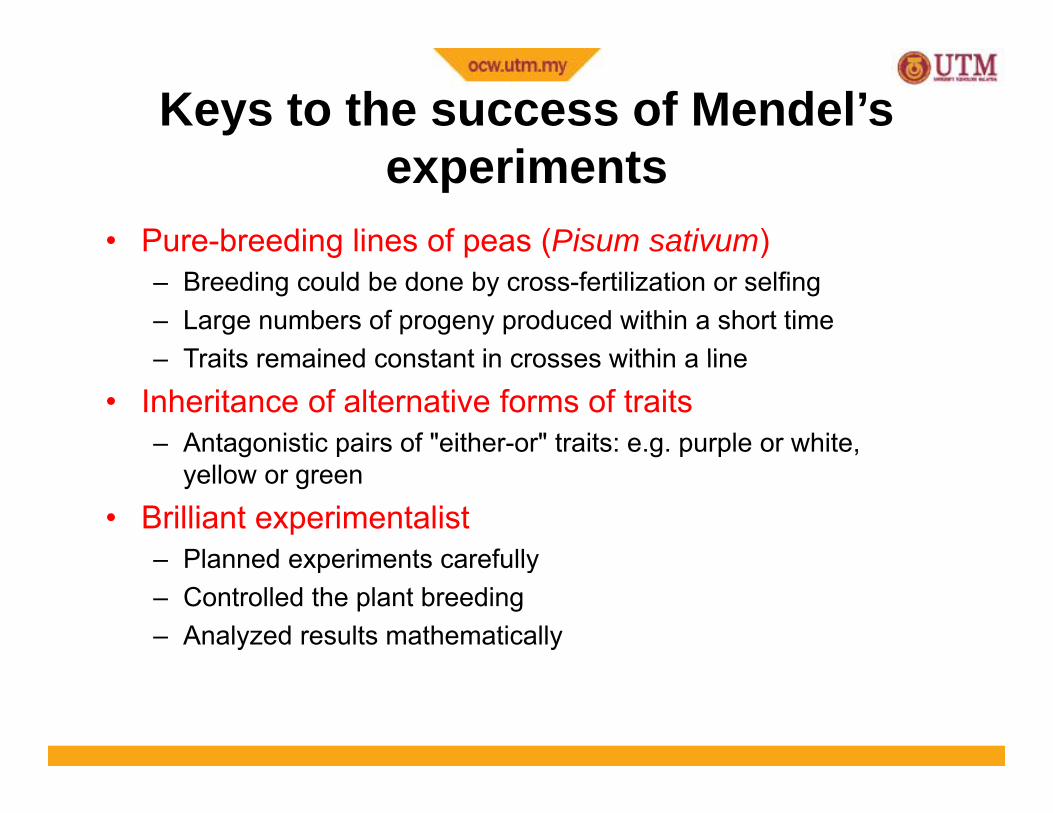
Keys to the success of Mendel’s i texperiments
• Pure-breeding lines of peas (Pisum sativum)g p ( )– Breeding could be done by cross-fertilization or selfing– Large numbers of progeny produced within a short time
Traits remained constant in crosses within a line– Traits remained constant in crosses within a line
• Inheritance of alternative forms of traits– Antagonistic pairs of "either-or" traits: e.g. purple or white,
yellow or green
• Brilliant experimentalist– Planned experiments carefully– Planned experiments carefully– Controlled the plant breeding– Analyzed results mathematically
Mendel Studied Seven Traits That B d TBred True
• The morphological characteristics of anThe morphological characteristics of an organism are termed characters or traits
• A variety that produces the same trait over• A variety that produces the same trait over and over again is termed a true-breeder
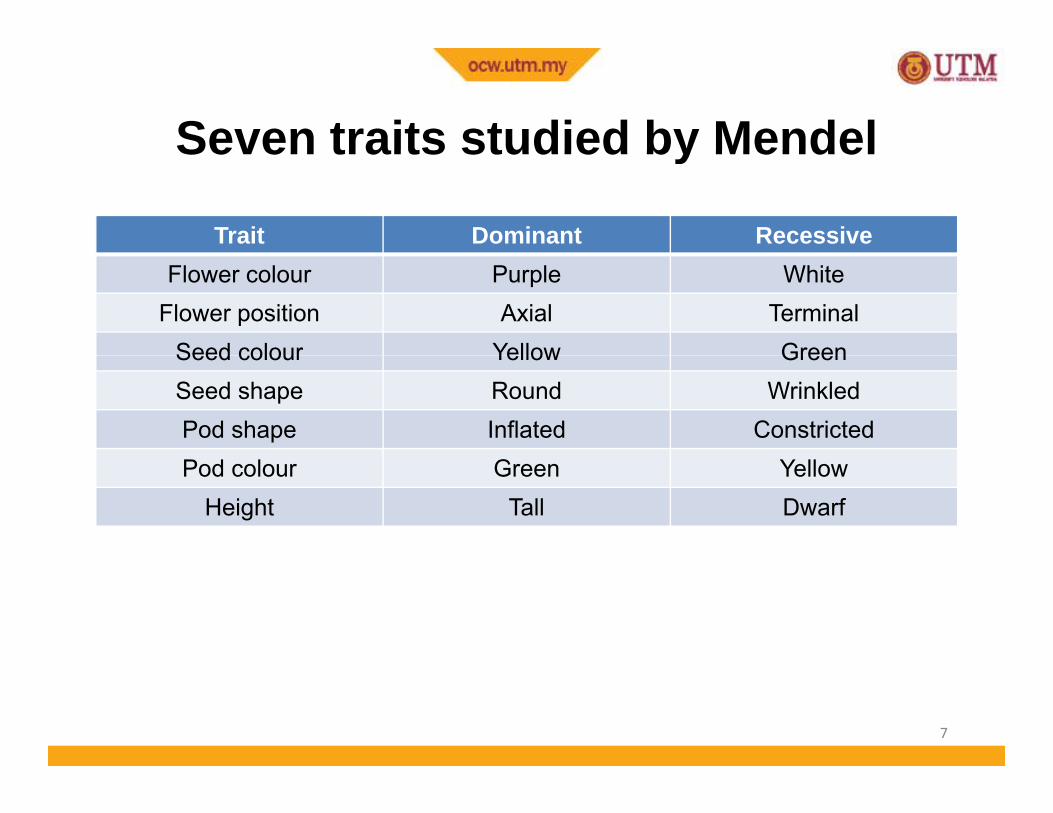
Seven traits studied by MendelSeven traits studied by Mendel
Trait Dominant RecessiveFlower colour Purple White
Flower position Axial TerminalSeed colour Yellow GreenSeed colour Yellow GreenSeed shape Round WrinkledPod shape Inflated ConstrictedPod colour Green Yellow
Height Tall Dwarf
7
MONOHYBRID CROSSESMONOHYBRID CROSSES
The Principles of Dominance and Segregation
8
Mendel’s Experimentsp
• Crossed two variants differing in only one traittrait– a monohybrid cross
9
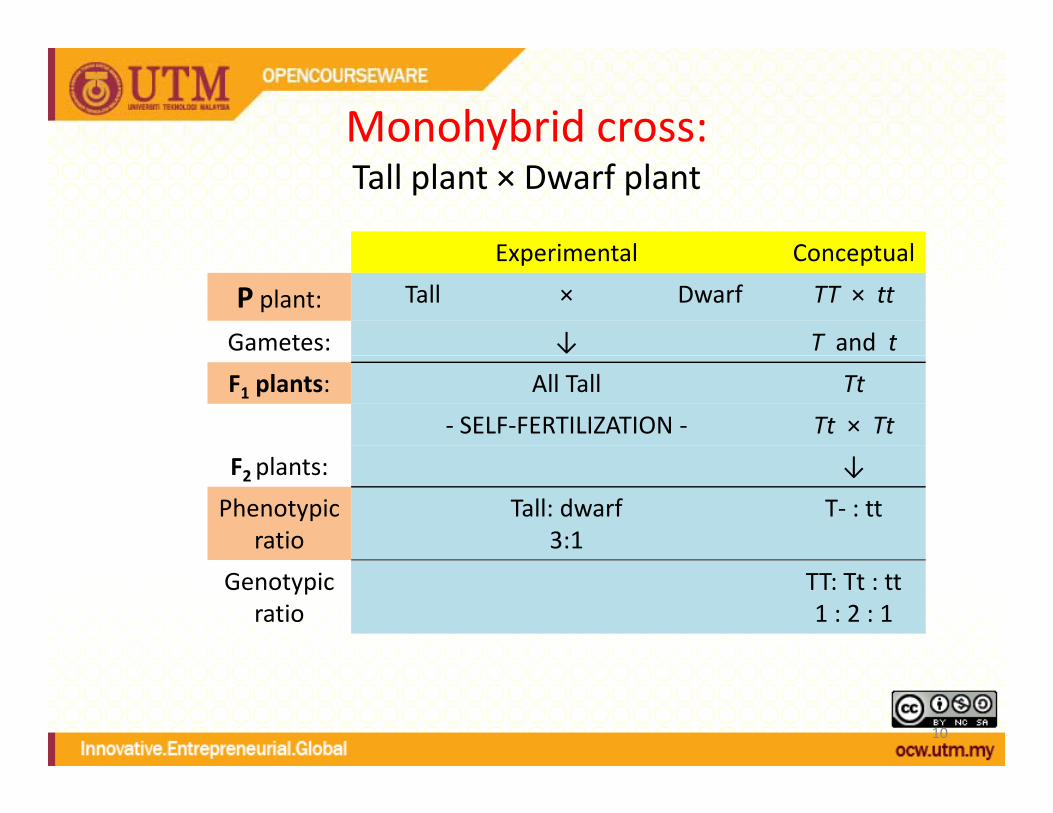
Monohybrid cross: Tall plant × Dwarf plant
Experimental ConceptualExperimental Conceptual
P plant: Tall × Dwarf TT × tt
Gametes: ↓ T and t
F1 plants: All Tall Tt
‐ SELF‐FERTILIZATION ‐ Tt × Tt
l ↓F2plants: ↓
Phenotypic ratio
Tall: dwarf3:1
T‐ : tt
Genotypic ratio
TT: Tt : tt1 : 2 : 1
10
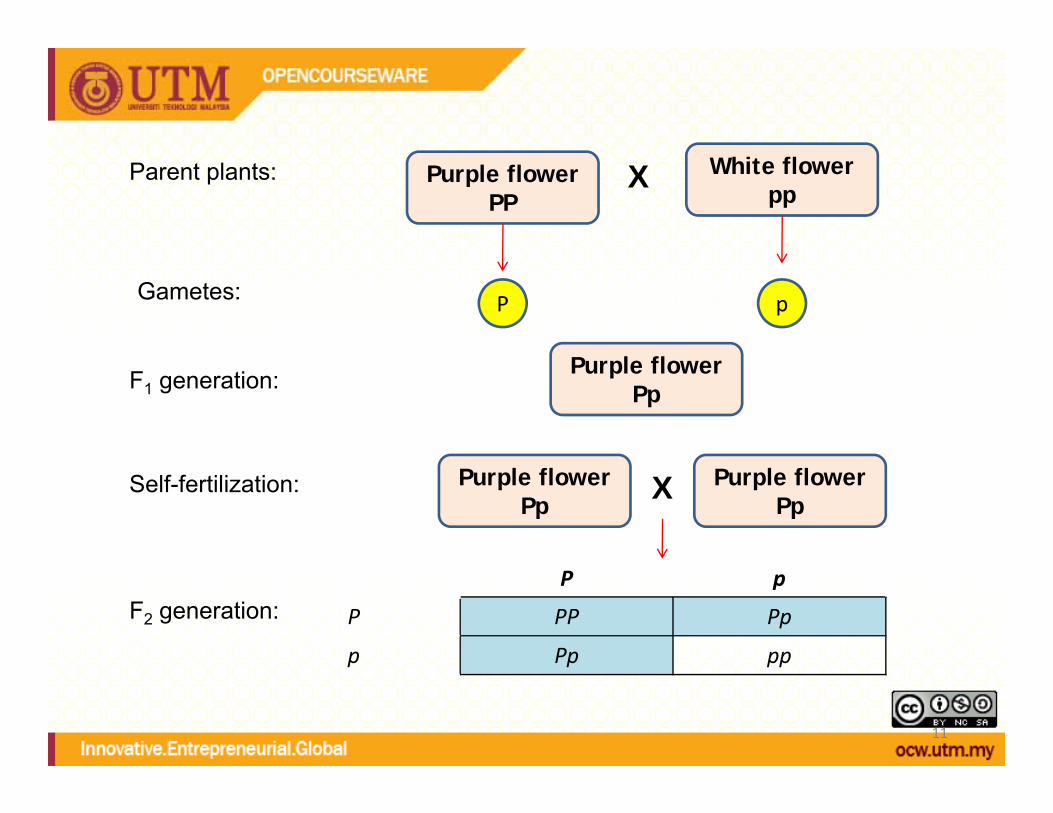
White flowerpp
Purple flowerPP
Parent plants: X
P pGametes:
Purple flowerPpF1 generation:
Purple flowerPp
Purple flowerPp
XSelf-fertilization:
P p
P PP Pp
p Pp pp
F2 generation:
11
p p pp
P C F R ti
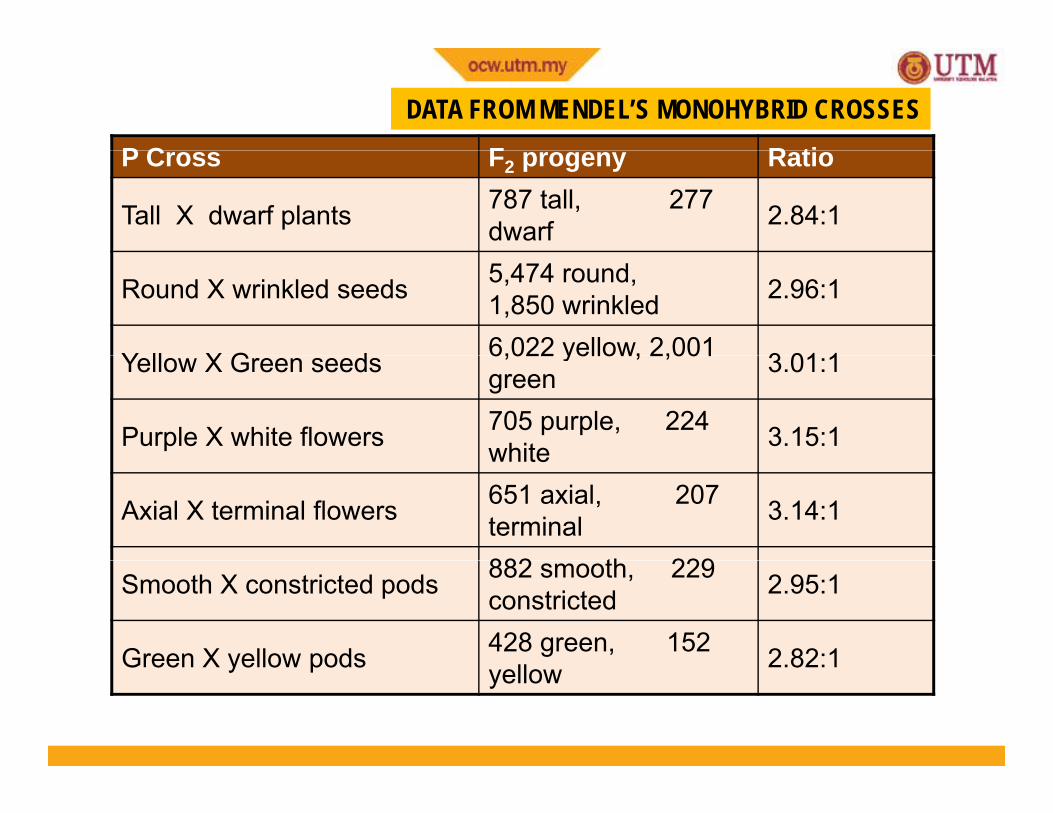
DATA FROM MENDEL’S MONOHYBRID CROSSES
P Cross F2 progeny Ratio
Tall X dwarf plants 787 tall, 277 dwarf 2.84:1
Round X wrinkled seeds 5,474 round, 1,850 wrinkled 2.96:1
Y ll X G d 6,022 yellow, 2,001 3 01 1Yellow X Green seeds 6,022 yellow, 2,001 green 3.01:1
Purple X white flowers 705 purple, 224 white 3.15:1white
Axial X terminal flowers 651 axial, 207 terminal 3.14:1
882 th 229Smooth X constricted pods 882 smooth, 229 constricted 2.95:1
Green X yellow pods 428 green, 152 2 82:1Green X yellow pods yellow 2.82:1
12
Interpreting the DataInterpreting the Data
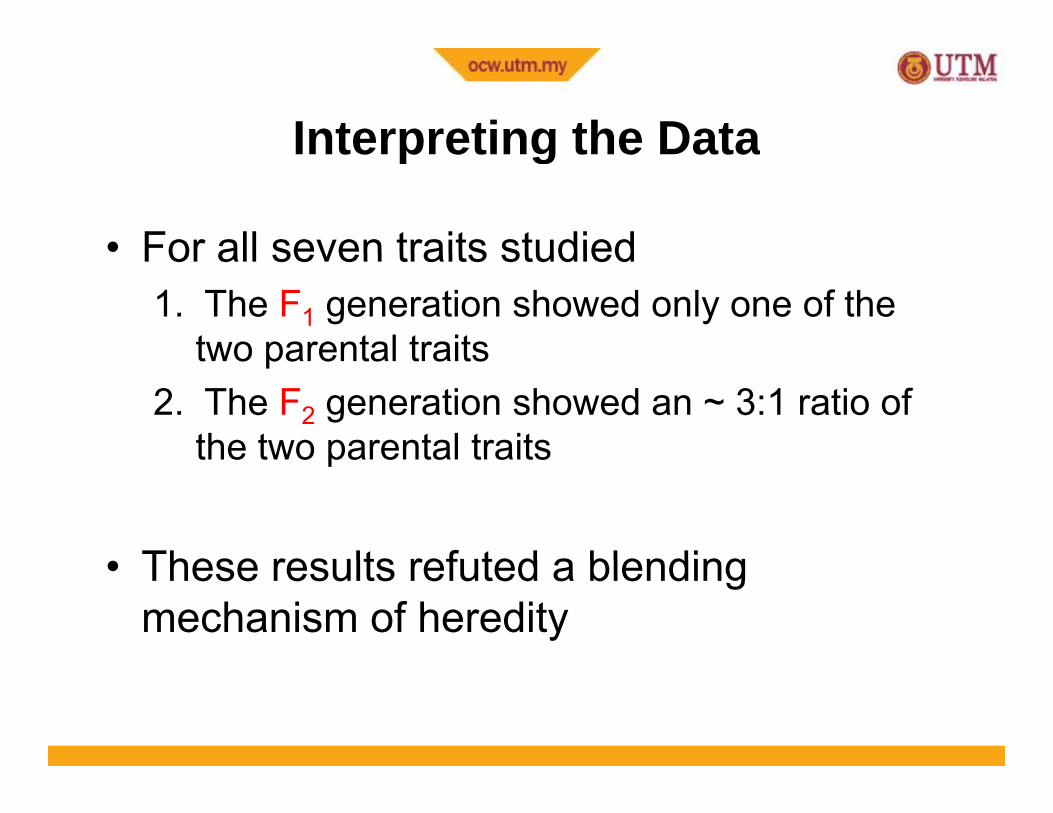
• For all seven traits studiedFor all seven traits studied 1. The F1 generation showed only one of the
two parental traitstwo parental traits 2. The F2 generation showed an ~ 3:1 ratio of
the two parental traitsthe two parental traits
These results refuted a blending• These results refuted a blending mechanism of heredity
SummarySummary
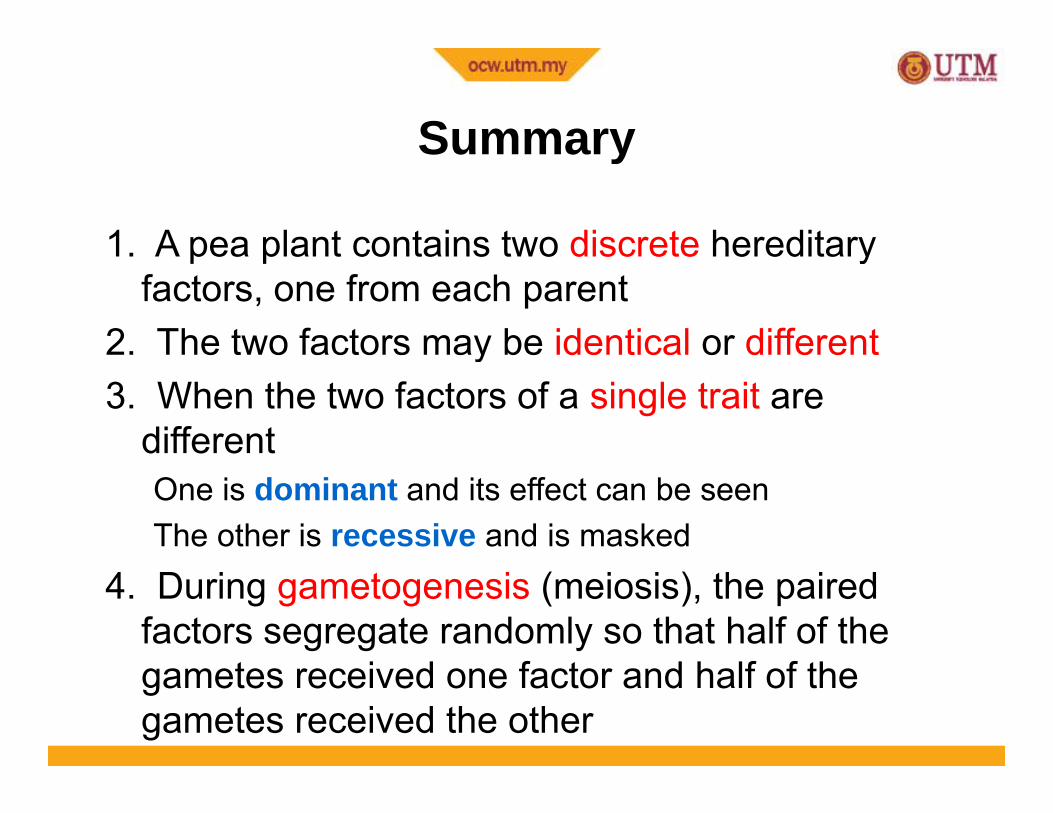
1. A pea plant contains two discrete hereditary1. A pea plant contains two discrete hereditary factors, one from each parent
2. The two factors may be identical or differenty3. When the two factors of a single trait are
differentOne is dominant and its effect can be seenThe other is recessive and is masked
4. During gametogenesis (meiosis), the paired factors segregate randomly so that half of the
t i d f t d h lf f thgametes received one factor and half of the gametes received the other
The Principle of DominanceThe Principle of Dominance
• In a heterozygote one allele may concealIn a heterozygote, one allele may conceal the presence of another
15
The Principle of SegregationThe Principle of Segregation
• In a heterozygote two different allelesIn a heterozygote, two different alleles segregate from each other during the formation of gametesformation of gametes
16
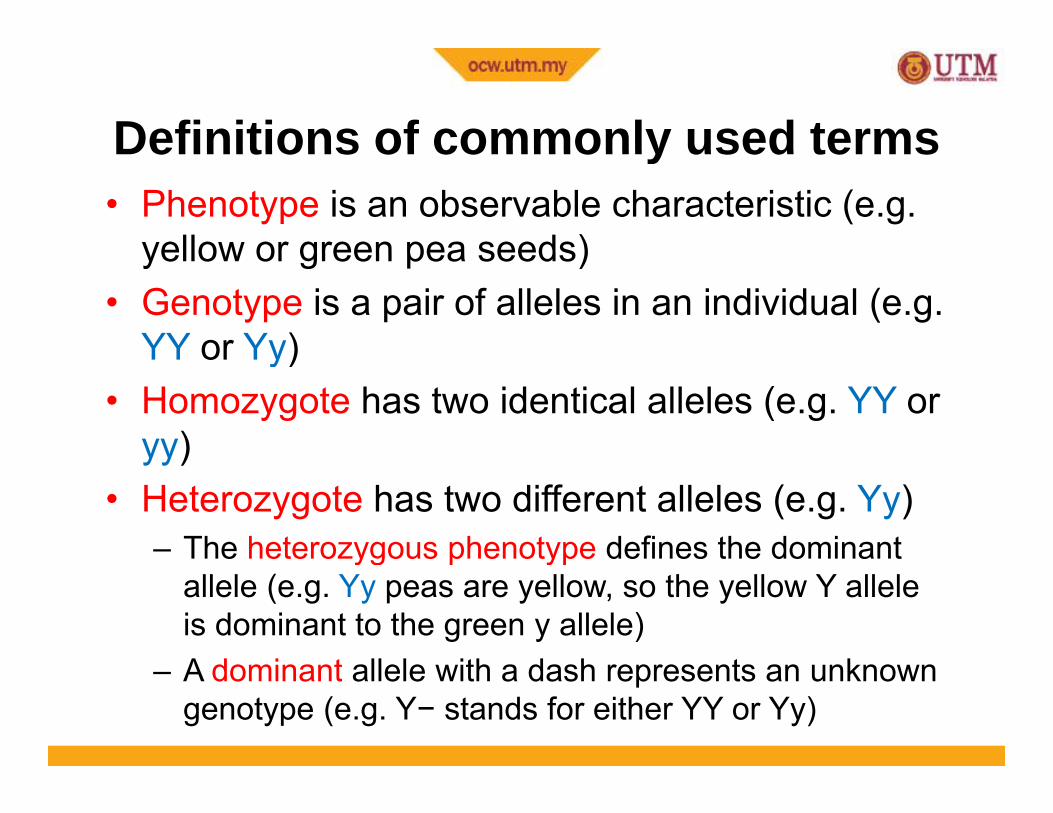
Definitions of commonly used termsDefinitions of commonly used terms• Phenotype is an observable characteristic (e.g.
yellow or green pea seeds)yellow or green pea seeds)• Genotype is a pair of alleles in an individual (e.g.
YY or Yy)YY or Yy)• Homozygote has two identical alleles (e.g. YY or
yy)yy)• Heterozygote has two different alleles (e.g. Yy)
– The heterozygous phenotype defines the dominant yg p ypallele (e.g. Yy peas are yellow, so the yellow Y allele is dominant to the green y allele)A d i t ll l ith d h t k– A dominant allele with a dash represents an unknown genotype (e.g. Y− stands for either YY or Yy)
Back CrossBack Cross
• The F1 progeny are mated back to oneThe F1 progeny are mated back to one of their parents (or to individuals with a genotype identical to parents)genotype identical to parents).
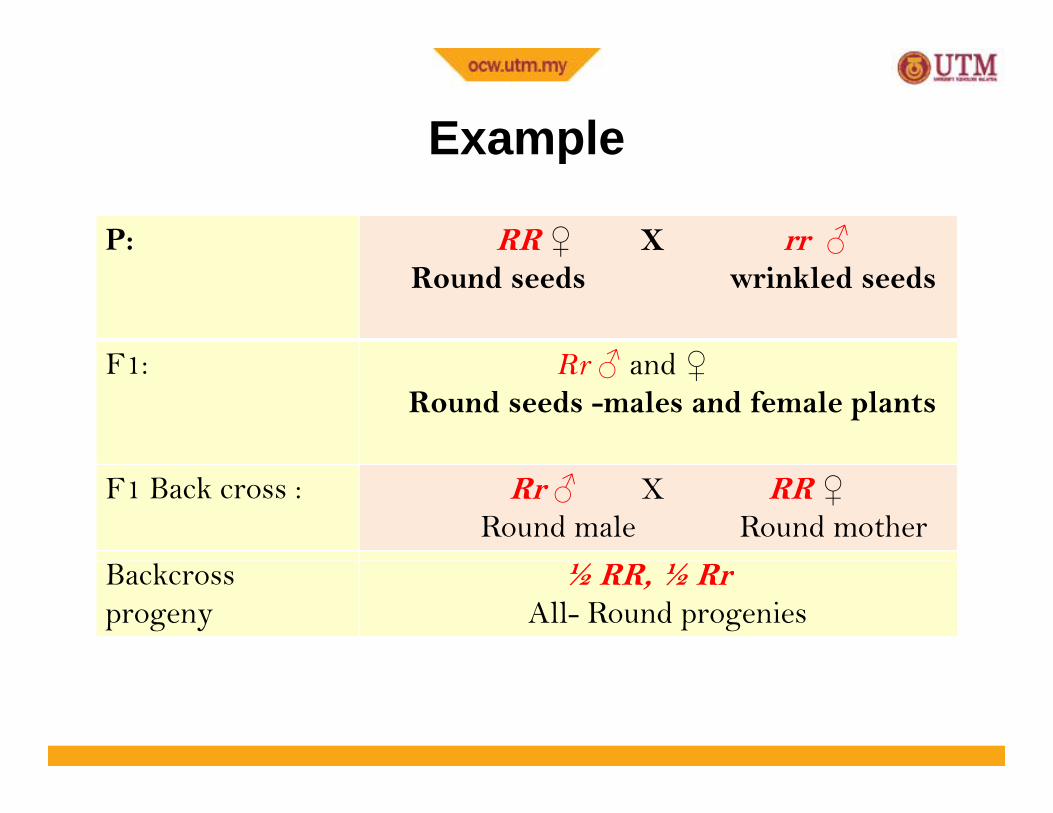
ExampleExample
P: RR ♀ X rr ♂♀ ♂Round seeds wrinkled seeds
F R ♂ d ♀F1: Rr ♂ and ♀Round seeds -males and female plants
F1 Back cross : Rr ♂ X RR ♀Round male Round mother
Backcross progeny
½ RR, ½ RrAll- Round progenies
TestcrossTestcross
a cross to determine between aa cross to determine between ahomozygous dominant genotype andheterozygous genotype which has theheterozygous genotype which has thesame phenotype parent is alwayshomozygous recessive for all the geneshomozygous recessive for all the genes
20
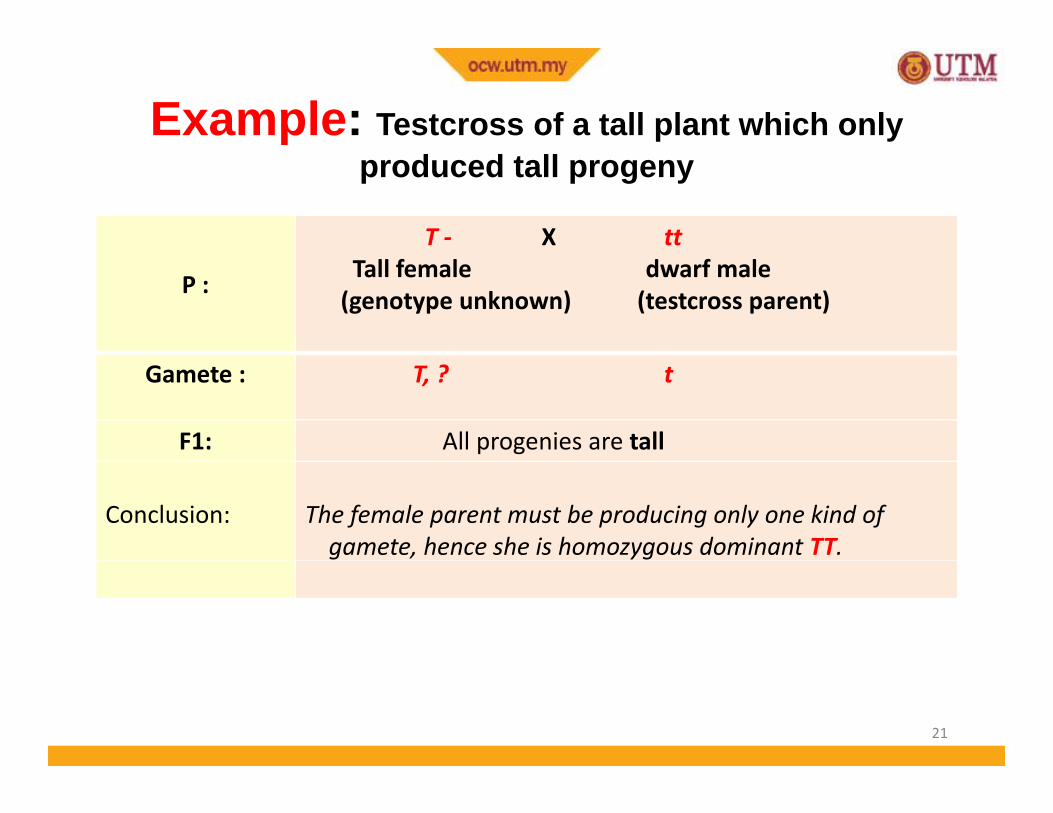
Example: Testcross of a tall plant which only produced tall progeny
T ‐ X tt
P :Tall female dwarf male(genotype unknown) (testcross parent)
Gamete : T, ? t
F1: All progenies are tall
Conclusion: The female parent must be producing only one kind of gamete, hence she is homozygous dominant TT.
21
DIHYBRID CROSSESDIHYBRID CROSSES
The Principle of Independent Assortment
22
Mendel’s Experimentsp
• Mendel also performed dihybrid crosses– Crossing individual plants that differ in two traitsg p
• For example– Trait 1 = Seed texture (round vs wrinkled)Trait 1 Seed texture (round vs. wrinkled)– Trait 2 = Seed color (yellow vs. green)
• There are two possible patterns of inheritance• There are two possible patterns of inheritance for these traits

Dihybrid cross: Yellow, Round × Green Wrinkled Seeds
Experimental ConceptualExperimental Conceptual
P plant: Yellow, Round × Green, Wrinkled
YYRR × yyrr
Gametes: ↓ YR and yr
F1 plants: All yellow and round seeds YyRr
‐ SELF‐FERTILIZATION ‐ YyRr × YyRrSELF FERTILIZATION YyRr YyRr
F2plants: ↓
Phenotypic ti
9 Yellow, round 3 Y ll i kl d
Y – R –Yratio 3 Yellow, wrinkled
3 Green, round1 Green, wrinkled
Y – rryyR –yyrr
24
Male gametes
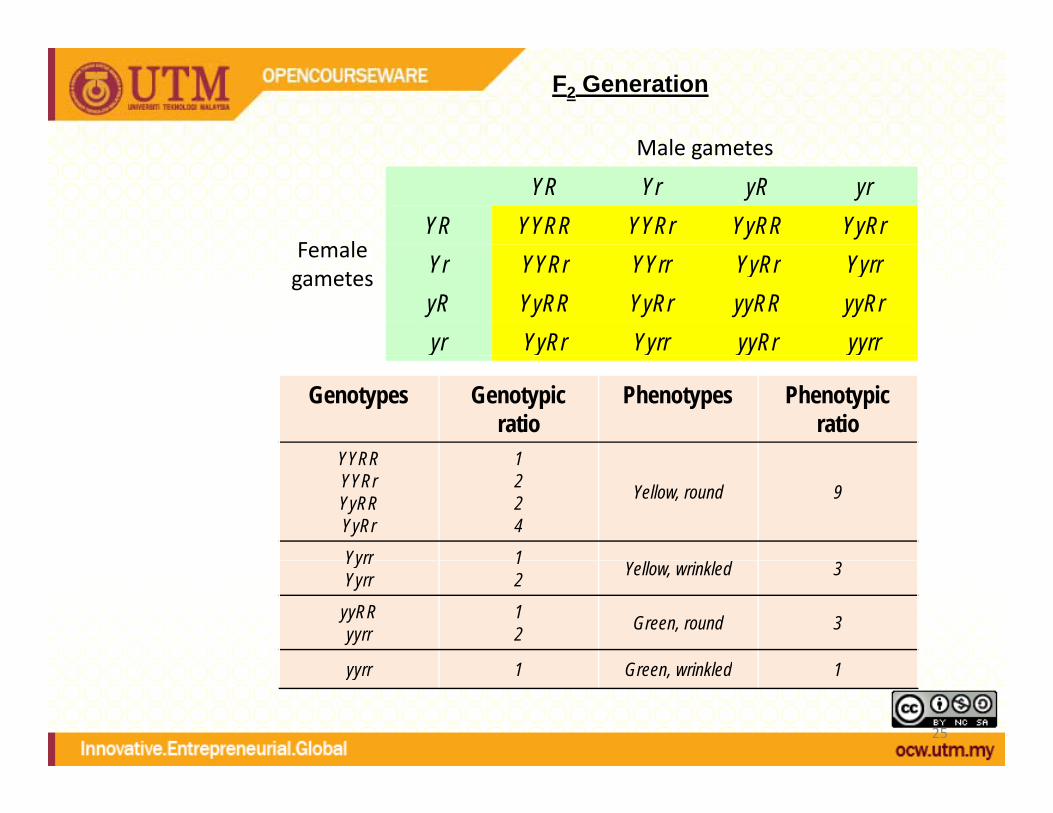
F2 Generation
Male gametes
Female
YR Yr yR yrYR YYRR YYRr YyRR YyRr
Female gametes Yr YYRr YYrr YyRr Yyrr
yR YyRR YyRr yyRR yyRryr YyRr Yyrr yyRr yyrr
Genotypes Genotypicratio
Phenotypes Phenotypic ratio
YYRR 1YYRRYYRrYyRRYyRr
1224
Yellow, round 9
Yyrr 1YyrrYyrr
12 Yellow, wrinkled 3
yyRRyyrr
12 Green, round 3
1 G i kl d 1
25
yyrr 1 Green, wrinkled 1
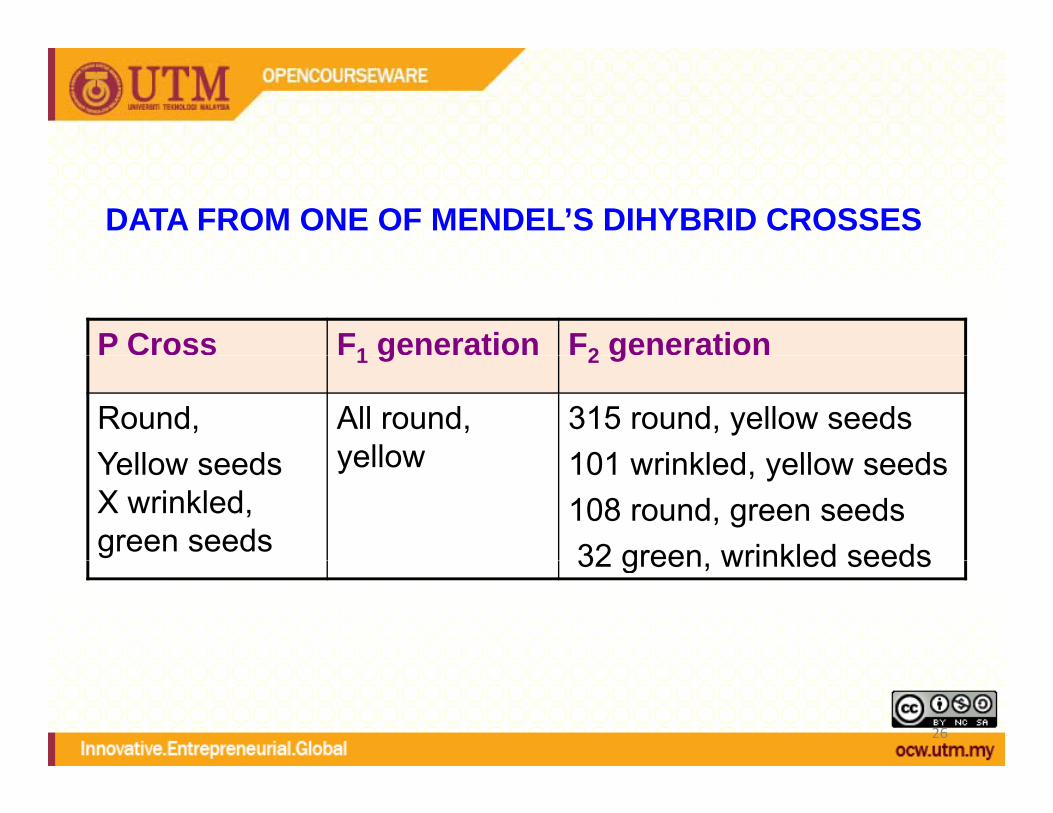
DATA FROM ONE OF MENDEL’S DIHYBRID CROSSES
P Cross F1 generation F2 generation1 g 2 g
Round,Yello seeds
All round, yellow
315 round, yellow seeds101 rinkled ello seedsYellow seeds
X wrinkled, green seeds
yellow 101 wrinkled, yellow seeds108 round, green seeds32 green wrinkled seeds32 green, wrinkled seeds
26
Interpreting the Datap g
• The F2 generation contains seeds with novel combinations not found in the parentals– Round and Green– Wrinkled and Yellow
• These are nonparentals• Occurrence contradicts the linkage model• Occurrence contradicts the linkage model
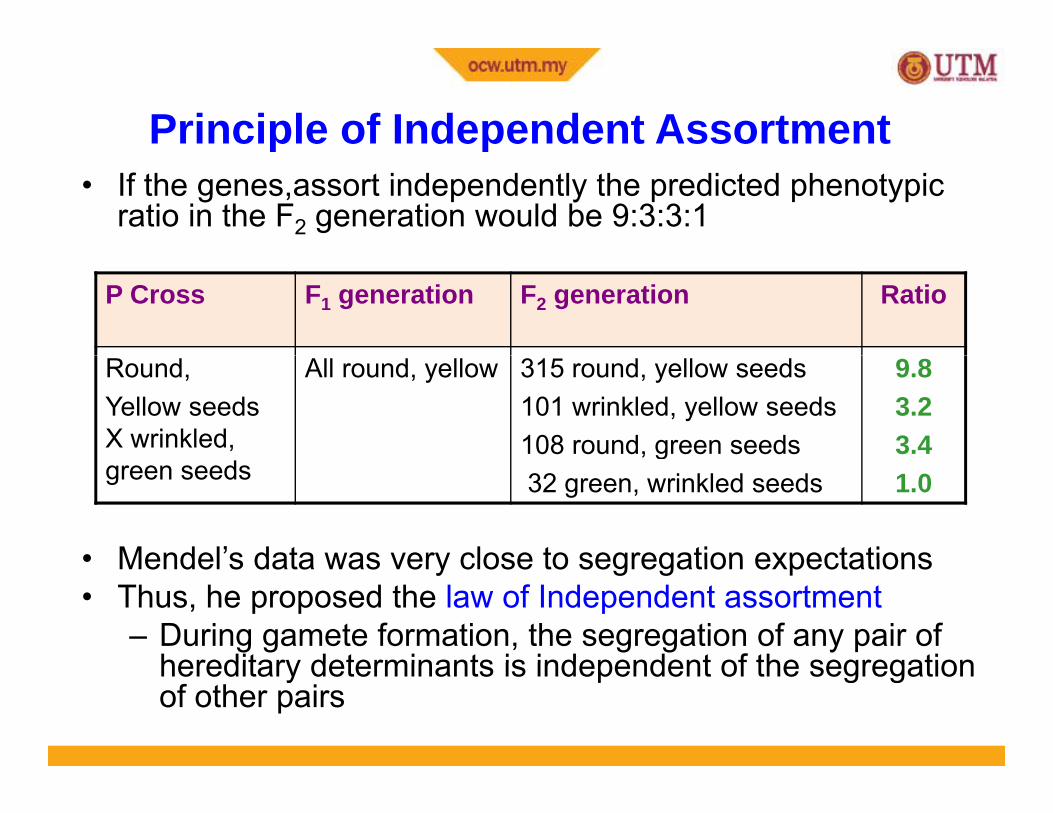
Principle of Independent Assortmentp p• If the genes,assort independently the predicted phenotypic
ratio in the F2 generation would be 9:3:3:1
P Cross F1 generation F2 generation Ratio
Round,Yellow seeds X wrinkled,
All round, yellow 315 round, yellow seeds101 wrinkled, yellow seeds108 round, green seeds
9.83.23.4
green seedsg
32 green, wrinkled seeds 1.0
• Mendel’s data was very close to segregation expectations• Mendel s data was very close to segregation expectations• Thus, he proposed the law of Independent assortment
– During gamete formation, the segregation of any pair of hereditary determinants is independent of the segregationhereditary determinants is independent of the segregation of other pairs
The Principle of Independent AssortmentThe Principle of Independent Assortment
• The alleles of different genes segregateThe alleles of different genes segregate, or as we sometimes say, assort, independently of each otherindependently of each other
29
Applications of Mendel’s Principles
To predict the outcomes of crosses between different traits of organisms
30

(A) The Punnett Square Method(A) The Punnett Square Method
• A Punnett square is a grid that enablesA Punnett square is a grid that enables one to predict the outcome of simple genetic crossesgenetic crosses
• Proposed by the English geneticist, Reginald PunnettReginald Punnett
31
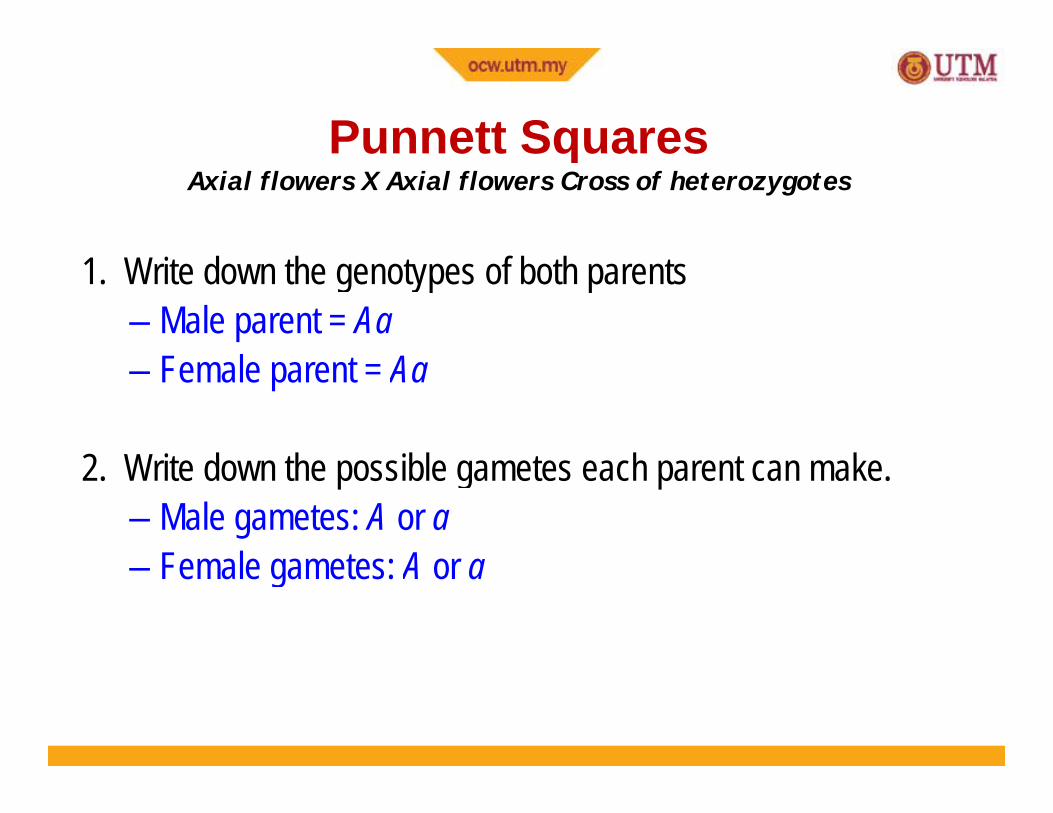
Punnett SquaresPunnett SquaresAxial flowers X Axial flowers Cross of heterozygotes
1. Write down the genotypes of both parents– Male parent = Aa– Female parent = Aa
2 W it d th ibl t h t k2. Write down the possible gametes each parent can make.– Male gametes: A or a
Female gametes: A or a– Female gametes: A or a
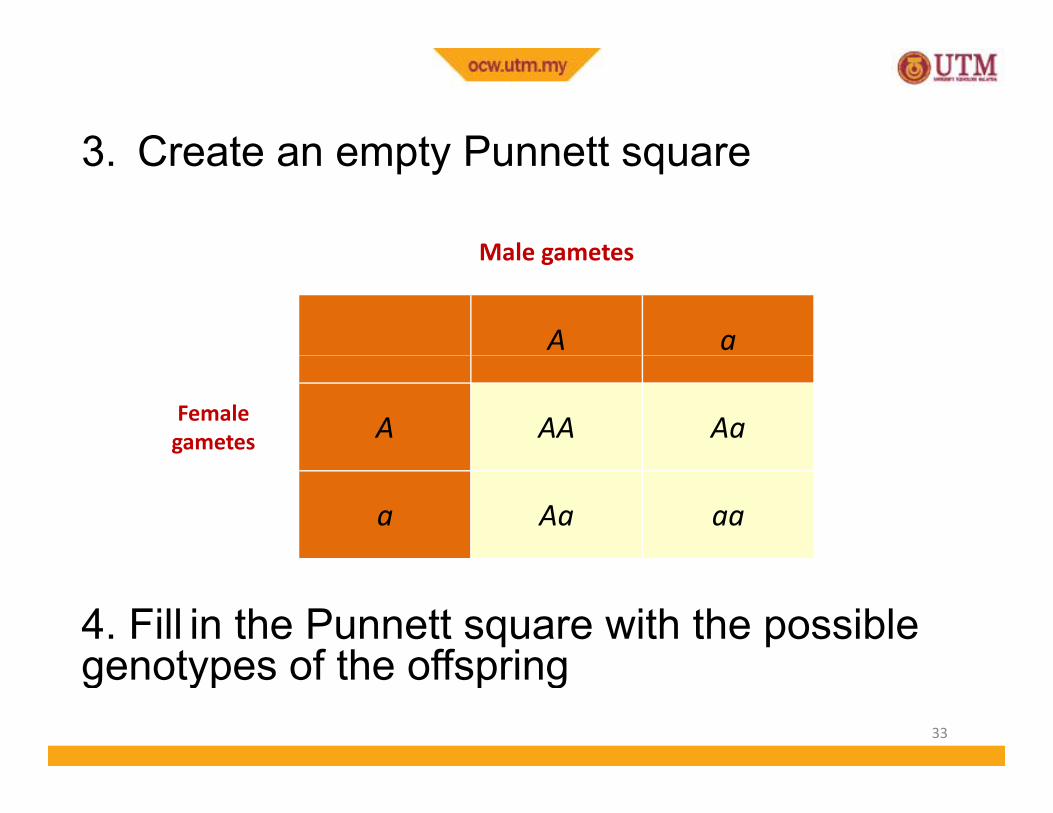
3 Create an empty Punnett square3. Create an empty Punnett square
Male gametesMale gametes
A a
Female gametes A AA Aa
a Aa aa
4. Fill in the Punnett square with the possible genotypes of the offspring
33
genotypes of the offspring
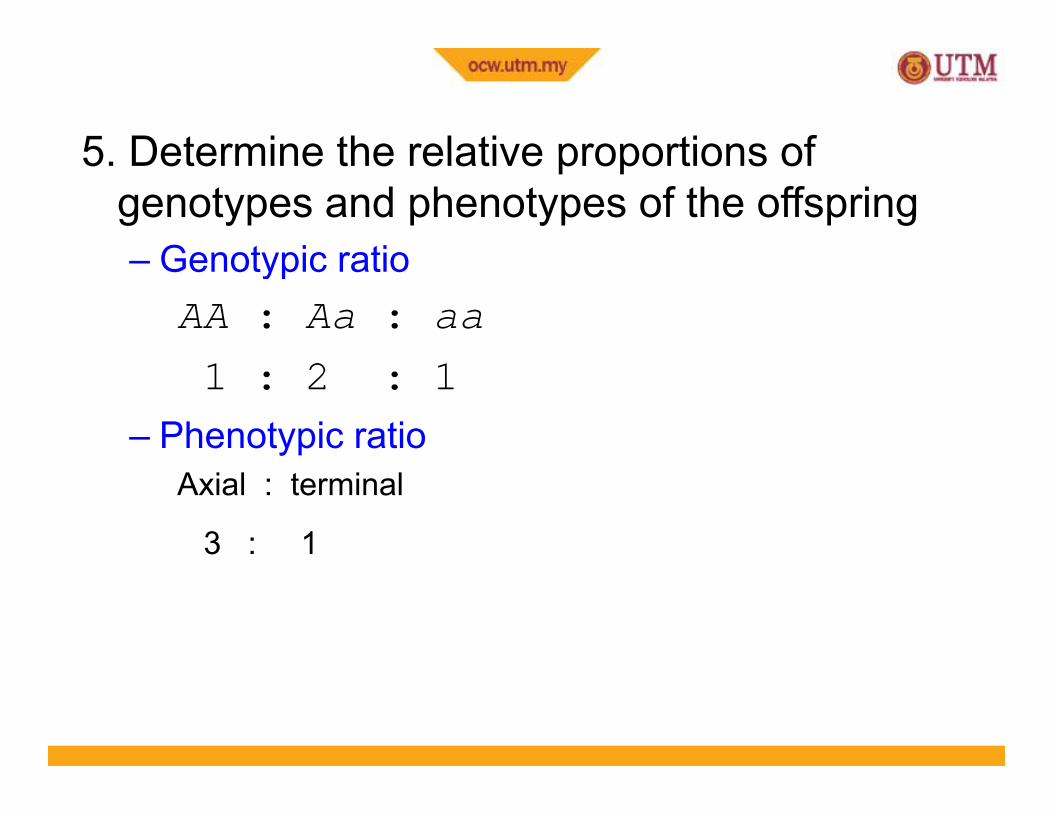
5 Determine the relative proportions of5. Determine the relative proportions of genotypes and phenotypes of the offspring
Genotypic ratio– Genotypic ratioAA : Aa : aa1 : 2 : 1
– Phenotypic ratioAxial : terminal
3 : 1
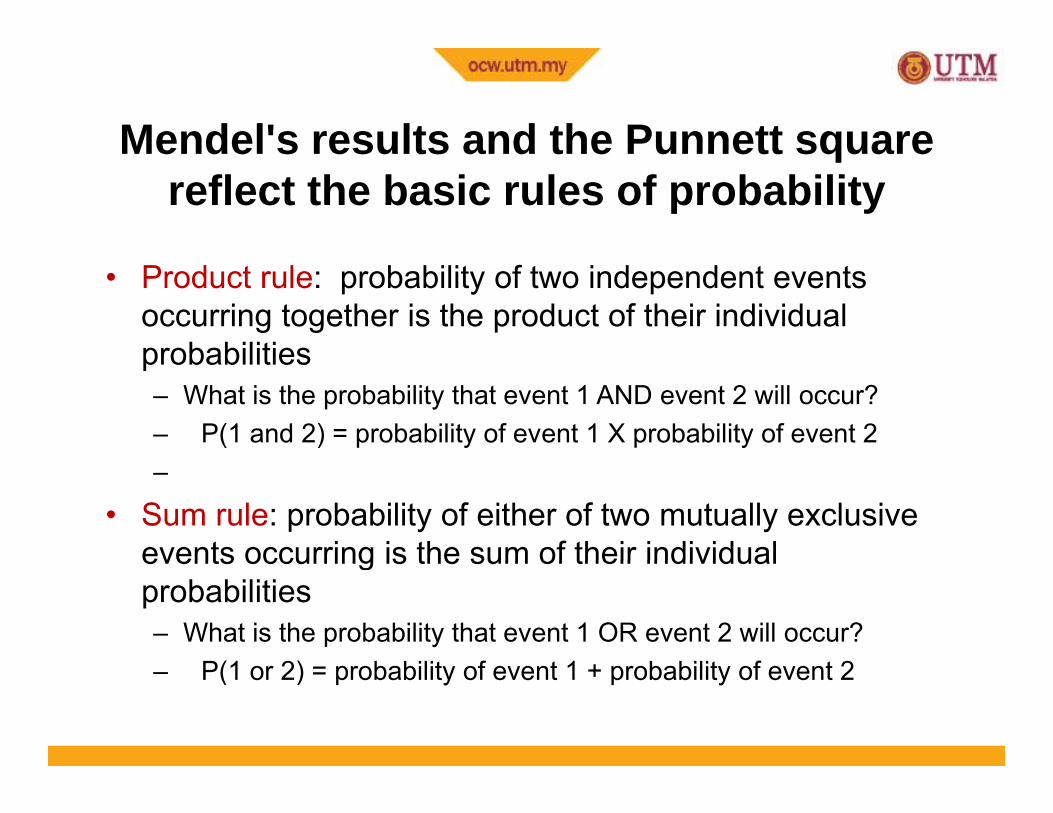
Mendel's results and the Punnett squareMendel s results and the Punnett square reflect the basic rules of probability
• Product rule: probability of two independent events occurring together is the product of their individual probabilitiesprobabilities– What is the probability that event 1 AND event 2 will occur?– P(1 and 2) = probability of event 1 X probability of event 2–
• Sum rule: probability of either of two mutually exclusive events occurring is the sum of their individualevents occurring is the sum of their individual probabilities – What is the probability that event 1 OR event 2 will occur?
P(1 2) b bilit f t 1 b bilit f t 2– P(1 or 2) = probability of event 1 + probability of event 2
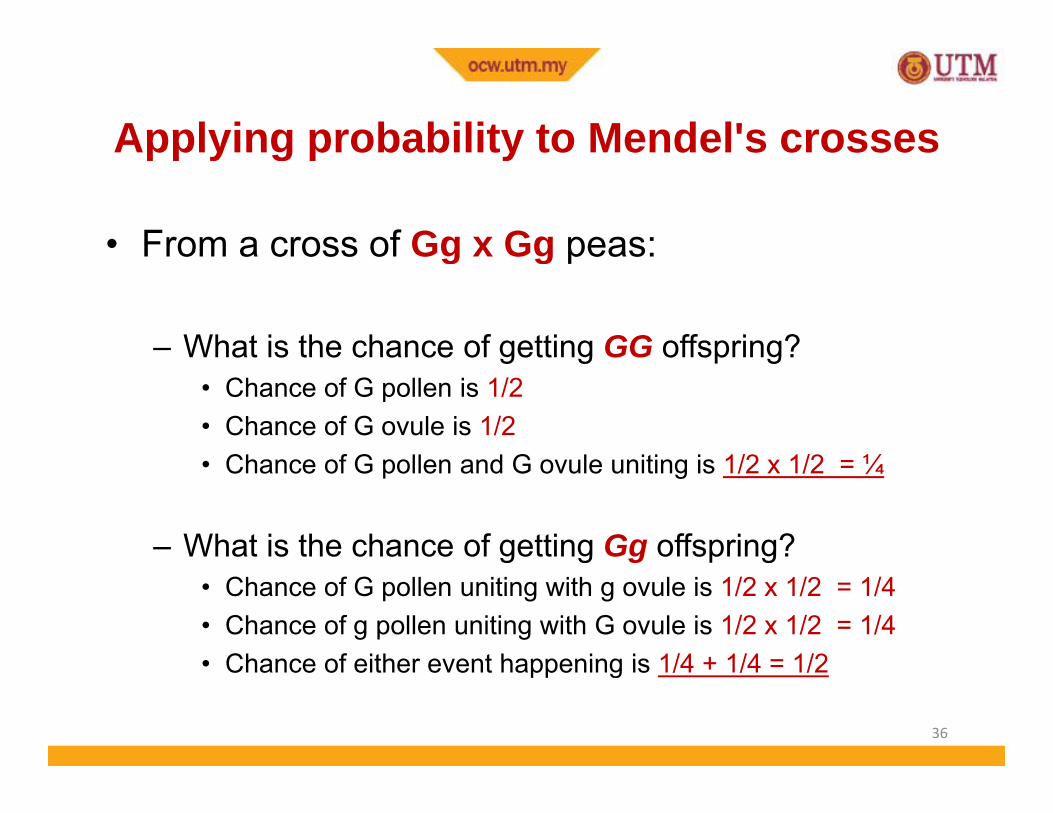
Applying probability to Mendel's crossesApplying probability to Mendel s crosses
• From a cross of Gg x Gg peas:From a cross of Gg x Gg peas:
– What is the chance of getting GG offspring?What is the chance of getting GG offspring?• Chance of G pollen is 1/2• Chance of G ovule is 1/2
Ch f G ll d G l iti i 1/2 1/2 ¼• Chance of G pollen and G ovule uniting is 1/2 x 1/2 = ¼
– What is the chance of getting Gg offspring?g g g p g• Chance of G pollen uniting with g ovule is 1/2 x 1/2 = 1/4• Chance of g pollen uniting with G ovule is 1/2 x 1/2 = 1/4• Chance of either event happening is 1/4 + 1/4 = 1/2• Chance of either event happening is 1/4 + 1/4 = 1/2
36
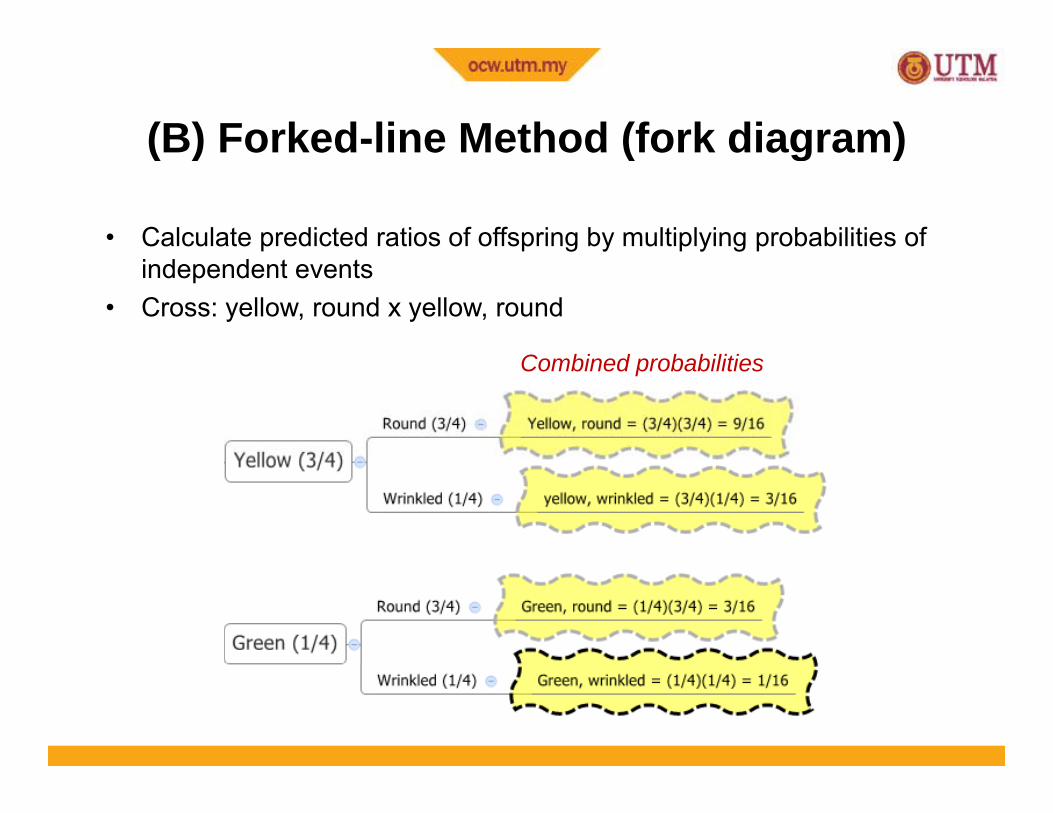
(B) Forked-line Method (fork diagram)(B) Forked line Method (fork diagram)
• Calculate predicted ratios of offspring by multiplying probabilities of independent events
• Cross: yellow, round x yellow, round
C bi d b bilitiCombined probabilities
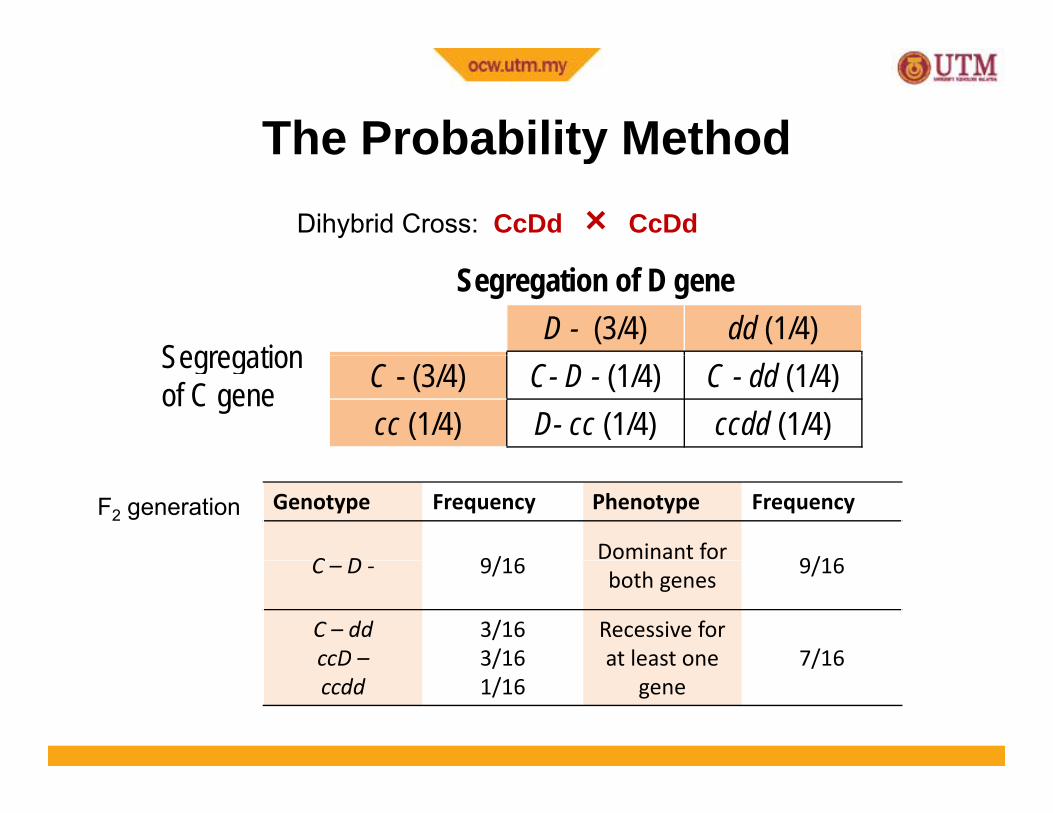
The Probability MethodThe Probability MethodDihybrid Cross: CcDd × CcDd
Segregation of D gene
Segregation D - (3/4) dd (1/4)
Segregation of C gene C - (3/4) C- D - (1/4) C - dd (1/4)
cc (1/4) D- cc (1/4) ccdd (1/4)
Genotype Frequency Phenotype Frequency
C D 9/16Dominant for
9/16
F2 generation
C – D ‐ 9/16both genes
9/16
C – ddccD –
3/163/16
Recessive for at least one 7/16ccD
ccdd3/161/16
at least one gene
7/16
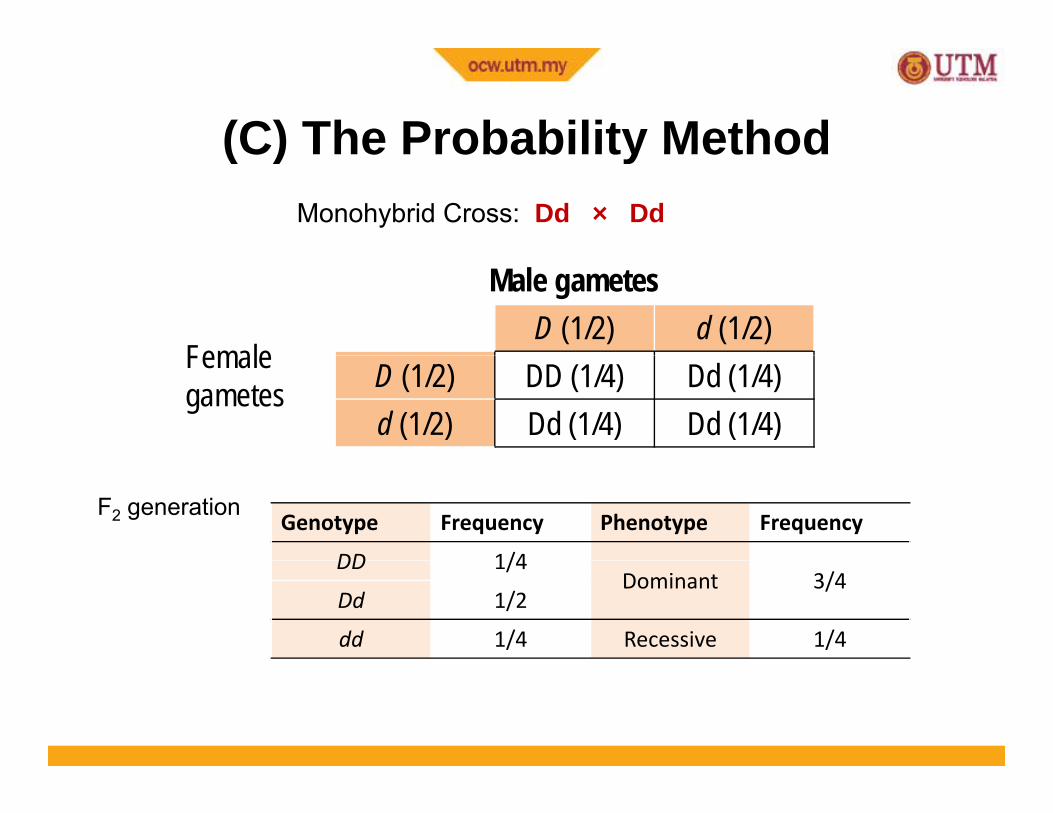
(C) The Probability Method(C) The Probability MethodMonohybrid Cross: Dd × Dd
Male gametes
Female D (1/2) d (1/2)
Female gametes D (1/2) DD (1/4) Dd (1/4)
d (1/2) Dd (1/4) Dd (1/4)
Genotype Frequency Phenotype Frequency
DD 1/4
F2 generation
DD 1/4Dominant 3/4
Dd 1/2
dd 1/4 Recessive 1/4
ProbabilityProbability
• To compute probability we can use• To compute probability, we can use three mathematical operations– Sum rule– Product rule– Binomial expansion equation
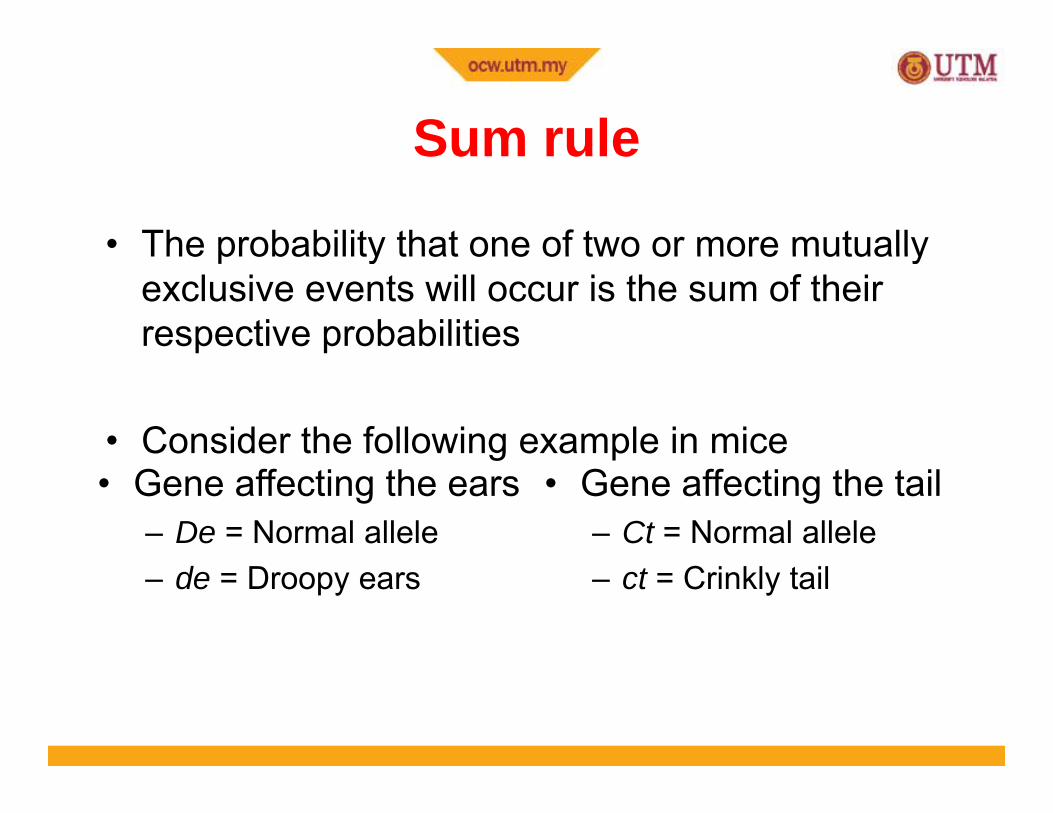
Sum ruleSum rule
• The probability that one of two or more mutuallyThe probability that one of two or more mutually exclusive events will occur is the sum of their respective probabilities
• Consider the following example in miceg p• Gene affecting the ears
– De = Normal allele• Gene affecting the tail
– Ct = Normal allele– de = Droopy ears – ct = Crinkly tail
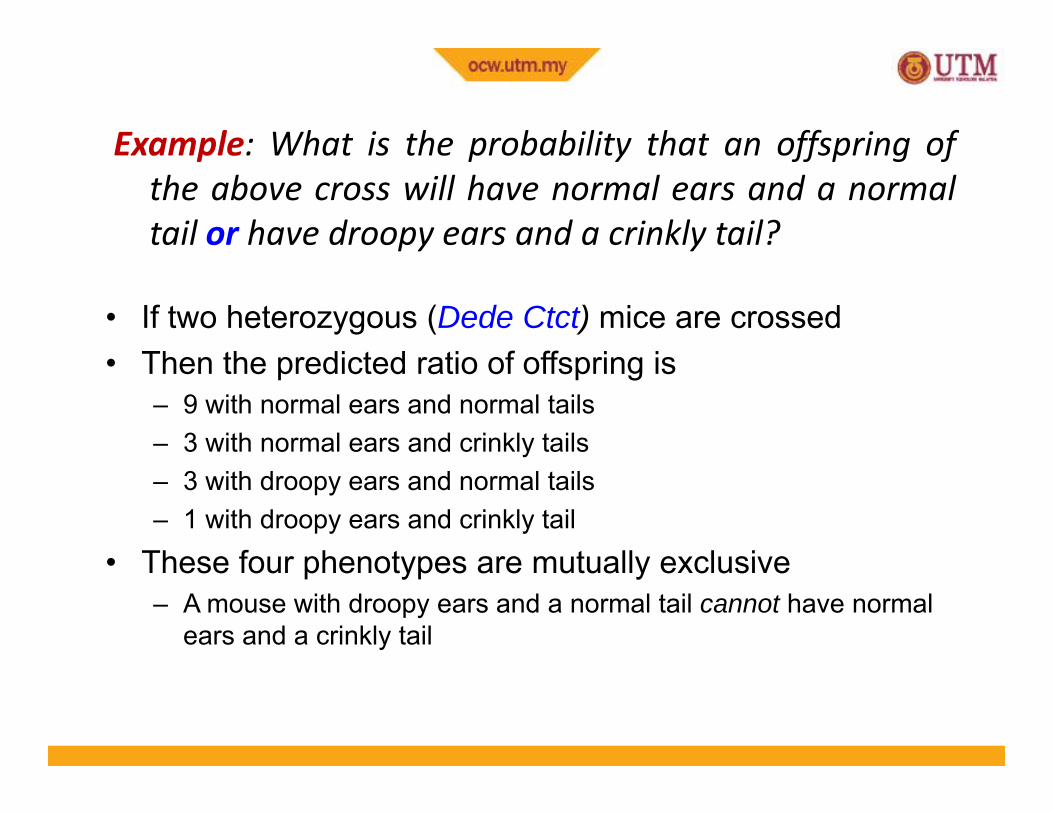
Example: What is the probability that an offspring ofExample: What is the probability that an offspring ofthe above cross will have normal ears and a normaltail or have droopy ears and a crinkly tail?
• If two heterozygous (Dede Ctct) mice are crossedTh th di t d ti f ff i i• Then the predicted ratio of offspring is– 9 with normal ears and normal tails– 3 with normal ears and crinkly tails– 3 with droopy ears and normal tails– 1 with droopy ears and crinkly tail
• These four phenotypes are mutually exclusive• These four phenotypes are mutually exclusive– A mouse with droopy ears and a normal tail cannot have normal
ears and a crinkly tail
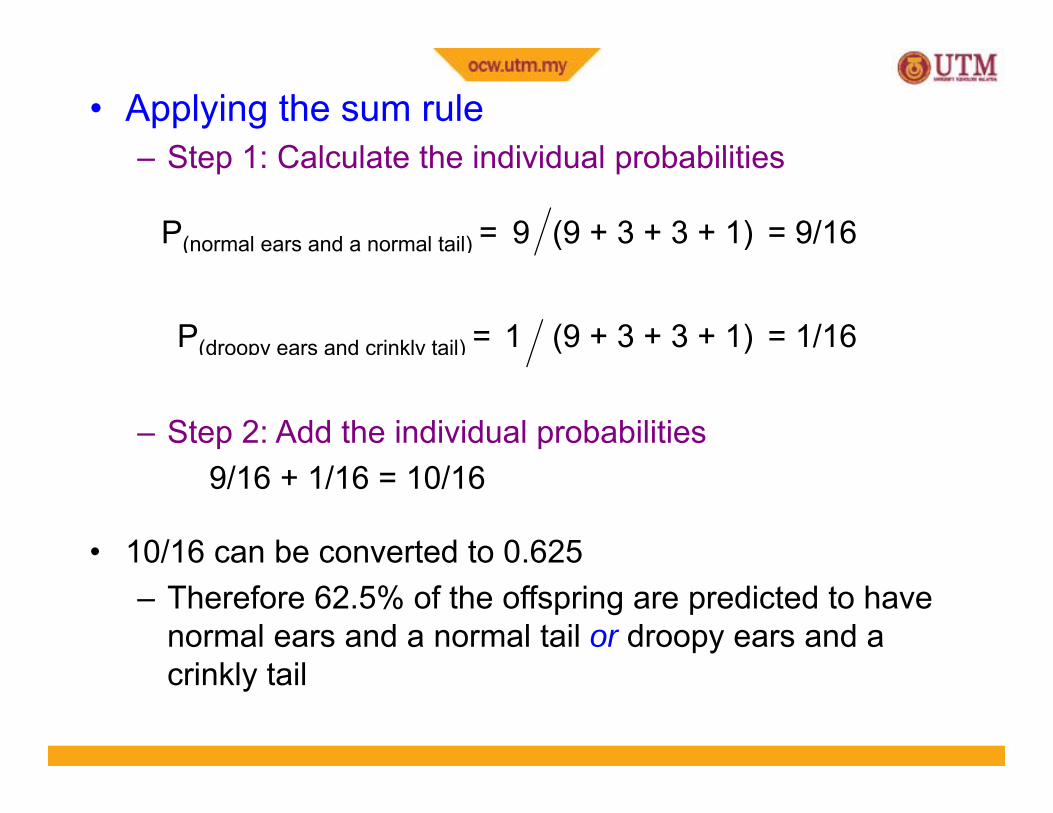
• Applying the sum ruleSt 1 C l l t th i di id l b biliti– Step 1: Calculate the individual probabilities
9 (9 + 3 + 3 + 1) = 9/16 P(normal ears and a normal tail) =
1 (9 + 3 + 3 + 1) = 1/16 P(droopy ears and crinkly tail) =
– Step 2: Add the individual probabilities9/16 + 1/16 = 10/16
• 10/16 can be converted to 0.62510/16 can be converted to 0.625– Therefore 62.5% of the offspring are predicted to have
normal ears and a normal tail or droopy ears and a i kl t ilcrinkly tail

Product ruleProduct rule
• The probability that two or moreThe probability that two or more independent events will occur is equal to the product of their respective probabilitiesthe product of their respective probabilities
N t• Note– Independent events are those in which the
f d t ff t thoccurrence of one does not affect the probability of another
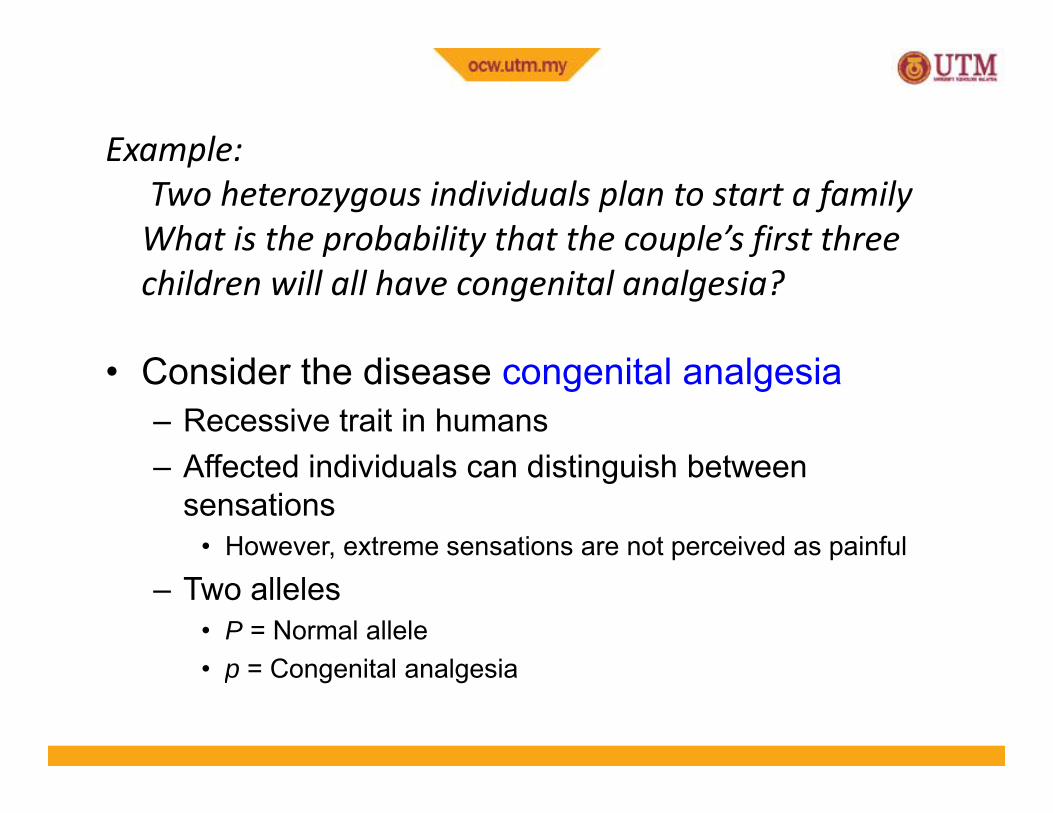
Example:Example:Two heterozygous individuals plan to start a familyWhat is the probability that the couple’s first three p y p fchildren will all have congenital analgesia?
• Consider the disease congenital analgesia– Recessive trait in humans
Aff t d i di id l di ti i h b t– Affected individuals can distinguish between sensations
• However, extreme sensations are not perceived as painful
– Two alleles• P = Normal allele
C it l l i• p = Congenital analgesia
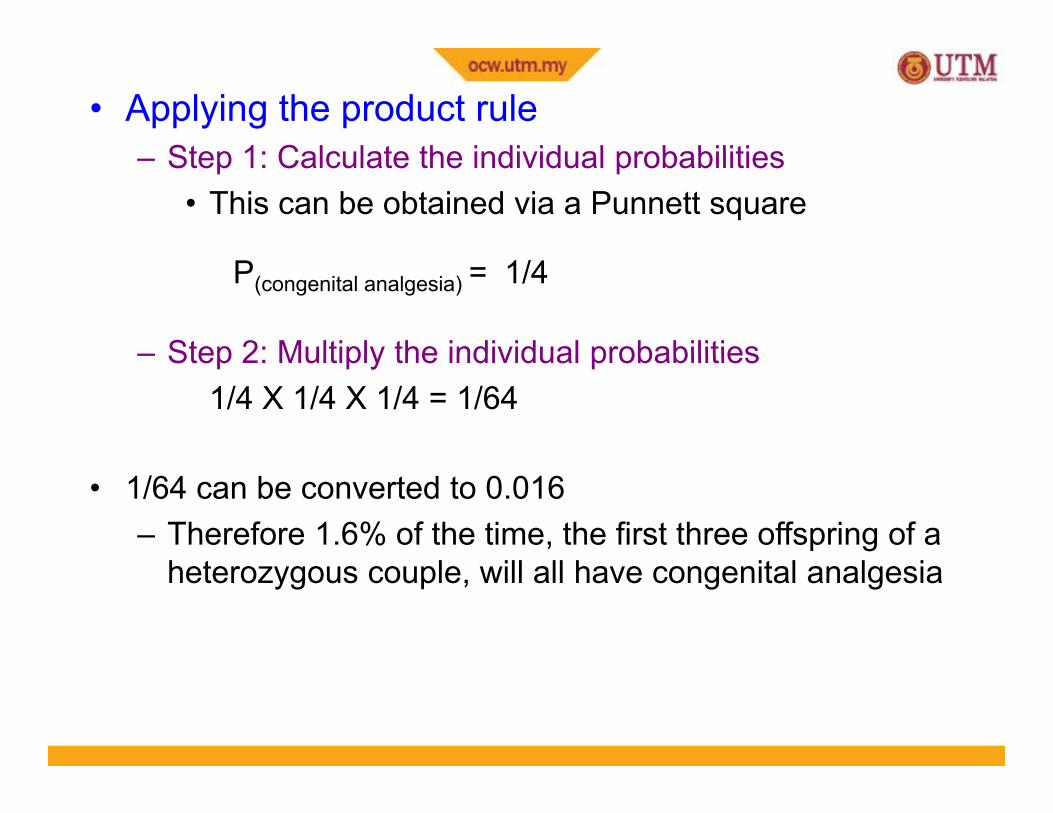
• Applying the product ruleSt 1 C l l t th i di id l b biliti– Step 1: Calculate the individual probabilities
• This can be obtained via a Punnett square
1/4 P(congenital analgesia) =
– Step 2: Multiply the individual probabilities– Step 2: Multiply the individual probabilities1/4 X 1/4 X 1/4 = 1/64
• 1/64 can be converted to 0.016– Therefore 1.6% of the time, the first three offspring of a
h l ill ll h i l l iheterozygous couple, will all have congenital analgesia
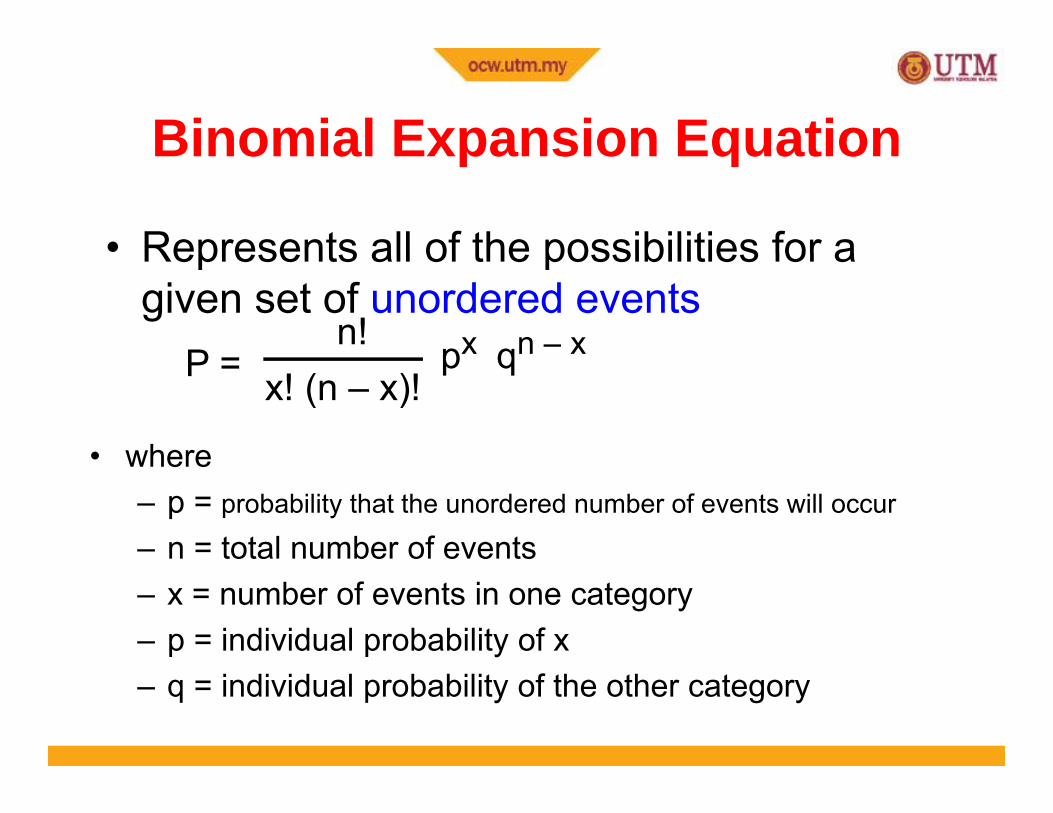
Binomial Expansion EquationBinomial Expansion Equation
• Represents all of the possibilities for aRepresents all of the possibilities for a given set of unordered events
n! px qn – x P x! (n – x)!p q
• where
P =
• where – p = probability that the unordered number of events will occur
– n = total number of events– x = number of events in one category– p = individual probability of x– q = individual probability of the other category
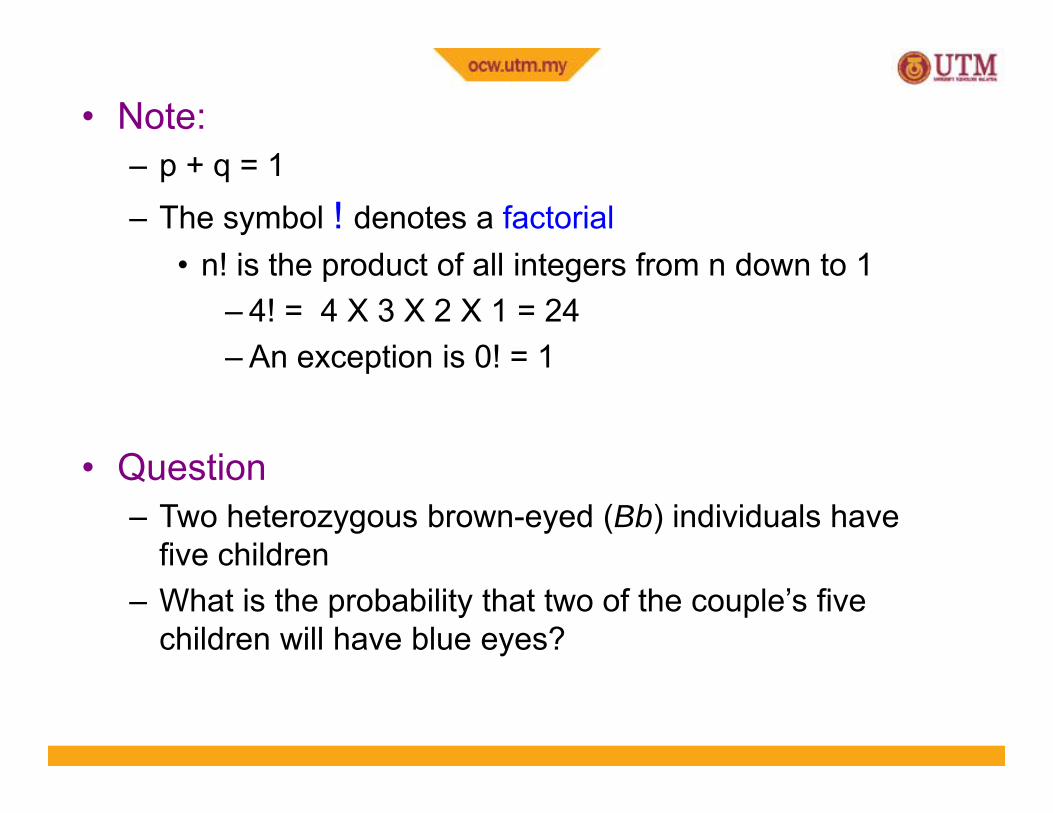
• Note:– p + q = 1– The symbol ! denotes a factorial
! i h d f ll i f d 1• n! is the product of all integers from n down to 1– 4! = 4 X 3 X 2 X 1 = 24
An exception is 0! = 1– An exception is 0! = 1
Q ti• Question– Two heterozygous brown-eyed (Bb) individuals have
five childrenfive children– What is the probability that two of the couple’s five
children will have blue eyes?
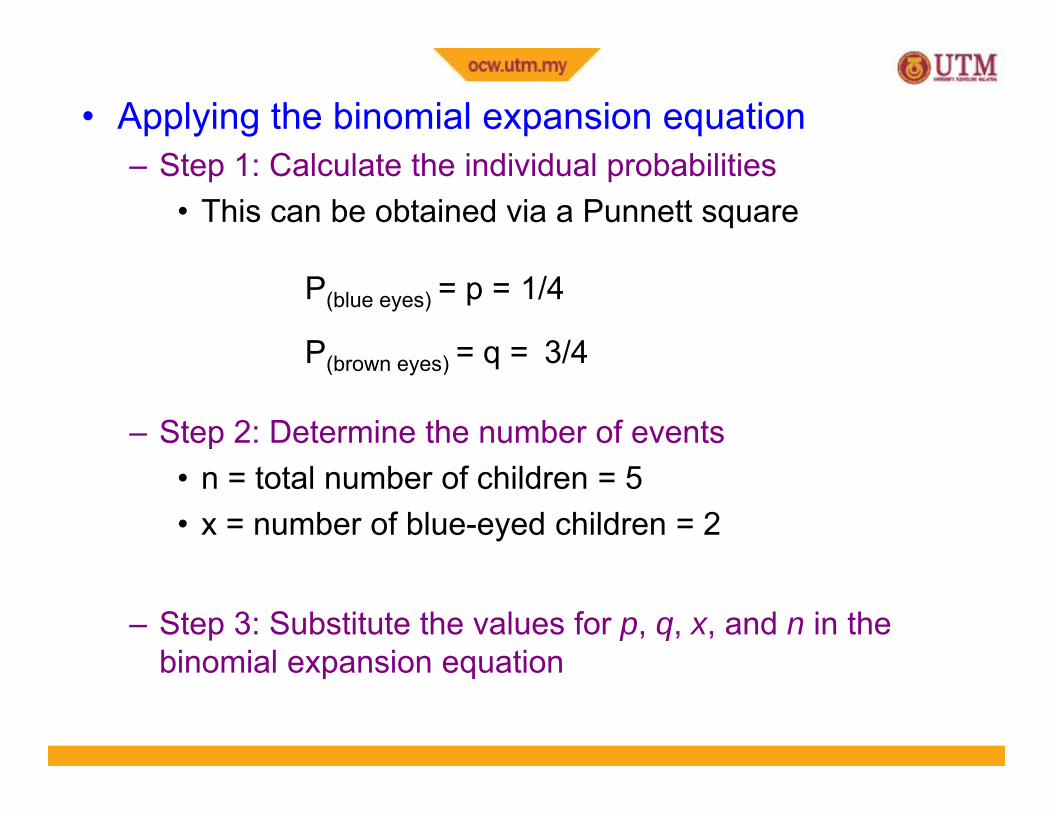
• Applying the binomial expansion equation– Step 1: Calculate the individual probabilities
• This can be obtained via a Punnett square
1/4 P(blue eyes) = p =
3/4P( ) = q = 3/4 P(brown eyes) = q =
– Step 2: Determine the number of events• n = total number of children = 5• x = number of blue-eyed children = 2
– Step 3: Substitute the values for p, q, x, and n in the binomial expansion equationbinomial expansion equation
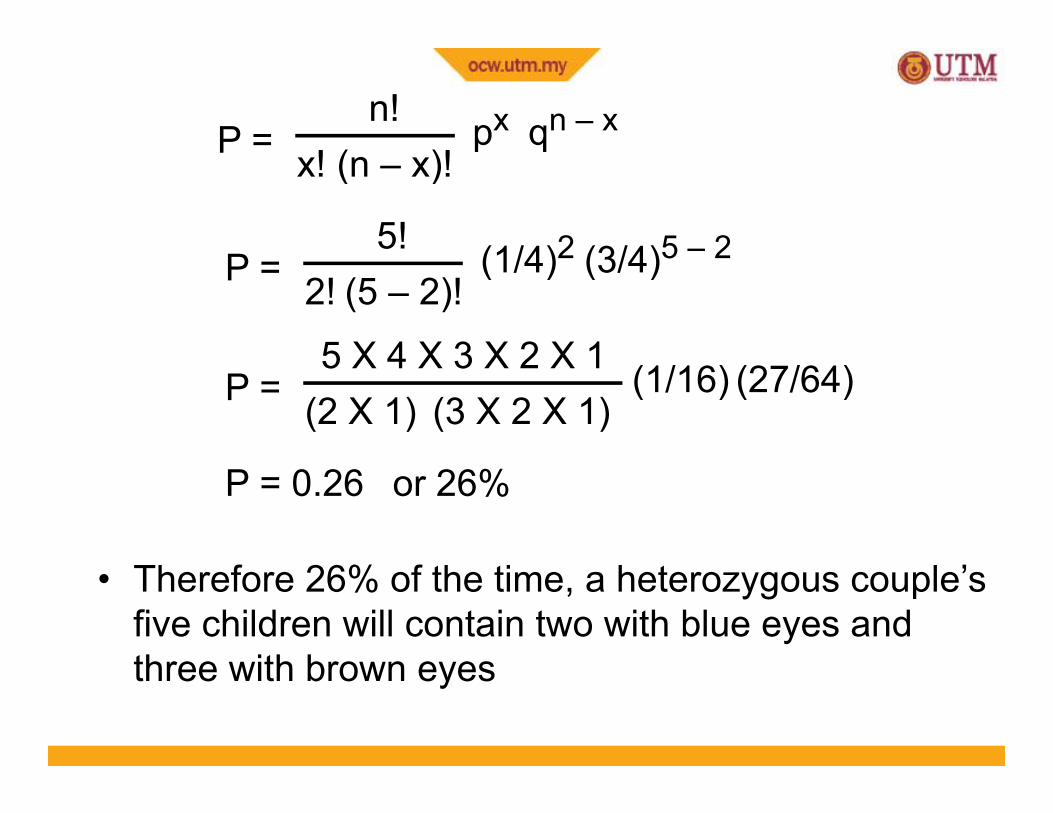
n!! ( )!
px qn – x P = x! (n – x)!p qP
5! (1/4)2 (3/4)5 – 22! (5 – 2)!
(1/4)2 (3/4)5 2 P =
5 X 4 X 3 X 2 X 15 X 4 X 3 X 2 X 1(2 X 1) (3 X 2 X 1)
(1/16) (27/64)P =
P = 0.26 or 26%
• Therefore 26% of the time, a heterozygous couple’s five children will contain two with blue eyes and three with brown eyesthree with brown eyes
ProblemsProblems
• A family with six childrenA family with six children. i. What is probability that at least four will be
girls?girls?ii. What is probability that at least one but no
more than four of the children will be girls?more than four of the children will be girls?
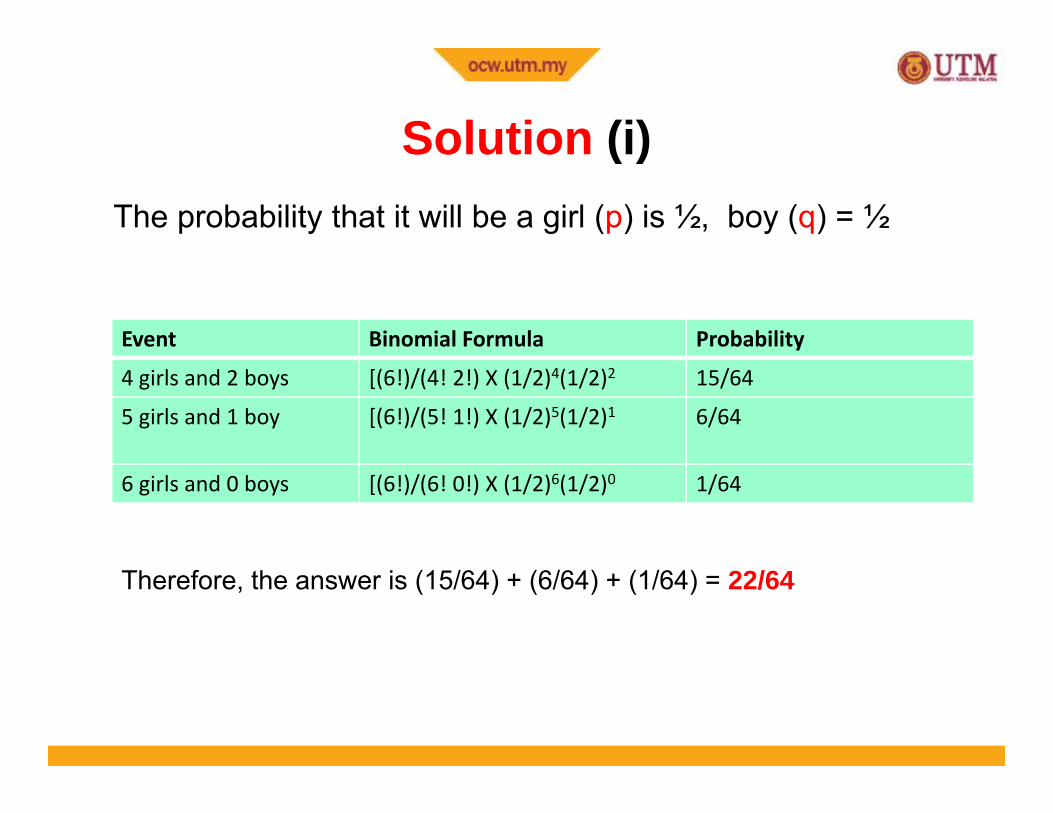
Solution (i)Solution (i)The probability that it will be a girl (p) is ½, boy (q) = ½
Event Binomial Formula Probability
4 girls and 2 boys [(6!)/(4! 2!) X (1/2)4(1/2)2 15/64
5 girls and 1 boy [(6!)/(5! 1!) X (1/2)5(1/2)1 6/64
6 girls and 0 boys [(6!)/(6! 0!) X (1/2)6(1/2)0 1/64
Therefore, the answer is (15/64) + (6/64) + (1/64) = 22/64

Solution (ii)Solution (ii)The probability that it will be a girl (p) is ½, boy (q) = ½
Event Binomial Formula Probability
1 girl and 5 boys [(6!)/(1! 5!) X (1/2)1(1/2)5 6/64
2 girl and 4 boys [(6!)/(2! 4!) X (1/2)2(1/2)4 15/64
3 girls and 3 boys [(6!)/(3! 3!) X (1/2)3(1/2)3 20/64
4 girls and 2 boys [(6!)/(4! 2!) X (1/2)4(1/2)2 15/64
Therefore, the answer is (6/64) +(15/64) + (20/64) + (15/64) = 56/64
The Chi Square TestThe Chi Square Test
• A statistical method used to determineA statistical method used to determine goodness of fit
Goodness of fit refers to how close the– Goodness of fit refers to how close the observed data are to those predicted from a hypothesisyp
• Note:The chi square test does not prove that a– The chi square test does not prove that a hypothesis is correct
• It evaluates whether or not the data and theIt evaluates whether or not the data and the hypothesis have a good fit
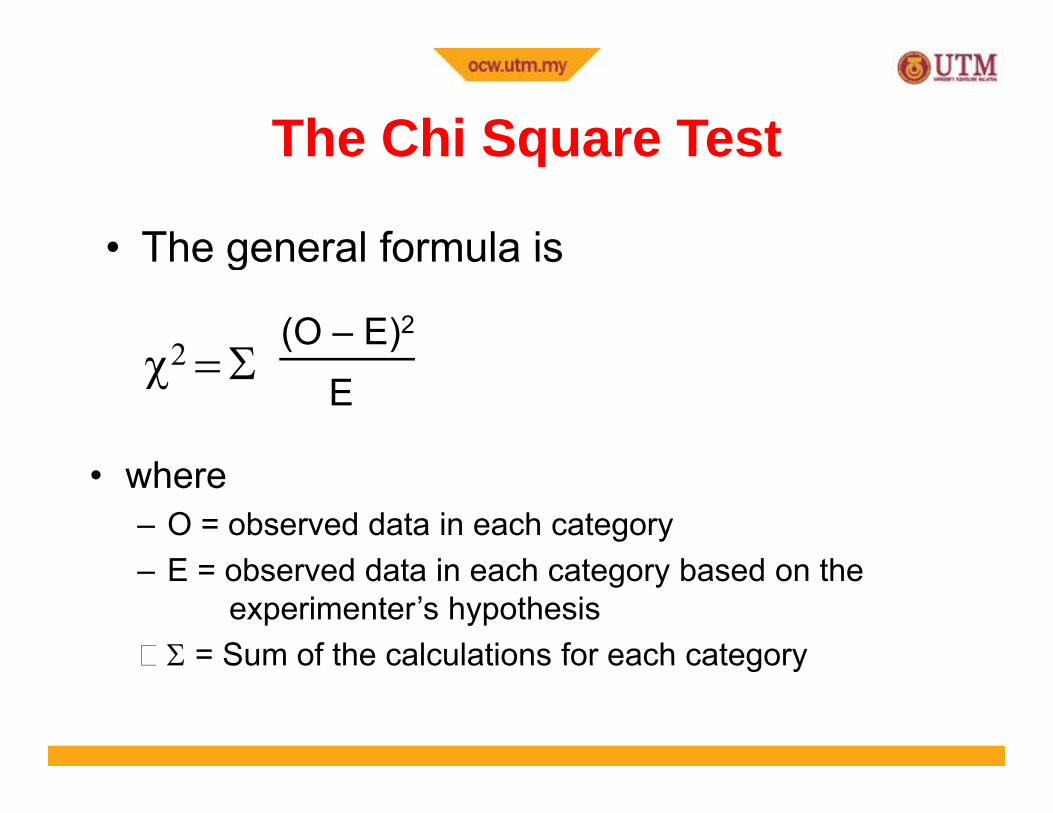
The Chi Square TestThe Chi Square Test
• The general formula isThe general formula is
2 Σ(O – E)2
χ2 = ΣE
• where – O = observed data in each category
E b d d t i h t b d th– E = observed data in each category based on the experimenter’s hypothesis
Σ = Sum of the calculations for each categoryΣ Sum of the calculations for each category
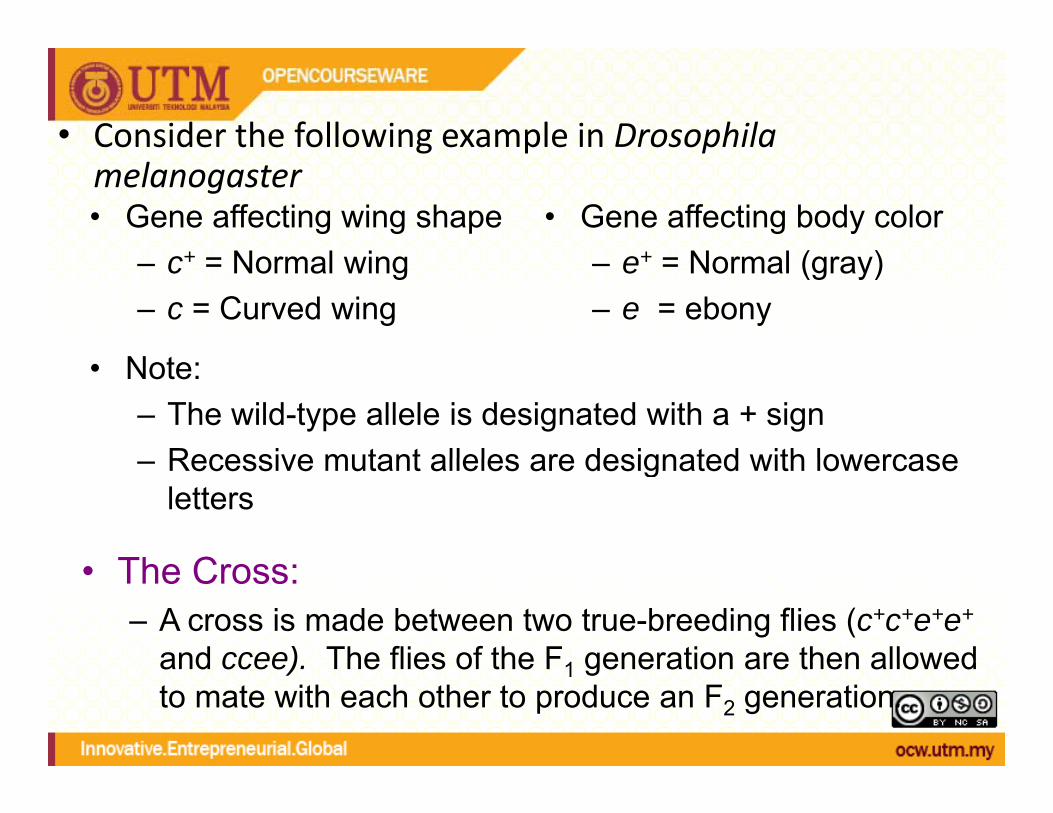
• Consider the following example in Drosophila
• Gene affecting wing shape+ N l i
• Gene affecting body color+ N l ( )
g p pmelanogaster
– c+ = Normal wing– c = Curved wing
– e+ = Normal (gray)– e = ebony
• Note:– The wild-type allele is designated with a + sign
Recessive mutant alleles are designated with lowercase– Recessive mutant alleles are designated with lowercase letters
Th C• The Cross:– A cross is made between two true-breeding flies (c+c+e+e+
and ccee) The flies of the F1 generation are then allowedand ccee). The flies of the F1 generation are then allowed to mate with each other to produce an F2 generation.
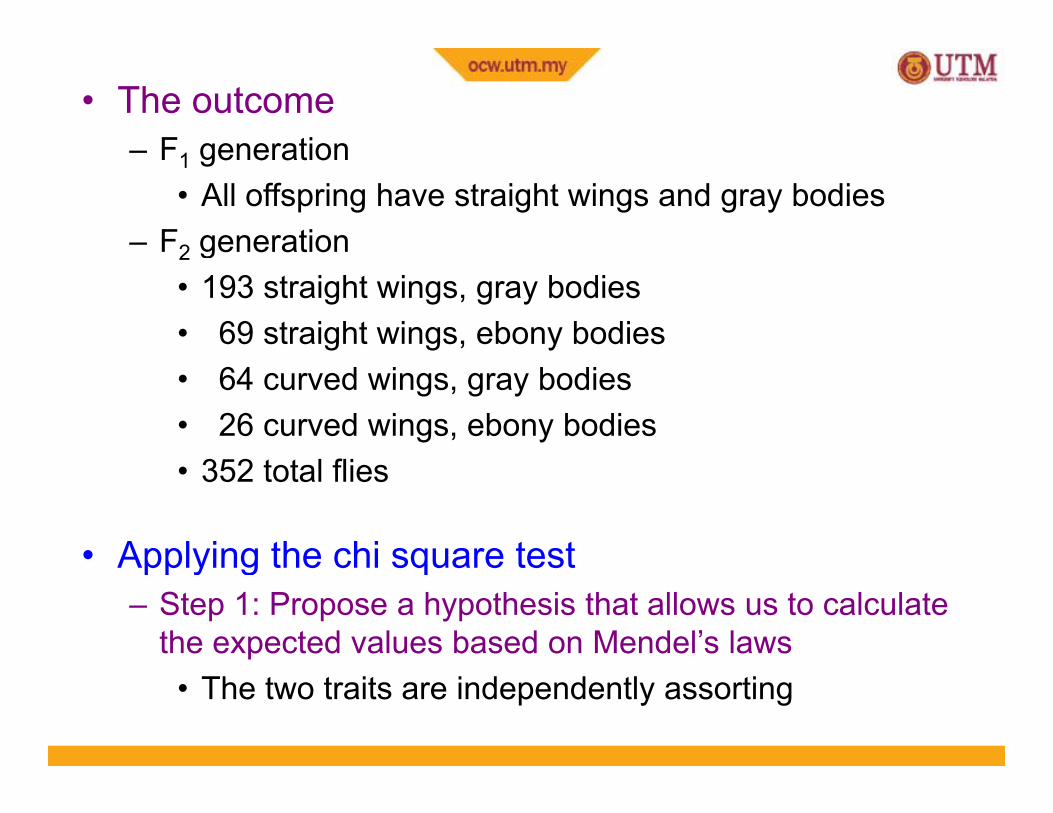
• The outcomeF generation– F1 generation
• All offspring have straight wings and gray bodies– F2 generation 2 g
• 193 straight wings, gray bodies• 69 straight wings, ebony bodies• 64 curved wings, gray bodies• 26 curved wings, ebony bodies• 352 total flies
• Applying the chi square testApplying the chi square test– Step 1: Propose a hypothesis that allows us to calculate
the expected values based on Mendel’s laws• The two traits are independently assorting
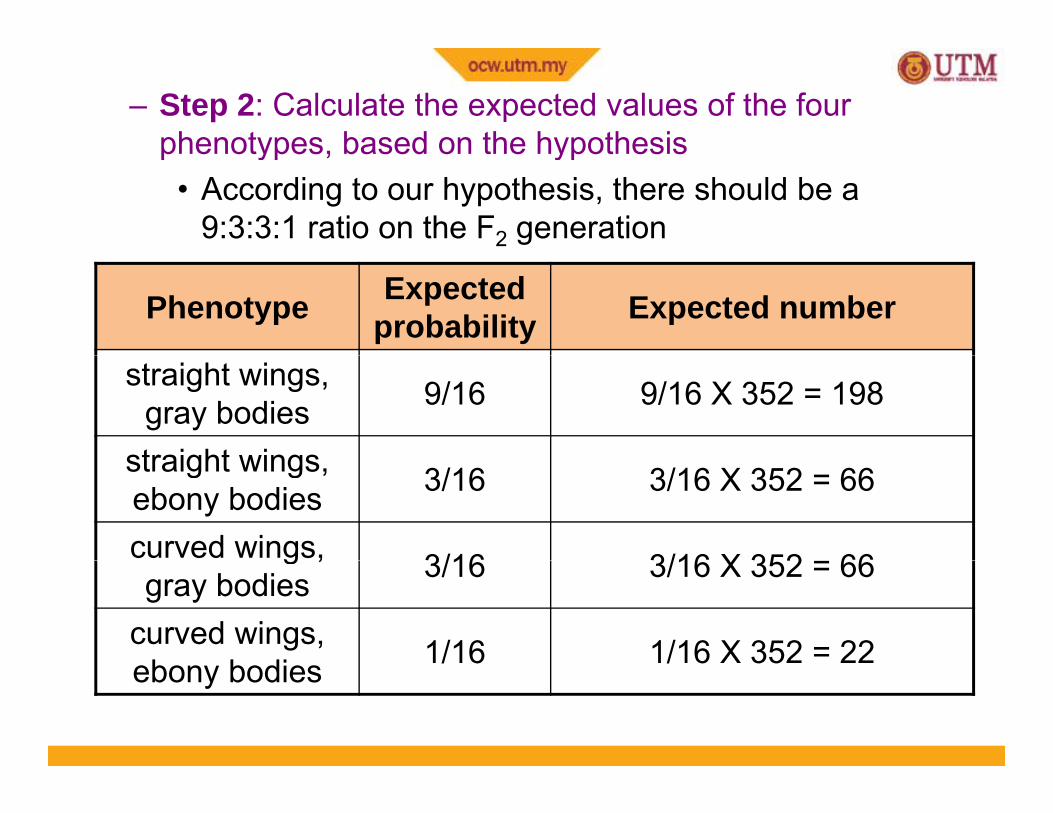
– Step 2: Calculate the expected values of the four phenotypes based on the hypothesisphenotypes, based on the hypothesis
• According to our hypothesis, there should be a 9:3:3:1 ratio on the F2 generation
Phenotype Expected probability Expected number
straight wings, gray bodies 9/16 9/16 X 352 = 198
straight wingsstraight wings, ebony bodies 3/16 3/16 X 352 = 66
curved wings, 3/16 3/16 X 352 66g ,gray bodies 3/16 3/16 X 352 = 66
curved wings, b b di 1/16 1/16 X 352 = 22ebony bodies / 6 / 6 35

– Step 3: Apply the chi square formula
χ2 =(O1 – E1)2 (O2 – E2)2 (O3 – E3)2 (O4 – E4)2
+ + +χ =E1 E2 E3 E4
χ2 = (193 – 198)2
198(69 – 66)2
66(64 – 66)2
66(26 – 22)2
22+ + +
χ2 = 0.13 + 0.14 + 0.06 + 0.73
χ2 = 1.06
• Step 4: Interpret the chi square value
– Low chi square values indicate a high probability that the observed deviations could be due to random chance aloneHigh chi square values indicate a low probability that the– High chi square values indicate a low probability that the observed deviations are due to random chance alone
– If the chi square value results in a probability that is less than 0.05 (ie: less than 5%)
• The hypothesis is rejected
• Step 4: Interpret the chi square value
B f th hi t bl h t– Before we can use the chi square table, we have to determine the degrees of freedom (df)
• The df is a measure of the number of categories that areThe df is a measure of the number of categories that are independent of each other
• df = n – 1 – where n = total number of categories
• In our experiment, there are four phenotypes/categoriesTh f df 4 1 3– Therefore, df = 4 – 1 = 3
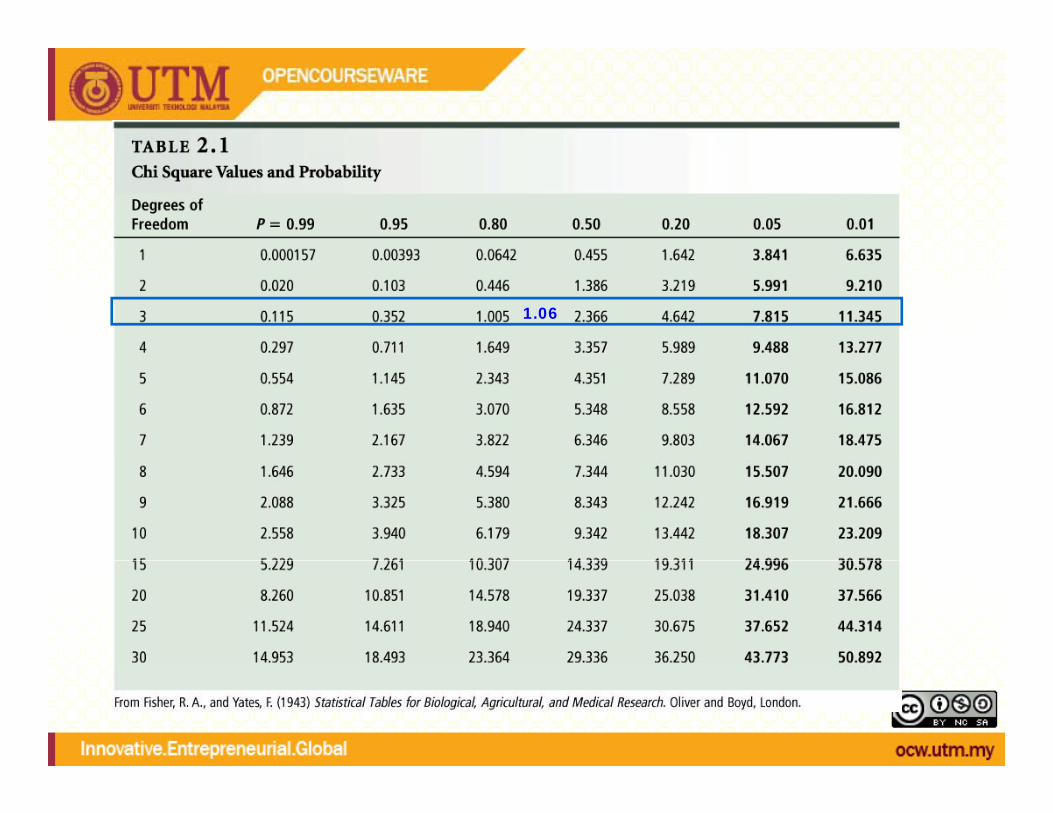
1.06
• Step 4: Interpret the chi square value
– With df = 3, the chi square value of 1.06 is slightly greater than 1.005 (which corresponds to P= 0.80)
– A P = 0.80 means that values equal to or greater than 1.005 t d t 80% f th ti b d dare expected to occur 80% of the time based on random
chance alone
– Therefore, it is quite probable that the deviations between the observed and expected values in this experiment can be
l i d b d liexplained by random sampling error
Modern Genetic TerminologyModern Genetic Terminology
• RecessiveRecessive– Null – no functional protein is produced
• genetic null – gene is lost• genetic null – gene is lost• functional null – no protein function
• Dominant• Dominant– Gain-of-function (GOF)
• protein functions is a new way• protein functions is a new way• more protein is made than in wildtype• protein can not be regulated as in wildtypep g yp
MENDELIAN INHERITANCE IN HUMANSMENDELIAN INHERITANCE IN HUMANS
• Many heritable traits in humans areMany heritable traits in humans are caused by interaction of multiple genes
• Even with single gene traits determining• Even with single-gene traits, determining inheritance pattern in humans can be trickytricky– Long generation time
S ll b f– Small numbers of progeny– No controlled matings– No pure-breeding lines

Some of the most common single-gene traits d b i ll l i hcaused by recessive alleles in humans
Disease Effect Incidence of Disease
Thallassemia (chromosome 16 or 11)
Reduced amounts of hemoglobin; anemia, bone, and spleen enlargement
1/10 in parts of Italy
Sickle cell anemia Abnormal hemoglobin; sickle 1/625 AfricanSickle-cell anemia (chromosome 11)
Abnormal hemoglobin; sickle-shaped red cells, anemia, blocked circulation; increased resistance to malaria
1/625 African-Americans
Cystic fibrosis (chromosome 7)
Defective cell membrane protein; excessive mucus production; digestive and respiratory failure
1/2000 Caucasians
Tay-Sachs disease Missing enzyme; buildup of fatty 1/3000 EasternTay Sachs disease (chromosome 15)
Missing enzyme; buildup of fatty deposit in brain; buildup disrupts mental development
1/3000 Eastern European Jews
Phenylketonuria (PKU) ( h 12)
Missing enzyme; mental d fi i
1/10,000 Caucasians(chromosome 12) deficiency
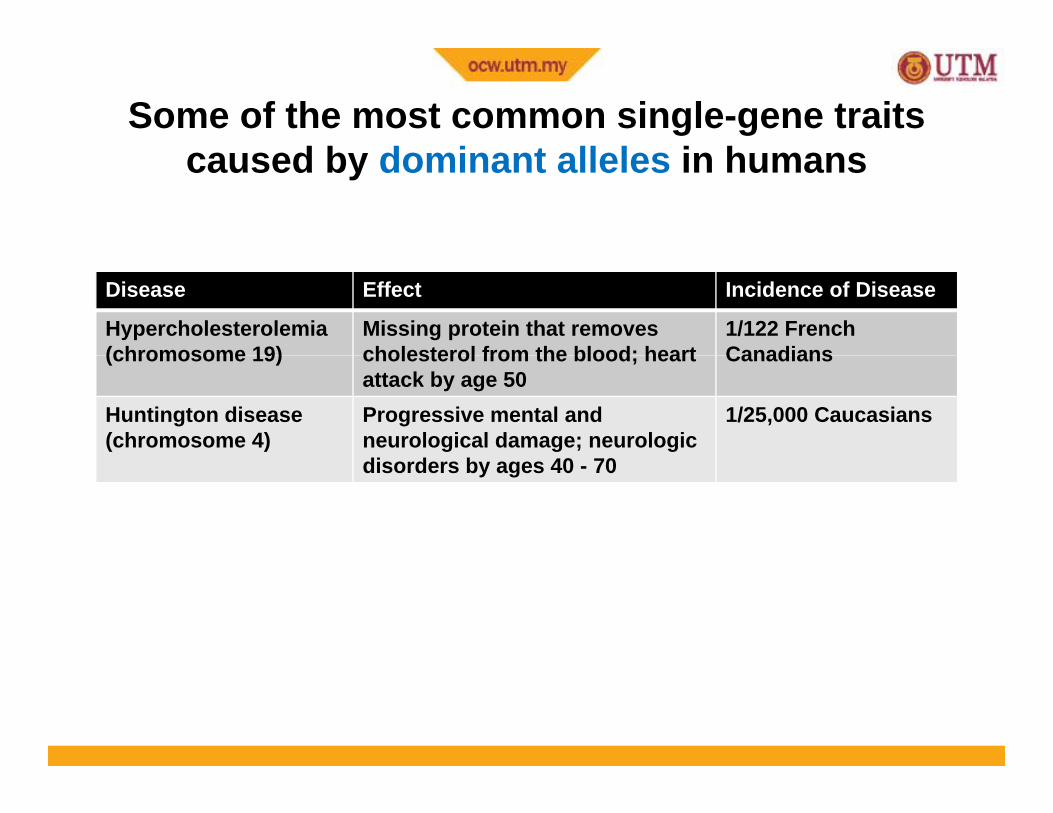
Some of the most common single-gene traits d b d i t ll l i hcaused by dominant alleles in humans
Disease Effect Incidence of Disease
Hypercholesterolemia (chromosome 19)
Missing protein that removes cholesterol from the blood; heart
1/122 French Canadians(chromosome 19) cholesterol from the blood; heart
attack by age 50Canadians
Huntington disease (chromosome 4)
Progressive mental and neurological damage; neurologic di d b 40 70
1/25,000 Caucasians
disorders by ages 40 - 70
PEDIGREESPEDIGREES
• In the study of human traits there are notIn the study of human traits, there are not controlled parental crosses
• Rely on information from family trees or• Rely on information from family trees or pedigreesP di l i i d t d t i th• Pedigree analysis is used to determine the pattern of inheritance of traits in humans
Pedigree AnalysisPedigree Analysis
• Pedigree analysis is commonly used toPedigree analysis is commonly used to determine the inheritance pattern of human genetic diseases
• Genes that play a role in disease may exist as– A normal allele – A mutant allele that causes disease symptoms
• Disease that follow a simple Mendelian pattern of inheritance can be– Dominant
R i– Recessive
In humans, pedigrees can be used t t d i h itto study inheritance
• Pedigrees are orderly diagrams of aPedigrees are orderly diagrams of a family's relevant genetic features
• Includes as many generations as possible• Includes as many generations as possible (ideally, at least both sets of grandparents of an affected person)of an affected person)
• Pedigrees can be analyzed using Mendel's llaws– Is a trait determined by alternate alleles of a
i l ?single gene?– Is a trait dominant or recessive?
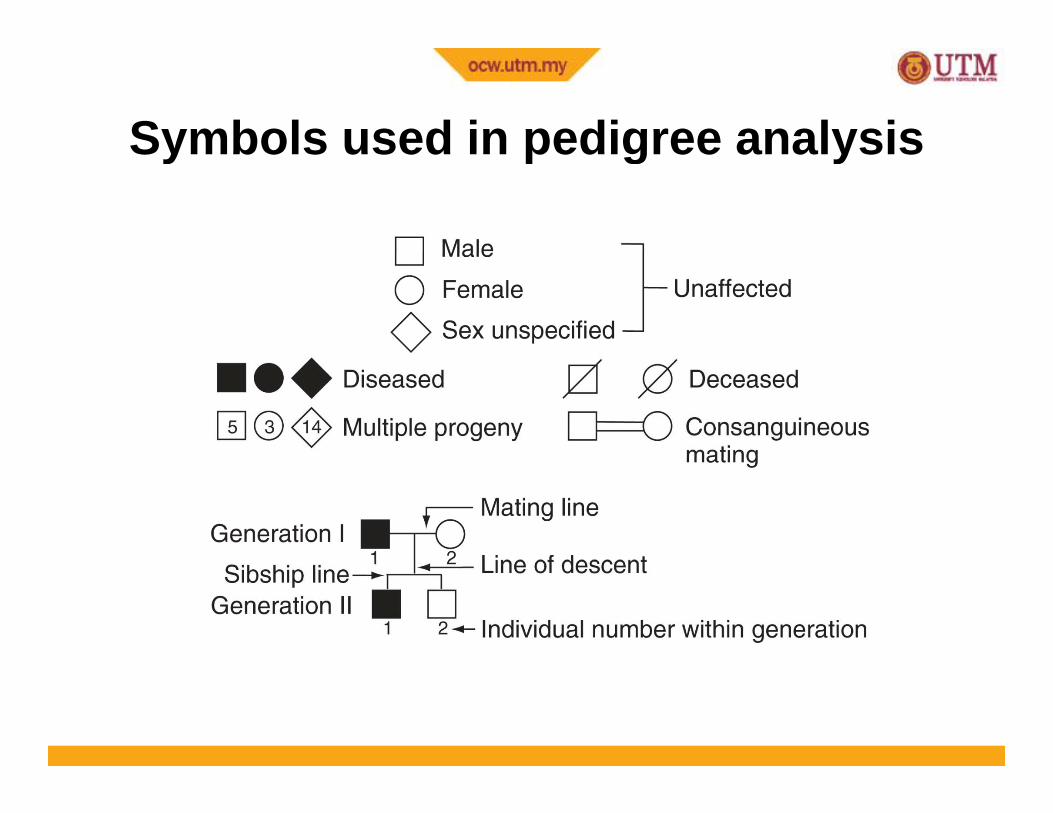
Symbols used in pedigree analysisSymbols used in pedigree analysis
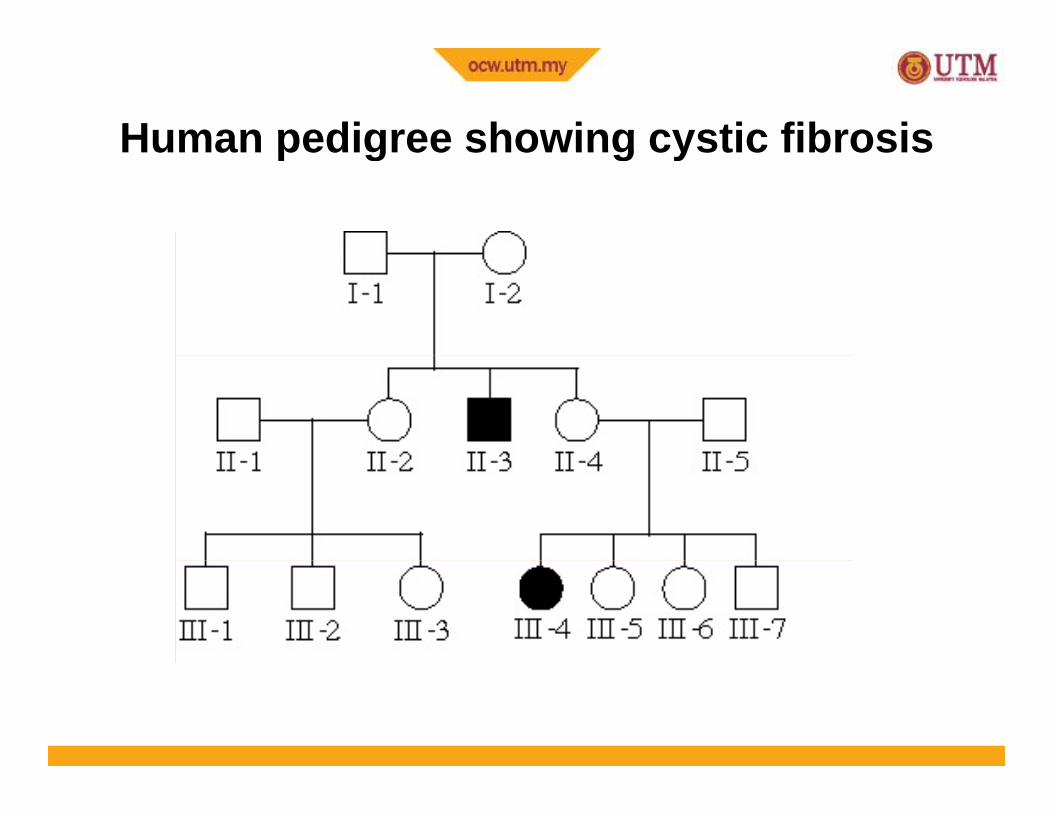
Human pedigree showing cystic fibrosisHuman pedigree showing cystic fibrosis
Dominant traits in pedigreesDominant traits in pedigrees
• Three key aspects:Three key aspects:1. Affected children always have at least
one affected parentone affected parent2. As a result, dominant traits show a
ti l tt f i h itvertical pattern of inheritance3. Two affected parents can produce
unaffected children, if both parents are heterozygotes
73
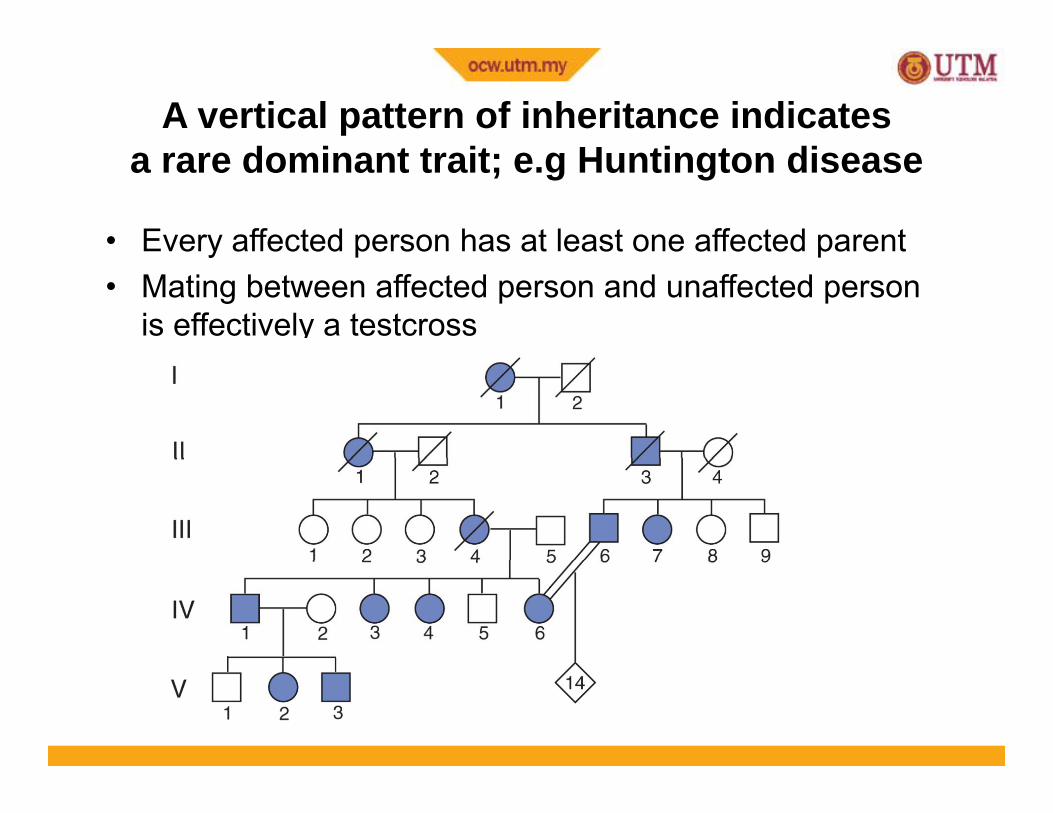
A vertical pattern of inheritance indicates d i t t it H ti t dia rare dominant trait; e.g Huntington disease
• Every affected person has at least one affected parenty p p• Mating between affected person and unaffected person
is effectively a testcross
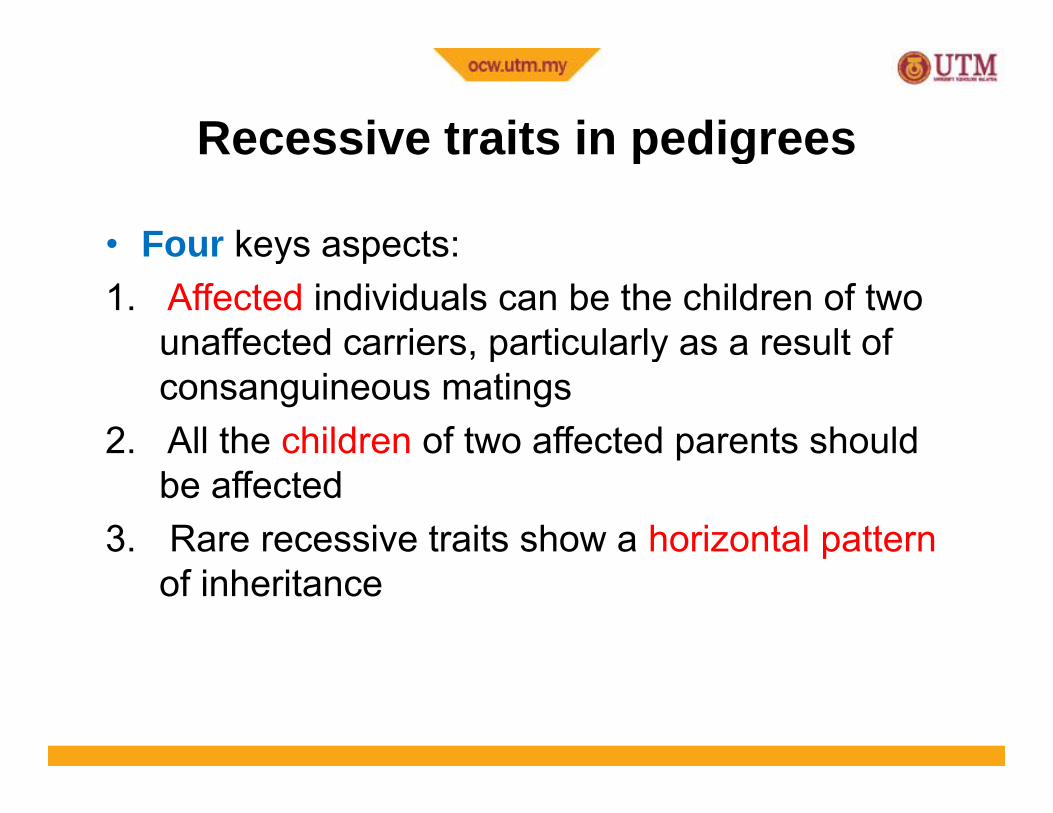
Recessive traits in pedigreesRecessive traits in pedigrees
• Four keys aspects:Four keys aspects:1. Affected individuals can be the children of two
unaffected carriers, particularly as a result of , p yconsanguineous matings
2. All the children of two affected parents should pbe affected
3. Rare recessive traits show a horizontal pattern of inheritance
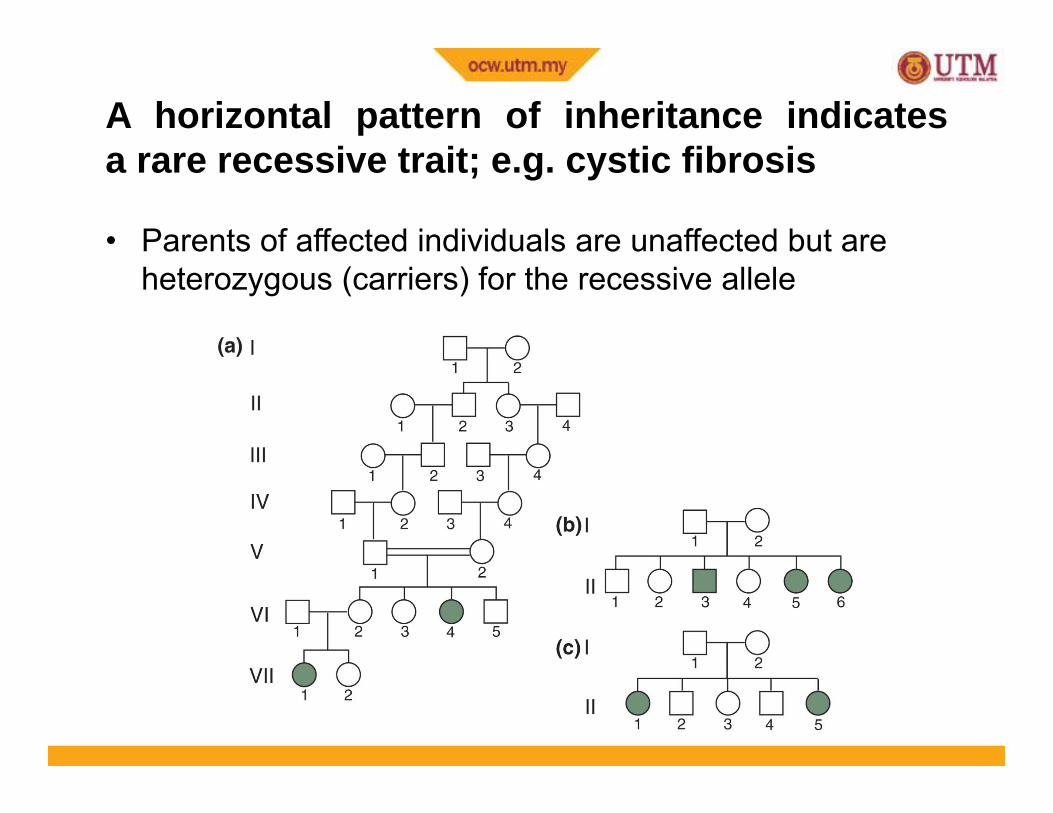
A horizontal pattern of inheritance indicatesi t it ti fib ia rare recessive trait; e.g. cystic fibrosis
• Parents of affected individuals are unaffected but are heterozygous (carriers) for the recessive allele
ReferencesReferences
• Snustad DP, Simmons, MJ (2010) Principles of Genetics , , ( ) pFifth Ed. John Wiley & Sons, Inc., USA.
• Klug WS, Cummings MR, Spencer CA, Palladino MA (2012) C t f G ti 10th Ed P(2012) Concepts of Genetics. 10th Ed. Pearson, California.
• Hartwell LH, Hood L, Goldberg ML,Reynolds AE, SilverHartwell LH, Hood L, Goldberg ML,Reynolds AE, Silver LM (2011) Genetics: From Genes to Genomes. 4th Ed. McGraw-Hill Companies, Inc.,NY