ch02 se
TRANSCRIPT

Section 1.1 Sets of Numbers and Interval Notation 103
IA
103
In this chapter we cover topics related to graphing and the applications ofgraphing. Graphs appear in magazines and newspapers and in other aspectsof day-to-day life. Furthermore, in many fields of study such as the sciencesand business, graphs are used to display data (information).
The following words are key terms used in this chapter. Search for themin the puzzle and in the text throughout the chapter. By the end of thischapter, you should be familiar with all of these terms.
Linear Equationsin Two Variables
2.1 The Rectangular Coordinate System and Midpoint
Formula
2.2 Linear Equations in Two Variables
2.3 Slope of a Line
2.4 Equations of a Line
2.5 Applications of Linear Equations and Graphing
22
W M V E P O L S W W M M R E N E FV D P D I D F K O O R Z J J P P QZ E R G N V R P W L X J C K A W JO H R I F F X P P E B P F P Y X SJ M V T I M T P E C R E T N I X CU R P N I W Y I N T E R C E P T RE W K N L C J V D Y Z R N G X D IT T D I V Y A Z L X N R T K A K VA N P G T E L L A Z T Q E H X V EN I R I N Y D K T T K N B T I Z ZI O W R A E H A N Y L K N A S Y XD P Q O R C E S O T X Q T S X K QR D A V D L T O Z C U N F R Y O JO I E F A O U G I T D A I D A P XO M C H U L T K R R Z C E K X T TC Y K I Q R U R O D W L N B I S UZ W J U R R P S H E C X M N S N N
Key Terms
coordinateoriginx-axisy-axisquadrantslope
midpointx-intercepty-intercepthorizontalvertical
miL2872X_ch02_103-176 09/14/2006 06:38 PM Page 103 CONFIRMING PAGES
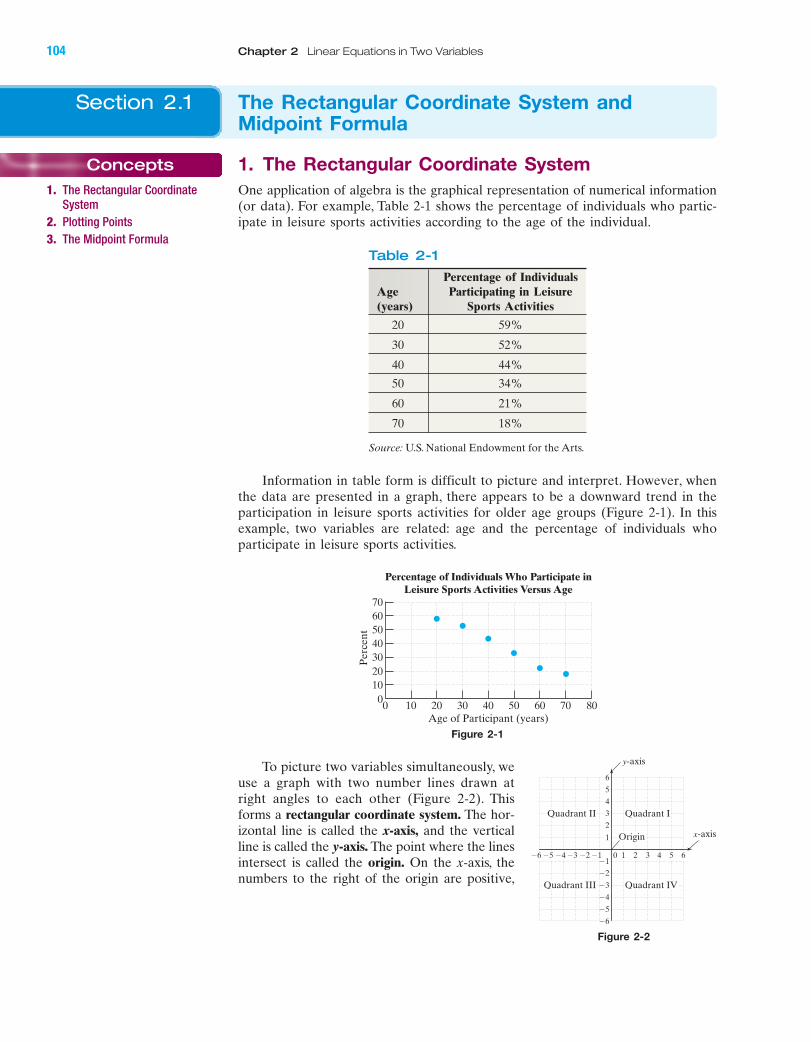
1. The Rectangular Coordinate SystemOne application of algebra is the graphical representation of numerical information
(or data). For example, Table 2-1 shows the percentage of individuals who partic-
ipate in leisure sports activities according to the age of the individual.
IA
104 Chapter 2 Linear Equations in Two Variables
Concepts
1. The Rectangular CoordinateSystem
2. Plotting Points3. The Midpoint Formula
Section 2.1 The Rectangular Coordinate System andMidpoint Formula
Table 2-1
Percentage of IndividualsAge Participating in Leisure(years) Sports Activities
20 59%
30 52%
40 44%
50 34%
60 21%
70 18%
Source: U.S. National Endowment for the Arts.
Information in table form is difficult to picture and interpret. However, when
the data are presented in a graph, there appears to be a downward trend in the
participation in leisure sports activities for older age groups (Figure 2-1). In this
example, two variables are related: age and the percentage of individuals who
participate in leisure sports activities.
70
60
50
40
30
20
10
00 10 20 30 40 50 60 70 80
Perc
en
t
Age of Participant (years)
Percentage of Individuals Who Participate inLeisure Sports Activities Versus Age
Figure 2-1
To picture two variables simultaneously, we
use a graph with two number lines drawn at
right angles to each other (Figure 2-2). This
forms a rectangular coordinate system. The hor-
izontal line is called the x-axis, and the vertical
line is called the y-axis. The point where the lines
intersect is called the origin. On the x-axis, the
numbers to the right of the origin are positive,
4 5�4�5�6 �3 10 2 3
�2
�3
�4
�5
�6
4
5
6
1
�1�2 6
3
2
�1
y-axis
x-axis
Quadrant IQuadrant II
Quadrant IVQuadrant III
Origin
Figure 2-2
miL2872X_ch02_103-176 09/14/2006 06:38 PM Page 104CONFIRMING PAGES
and the numbers to the left are negative. On the y-axis, the numbers above the
origin are positive, and the numbers below are negative. The x- and y-axes divide
the graphing area into four regions called quadrants.
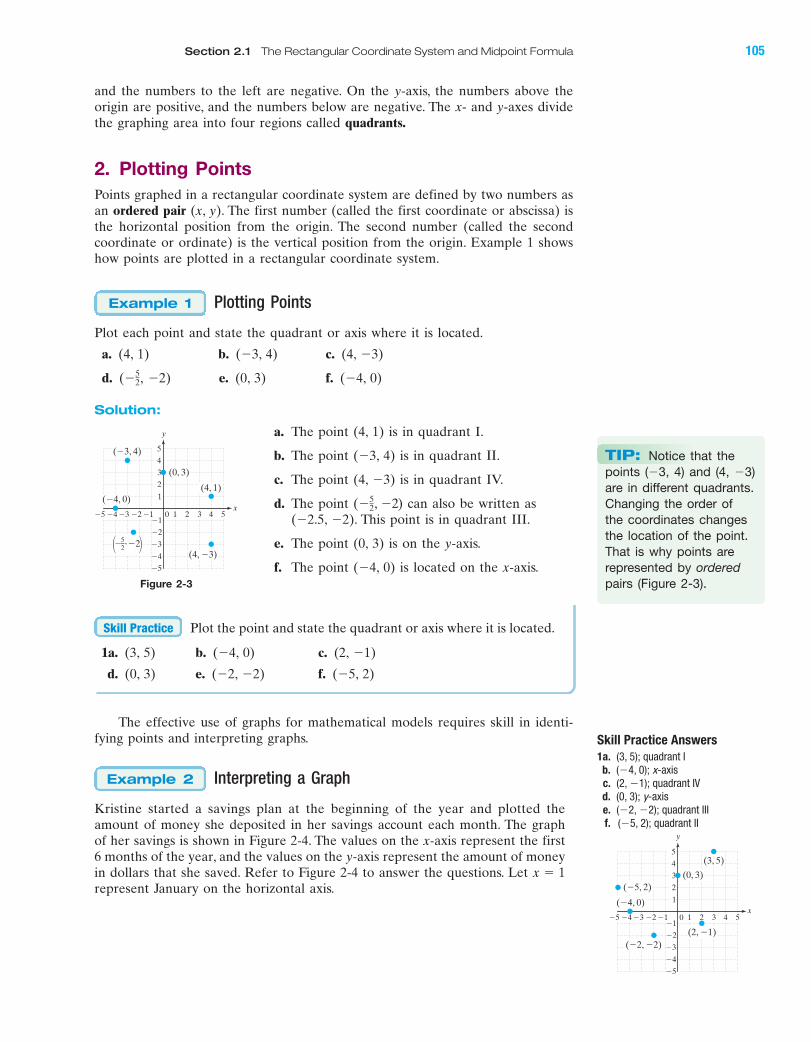
2. Plotting PointsPoints graphed in a rectangular coordinate system are defined by two numbers as
an ordered pair (x, y). The first number (called the first coordinate or abscissa) is
the horizontal position from the origin. The second number (called the second
coordinate or ordinate) is the vertical position from the origin. Example 1 shows
how points are plotted in a rectangular coordinate system.
IA
Section 2.1 The Rectangular Coordinate System and Midpoint Formula 105
Figure 2-3
Plotting Points
Plot each point and state the quadrant or axis where it is located.
a. (4, 1) b. (�3, 4) c. (4, �3)
d. ( �2) e. (0, 3) f. (�4, 0)
Solution:
�52,
Example 1
4 5�4�5 �3 1 2 3
�2
�3
�4
�5
4
(0, 3)
(4, 1)
(�3, 4) 5
1
�1�2
3
2
�10
(�4, 0)
(4, �3)
x
y
� �25
2,� �
a. The point (4, 1) is in quadrant I.
b. The point (�3, 4) is in quadrant ��.
c. The point (4, �3) is in quadrant IV.
d. The point ( ) can also be written as
(�2.5, �2). This point is in quadrant III.
e. The point (0, 3) is on the y-axis.
f. The point (�4, 0) is located on the x-axis.
�52, �2
Plot the point and state the quadrant or axis where it is located.
1a. (3, 5) b. (�4, 0) c. (2, �1)
d. (0, 3) e. (�2, �2) f. (�5, 2)
Skill Practice
TIP: Notice that thepoints (�3, 4) and (4, �3)are in different quadrants.Changing the order of the coordinates changesthe location of the point.That is why points arerepresented by orderedpairs (Figure 2-3).
The effective use of graphs for mathematical models requires skill in identi-
fying points and interpreting graphs. Skill Practice Answers
1a. (3, 5); quadrant Ib. (�4, 0); x-axisc. (2, �1); quadrant IVd. (0, 3); y-axise. (�2, �2); quadrant IIIf. (�5, 2); quadrant II
4 5�4�5 �3 1 2 3
�2
�3
�4
�5
4
(0, 3)
(3, 5)
(2, �1)
(�2, �2)
(�4, 0)
(�5, 2)
5
1
�1�2
3
2
�10
x
y
Interpreting a Graph
Kristine started a savings plan at the beginning of the year and plotted the
amount of money she deposited in her savings account each month. The graph
of her savings is shown in Figure 2-4. The values on the x-axis represent the first
6 months of the year, and the values on the y-axis represent the amount of money
in dollars that she saved. Refer to Figure 2-4 to answer the questions. Let
represent January on the horizontal axis.
x � 1
Example 2
miL2872X_ch02_103-176 09/14/2006 06:38 PM Page 105CONFIRMING PAGES

a. What is the y-coordinate when the x-coordinate is 6? Interpret the
meaning of the ordered pair in the context of this problem.
b. In which month did she save the most? How much did she save?
c. In which month did she save the least? How much did she save?
d. How much did she save in March?
e. In which two months did she save the same amount? How much did she
save in these months?
Solution:
a. When x is 6, the y-coordinate is 40. This means that in June, Kristine
saved $40.
b. The point with the greatest y-coordinate occurs when x is 2. She saved the
most money, $90, in February.
c. The point with the lowest y-coordinate occurs when x is 4. She saved the
least amount, $10, in April.
d. In March, the x-coordinate is 3 and the y-coordinate is 80. She saved $80
in March.
e. The two points with the same y-coordinate occur when and when
She saved $60 in both January and May.
Refer to Figure 2-4.
2a. In which month(s) did Kristine save $80?
b. How much did Kristine save in June?
c. What was the total amount saved during these 6 months?
3. The Midpoint FormulaConsider two points in the coordinate plane and the line segment determined by the
points. It is sometimes necessary to determine the point that is halfway between
the endpoints of the segment. This point is
called the midpoint. If the coordinates of the
endpoints are represented by and
then the midpoint of the segment is
given by the following formula.
Midpoint formula: ax1 � x2
2,
y1 � y2
2b
1x2, y22,1x1, y12
Skill Practice
x � 5.
x � 1
IA
106 Chapter 2 Linear Equations in Two Variables
100
80
60
40
20
00 1 2 3 4 5 6
Savin
gs
($)
Month
y
x
Figure 2-4
TIP: The scale on thex- and y-axes may bedifferent. This oftenhappens in applications.See Figure 2-4.
Skill Practice Answers
2a. Marchb. $40c. $340
x
y
(x2, y2)
(x1, y1)
x1 � x2
2( ),
y1 � y2
2
miL2872X_ch02_103-176 09/14/2006 06:38 PM Page 106CONFIRMING PAGES

Finding the Midpoint of a Segment
Find the midpoint of the line segment with the given endpoints.
a. and (8, 1) b. and
Solution:
a. and (8, 1)
Apply the midpoint formula.
Simplify.
The midpoint of the segment is
b. and
Apply the midpoint formula.
Simplify.
Find the midpoint of the line segment with the given endpoints.
3. (5, 6) and (�10, 4) 4. (�2.6, �6.3) and (1.2, 4.1)
Applying the Midpoint Formula
A map of a national park is created so that the ranger station is at the origin of
a rectangular grid. Two hikers are located at positions (2, 3) and with re-
spect to the ranger station, where all units are in miles. The hikers would like to
meet at a point halfway between them (Figure 2-5), but they are too far apart to
communicate their positions to each other via radio. However, the hikers are both
within radio range of the ranger station. If the ranger station relays each hiker’s
position to the other, at what point on the map should the hikers meet?
1�5, �22
Example 4
Skill Practice
1�3.9, �0.952a�1.2 � �6.6
2,
�3.1 � 1.2
2b
1�6.6, 1.221�1.2, �3.12
12, 72 2.a2,
7
2b
a�4 � 8
2,
6 � 1
2b
1�4, 62
1�6.6, 1.221�1.2, �3.121�4, 62
Example 3
IA
Skill Practice Answers
3. 4. 1�0.7,�1.12a�52
, 5b
x
y
4 5�4�5�6 �3 10 2 3
�2
�3
�4
�5
�6
4
5
6
1
�1�2 6
3
2
�1
(�5, �2)
(2, 3)
Hiker 1
Hiker 2
Ranger
Station
Figure 2-5
Section 2.1 The Rectangular Coordinate System and Midpoint Formula 107
TIP: The midpoint of a line segment is found by taking the average of the x-coordinates and the average of the y-coordinates of the endpoints.
miL2872X_ch02_103-176 09/14/2006 06:38 PM Page 107CONFIRMING PAGES

Solution:
To find the halfway point on the line segment between the two hikers, apply the
midpoint formula:
(2, 3) and
and
Apply the midpoint formula.
Simplify.
The halfway point between the hikers is located at or .
5. Find the center of the circle in the figure,
given that the endpoints of a diameter are
(3, 2) and (7, 10).
Skill Practice
1�1.5, 0.521�32,
12 2
a�3
2,
1
2b
a2 � 1�522
, 3 � 1�22
2b
ax1 � x2
2,
y1 � y2
2b
1x2, y221x1, y121�5, �22
IA
108 Chapter 2 Linear Equations in Two Variables
(3, 2)
(7, 10)
y
x
Skill Practice Answers
5. 15, 62
Study Skills Exercises
1. After getting a test back, it is a good idea to correct the test so that you do
not make the same errors again. One recommended approach is to use a
clean sheet of paper, and divide the paper down the middle vertically, as
shown. For each problem that you missed on the test, rework the problem
correctly on the left-hand side of the paper. Then give a written explanation
on the right-hand side of the paper. To reinforce the correct procedure, return
to the section of text from which the problem was taken and do several more
problems.
Take the time this week to make corrections from your last test.
Boost your GRADE atmathzone.com!
• Practice Problems • e-Professors
• Self-Tests • Videos
• NetTutor
Section 2.1 Practice Exercises
Performthe correctmath here.
2 � 4(5)� 2 � 20� 22
Explain theprocess here.
Domultiplication
beforeaddition.
miL2872X_ch02_103-176 09/14/2006 06:38 PM Page 108CONFIRMING PAGES

2. Define the key terms.
a. Rectangular coordinate system b. x-Axis c. y-Axis
d. Origin e. Quadrant f. Ordered pair
g. Midpoint
Concept 1: The Rectangular Coordinate System
3. Given the coordinates of a point, explain how to determine which quadrant the point is in.
4. What is meant by the word ordered in the term ordered pair?
Concept 2: Plotting Points
5. Plot the points on a rectangular coordinate system.
a. b.
c. d.
e. f.
6. Plot the points on a rectangular coordinate system.
a. b.
c. d.
e. f.
7. A point on the x-axis will have what y-coordinate?
8. A point on the y-axis will have what x-coordinate?
For Exercises 9–12, give the coordinates of the labeled points, and state the quadrant or axis where the point is
located.
9. 10.
4 5�4 �3 1 3
�2
�3
�5
4
5
1
�1�2
3
2
�12�5
A
C
B
D
E
�4
x
y
4 5�4 �3 1 3
�2
�3
�5
4
5
1
�1�2
3
2
�12�5
A
CB
DE
�4
x
y
1�3, �3212, 2210, �2214, �32a5
2, 0b1�2, 52
1�4.1, �2.72a3
2, �
7
3b
1�3, 0210, 0210, 421�2, 12
IA
4 5�4�5 �3 1 2 3
�2
�3
�4
�5
4
5
1
�1�2
3
2
�1
x
y
4 5�4�5 �3 1 2 3
�2
�3
�4
4
5
6
1
�1�2
3
2
�1
x
y
Section 2.1 The Rectangular Coordinate System and Midpoint Formula 109
miL2872X_ch02_103-176 09/14/2006 06:39 PM Page 109CONFIRMING PAGES

11. 12.
For Exercises 13–14, refer to the graphs to answer the questions.
13. The fact that obesity is increasing in both children and adults is of great concern to health care providers.
One way to measure obesity is by using the body mass index. Body mass is calculated based on the height
and weight of an individual. The graph shows the relationship between body mass index and weight for a
person who is tall.5¿6–
4 5�4�5 �3 1 2 3
�2
�3
�4
�5
4
5
1
�1�2
3
2
�10
x
y
A
C
D
E
B4 5�4 �3 1 3
�2
�3
�5
4
5
1
�1�2
3
2
�12�5
A
C
B
DE
�4
x
y
110 Chapter 2 Linear Equations in Two Variables
142 150 158 166 174 182 190 198 206
Bo
dy M
ass
In
dex
Weight (lb)
25
30
35
5
0
15
20
10
x
y
a. What is the body mass index for a 5¿6– person who weighs 154 lb?
b. What is the weight of a 5¿6– person whose body mass index is 29?
14. The graph shows the number of cases of West Nile virus reported in Colorado during the months of May
through October 2005. The month of May is represented by on the x-axis. (Source: Centers for Disease
Control.)
x � 1
210 3 4 5 6
Nu
mb
er
of
Case
s
Month (x � 1 corresponds to May)
30
40
50
10
0
20
x
y
Number of Cases of West Nile Virus(Colorado, 2005)
a. Which month had the greatest number of cases reported? Approximately how many cases were
reported?
b. Which month had the fewest cases reported? Approximately how many cases were reported?
c. Which months had fewer than 10 cases of the virus reported?
d. Approximately how many cases of the virus were reported in August?
IAmiL2872X_ch02_103-176 09/14/2006 06:39 PM Page 110CONFIRMING PAGES
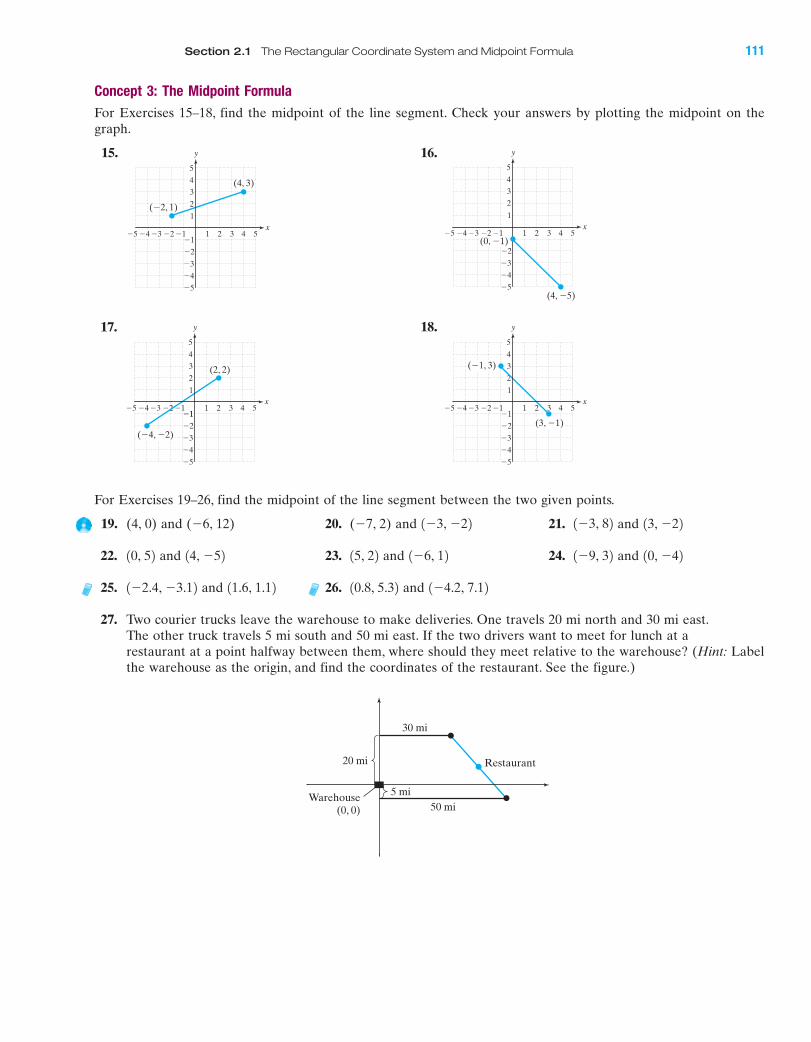
Concept 3: The Midpoint Formula
For Exercises 15–18, find the midpoint of the line segment. Check your answers by plotting the midpoint on the
graph.
15. 16.
17. 18.
For Exercises 19–26, find the midpoint of the line segment between the two given points.
19. (4, 0) and (�6, 12) 20. (�7, 2) and 21. and
22. and 23. and 24. and
25. and 26. and
27. Two courier trucks leave the warehouse to make deliveries. One travels 20 mi north and 30 mi east.
The other truck travels 5 mi south and 50 mi east. If the two drivers want to meet for lunch at a
restaurant at a point halfway between them, where should they meet relative to the warehouse? (Hint: Label
the warehouse as the origin, and find the coordinates of the restaurant. See the figure.)
1�4.2, 7.1210.8, 5.3211.6, 1.121�2.4, �3.1210, �421�9, 321�6, 1215, 2214, �5210, 5213, �221�3, 821�3, �22
4 5�4�5 �3 1 2 3
�2
�3
�4
�5
4
5
1
�1�2
3
2
�1
x
y
(3, �1)
(�1, 3)
4 5�4�5 �3 1 2 3
�2
�1
�3
�4
�5
4
5
1
�1�2
3
2
�1
x
y
(�4, �2)
(2, 2)
4 5�4�5 �3 1 2 3
�2
�3
�4
�5
4
5
1
�1�2
3
2
x
y
(0, �1)
(4, �5)
4 5�4�5 �3 1 2 3
�2
�3
�4
�5
4 (4, 3)
5
1
�1�2
3
2
�1
x
y
(�2, 1)
Restaurant
5 mi
50 miWarehouse
(0, 0)
30 mi
20 mi
IA
Section 2.1 The Rectangular Coordinate System and Midpoint Formula 111
miL2872X_ch02_103-176 09/14/2006 06:39 PM Page 111CONFIRMING PAGES

28. A map of a hiking area is drawn so that the Visitor Center is at the origin of a rectangular grid. Two hikers
are located at positions and with respect to the Visitor Center where all units are in miles. A
campground is located exactly halfway between the hikers. What are the coordinates of the campground?
1�3, �221�1, 12
112 Chapter 2 Linear Equations in Two Variables
4 5�4�5 �3 1 2 3
�2
�3
�4
�5
4
(0, 0)
5
1
�1�2
3
2
�10
(�1, 1)
x
y
Visitor Center
(�3, �2)Hiker 2
Hiker 1
29. Find the center of a circle if a diameter of the circle has endpoints and (3, 4).
30. Find the center of a circle if a diameter of the circle has endpoints and .17, �121�3, 321�1, 22
Section 2.2 Linear Equations in Two Variables
Concepts
1. Linear Equations in TwoVariables
2. Graphing Linear Equations inTwo Variables
3. x-Intercepts and y-Intercepts4. Horizontal and Vertical Lines
1. Linear Equations in Two VariablesRecall from Section 1.4 that an equation in the form is called a lin-
ear equation in one variable. In this section we will study linear equations in
two variables.
ax � b � 0
Linear Equation in Two Variables
Let A, B, and C be real numbers such that A and B are not both zero. A lin-ear equation in two variables is an equation that can be written in the form
This form is called standard form.Ax � By � C
A solution to a linear equation in two variables is an ordered pair that
makes the equation a true statement.
Determining Solutions to a Linear Equation
For the linear equation determine whether the order pair is a
solution.
a. b. c. a1, 10
3b12, �421�4, 02
�2x � 3y � 8,
Example 1
1x, y2
IAmiL2872X_ch02_103-176 09/14/2006 06:39 PM Page 112CONFIRMING PAGES
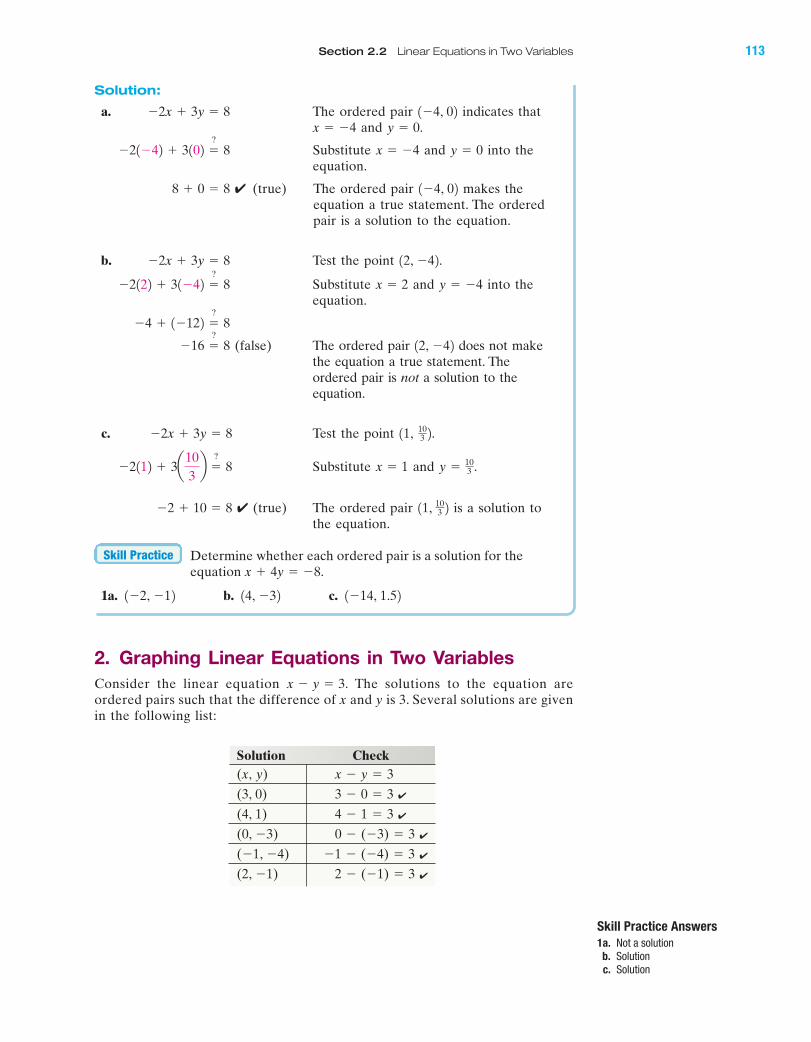
Solution:
a. The ordered pair indicates that
and
Substitute and into the
equation.
✔ (true) The ordered pair makes the
equation a true statement. The ordered
pair is a solution to the equation.
b. Test the point .
Substitute and into the
equation.
(false) The ordered pair does not make
the equation a true statement. The
ordered pair is not a solution to the
equation.
c. Test the point .
Substitute and
✔ (true) The ordered pair is a solution to
the equation.
Determine whether each ordered pair is a solution for the
equation
1a. b. c. 1�14, 1.5214, �321�2, �12x � 4y � �8.
Skill Practice
11, 103 2 �2 � 10 � 8
y � 103 .x � 1 �2112 � 3a10
3b �
?
8
11, 103 2 �2x � 3y � 8
12, �42 �16 �?
8
�4 � 1�122 �?
8
y � �4x � 2 �2122 � 31�42 �?
8
12, �42 �2x � 3y � 8
1�4, 02 8 � 0 � 8
y � 0x � �4 �21�42 � 3102 �?
8
y � 0.x � �4
1�4, 02 �2x � 3y � 8
Section 2.2 Linear Equations in Two Variables 113
Skill Practice Answers
1a. Not a solutionb. Solutionc. Solution
2. Graphing Linear Equations in Two VariablesConsider the linear equation The solutions to the equation are
ordered pairs such that the difference of x and y is 3. Several solutions are given
in the following list:
Solution Check(x, y) x � y � 3
(3, 0) 3 � 0 � 3
(4, 1) 4 � 1 � 3
(0, �3) 0 � (�3) � 3
(�1, �4) �1 � (�4) � 3
(2, �1) 2 � (�1) � 3
x � y � 3.
IA
✔
✔
✔
✔
✔
miL2872X_ch02_103-176 09/14/2006 06:39 PM Page 113CONFIRMING PAGES

By graphing these ordered pairs, we see that the solu-
tion points line up (see Figure 2-6). There are actually
an infinite number of solutions to the equation
The graph of all solutions to a linear equa-
tion forms a line in the xy-plane. Conversely, each
ordered pair on the line is a solution to the equation.
To graph a linear equation, it is sufficient to find
two solution points and draw the line between them.
We will find three solution points and use the third
point as a check point. This is demonstrated in
Example 2.
Graphing a Linear Equation in Two Variables
Graph the equation
Solution:
We will find three ordered pairs that are solutions to the equation. In the table,
we have selected arbitrary values for x or y and must complete the ordered
pairs.
3x � 5y � 15.
Example 2
x � y � 3.
x y
0 (0, )
2 ( , 2)
5 (5, )
From the first row, From the second row, From the third row,
substitute substitute substitute
The completed list of ordered pairs is shown as follows. To graph the equation,
plot the three solutions and draw the line through the points (Figure 2-7). Arrows
on the ends of the line indicate that points on the line extend infinitely in both
directions.
y � 0 x �5
3
5y � 0 3x � 5 y � 3
15 � 5y � 15 3x � 10 � 15 5y � 15
3152 � 5y � 15 3x � 5122 � 15 3102 � 5y � 15
3x � 5y � 15 3x � 5y � 15 3x � 5y � 15
x � 5.y � 2.x � 0.
114 Chapter 2 Linear Equations in Two Variables
4 5�4�5 �3 1 2 3
�2
�4
�5
4
(4, 1)
(3, 0)
(2, �1)
(�1, �4)
5
1
�1�2
3
2
�1
(0, �3)
x
y
�3
Figure 2-6
x y
0 3 (0, 3)
2
5 0 (5, 0)
Q53, 2R53
Figure 2-7
4 5�4 �3 1 3
�2
�3
�5
4
5
1
�1�2
3
2
�12�5
�4
x
y
(0, 3)
( , 2)
(5, 0)
53
3x � 5y � 15
IAmiL2872X_ch02_103-176 09/14/2006 06:39 PM Page 114CONFIRMING PAGES

Section 2.2 Linear Equations in Two Variables 115
Skill Practice Answers
2.
3.
4 5�4�5 �3 1 2 3
�2
�3
�4
�5
4
5
1
�1�2
3
2
�1
x
y
(0, �1)
(1, 1)
(3, 5)
2x � y � 1
x y
0
5
1
2. Given complete the table and graph the line through the points.2x � y � 1,
Skill Practice
x y
0
2
4
Figure 2-8
x y
0
2
4 0 (4, 0)
12, �12�1
10, �22�2
Graphing a Linear Equation in Two Variables
Graph the equation
Solution:
Because the y-variable is isolated in the equation, it is easy to substitute a value
for x and simplify the right-hand side to find y. Since any number for x can be
used, choose numbers that are multiples of 2 that will simplify easily when mul-
tiplied by
Substitute Substitute Substitute
The completed list of ordered pairs is as follows. To graph the equation, plot
the three solutions and draw the line through the points (Figure 2-8).
y � 0 y � �1 y � �2
y � 2 � 2 y � 1 � 2 y � 0 � 2
y �1
2 142 � 2 y �
1
2 122 � 2 y �
1
2 102 � 2
x � 4.x � 2.x � 0.
12.
y �1
2 x � 2.
Example 3
4 5�4�5 �3 1 2 3
�2
�3
�4
�5
4
5
1
�1�2
3
2
�1
x
y
y � x � 212
(4, 0)
(2, �1)(0, �2)
3. Graph the equation Hint: Select values of x that are multiples of 3.y � �1
3x � 1.
Skill Practice
4 5�4�5 �3 1 2 3
�2
�3
�4
�5
4
5
1
�1�2
3
2
�1
x
y
y � � x � 113
IAmiL2872X_ch02_103-176 09/14/2006 06:39 PM Page 115CONFIRMING PAGES

3. x-Intercepts and y-InterceptsFor many applications of graphing, it is advantageous to know the points where
a graph intersects the x- or y-axis. These points are called the x- and y-intercepts.
In Figure 2-7, the x-intercept is (5, 0). In Figure 2-8, the x-intercept is (4, 0).
In general, a point on the x-axis must have a y-coordinate of zero. In Figure 2-7,
the y-intercept is (0, 3). In Figure 2-8, the y-intercept is In general, a
point on the y-axis must have an x-coordinate of zero.
10, �22.
To find the x- and y-intercepts from an equation in x and y, follow these steps:
116 Chapter 2 Linear Equations in Two Variables
x
y
(0, b)
(a, 0)
IA
Figure 2-9
Definition of x- and y-Intercepts
An x-intercept* is a point where a graph intersects the x-axis. (see
Figure 2-9.)
A y-intercept is a point where a graph intersects the y-axis. (see
Figure 2-9.)
*In some applications, an x-intercept is defined as the x-coordinate of a point of intersection
that a graph makes with the x-axis. For example, if an x-intercept is at the point (3, 0), it is sometimes
stated simply as 3 (the y-coordinate is understood to be zero). Similarly, a y-intercept is sometimes
defined as the y-coordinate of a point of intersection that a graph makes with the y-axis. For example,
if a y-intercept is at the point (0, 7), it may be stated simply as 7 (the x-coordinate is understood to
be zero).
10, b2
1a, 02
Steps to Find the x- and y-Intercepts from an Equation
Given an equation in x and y,
1. Find the x-intercept(s) by substituting into the equation and
solving for x.
2. Find the y-intercept(s) by substituting into the equation and
solving for y.
x � 0
y � 0
Finding the x- and y-Intercepts of a Line
Find the x- and y-intercepts of the line . Then graph the line.
Solution:
To find the x-intercept, substitute To find the y-intercept, substitute
.
The x-intercept is (4, 0). The y-intercept is (0, 2).
In this case, the intercepts are two distinct points and may be used to graph
the line. A third point can be found to verify that the points all fall on the
same line (points that lie on the same line are said to be collinear). Choose a
different value for either x or y, such as .y � 4
y � 2x � 4
4y � 82x � 8
2102 � 4y � 82x � 4102 � 8
2x � 4y � 82x � 4y � 8
x � 0y � 0.
2x � 4y � 8
Example 4
miL2872X_ch02_103-176 09/14/2006 06:39 PM Page 116CONFIRMING PAGES
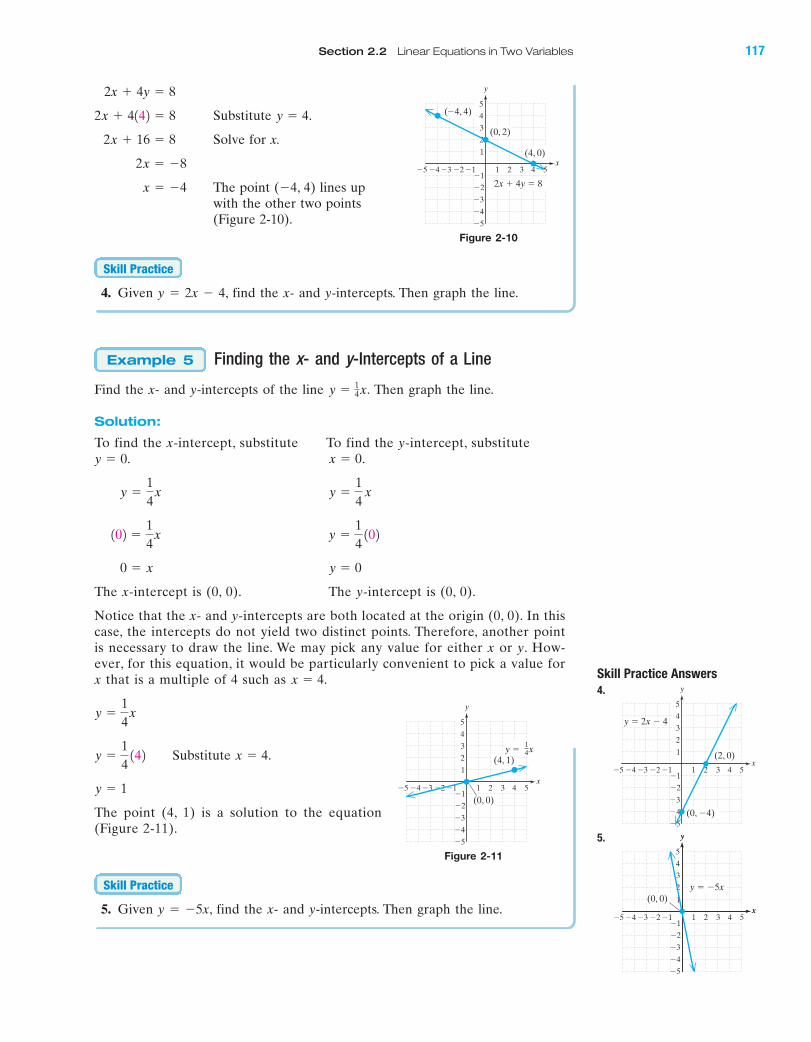
Section 2.2 Linear Equations in Two Variables 117
IA
Substitute .
Solve for x.
The point (�4, 4) lines up
with the other two points
(Figure 2-10).
4. Given y � 2x � 4, find the x- and y-intercepts. Then graph the line.
Finding the x- and y-Intercepts of a Line
Find the x- and y-intercepts of the line Then graph the line.
Solution:
To find the x-intercept, substitute To find the y-intercept, substitute
.
The x-intercept is (0, 0). The y-intercept is (0, 0).
Notice that the x- and y-intercepts are both located at the origin (0, 0). In this
case, the intercepts do not yield two distinct points. Therefore, another point
is necessary to draw the line. We may pick any value for either x or y. How-
ever, for this equation, it would be particularly convenient to pick a value for
x that is a multiple of 4 such as
Substitute
The point (4, 1) is a solution to the equation
(Figure 2-11).
5. Given y � �5x, find the x- and y-intercepts. Then graph the line.
Skill Practice
y � 1
x � 4.y �1
4 142
y �1
4x
x � 4.
y � 00 � x
y �1
4 102102 �
1
4x
y �1
4 xy �
1
4x
x � 0y � 0.
y � 14x.
Example 5
Skill Practice
x � �4
2x � �8
2x � 16 � 8
y � 42x � 4142 � 8
2x � 4y � 8
Figure 2-10
4 5�4�5 �3 1 2 3
�2
�3
�4
�5
4
5
1
�1�2
3
2
�1
x
y
(4, 0)
(0, 2)
(�4, 4)
2x � 4y � 8
Figure 2-11
4 5�4�5 �3 1 2 3
�2
�3
�4
�5
4
5
1
�1�2
3
2
�1
x
y
(0, 0)
(4, 1)y � x
14
Skill Practice Answers
4.
5.
4 5�4�5 �3 1 2 3
�2
�3
�4
�5
4
5
1
�1�2
3
2
�1
x
y
y � �5x
x
y
(0, 0)
4 5�4�5 �3 1 2 3
�2
�3
�4
�5
4
5
1
�1�2
3
2
�1
x
y
y � 2x � 4
(2, 0)
(0, �4)
miL2872X_ch02_103-176 09/14/2006 06:39 PM Page 117CONFIRMING PAGES

Interpreting the x- and y-Intercepts of a Line
Companies and corporations are permitted to depreciate assets that have a
known useful life span. This accounting practice is called straight-line deprecia-tion. In this procedure the useful life span of the asset is determined, and then
the asset is depreciated by an equal amount each year until the taxable value of
the asset is equal to zero.
The J. M. Gus trucking company purchases a new truck for $65,000. The truck
will be depreciated at $13,000 per year. The equation that describes the depreci-
ation line is
where y represents the value of the truck in dollars and x is the age of the
truck in years.
a. Find the x- and y-intercepts. Plot the intercepts on a rectangular coordinatesystem, and draw the line that represents the straight-line depreciation.
b. What does the x-intercept represent in the context of this problem?
c. What does the y-intercept represent in the context of this problem?
Solution:
a. To find the x-intercept, substitute To find the y-intercept, substitute
The x-intercept is (5, 0). The y-intercept is (0, 65,000).
x � 5
y � 65,00013,000x � 65,000
y � 65,000 � 13,0001020 � 65,000 � 13,000x
x � 0.y � 0.
y � 65,000 � 13,000x
Example 6
70,000
60,000
50,000
40,000
30,000
20,000
10,000
00 1 2 3 4 5 6
x
y
Taxab
le V
alu
e (
$)
Age (years)
Taxable Value of a Truck Versusthe Age of the Vehicle
b. The x-intercept (5, 0) indicates that when the truck is 5 years old, the
taxable value of the truck will be $0.
c. The y-intercept (0, 65,000) indicates that when the truck was new (0 years
old), its taxable value was $65,000.
6. Acme motor company tests the engines of its trucks by running the
engines in a laboratory. The engines burn 4 gal of fuel per hour. The
engines begin the test with 30 gal of fuel. The equation y � 30 – 4xrepresents the amount of fuel y left in the engine after x hours.
a. Find the x- and y-intercepts.
b. Interpret the y-intercept in the context of this problem.
c. Interpret the x-intercept in the context of this problem.
Skill Practice
118 Chapter 2 Linear Equations in Two Variables
IA
Skill Practice Answers
6a. x-intercept: (7.5, 0); y-intercept:(0, 30)
b. The y-intercept (0, 30) representsthe amount of fuel in the truckinitially (after 0 hr). After 0 hr, thetank contains 30 gal of fuel.
c. The x-intercept (7.5, 0) representsthe amount of fuel in the truckafter 7.5 hr. After 7.5 hr the tankcontains 0 gal. It is empty.
miL2872X_ch02_103-176 09/14/2006 06:39 PM Page 118CONFIRMING PAGES
Section 2.2 Linear Equations in Two Variables 119
IA
Skill Practice Answers
7.
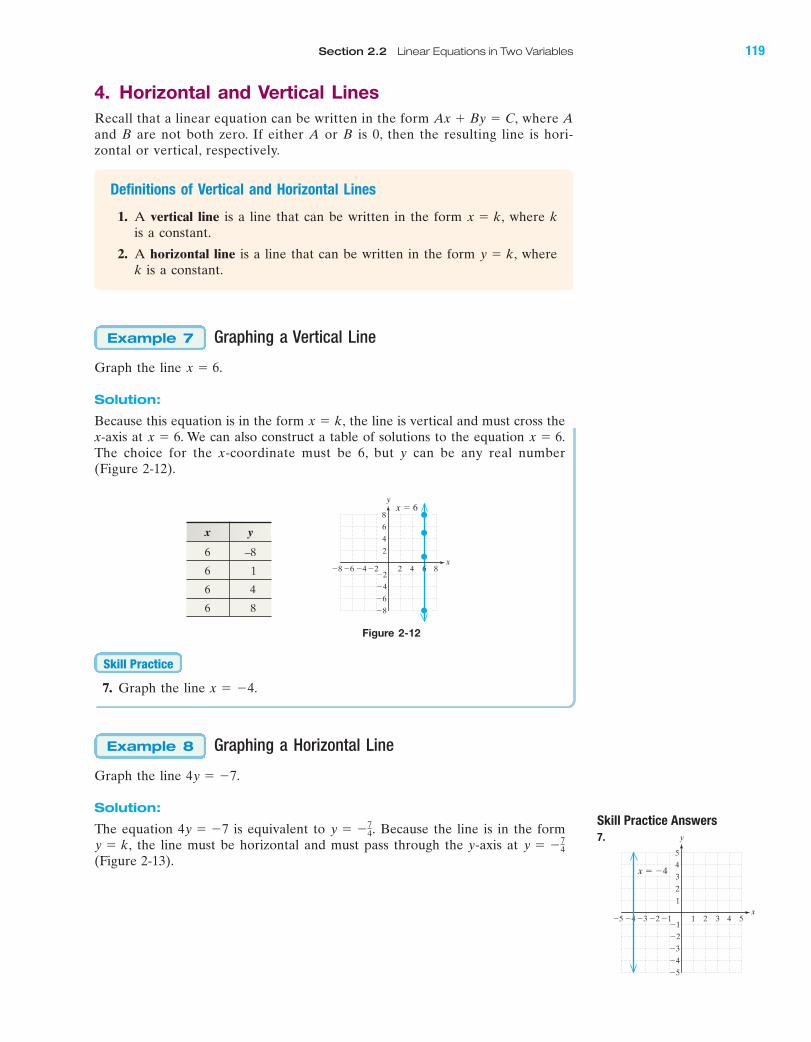
4. Horizontal and Vertical LinesRecall that a linear equation can be written in the form where Aand B are not both zero. If either A or B is 0, then the resulting line is hori-
zontal or vertical, respectively.
Definitions of Vertical and Horizontal Lines
1. A vertical line is a line that can be written in the form where kis a constant.
2. A horizontal line is a line that can be written in the form where
k is a constant.
Graphing a Vertical Line
Graph the line
Solution:
Because this equation is in the form the line is vertical and must cross the
x-axis at . We can also construct a table of solutions to the equation .
The choice for the x-coordinate must be 6, but y can be any real number
(Figure 2-12).
x � 6x � 6
x � k,
x � 6.
Example 7
y � k,
x � k,
Ax � By � C,
Figure 2-12
7. Graph the line x � �4.
Graphing a Horizontal Line
Graph the line
Solution:
The equation is equivalent to Because the line is in the form
the line must be horizontal and must pass through the y-axis at
(Figure 2-13).
y � �74y � k,
y � �74.4y � �7
4y � �7.
Example 8
Skill Practice
x y
6 –8
6 1
6 4
6 8
8�8 �6 2 4
�4
�6
�8
8
2
�2�4
6
4
�2
x
yx � 6
6
4 5�4�5 �3 1 2 3
�2
�3
�4
�5
4
5
1
�1�2
3
2
�1
x
y
x � �4
miL2872X_ch02_103-176 09/14/2006 06:39 PM Page 119CONFIRMING PAGES

120 Chapter 2 Linear Equations in Two Variables
IA
8. Graph the line –2y � 9.
Skill Practice
x y
0
2 �74
�74�3
�74
A viewing window of a graphing calculator shows a portion of a rectangular
coordinate system. The standard viewing window for most calculators shows
both the x- and y-axes between �10 and 10. Furthermore, the scale defined
by the tick marks on both axes is usually set to 1.
Linear equations can be analyzed with a graphing calculator.
• It is important to isolate the y-variable in the equation. Then enter the
equation in the calculator. For example, to enter the equation from Exam-
ple 4, we have:
• A Table feature can be used to find many
solutions to an equation. Several solutions to
are shown here.y � �1
2 x � 2
y � �1
2 x � 2
4y
4�
�2x4
�8
4
4y � �2x � 82x � 4y � 8
Calculator Connections
Skill Practice Answers
8.
4 5�4�5 �3 1 2 3
�2
�3
�4
�5
4
5
1
�1�2
3
2
�1
x
y
�2y � 9
Figure 2-13
4�4 �3 1 2
�2
�3
�4
4
1
�1�2
3
2
�1
x
y
3
y � �74
The standard viewing window.
We can also construct a table of solutions to the equation . The choice
for the y-coordinate must be , but x can be any real number.�74
4y � �7
miL2872X_ch02_103-176 09/14/2006 06:39 PM Page 120CONFIRMING PAGES

Section 2.2 Linear Equations in Two Variables 121
Study Skills Exercises
1. A good technique for studying for a test is to choose four problems from each section of the chapter and
write each of them along with the directions on a 3 � 5 card. On the back, put the page number where
you found that problem. Then shuffle the cards and test yourself on the procedure to solve each problem.
For any that you do not know how to solve, look at the page number and do several of that type. Write
which four problems you would choose for this section.
2. Define the key terms.
a. Linear equation in two variables b. x-Intercept c. y-Intercept
d. Vertical line e. Horizontal line
IA
• A Graph feature can be used to graph
a line.
Sometimes the standard viewing window does
not provide an adequate display for the graph
of an equation. For example, in the standard
viewing window, the graph of y � �x � 15 is
visible only in a small portion of the upper
right corner.
To see the x- and y-intercepts of this line, we can change the viewing win-
dow to accommodate larger values of x and y. Most calculators have a Rangeor Window feature that enables the user to change the minimum and maxi-
mum x- and y-values. In this case, we changed the values of x to range
between �5 and 20, and the values of y to range between �10 and 20.
Boost your GRADE atmathzone.com!
• Practice Problems • e-Professors
• Self-Tests • Videos
• NetTutor
Section 2.2 Practice Exercises
miL2872X_ch02_103-176 09/14/2006 06:39 PM Page 121CONFIRMING PAGES

x y
0
5
�5
x y
0
3
6
4 5�4�5 �3 1 2 3
�2
�3
�4
�5
4
5
1
�1�2
y
x
3
2
�14 5�4�3 1 2 3
�2
�3
�4
�5
4
5
1
�1�2
y
6x
3
2
�1
122 Chapter 2 Linear Equations in Two Variables
Review Exercises
3. Plot each point on a rectangular coordinate system, and identify the quadrant or axis where it is located.
a. b. c. C(4, 2) d. D10, �42B1�1, �12A12, �32
4 5�4�5 �3 1 2 3
�2
�3
�4
�5
4
5
1
�1�2
y
x
3
2
�1
For Exercises 4–6, find the midpoint of the line segment between the given points. Check your answer by
graphing the line segment and midpoint.
4. and 5. (7, 8) and 6. and
Concept 1: Linear Equations in Two Variables
For Exercises 7–10, determine if the ordered pair is a solution to the linear equation.
7. 8. 9. 10.
a. a. (0, 3) a. a.
b. b. b. (2, 3) b.
c. c. c. c.
Concept 2: Graphing Linear Equations in Two Variables
For Exercises 11–14, complete the table. Then graph the line defined by the points.
11. 12. 4x � 3y � 63x � 2y � 4
1�4, �221�6, 121�2, 22a1, �7
3b
12, �72a�6
5, 0b1�6, 12
10, �421�1, 0210, �32y � �
3
2x � 4x �
1
3y � 1�5x � 2y � 62x � 3y � 9
1�2, 021�2, 1021�4, 121�15, �121�3, 12
x y
0
4
�1
x y
2
3
�1
4 5�4�5 �3 1 2 3
�2
�3
�4
�5
4
5
1
�1�2
y
x
3
2
�14 5�4�5 �3 1 2 3
�2
�3
�4
�5
4
5
1
�1�2
y
x
3
2
�1
IA
13. 14. y �1
3xy � �
1
5x
miL2872X_ch02_103-176 09/14/2006 06:40 PM Page 122CONFIRMING PAGES
Section 2.2 Linear Equations in Two Variables 123
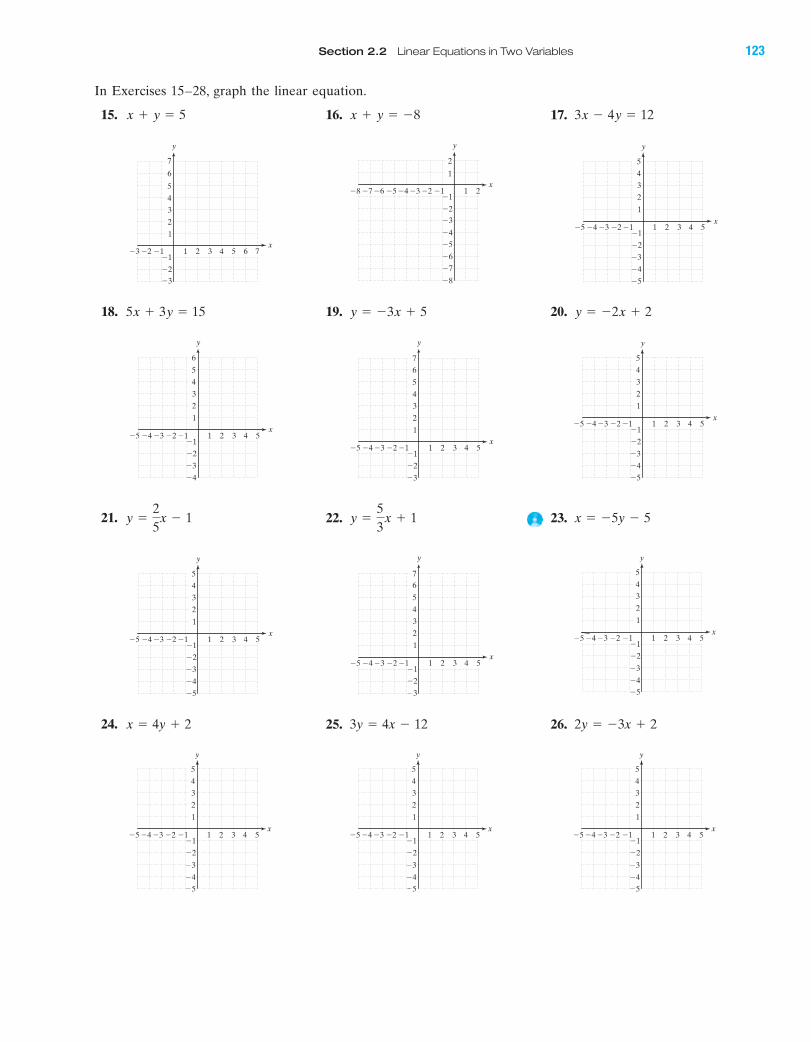
In Exercises 15–28, graph the linear equation.
15. 16. 17. 3x � 4y � 12x � y � �8x � y � 5
18. 19. 20. y � �2x � 2y � �3x � 55x � 3y � 15
4 5 6 7�3 �2 1 2 3�1
�2
�3
4
5
6
7
1
�1
3
2
x
y
1 2�3�4�5�6�7�8 �2�1
�2
�3
�4
�5
�6
�7
�8
1
2
�1x
y
4 5�4�5 �3 1 2 3
�2
�3
�4
�5
4
5
1
�1�2
3
2
�1
x
y
21. 22. 23. x � �5y � 5y �5
3x � 1y �
2
5x � 1
4 5�4�5 �3 1 2 3
�2
�3
�4
4
5
6
1
�1�2
3
2
�1
x
y
4 5�4�5 �3 1 2 3
�2
�3
4
5
6
7
1
�1�2
3
2
�1
x
y
4 5�4�5 �3 1 2 3
�2
�3
�4
�5
4
5
1
�1�2
3
2
�1
x
y
24. 25. 26. 2y � �3x � 23y � 4x � 12x � 4y � 2
4 5�4�5 �3 1 2 3
�2
�3
�4
�5
4
5
1
�1�2
3
2
�1
x
y
4 5�4�5 �3 1 2 3
�2
�3
4
5
6
7
1
�1�2
3
2
�1
x
y
4 5�4�5 �3 1 2 3
�2
�3
�4
�5
4
5
1
�1�2
y
x
3
2
�1
IA
4 5�4�5 �3 1 2 3
�2
�3
�4
�5
4
5
1
�1�2
y
x
3
2
�14 5�4�5 �3 1 2 3
�2
�3
�4
�5
4
5
1
�1�2
y
x
3
2
�14 5�4�5 �3 1 2 3
�2
�3
�4
�5
4
5
1
�1�2
y
x
3
2
�1
miL2872X_ch02_103-176 09/14/2006 06:40 PM Page 123CONFIRMING PAGES

�1x
y
4 5 6 7 8 91 2 3
4
5
6
7
8
9
1
3
2
�1
4 5�4�5 �3 1 2 3
�2
�3
�4
�5
4
5
1
�1�2
3
2
�1
x
y
4 5�4�5 �3 1 2 3
�2
�3
�4
�5
4
5
1
�1�2
3
2
�1
x
y
124 Chapter 2 Linear Equations in Two Variables
27. 28. x � �3yx � 2y
Concept 3: x-Intercepts and y-Intercepts
4 5�4�5 �3 1 2 3
�2
�3
�4
�5
4
5
1
�1�2
y
x
3
2
�14 5�4�5 �3 1 2 3
�2
�3
�4
�5
4
5
1
�1�2
y
x
3
2
�1
29. Given a linear equation, how do you find an x-intercept? How do you find a y-intercept?
30. Can the point (4, �1) be an x- or y-intercept? Why or why not?
For Exercises 31–42, a. find the x-intercept, b. find the y-intercept, and c. graph the line.
31. 32. 33. x � 2y � 42x � 5y � 102x � 3y � 18
4 5 6 7 8 9�1 1 2 3�1
�2
4
5
6
7
8
1
3
2
x
y
4 5 6 7�3 �2 1 2 3�1
�2
�3
�4
�5
2
3
4
5
�1
1
x
y
4 5�4�5 �3 1 2 3
�2
�3
�4
�5
4
5
1
�1�2
3
2
�1
x
y
IA
34. 35. 36. 3y � �5x5x � 3yx � y � 8
miL2872X_ch02_103-176 09/14/2006 06:40 PM Page 124CONFIRMING PAGES

Section 2.2 Linear Equations in Two Variables 125
37. 38. 39. y � �4
3x � 2y � �3x � 1y � 2x � 4
40. 41. 42. x �2
3yx �
1
4yy � �
2
5x � 1
4 5�4�5 �3 1 2 3
�2
�3
�4
�5
4
5
1
�1�2
y
x
3
2
�14 5�4�5 �3 1 2 3
�2
�3
�4
�5
4
5
1
�1�2
y
x
3
2
�14 5�4�5 �3 1 2 3
�2
�3
�4
�5
4
5
1
�1�2
y
x
3
2
�1
43. A salesperson makes a base salary of $10,000 a year plus a 5% commission on the total sales for the year.
The yearly salary can be expressed as a linear equation as
where y represents the yearly salary and x represents the total yearly sales.
y � 10,000 � 0.05x
4 5�4�5 �3 1 2 3
�2
�3
�4
�5
4
5
1
�1�2
y
x
3
2
�14 5�4�5 �3 1 2 3
�2
�3
�4
�5
4
5
1
�1�2
y
x
3
2
�14 5�4�5 �3 1 2 3
�2
�3
�4
�5
4
5
1
�1�2
y
x
3
2
�1
a. What is the salesperson’s salary for a year in which his sales total $500,000?
b. What is the salesperson’s salary for a year in which his sales total $300,000?
c. What does the y-intercept mean in the context of this problem?
d. Why is it unreasonable to use negative values for x in this equation?
Yearly Salary Relating to Sales60,000
00 200,000 400,000 600,000 800,000
To
tal Y
earl
y S
ala
ry($
)
Total Yearly Sales ($)
40,000
20,000
x
y
IAmiL2872X_ch02_103-176 09/14/2006 06:40 PM Page 125CONFIRMING PAGES

51. 52. �5y � �10�2y � 1 � 9
4 5�4�5 �3 1 2 3
�2
�3
�4
�5
4
5
1
�1�2
y
x
3
2
�14 5�4�5 �3 1 2 3
�2
�3
�4
�5
4
5
1
�1�2
y
x
3
2
�14 5�4�5 �3 1 2 3
�2
�3
�4
�5
4
5
1
�1�2
y
x
3
2
�1
4 5�4�5 �3 1 2 3
�2
�3
�4
�5
4
5
1
�1�2
y
x
3
2
�14 5�4�5 �3 1 2 3
�2
�3
�4
�5
4
5
1
�1�2
y
x
3
2
�1
126 Chapter 2 Linear Equations in Two Variables
44. A taxi company in Miami charges $2.00 for any distance up
to the first mile and $1.10 for every mile thereafter. The cost
of a cab ride can be modeled graphically.
a. Explain why the first part of the model is represented by a
horizontal line.
b. What does the y-intercept mean in the context of this
problem?
c. Explain why the line representing the cost of traveling
more than 1 mi is not horizontal.
d. How much would it cost to take a cab mi?
Concept 4: Horizontal and Vertical Lines
For Exercises 45–52, identify the line as either vertical or horizontal, and graph the line.
45. 46. 47. x � 2y � 3y � �1
312
4 5�4�5 �3 1 2 3
�2
�3
�4
�5
4
5
1
�1�2
y
x
3
2
�14 5�4�5 �3 1 2 3
�2
�3
�4
�5
4
5
1
�1�2
y
x
3
2
�14 5�4�5 �3 1 2 3
�2
�3
�4
�5
4
5
1
�1�2
y
x
3
2
�1
IA
48. 49. 50. �3x � 122x � 6 � 5x � �5
Cost of Cab Ride Versus Number of Miles6.00
00 1 2 3 4
Co
st (
$)
Number of Miles
5.00
4.00
3.00
2.00
1.00
x
y
miL2872X_ch02_103-176 09/14/2006 06:41 PM Page 126CONFIRMING PAGES
Section 2.2 Linear Equations in Two Variables 127
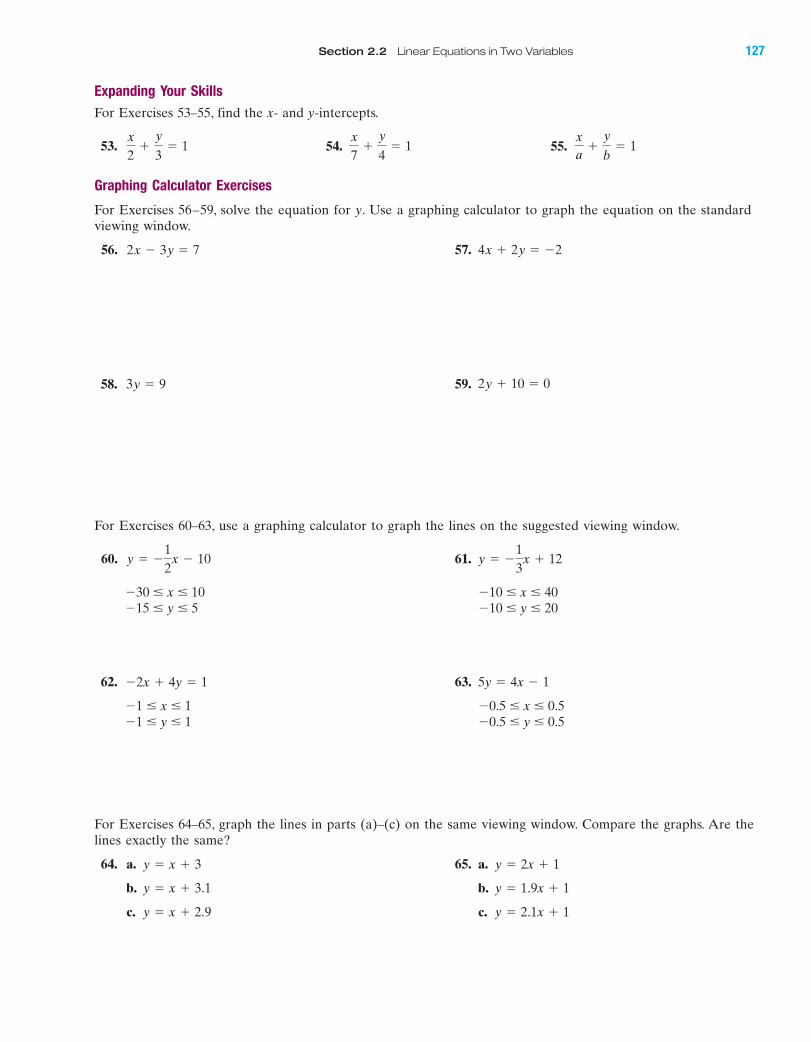
Expanding Your Skills
For Exercises 53–55, find the x- and y-intercepts.
53. 54. 55.
Graphing Calculator Exercises
For Exercises 56–59, solve the equation for y. Use a graphing calculator to graph the equation on the standard
viewing window.
56. 57. 4x � 2y � �22x � 3y � 7
xa
�y
b� 1
x
7�
y
4� 1
x
2�
y
3� 1
IA
58. 59. 2y � 10 � 03y � 9
For Exercises 60–63, use a graphing calculator to graph the lines on the suggested viewing window.
60. 61.
62. 63.
For Exercises 64–65, graph the lines in parts (a)–(c) on the same viewing window. Compare the graphs. Are the
lines exactly the same?
64. a. 65. a.
b. b.
c. c. y � 2.1x � 1y � x � 2.9
y � 1.9x � 1y � x � 3.1
y � 2x � 1y � x � 3
�0.5 � y � 0.5�1 � y � 1
�0.5 � x � 0.5�1 � x � 1
5y � 4x � 1�2x � 4y � 1
�10 � y � 20�15 � y � 5
�10 � x � 40�30 � x � 10
y � �1
3x � 12y � �
1
2x � 10
miL2872X_ch02_103-176 09/14/2006 06:41 PM Page 127CONFIRMING PAGES

Figure 2-15
Figure 2-16
To measure the slope of a line quantitatively, consider two points on the line. The
slope is the ratio of the vertical change between the two points to the horizontal
change. That is, the slope is the ratio of the change in y to the change in x. As a
memory device, we might think of the slope of a line as “rise over run.”
Slope �change in y
change in x�
rise
run
Change in y(rise)
Change in x (run)
4-ftchange in x
3-ftchange in y
A
B
18-ftchange in x
3-ftchange in y
A
B
To move from point A to point B on the stairs, rise 3 ft and move to the right
4 ft (Figure 2-15).
To move from point A to point B on the wheelchair ramp, rise 3 ft and move
to the right 18 ft (Figure 2-16).
The slope of the stairs is which is greater than the slope of the ramp, which
is 16.
34
Slope �change in y
change in x�
3 ft
18 ft�
1
6
1. Introduction to the Slope of a LineIn Section 2.2, we learned how to graph a linear equation and to identify its x-
and y-intercepts. In this section, we learn about another important feature of a
line called the slope of a line. Geometrically, slope measures the “steepness” of
a line.
Figure 2-14 shows a set of stairs with a wheelchair ramp to the side. Notice
that the stairs are steeper than the ramp.
4 ft
3 ft 3 ft
18 ft
Figure 2-14
Section 2.3 Slope of a Line
Concepts
1. Introduction to the Slope ofa Line
2. The Slope Formula3. Parallel and Perpendicular
Lines 4. Applications and
Interpretation of Slope
IA
128 Chapter 2 Linear Equations in Two Variables
Slope �change in y
change in x�
3 ft
4 ft�
3
4
miL2872X_ch02_103-176 09/14/2006 06:41 PM Page 128CONFIRMING PAGES
Skill Practice Answers
1.25
8 ft
20 ft
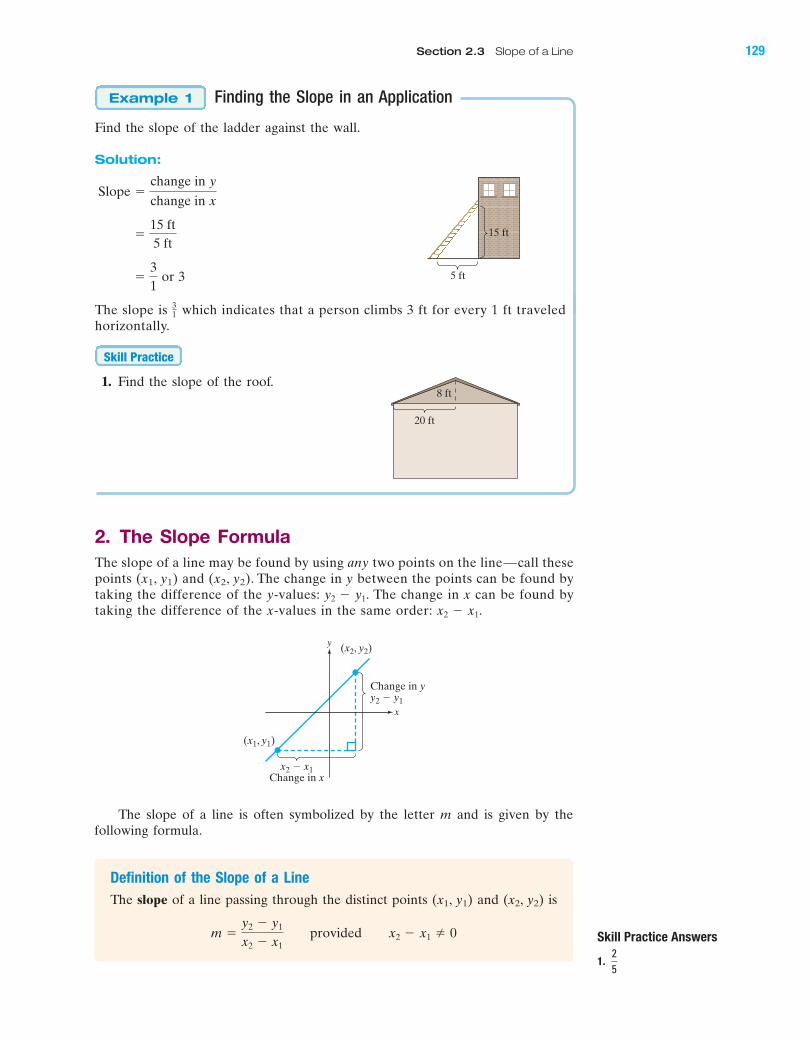
Finding the Slope in an Application
Find the slope of the ladder against the wall.
Solution:
or 3
The slope is which indicates that a person climbs 3 ft for every 1 ft traveled
horizontally.
1. Find the slope of the roof.
2. The Slope FormulaThe slope of a line may be found by using any two points on the line—call these
points (x1, y1) and (x2, y2). The change in y between the points can be found by
taking the difference of the y-values: The change in x can be found by
taking the difference of the x-values in the same order: x2 � x1.
y2 � y1.
Skill Practice
31
�3
1
�15 ft
5 ft
Slope �change in y
change in x
Example 1
5 ft
15 ft
The slope of a line is often symbolized by the letter m and is given by the
following formula.
y
x
y2 � y1
x2 � x1
(x2, y2)
(x1, y1)
Change in y
Change in x
Definition of the Slope of a Line
The slope of a line passing through the distinct points (x1, y1) and (x2, y2) is
m �y2 � y1
x2 � x1
provided x2 � x1 � 0
IA
Section 2.3 Slope of a Line 129
miL2872X_ch02_103-176 09/14/2006 06:41 PM Page 129CONFIRMING PAGES
Skill Practice Answers
2.3
10
Finding the Slope of a Line Through Two Points
Find the slope of the line passing through the points (1, �1) and (7, 2).
Solution:
To use the slope formula, first label the coordinates of each point, and then
substitute their values into the slope formula.
Label the points.
Apply the slope formula.
Simplify.
�1
2
�3
6
m �y2 � y1
x2 � x1
�2 � 1�12
7 � 1
1x2, y221x1, y1211, �12 and 17, 22
Example 2
Figure 2-17
4 5 6 7 8 9 10�1�2 2 3
�2
�3
�4
�5
4
5
1
3
2
�1
x
y
(7, 2)
(1, �1)
6
3
1
The slope of the line can be verified from the graph (Figure 2-17).
TIP: The slope formula does not depend on which point is labeled (x1, y1)and which point is labeled (x2, y2). For example, reversing the order in whichthe points are labeled in Example 2 results in the same slope:
then m ��1 � 21 � 7
��3�6
�12
1x1, y121x2, y2211, �12 and 17, 22
2. Find the slope of the line that passes through the points (–4, 5) and (6, 8).
Skill Practice
130 Chapter 2 Linear Equations in Two Variables
IAmiL2872X_ch02_103-176 09/14/2006 06:41 PM Page 130CONFIRMING PAGES

• Horizontal lines have a zero slope.
• Vertical lines have an undefined slope.
Skill Practice Answers
3. �23
Finding the Slope of a LineBetween Two Points
Find the slope of the line passing through the points (3, �4) and (�5, �1).
Solution:
Label points.
Apply the slope formula.
Simplify.
The two points can be graphed to verify that is the correct slope
(Figure 2-18).
�38
�3
�8� �
3
8
m �y2 � y1
x2 � x1
��1 � 1�42
�5 � 3
1x2, y221x1, y1213, �42 and 1�5, �12
Example 3
Figure 2-18
Negative slope Zero slope Undefined slopePositive slope
y
x
(�5, �1)
(3, �4)
The line slopes
downward from left to right.
3
8
m � �38
�5
1
2
3
4
5
1 2 3 4 5
�4
�3
�2
�1�2�3�4�5
3. Find the slope of the line that passes through the given points.
(1, –8) and (–5, –4)
Skill Practice
Section 2.3 Slope of a Line 131
IA
When you apply the slope formula, you will see that the slope of a line
may be positive, negative, zero, or undefined.
• Lines that “increase,” or “rise,” from left to right have a positive slope.
• Lines that “decrease,” or “fall,” from left to right have a negative slope.
miL2872X_ch02_103-176 09/14/2006 06:41 PM Page 131CONFIRMING PAGES

Skill Practice Answers
4. Undefined 5. 0
Finding the Slope of a Line Between Two Points
a. Find the slope of the line passing through the points (�3, 4) and (�3, �2).
b. Find the slope of the line passing through the points (0, 2) and (�4, 2).
Solution:
a.
Label points.
Apply slope formula.
Undefined
The slope is undefined. The points define a vertical line (Figure 2-19).
��6
0
��6
�3 � 3
m �y2 � y1
x2 � x1
��2 � 4
�3 � 1�32
1x2, y221x1, y121�3, 42 and 1�3, �22
Example 4
Figure 2-19
y
x
(�3, �2)
3 4 51 2
1
2
3
5
�4�5 �3 �1�2
(�3, 4)
�5
�2
�3
�4
�1
b.
and Label the points.
Apply the slope formula.
Simplify.
The slope is zero. The line through the two points is a horizontal line
(Figure 2-20).
Find the slope of the line that passes through the given points.
4. (5, –2) and (5, 5) 5. (1, 6) and (–7, 6)
3. Parallel and Perpendicular LinesLines in the same plane that do not intersect are parallel. Nonvertical parallel
lines have the same slope and different y-intercepts (Figure 2-21).
Lines that intersect at a right angle are perpendicular. If two lines are per-
pendicular, then the slope of one line is the opposite of the reciprocal of the slope
of the other (provided neither line is vertical) (Figure 2-22).
Skill Practice
� 0
�0
�4
m �y2 � y1
x2 � x1
�2 � 2
�4 � 0
1x2, y221x1, y1210, 22 and 1�4, 22
Figure 2-20
y
x3 4 51 2
1
2
5
4
3
�4�5 �3 �1�2
(�4, 2)
�5
�2
�3
�4
�1
(0, 2)
Slopes of Parallel Lines
If and represent the slopes of two parallel (nonvertical) lines, then
See Figure 2-21.
m1 � m2
m2m1
IA
132 Chapter 2 Linear Equations in Two Variables
miL2872X_ch02_103-176 09/14/2006 06:41 PM Page 132CONFIRMING PAGES
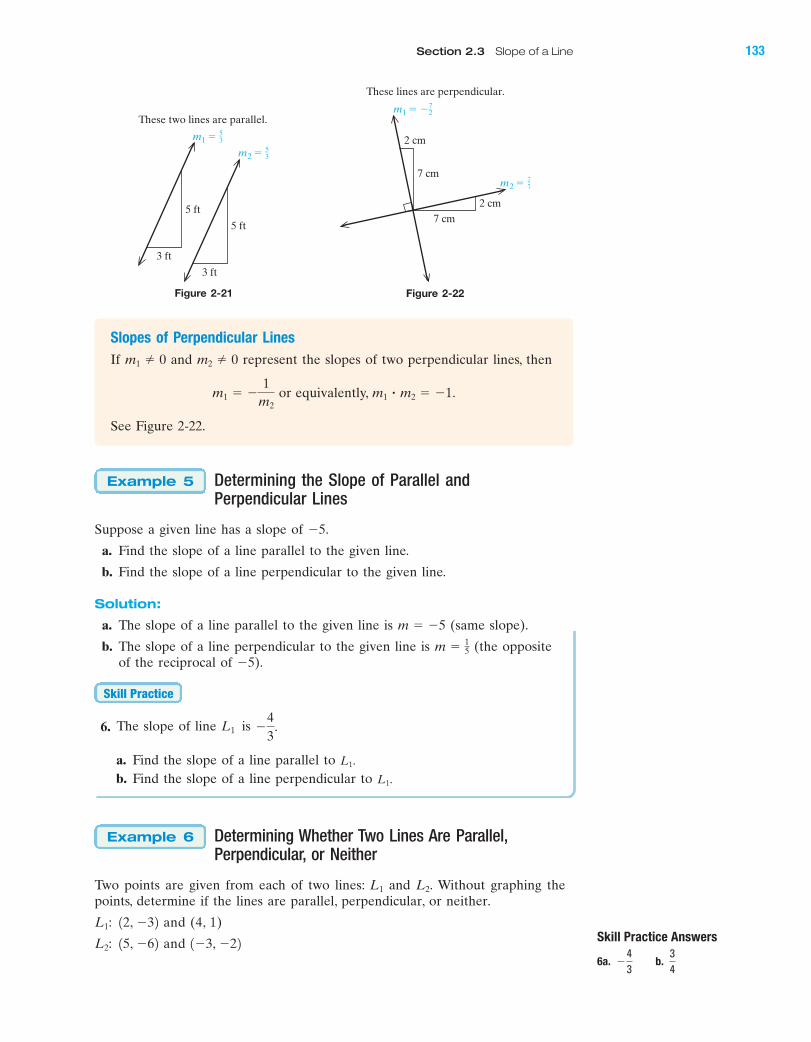
Slopes of Perpendicular Lines
If and represent the slopes of two perpendicular lines, then
or equivalently, .
See Figure 2-22.
m1 � m2 � �1m1 � �1
m2
m2 � 0m1 � 0
Figure 2-21 Figure 2-22
Skill Practice Answers
6a. b.34
�43
m1 �53
m2 �53
5 ft
3 ft
5 ft
These two lines are parallel.
3 ft
m1 � �72
m2 �27
2 cm
2 cm
7 cm
7 cm
These lines are perpendicular.
Determining the Slope of Parallel andPerpendicular Lines
Suppose a given line has a slope of �5.
a. Find the slope of a line parallel to the given line.
b. Find the slope of a line perpendicular to the given line.
Solution:
a. The slope of a line parallel to the given line is (same slope).
b. The slope of a line perpendicular to the given line is (the opposite
of the reciprocal of �5).
6. The slope of line is
a. Find the slope of a line parallel to
b. Find the slope of a line perpendicular to
Determining Whether Two Lines Are Parallel,Perpendicular, or Neither
Two points are given from each of two lines: and Without graphing the
points, determine if the lines are parallel, perpendicular, or neither.
and (4, 1)
and 1�3, �2215, �62L2:
12, �32L1:
L2.L1
Example 6
L1.
L1.
�4
3.L1
Skill Practice
m � 15
m � �5
Example 5
IA
Section 2.3 Slope of a Line 133
miL2872X_ch02_103-176 09/14/2006 06:41 PM Page 133CONFIRMING PAGES
Solution:
First determine the slope of each line. Then compare the values of the slopes
to determine if the lines are parallel or perpendicular.
For line 1: For line 2:
and (4, 1) and
Label the points.
Apply the slope
formula.
The slope of is 2. The slope of is The slope of is the opposite of the
reciprocal of By comparing the slopes, the lines must be perpendicular.
7. Two points are given for lines and Determine if the lines are parallel,
perpendicular, or neither.
(4, �1) and (�3, 6)
(�1, 3) and (2, 0)L2:
L1:
L2.L1
Skill Practice
L2.
L1�12.L2L1
� �1
2 � 2
�4
�8 �
4
2
m ��2 � 1�62�3 � 152 m �
1 � 1�324 � 2
1x2, y221x1, y121x2, y221x1, y121�3, �2215, �62L2:12, �32L1:
4. Applications and Interpretation of Slope
Interpreting the Slope of a Line in an Application
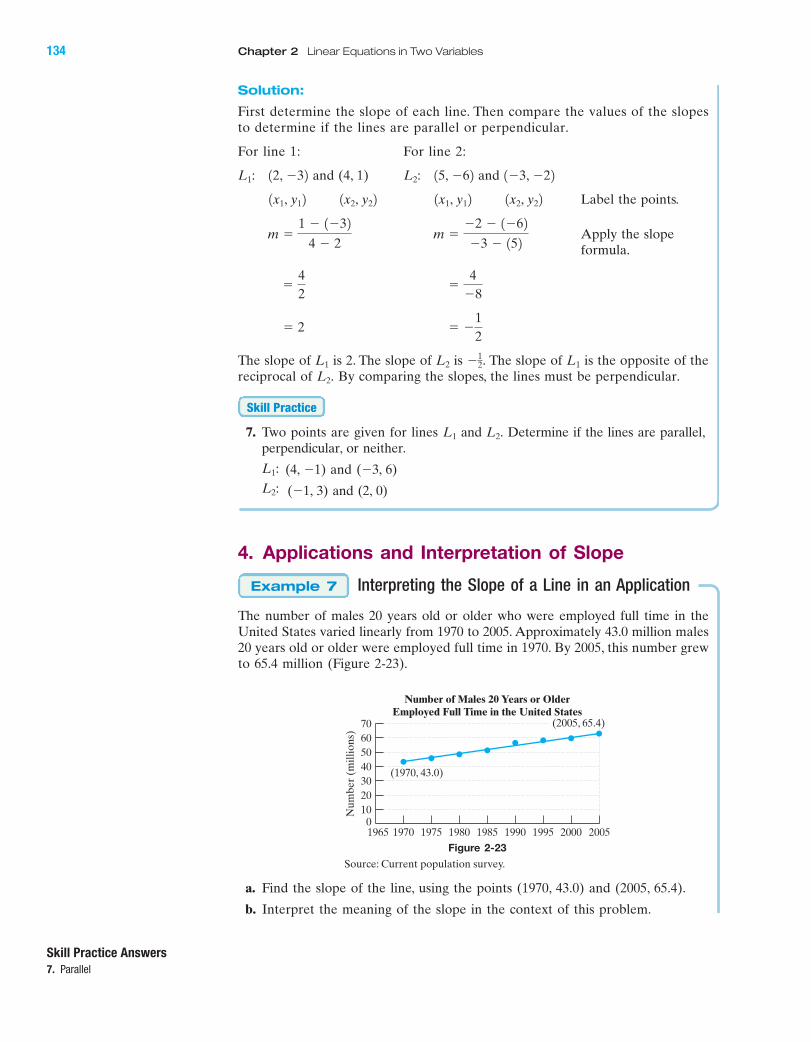
The number of males 20 years old or older who were employed full time in the
United States varied linearly from 1970 to 2005. Approximately 43.0 million males
20 years old or older were employed full time in 1970. By 2005, this number grew
to 65.4 million (Figure 2-23).
Example 7
Figure 2-23
Source: Current population survey.
Skill Practice Answers
7. Parallel
Nu
mb
er
(mil
lio
ns)
1965 1970 1975 1980 1985 1990 1995 2000 20050
10
20
30
40
50
60
70
Number of Males 20 Years or OlderEmployed Full Time in the United States
(1970, 43.0)
(2005, 65.4)
a. Find the slope of the line, using the points (1970, 43.0) and (2005, 65.4).
b. Interpret the meaning of the slope in the context of this problem.
IA
134 Chapter 2 Linear Equations in Two Variables
miL2872X_ch02_103-176 09/14/2006 06:41 PM Page 134CONFIRMING PAGES

Study Skills Exercises
1. Go to the online service called MathZone that accompanies this text (www.mathzone.com). Name two
features that this online service offers that can help you in this course.
2. Define the key term slope.
Review Exercises
3. Find the missing coordinate so that the ordered pairs are solutions to the equation
a. 0, b. , 0 c. �4,
For Exercises 4–7, find the x- and y-intercepts (if possible) for each equation, and sketch the graph.
4. 5.
4 5�4�5 �3 1 2 3
�2
�3
�4
�5
4
5
1
�1�2
3
2
�1
x
y
4�4�5�6 �3 1 2 3
�2
�3
�4
�5
4
5
1
�1�2
3
2
�1
x
y
4 � 2y � 02x � 8 � 0
21212112x � y � 4.
Solution:
a. 11970, 43.02 and 12005, 65.42Label the points.
Apply the slope formula.
b. The slope is approximately 0.64, meaning that the full-time workforce has
increased by approximately 0.64 million men (or 640,000 men) per year
between 1970 and 2005.
The number of people per square mile in Alaska was 0.96 in
1990. This number increased to 1.17 in 2005.
8a. Find the slope of the line that represents the population growth of Alaska.
Use the points (1990, 0.96) and (2005, 1.17).
b. Interpret the meaning of the slope in the context of this problem.
Skill Practice
m �22.4
35 or m � 0.64
m �y2 � y1
x2 � x1
�65.4 � 43.0
2005 � 1970
1x2, y221x1, y12
Skill Practice Answers
8a. 0.014b. The population increased by 0.014
person per square mile per year.
Boost your GRADE atmathzone.com!
• Practice Problems • e-Professors
• Self-Tests • Videos
• NetTutor
Section 2.3 Practice Exercises
IA
Section 2.3 Slope of a Line 135
miL2872X_ch02_103-176 09/14/2006 06:41 PM Page 135CONFIRMING PAGES

7 ft
24 ft20 ft
19 ft15 ft
Concept 1: Introduction to the Slope of a Line
8. A 25-ft ladder is leaning against a house, as shown 9. Find the pitch (slope) of the roof in the figure.
in the diagram. Find the slope of the ladder.
72 in.
8 in.
150 yd
500 yd
6. 7.
12 15 18 21�9 3 6 9
�6
�9
12
15
18
21
3
�3�6
9
6
�3
x
y
4 5�4�5 �3 1 2 3
�2
�3
�4
�5
4
5
1
�1�2
3
2
�1
x
y
x �1
3y � 62x � 2y � 6 � 0
10. Find the slope of the treadmill. 11. Find the average slope of the hill.
12. The road sign shown in the figure indicates the percent grade of
a hill. This gives the slope of the road as the change in elevation per
100 horizontal ft. Given a 4% grade, write this as a slope in
fractional form.
13. If a plane gains 1000 ft in altitude over a distance of 12,000 horizontal ft,
what is the slope? Explain what this value means in the context of the
problem.
Concept 2: The Slope Formula
For Exercises 14–29, use the slope formula to determine the slope of the line containing the two points.
14. (6, 0) and 15. and 16. and
17. (4, 5) and 18. and 19. and
20. and 21. and 22. (2, 3) and (2, 7)10.3, �0.1210.4, �0.221�0.1, �0.8210.3, �1.1213, �1214, �221�7, 121�2, 521�1, 0211, �221�2, 3210, �421�5, 0210, �32
4% Grade
IA
136 Chapter 2 Linear Equations in Two Variables
miL2872X_ch02_103-176 09/14/2006 06:41 PM Page 136CONFIRMING PAGES

For Exercises 32–37, estimate the slope of the line from its graph.
32. 33.
34. 35.
36. 37.
Concept 3: Parallel and Perpendicular Lines
38. Can the slopes of two perpendicular lines both be positive? Explain your answer.
y
x
�5
�4
�3
�2
�1
1
2
3
4
5
�1 1 2 3 4 5�2�3�4�5
y
x
�5
�4
�3
�2
�1
1
2
3
4
5
�1 1 2 3 4 5�2�3�4�5
y
x
�5
�4
�3
�2
�1
1
2
3
4
5
�1 1 2 3 4 5�2�3�4�5
y
x
�5
�4
�3
�2
�1
1
2
3
4
5
�1 1 2 3 4 5�2�3�4�5
y
x
�5
�4
�3
�2
�1
1
2
3
4
5
�1 1 2 3 4 5�2�3�4�5
23. and 24. and 25. and (1, 4)
26. and (0, 6.4) 27. (1.1, 4) and 28. and
29. and
30. Explain how to use the graph of a line to determine whether the slope of a line is positive, negative, zero,
or undefined.
31. If the slope of a line is how many units of change in y will be produced by 6 units of change in x?43,
a�1
6, �
3
2ba2
3, �
1
2b
a7
2, 1ba3
2,
4
3b1�3.2, �0.321�4.6, 4.12
1�8, 421�3, �1215, �121�1, 021�1, 52
y
x3 4 51 2
1
2
5
4
3
�4�5 �3 �1�2
�5
�2
�3
�4
�1
IA
Section 2.3 Slope of a Line 137
miL2872X_ch02_103-176 09/14/2006 06:41 PM Page 137CONFIRMING PAGES

For Exercises 39–44, the slope of a line is given.
a. Find the slope of a line parallel to the given line.
b. Find the slope of a line perpendicular to the given line.
39. 40. 41.
42. 43. 44. m is undefined.
In Exercises 45–52, two points are given from each of two lines and Without graphing the points,
determine if the lines are perpendicular, parallel, or neither.
45. and 46. and 47. and and and and
48. and 49. and 50. and
and and and
51. and 52. and
and and
Concept 4: Applications and Interpretation of Slope
53. The graph shows the number of cellular phone subscriptions
(in millions) purchased in the United States for selected years.
a. Use the coordinates of the given points to find the slope of
the line, and express the answer in decimal form.
b. Interpret the meaning of the slope in the context of this
problem.
54. The number of SUVs (in millions) sold in the United States
grew approximately linearly between 1990 and 2002.
a. Find the slope of the line defined by the two given points.
b. Interpret the meaning of the slope in the context of this
problem.
14, �62L2: 1�10, �8210, 52L2: 1�4, 1210, 02L1: 17, 1212, 32L1: 1�3, �22
10, 42L2: 12, 4210, 22L2: 14, 2210, �22L2: 1�2, 5212, 52L1: 13, 5215, 92L1: 15, 3212, 32L1: 10, 021�10, �162L2: 1�5, �1217, 22L2: 10, 4213, 22L2: 1�1, 4213, �12L1: 14, �221�1, 22L1: 1�3, �5214, 92L1: 12, 52
L2.L1
m � 0m � �2
11
m � �4
7m � 3m � 5
Mil
lio
ns
1996 1998 2000 2002 2004 20060
50
100
150
200
250Number of Cellular Phone Subscriptions
(1998, 70)
(2006, 220)M
illi
on
s
1990 1992 1994 1996 1998 20042000 20020
50
100
150
200
250
300
350
400
Number of SUVs Sold in theUnited States
(1994, 155)
(2000, 341)
IA
138 Chapter 2 Linear Equations in Two Variables
miL2872X_ch02_103-176 09/14/2006 06:41 PM Page 138CONFIRMING PAGES
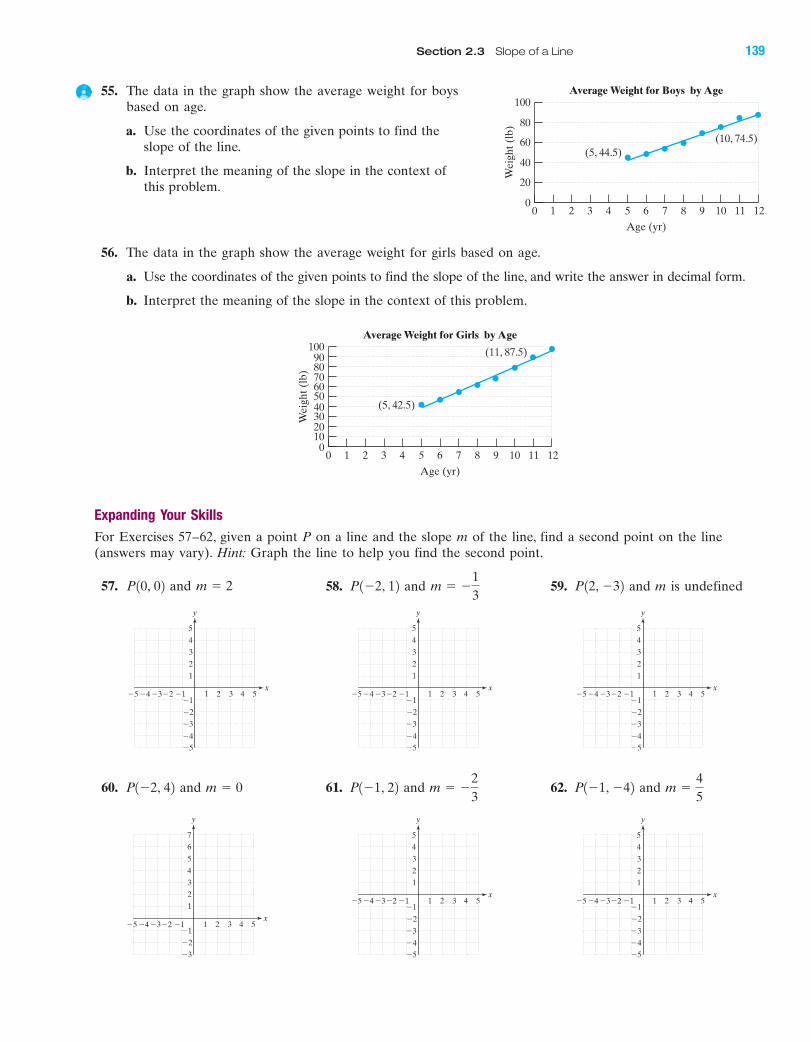
55. The data in the graph show the average weight for boys
based on age.
a. Use the coordinates of the given points to find the
slope of the line.
b. Interpret the meaning of the slope in the context of
this problem.
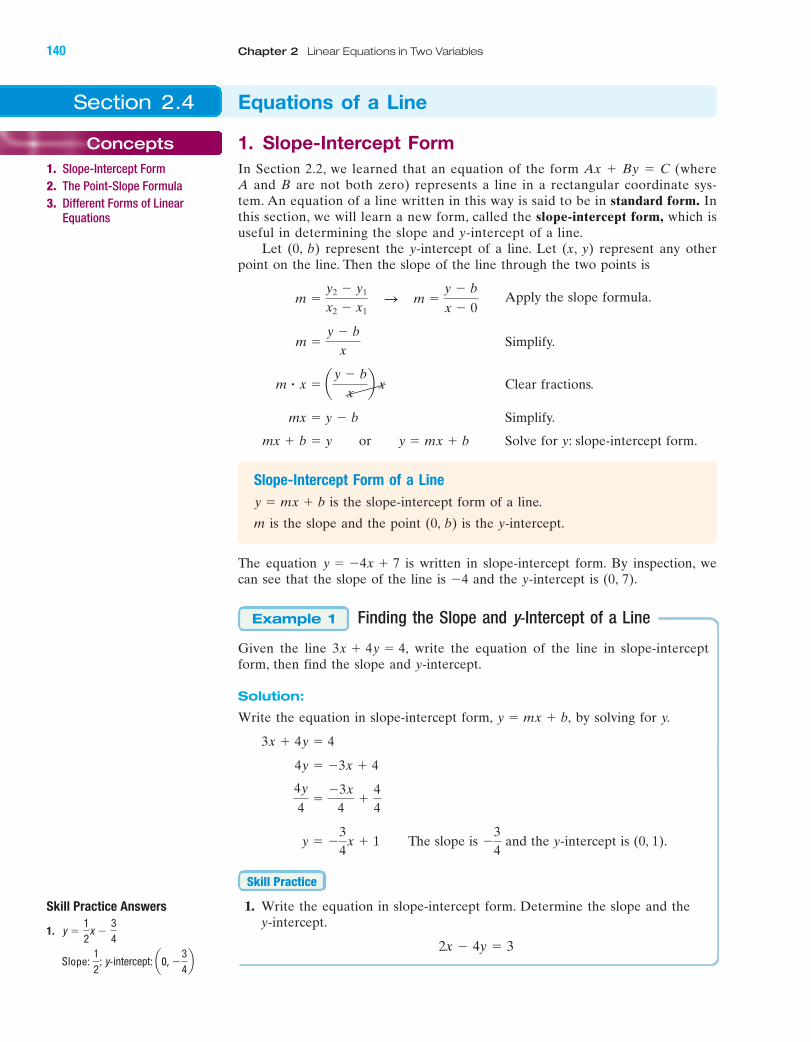
56. The data in the graph show the average weight for girls based on age.
a. Use the coordinates of the given points to find the slope of the line, and write the answer in decimal form.
b. Interpret the meaning of the slope in the context of this problem.
Expanding Your Skills
For Exercises 57–62, given a point P on a line and the slope m of the line, find a second point on the line
(answers may vary). Hint: Graph the line to help you find the second point.
57. and 58. and 59. and m is undefined
60. and 61. and 62. and
4 5�4�5 �3 1 2 3
�2
�3
�4
�5
4
5
�1�1�2
y
x
3
2
1
4 5�4�5 �3 1 2 3
�2
�3
�4
�5
4
5
�1�1�2
y
x
3
2
1
4 5�4�5 �3 1 2 3
�2
�3
4
5
6
7
�1�1�2
y
x
3
2
1
m �4
5P1�1, �42m � �
2
3P1�1, 22m � 0P1�2, 42
4 5�4�5 �3 1 2 3
�2
�3
�4
�5
4
5
�1�1�2
y
x
3
2
1
4 5�4�5 �3 1 2 3
�2
�3
�4
�5
4
5
�1�1�2
y
x
3
2
1
4 5�4�5 �3 1 2 3
�2
�3
�4
�5
4
5
�1�1�2
y
x
3
2
1
P12, �32m � �1
3P1�2, 12m � 2P10, 02
Weig
ht
(lb
)
Age (yr)
0 1 2 3 4 5 6 7 8 9 10 11 120
70
5060
40302010
8090
100Average Weight for Girls by Age
(5, 42.5)
(11, 87.5)
IA
Section 2.3 Slope of a Line 139
Weig
ht
(lb
)
Age (yr)
0 1 2 3 4 5 6 7 8 9 10 11 120
60
40
20
80
100Average Weight for Boys by Age
(5, 44.5)
(10, 74.5)
miL2872X_ch02_103-176 09/14/2006 06:42 PM Page 139CONFIRMING PAGES
Skill Practice Answers
1.
Slope: 12
; y-intercept: a0, �34b
y �12
x �34
Section 2.4 Equations of a Line
Concepts
1. Slope-Intercept Form2. The Point-Slope Formula3. Different Forms of Linear
Equations
1. Slope-Intercept FormIn Section 2.2, we learned that an equation of the form Ax � By � C (where
A and B are not both zero) represents a line in a rectangular coordinate sys-
tem. An equation of a line written in this way is said to be in standard form. In
this section, we will learn a new form, called the slope-intercept form, which is
useful in determining the slope and y-intercept of a line.
Let (0, b) represent the y-intercept of a line. Let (x, y) represent any other
point on the line. Then the slope of the line through the two points is
Apply the slope formula.
Simplify.
Clear fractions.
Simplify.
Solve for y: slope-intercept form.
Slope-Intercept Form of a Line
is the slope-intercept form of a line.
m is the slope and the point (0, b) is the y-intercept.
The equation is written in slope-intercept form. By inspection, we
can see that the slope of the line is �4 and the y-intercept is (0, 7).
Finding the Slope and y-Intercept of a Line
Given the line write the equation of the line in slope-intercept
form, then find the slope and y-intercept.
Solution:
Write the equation in slope-intercept form, by solving for y.
The slope is and the y-intercept is (0, 1).
1. Write the equation in slope-intercept form. Determine the slope and the
y-intercept.
2x � 4y � 3
Skill Practice
�3
4 y � �
3
4x � 1
4y
4�
�3x
4�
4
4
4y � �3x � 4
3x � 4y � 4
y � mx � b,
3x � 4y � 4,
Example 1
y � �4x � 7
y � mx � b
mx � b � y or y � mx � b
mx � y � b
m � x � ay � b
xb x
m �y � b
x
m �y2 � y1
x2 � x1
S m �y � b
x � 0
IA
140 Chapter 2 Linear Equations in Two Variables
miL2872X_ch02_103-176 09/14/2006 06:42 PM Page 140CONFIRMING PAGES

The slope-intercept form is a useful tool to graph a line. The y-intercept is a
known point on the line, and the slope indicates the “direction” of the line and
can be used to find a second point. Using slope-intercept form to graph a line is
demonstrated in Example 2.
Graphing a Line by Using the Slope and y-Intercept
Graph the line by using the slope and y-intercept.
Solution:
First plot the y-intercept (0, 1). The slope
can be written as
To find a second point on the line, start at the
y-intercept and move down 3 units and to the right4 units. Then draw the line through the two points
(Figure 2-24).
Similarly, the slope can be written as
To find a second point on the line, start at the y-intercept and move up3 units and to the left 4 units. Then draw the line through the two points (see
Figure 2-24).
2. Graph the line by using the slope and y-intercept.
Two lines are parallel if they have the same slope and different y-intercepts.
Two lines are perpendicular if the slope of one line is the opposite of the recip-
rocal of the slope of the other line. Otherwise, the lines are neither parallel nor
perpendicular.
Determining if Two Lines Are Parallel,Perpendicular, or Neither
Given the pair of linear equations, determine if the lines are parallel, perpendi-
cular, or neither parallel nor perpendicular.
a. b. c.
y � 6L2:�4x � 6y � �12L2:y � �2x � 1L2:
x � y � 6L1:2y � �3x � 2L1:y � �2x � 7L1:
Example 3
y � 15 x � 2
Skill Practice
m �3
�4
m ��3
4
m � �34
y � �34x � 1
Example 2
The change in y is �3.
The change in x is 4.
The change in y is 3.
The change in x is �4.
y
x
Start here
y-intercept
(0, 1)y � � x � 134
�3
3
�4
4
�5
�4
�3
�2
�1
1
2
3
4
5
1 2 3 4 5�3�4�5
Figure 2-24
Skill Practice Answers
2.
4 5�4�5 �3 1 2 3
�2
�3
�4
�5
4
5
1
�1�2
3
2
�1
x
y
y � x � 215
TIP: To graph a lineusing the y-intercept andslope, always begin byplotting a point at the y-intercept (not at theorigin).
IA
Section 2.4 Equations of a Line 141
miL2872X_ch02_103-176 09/14/2006 06:42 PM Page 141CONFIRMING PAGES

Solution:
a. The equations are written in slope-intercept form.
The slope is and the y-intercept is (0, 7).
The slope is and the y-intercept is
Because the slopes are the same and the y-intercepts are different, the
lines are parallel.
b. Write each equation in slope-intercept form by solving for y.
Divide by 2.
Divide by 6.
The slope of is The slope of is
The value is the opposite of the reciprocal of . Therefore, the lines
are perpendicular.
c. is equivalent to The slope is
is a horizontal line, and the slope is 0.
The slopes are not the same. Therefore, the lines are not parallel. The slope
of one line is not the opposite of the reciprocal of the other slope.
Therefore, the lines are not perpendicular. The lines are neither parallel
nor perpendicular.
Given the pair of equations, determine if the lines are parallel,
perpendicular, or neither.
3. 4. 5.
Using Slope-Intercept Form to Findan Equation of a Line
Use slope-intercept form to find an equation of a line with slope �3 and passing
through the point (1, �4).
Solution:
To find an equation of a line in slope-intercept form, y � mx � b, it is necessary
to find the slope, m, and the y-intercept, b. The slope is given in the problem as
m � �3. Therefore, the slope-intercept form becomes
y � �3x � b
y � mx � b
Example 4
y �4
3 x � 3
x � y � 7 3x � y � 4y � �3
4 x � 1
Skill Practice
y � 6L2:
�1.y � �x � 6.x � y � 6L1:
23�3
2
2
3.L2�
3
2.L1
y �2
3x � 2
6y
6�
4
6x �
12
6 y � �
3
2x � 1
6y � 4x � 12 2y
2�
�3x2
�2
2
�4x � 6y � �12L2: 2y � �3x � 2L1:
10, �12.�2y � �2x � 1L2:
�2y � �2x � 7L1:
Add 4x to
both sides.
IA
142 Chapter 2 Linear Equations in Two Variables
Skill Practice Answers
3. Perpendicular 4. Parallel5. Neither
x � 1 6x � 6 � 2y
miL2872X_ch02_103-176 09/14/2006 06:42 PM Page 142CONFIRMING PAGES
Furthermore, because the point (1, �4) is on the line, it is a solution to the equa-
tion. Therefore, if we substitute (1, �4) for x and y in the equation, we can solve
for b.
Thus, the slope-intercept form is .
6. Use slope-intercept form to find an equation of a line with slope 2 and
passing through .1�3, �52
Skill Practice
y � �3x � 1
�1 � b
�4 � �3 � b
�4 � �3112 � b
Skill Practice Answers
6. y � 2x � 1
IA
TIP: We can check the answer to Example 4,by graphing the line. Notice that the line appearsto pass through (1, �4) as desired.
4 5�4�5 �3 1 2 3
�2
�3
�4
�5
4
(1, �4)
5
1
�1�2
3
2
�1
x
y
2. The Point-Slope FormulaIn Example 4, we used the slope-intercept form of a line to construct an equa-
tion of a line given its slope and a known point on the line. Here we provide
another tool called the point-slope formula that (as its name suggests) can
accomplish the same result.
Suppose a line passes through a given point and has slope m. If (x, y)
is any other point on the line, then
Slope formula
Clear fractions.
or
Point-slope formula
The Point-Slope Formula
The point-slope formula is given by
where m is the slope of the line and is a known point on the line.1x1, y12y � y1 � m1x � x12
y � y1 � m1x � x12
m1x � x12 � y � y1
m1x � x12 �y � y1
x � x1
1x � x12
m �y � y1
x � x1
1x1, y12
Section 2.4 Equations of a Line 143
miL2872X_ch02_103-176 09/14/2006 06:42 PM Page 143CONFIRMING PAGES

The point-slope formula is used specifically to find an equation of a line when a
point on the line is known and the slope is known. To illustrate the point-slope
formula, we will repeat the problem from Example 4.
Using the Point-Slope Formula to Findan Equation of a Line
Use the point-slope formula to find an equation of the line having a slope of �3
and passing through the point (1, �4). Write the answer in slope-intercept form.
Solution:
and (x1, y1) � (1, �4)
Apply the point-slope formula.
Simplify.
To write the answer in slope-intercept form, clear parentheses and solve for y.
Clear parentheses.
Solve for y. The answer is written in slope-
intercept form. Notice that this is the same
equation as in Example 4.
7. Use the point-slope formula to write an equation for a line passing through
the point and with a slope of Write the answer in slope-
intercept form.
Finding an Equation of a Line Given Two Points
Find an equation of the line passing through the points (5, �1) and (3, 1). Write
the answer in slope-intercept form.
Solution:
The slope formula can be used to compute the slope of the line between two
points. Once the slope is known, the point-slope formula can be used to find
an equation of the line.
First find the slope.
Next, apply the point-slope formula.
Substitute and use either point for
(x1, y1). We will use (3, 1) for (x1, y1).
Clear parentheses.
Solve for y. The final answer is in slope-intercept
form.
y � �x � 4
y � 1 � �x � 3
m � �1 y � 1 � �11x � 32 y � y1 � m1x � x12
m �y2 � y1
x2 � x1
�1 � 1�12
3 � 5�
2
�2� �1 Hence, m � �1.
Example 6
�5.1�2, �62
Skill Practice
y � �3x � 1
y � 4 � �3x � 3
y � 4 � �31x � 12 y � 1�42 � �31x � 12
y � y1 � m1x � x12m � �3
Example 5
Skill Practice Answers
7. y � �5x � 16
IA
144 Chapter 2 Linear Equations in Two Variables
TIP: In Example 6, thepoint (3, 1) was used for(x1, y1) in the point-slopeformula. However, eitherpoint could have beenused. Using the point(5, �1) for (x1, y1) producesthe same final equation:
y � �x � 4
y � 1 � �x � 5
y � 1�12 � �11x � 52
miL2872X_ch02_103-176 09/14/2006 06:42 PM Page 144CONFIRMING PAGES
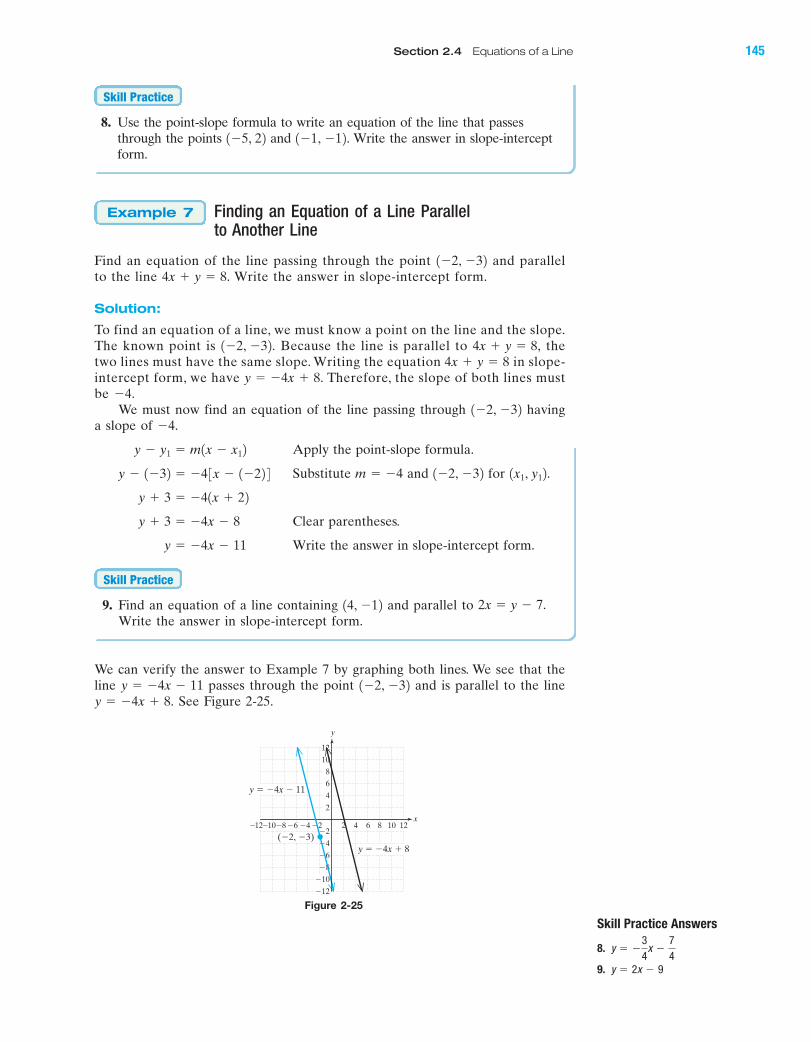
8. Use the point-slope formula to write an equation of the line that passes
through the points and Write the answer in slope-intercept
form.
Finding an Equation of a Line Parallel to Another Line
Find an equation of the line passing through the point and parallel
to the line Write the answer in slope-intercept form.
Solution:
To find an equation of a line, we must know a point on the line and the slope.
The known point is Because the line is parallel to the
two lines must have the same slope. Writing the equation in slope-
intercept form, we have Therefore, the slope of both lines must
be
We must now find an equation of the line passing through having
a slope of
Apply the point-slope formula.
Substitute and for
Clear parentheses.
Write the answer in slope-intercept form.
9. Find an equation of a line containing and parallel to
Write the answer in slope-intercept form.
We can verify the answer to Example 7 by graphing both lines. We see that the
line passes through the point and is parallel to the line
See Figure 2-25.y � �4x � 8.
1�2, �32y � �4x � 11
2x � y � 7.14, �12Skill Practice
y � �4x � 11
y � 3 � �4x � 8
y � 3 � �41x � 221x1, y12.1�2, �32m � �4 y � 1�32 � �4 3x � 1�22 4
y � y1 � m1x � x12�4.
1�2, �32�4.
y � �4x � 8.
4x � y � 8
4x � y � 8,1�2, �32.
4x � y � 8.
1�2, �32
Example 7
1�1, �12.1�5, 22
Skill Practice
Skill Practice Answers
8.
9. y � 2x � 9
y � �34
x �74
x
y
8 10�8�10�12 �6 2 4 6
�4
�6
�8
�10
�12
8
10
12
2
�2�4 12
6
4
�2
y � �4x � 11
(�2, �3)
y � �4x � 8
Figure 2-25
IA
Section 2.4 Equations of a Line 145
miL2872X_ch02_103-176 09/14/2006 06:42 PM Page 145CONFIRMING PAGES
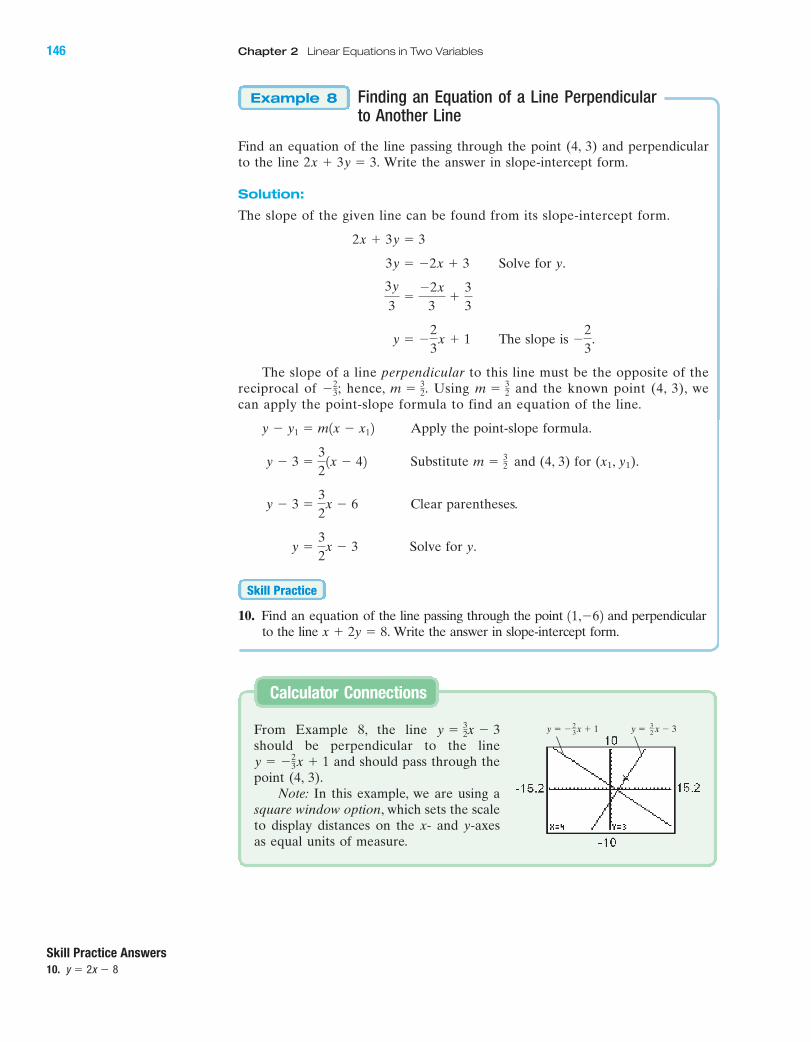
Finding an Equation of a Line Perpendicularto Another Line
Find an equation of the line passing through the point (4, 3) and perpendicular
to the line Write the answer in slope-intercept form.
Solution:
The slope of the given line can be found from its slope-intercept form.
Solve for y.
The slope is
The slope of a line perpendicular to this line must be the opposite of the
reciprocal of hence, Using and the known point (4, 3), we
can apply the point-slope formula to find an equation of the line.
Apply the point-slope formula.
Substitute and (4, 3) for (x1, y1).
Clear parentheses.
Solve for y.
10. Find an equation of the line passing through the point and perpendicular
to the line Write the answer in slope-intercept form.x � 2y � 8.11,�62
Skill Practice
y �3
2x � 3
y � 3 �3
2x � 6
m � 32 y � 3 �
3
21x � 42
y � y1 � m1x � x12
m � 32m � 3
2.�23;
�2
3. y � �
2
3x � 1
3y
3�
�2x
3�
3
3
3y � �2x � 3
2x � 3y � 3
2x � 3y � 3.
Example 8
Skill Practice Answers
10. y � 2x � 8
From Example 8, the line
should be perpendicular to the line
and should pass through the
point (4, 3).
Note: In this example, we are using a
square window option, which sets the scale
to display distances on the x- and y-axes
as equal units of measure.
y � �23x � 1
y � 32x � 3
Calculator Connections
y � � x � 123 y � x � 33
2
IA
146 Chapter 2 Linear Equations in Two Variables
miL2872X_ch02_103-176 09/14/2006 06:42 PM Page 146CONFIRMING PAGES

3. Different Forms of Linear EquationsA linear equation can be written in several different forms, as summarized in
Table 2-2.
Skill Practice Answers
11. y � 50
Form Example Comments
Standard FormA and B must not both be zero.
Horizontal LineThe slope is zero, and the y-intercept
(k is constant) is (0, k).
Vertical LineThe slope is undefined and the x-intercept
(k is constant) is (k, 0).
Slope-Intercept Form Solving a linear equation for y results in
slope-intercept form. The coefficient of
Slope is m. the x-term is the slope, and the constant
y-Intercept is (0, b). y-Intercept is (0, 5). defines the location of the y-intercept.
Point-Slope FormulaThis formula is typically used to build
Slope is m and an equation of a line when a point on
is a point on the line. the line is known and the slope is known.y � 1 � �21x � 321x1, y12
1x1, y12 � 13, 12y � y1 � m1x � x12m � �2
Slope � �2
y � mx � by � �2x � 5
x � �2x � k
y � 3y � k
2x � 3y � 6Ax � By � C
Although it is important to understand and apply slope-intercept form and the
point-slope formula, they are not necessarily applicable to all problems. Example 9
illustrates how a little ingenuity may lead to a simple solution.
Finding an Equation of a Line
Find an equation of the line passing through the point (�4, 1) and perpendicular
to the x-axis.
Solution:
Any line perpendicular to the x-axis must be vertical. Recall that all vertical
lines can be written in the form where k is constant. A quick sketch
can help find the value of the constant (Figure 2-26).
Because the line must pass through a point whose x-coordinate is �4, the
equation of the line is x � �4.
x � k,
Example 9
y
x
(�4, 1)
x � �4�5
�4
�3
�2
�1
1
2
3
4
5
�1 1 2 3 4 5�2�3�4�5
Figure 2-26
Table 2-2
IA
11. Write an equation of the line through the point (20, 50) and having a
slope of 0.
Skill Practice
Section 2.4 Equations of a Line 147
miL2872X_ch02_103-176 09/14/2006 06:42 PM Page 147CONFIRMING PAGES
Study Skills Exercises
1. For this chapter, find the page numbers for the Chapter Review Exercises, the Chapter Test, and the
Cumulative Review Exercises.
Chapter Review Exercises, page(s)
Chapter Test, page(s)
Cumulative Review Exercises, page(s)
Compare these features and state the advantages of each.
2. Define the key terms.
a. Standard form b. Slope-intercept form c. Point-slope formula
Review Exercises
3. Given
a. Find the x-intercept. b. Find the y-intercept. c. Sketch the graph.
4. Using slopes, how do you determine whether two lines are parallel?
5. Using the slopes of two lines, how do you determine whether the lines are
perpendicular?
6. Write the formula to find the slope of a line given two points and .
7. Given the two points (�1, �2) and (2, 4),
a. Find the slope of the line containing the two points.
b. Find the slope of a line parallel to the line containing the points.
c. Find the slope of a line perpendicular to the line containing the points.
Concept 1: Slope-Intercept Form
For Exercises 8–17, determine the slope and the y-intercept of the line.
8. 9. 10. 11.
12. 13. 14. 15.
16. 17. y � �2.5x � 1.8y � 0.625x � 1.2
�9x � 10y � �48x � 12y � 9�7 �1
2y18 � 2y
x � y � 017x � y � 0�7x � y � �5�3x � y � 2
1x2, y221x1, y12
x2
�y
3� 1
4 5�4�5 �3 1 2 3
�2
�3
�4
�5
4
5
1
�1�2
3
2
�1
x
y
Boost your GRADE atmathzone.com!
• Practice Problems • e-Professors
• Self-Tests • Videos
• NetTutor
Section 2.4 Practice Exercises
IA
148 Chapter 2 Linear Equations in Two Variables
miL2872X_ch02_103-176 09/14/2006 06:42 PM Page 148CONFIRMING PAGES
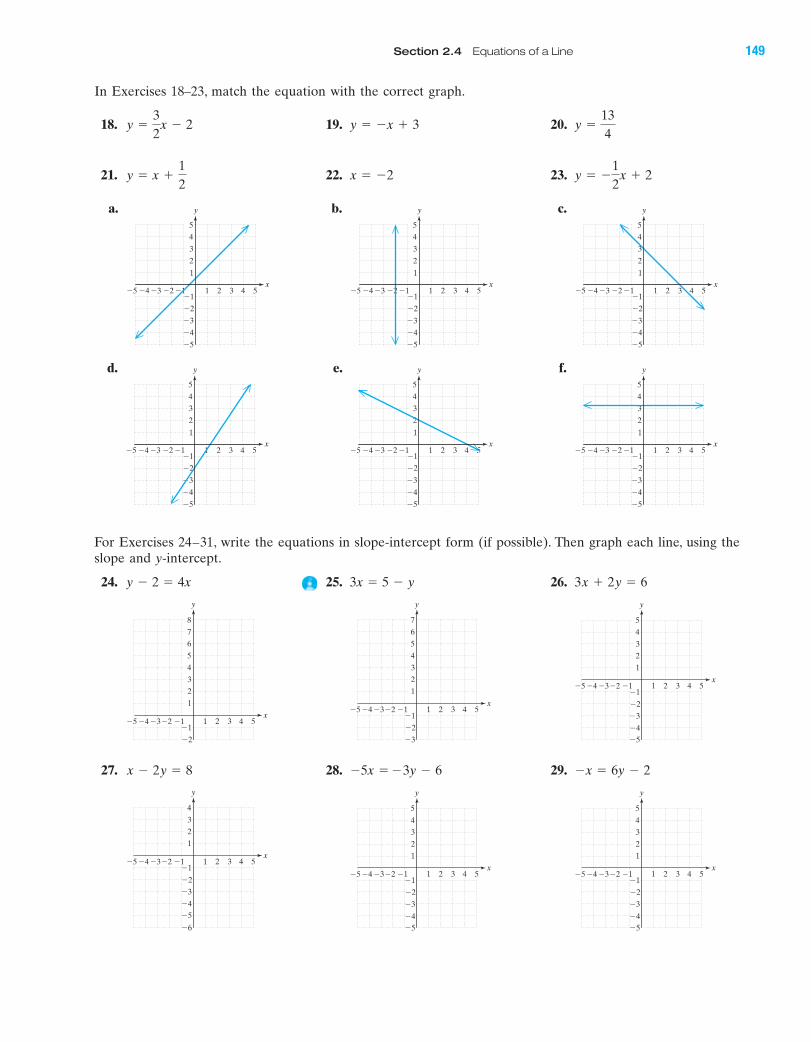
In Exercises 18–23, match the equation with the correct graph.
18. 19. 20.
21. 22. 23.
a. b. c.
d. e. f.
For Exercises 24–31, write the equations in slope-intercept form (if possible). Then graph each line, using the
slope and y-intercept.
24. 25. 26.
27. 28. 29.
4 5�4�5 �3 1 2 3
�2
�3
�4
�5
4
5
�1�1�2
y
x
3
2
1
4 5�4�5 �3 1 2 3
�2
�3
�4
�5
4
5
�1�1�2
y
x
3
2
14 5�4�5 �3 1 2 3
�2
�3
�4
�5
�6
4
�1�1�2
y
x
3
2
1
�x � 6y � 2�5x � �3y � 6x � 2y � 8
4 5�4�5 �3 1 2 3
�2
�3
�4
�5
4
5
�1�1�2
y
x
3
2
1
4 5�4�5 �3 1 2 3
�2
�3
4
5
6
7
�1�1�2
y
x
3
2
1
4 5�4�5 �3 1 2 3
�2
4
5
6
7
8
�1�1�2
y
x
3
2
1
3x � 2y � 63x � 5 � yy � 2 � 4x
4 5�4�5 �3 1 2 3
�2
�3
�4
�5
4
5
1
�1�2
3
2
�1
x
y
4 5�4�5 �3 1 2 3
�2
�3
�4
�5
4
5
1
�1�2
3
2
�1
x
y
4 5�4�5 �3 1 2 3
�2
�3
�4
�5
4
5
1
�1�2
3
2
�1
x
y
4 5�4�5 �3 1 2 3
�2
�3
�4
�5
4
5
1
�1�2
3
2
�1
x
y
4 5�4�5 �3 1 2 3
�2
�3
�4
�5
4
5
1
�1�2
3
2
�1
x
y
4 5�4�5 �3 1 2 3
�2
�3
�4
�5
4
5
1
�1�2
3
2
�1
x
y
y � �1
2x � 2x � �2y � x �
1
2
y �13
4y � �x � 3y �
3
2x � 2
IA
Section 2.4 Equations of a Line 149
miL2872X_ch02_103-176 09/14/2006 06:42 PM Page 149CONFIRMING PAGES

30. 31.
32. Given the standard form of a linear equation solve for y and write the equation in
slope-intercept form. What is the slope of the line? What is the y-intercept?
33. Use the result of Exercise 32 to determine the slope and y-intercept of the line
For Exercises 34–39, determine if the lines are parallel, perpendicular, or neither.
34. 35. 36.
37. 38. 39.
For Exercises 40–51, use the slope-intercept form of a line to find an equation of the line having the given slope
and passing through the given point.
40. 41. 42.
43. 44. 45.
46. 47. 48.
49. 50. 51.
Concept 2: The Point-Slope Formula
For Exercises 52–79, write an equation of the line satisfying the given conditions. Write the answer in slope-
intercept form or standard form.
52. The line passes through the point and has a slope of 3.
53. The line passes through the point (0, 5) and has a slope of
54. The line passes through the point (2, 7) and has a slope of 2.
55. The line passes through the point (3, 10) and has a slope of
56. The line passes through the point and has a slope of
57. The line passes through the point and has a slope of 4.1�1, �62�3.1�2, �52
�2.
�12.
10, �22
m � 0, 11, 42m � 0, 11, 22m � �4, 10, 32
m � 3, 10, 52m �3
8, 1�2, 42m � �
2
7, 1�3, 12
m � �4
5, 110, 02m �
3
4, 14, 02m � �2, 1�4, �32
m � �4, 1�1, �22m � 3, 1�1, 52m � 2, 14, �32
�6x � 2y � 65x � 3y � 9y � 1 � 4x
�y � 3x � 23y � 5x � 64.8x � 1.2y � 3.6
1
2x �
2
3y � 13x �
1
2y � 06x � 10y � 12
3x � 4y � 12x � 6y � 3�3y � 5x � 1
3x � 7y � 9.
Ax � By � C, B � 0,
4 5�4�5 �3 1 2 3
�2
�3
�4
�5
4
5
�1�1�2
y
x
3
2
1
4 5 6 7�3 1 2 3
�2
�3
�4
�5
4
5
�1�1�2
y
x
3
2
1
3x � y � 02x � 5y � 0
IA
150 Chapter 2 Linear Equations in Two Variables
miL2872X_ch02_103-176 09/14/2006 06:43 PM Page 150CONFIRMING PAGES
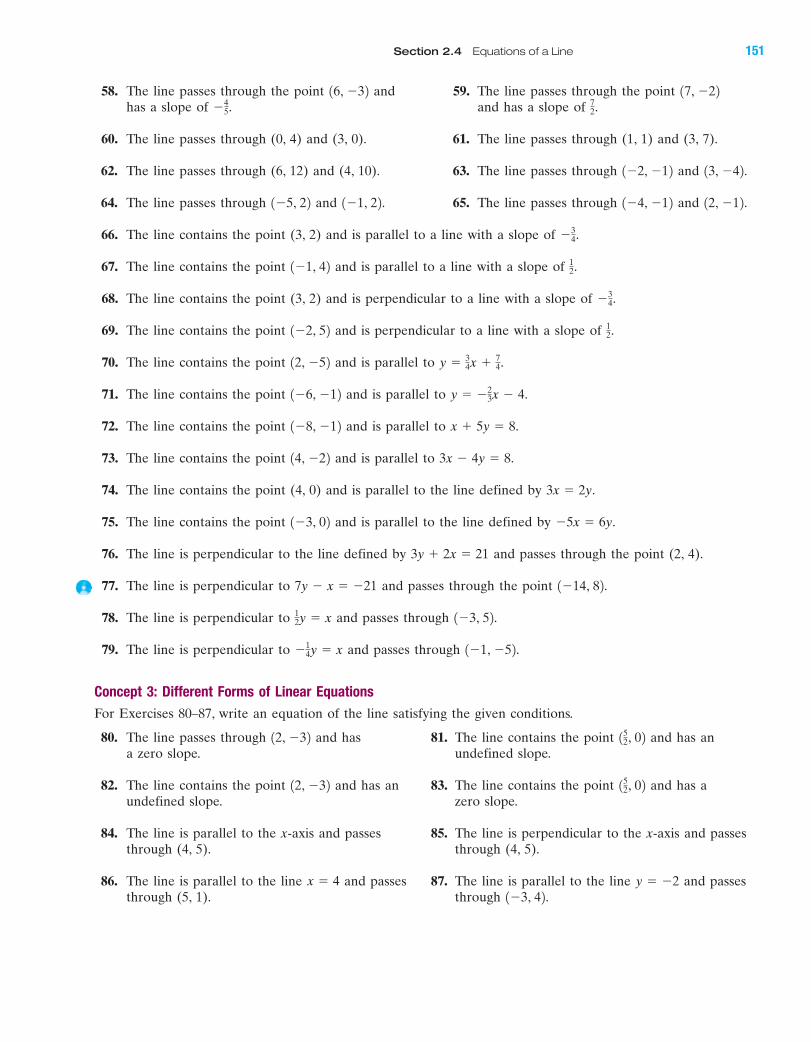
58. The line passes through the point and 59. The line passes through the point
has a slope of and has a slope of
60. The line passes through (0, 4) and (3, 0). 61. The line passes through (1, 1) and (3, 7).
62. The line passes through (6, 12) and (4, 10). 63. The line passes through and
64. The line passes through and 65. The line passes through and
66. The line contains the point (3, 2) and is parallel to a line with a slope of
67. The line contains the point and is parallel to a line with a slope of
68. The line contains the point (3, 2) and is perpendicular to a line with a slope of
69. The line contains the point and is perpendicular to a line with a slope of
70. The line contains the point and is parallel to
71. The line contains the point and is parallel to
72. The line contains the point and is parallel to
73. The line contains the point and is parallel to
74. The line contains the point (4, 0) and is parallel to the line defined by
75. The line contains the point and is parallel to the line defined by
76. The line is perpendicular to the line defined by and passes through the point (2, 4).
77. The line is perpendicular to and passes through the point
78. The line is perpendicular to and passes through
79. The line is perpendicular to and passes through
Concept 3: Different Forms of Linear Equations
For Exercises 80–87, write an equation of the line satisfying the given conditions.
80. The line passes through and has 81. The line contains the point and has an
a zero slope. undefined slope.
82. The line contains the point and has an 83. The line contains the point and has a
undefined slope. zero slope.
84. The line is parallel to the x-axis and passes 85. The line is perpendicular to the x-axis and passes
through (4, 5). through (4, 5).
86. The line is parallel to the line and passes 87. The line is parallel to the line and passes
through (5, 1). through 1�3, 42.y � �2x � 4
152, 0212, �32
152, 0212, �32
1�1, �52.�14y � x
1�3, 52.12y � x
1�14, 82.7y � x � �21
3y � 2x � 21
�5x � 6y.1�3, 023x � 2y.
3x � 4y � 8.14, �22x � 5y � 8.1�8, �12y � �2
3x � 4.1�6, �12y � 3
4x � 74.12, �52
12.1�2, 52
�34.
12.1�1, 42
�34.
12, �12.1�4, �121�1, 22.1�5, 2213, �42.1�2, �12
72.�4
5.
17, �2216, �32
IA
Section 2.4 Equations of a Line 151
miL2872X_ch02_103-176 09/14/2006 06:43 PM Page 151CONFIRMING PAGES

Expanding Your Skills
88. Is the equation in slope-intercept form? Identify the slope and y-intercept.
89. Is the equation in slope-intercept form? Identify the slope and y-intercept.
90. Is the equation in slope-intercept form? Identify the slope and the y-intercept.
91. Is the equation in slope-intercept form? Identify the slope and the y-intercept.
Graphing Calculator Exercises
92. Use a graphing calculator to graph the lines on 93. Use a graphing calculator to graph the lines on
the same viewing window. Then explain how the the same viewing window. Then explain how the
lines are related. lines are related.
94. Use a graphing calculator to graph the lines on 95. Use a graphing calculator to graph the lines
the same viewing window. Then explain how the on the same viewing window. Then explain how
lines are related. the lines are related.
96. Use a graphing calculator to graph the lines on 97. Use a graphing calculator to graph the lines on a
a square viewing window. Then explain how square viewing window. Then explain how the lines
the lines are related. are related.
98. Use a graphing calculator to graph the equation 99. Use a graphing calculator to graph the equation
from Exercise 60. Use an Eval feature to verify from Exercise 61. Use an Eval feature to verify
that the line passes through the points (0, 4) that the line passes through the points (1, 1)
and (3, 0). and (3, 7).
y2 � �2x � 3 y2 � �1
4x � 1
y1 �1
2x � 3 y1 � 4x � 1
y3 � �4x � 1 y3 � 3x � 2
y2 � �3x � 1 y2 � 2x � 2
y1 � �2x � 1 y1 � x � 2
y2 � �1
3x � 3y2 �
1
2x � 2
y1 � �1
3x � 5y1 �
1
2x � 4
y � �5
y � 3
x � 1
x � �2
IA
152 Chapter 2 Linear Equations in Two Variables
miL2872X_ch02_103-176 09/14/2006 06:43 PM Page 152CONFIRMING PAGES
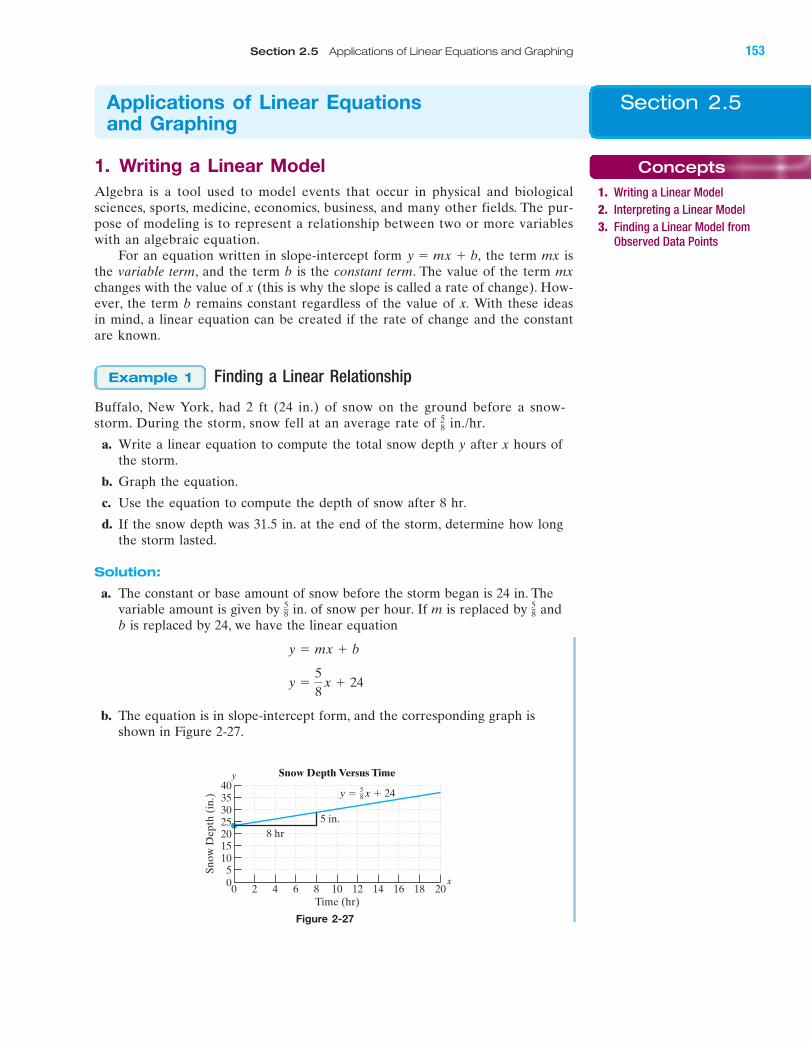
IA
1. Writing a Linear ModelAlgebra is a tool used to model events that occur in physical and biological
sciences, sports, medicine, economics, business, and many other fields. The pur-
pose of modeling is to represent a relationship between two or more variables
with an algebraic equation.
For an equation written in slope-intercept form the term mx is
the variable term, and the term b is the constant term. The value of the term mxchanges with the value of x (this is why the slope is called a rate of change). How-
ever, the term b remains constant regardless of the value of x. With these ideas
in mind, a linear equation can be created if the rate of change and the constant
are known.
Finding a Linear Relationship
Buffalo, New York, had 2 ft (24 in.) of snow on the ground before a snow-
storm. During the storm, snow fell at an average rate of in./hr.
a. Write a linear equation to compute the total snow depth y after x hours of
the storm.
b. Graph the equation.
c. Use the equation to compute the depth of snow after 8 hr.
d. If the snow depth was 31.5 in. at the end of the storm, determine how long
the storm lasted.
Solution:
a. The constant or base amount of snow before the storm began is 24 in. The
variable amount is given by in. of snow per hour. If m is replaced by and
b is replaced by 24, we have the linear equation
b. The equation is in slope-intercept form, and the corresponding graph is
shown in Figure 2-27.
y �5
8 x � 24
y � mx � b
58
58
58
Example 1
y � mx � b,
x
y40353025201510500 20
Sn
ow
Dep
th (
in.)
Time (hr)
5 in.
8 hr
Snow Depth Versus Time
2 4 6 8 10 12 14 16 18
y � x � 2458
Figure 2-27
Section 2.5Applications of Linear Equations and Graphing
Concepts
1. Writing a Linear Model2. Interpreting a Linear Model3. Finding a Linear Model from
Observed Data Points
Section 2.5 Applications of Linear Equations and Graphing 153
miL2872X_ch02_103-176 09/14/2006 06:43 PM Page 153CONFIRMING PAGES
c.
Substitute .
Solve for y.
in.
The snow depth was 29 in. after 8 hr. The corresponding ordered pair is
(8, 29) and can be confirmed from the graph.
d.
Substitute .
Multiply by 8 to clear fractions.
Clear parentheses.
Solve for x.
The storm lasted for 12 hr. The corresponding ordered pair is (12, 31.5)
and can be confirmed from the graph.
1. When Joe graduated from college, he had $1000 in his savings account.
When he began working, he decided he would add $120 per month to his
savings account.
a. Write a linear equation to compute the amount of money y in Joe’s
account after x months of saving.
b. Use the equation to compute the amount of money in Joe’s account
after 6 months.
c. Joe needs $3160 for a down payment for a car. How long will it take for
Joe’s account to reach this amount?
2. Interpreting a Linear Model
Interpreting a Linear Model
In 1938, President Franklin D. Roosevelt signed a bill enacting the Fair Labor
Standards Act of 1938 (FLSA). In its final form, the act banned oppressive
child labor and set the minimum hourly wage at 25 cents and the maximum
workweek at 44 hr. Over the years, the minimum hourly wage has been
increased by the government to meet the rising cost of living.
The minimum hourly wage y (in dollars per hour) in the United States
between 1960 and 2005 can be approximated by the equation
y � 0.10x � 0.82 x 0
Example 2
Skill Practice
12 � x
60 � 5x
252 � 5x � 192
8131.52 � 8 a5
8 x � 24b
y � 31.5 31.5 �5
8 x � 24
y �5
8 x � 24
y � 29
y � 5 � 24
x � 8y �5
8 182 � 24
y �5
8x � 24
IA
154 Chapter 2 Linear Equations in Two Variables
Skill Practice Answers
1a.
b. $1720 c. 18 monthsy � 120x � 1000
miL2872X_ch02_103-176 09/14/2006 06:43 PM Page 154CONFIRMING PAGES

IA
Section 2.5 Applications of Linear Equations and Graphing 155
where x represents the number of years since 1960 ( corresponds to 1960,
corresponds to 1961, and so on) (Figure 2-28).
a. Find the slope of the line and interpret the meaning of the slope in the
context of this problem.
b. Find the y-intercept of the line and interpret the meaning of the
y-intercept in the context of this problem.
c. Use the linear equation to approximate the minimum wage in 1985.
d. Use the linear equation to predict the minimum wage in the year 2010.
Solution:
a. The equation is written in slope-intercept form. The slope
is 0.10 and indicates that minimum hourly wage rose an average of $0.10
per year between 1960 and 2005.
b. The y-intercept is (0, 0.82). The y-intercept indicates that the minimum
wage in the year 1960 was approximately $0.82 per hour. (The
actual value of minimum wage in 1960 was $1.00 per hour.)
c. The year 1985 is 25 years after the year 1960. Substitute into the
linear equation.
Substitute
According to the linear model, the minimum wage in 1985 was approximately
$3.32 per hour. (The actual minimum wage in 1985 was $3.35 per hour.)
d. The year 2010 is 50 years after the year 1960. Substitute into the
linear equation.
Substitute
According to the linear model, minimum wage in 2010 will be approximately
$5.82 per hour provided the linear trend continues. (How does this com-
pare with the current value for minimum wage?)
y � 5.82
x � 50.y � 0.101502 � 0.82
y � 0.10x � 0.82
x � 50
y � 3.32
y � 2.50 � 0.82
x � 25.y � 0.101252 � 0.82
y � 0.10x � 0.82
x � 25
1x � 02
y � 0.10x � 0.82
x � 1
x � 0
Figure 2-28
5
6
00 5 10 15 20 25 30 35 40 45 50
Min
imu
m W
age (
$/h
r)
Year (x � 0 corresponds to 1960)
y � 0.10x � 0.82
Minimum Wage Earnings per Hour Versus Year
4
3
2
1
y
x
miL2872X_ch02_103-176 09/14/2006 06:43 PM Page 155CONFIRMING PAGES
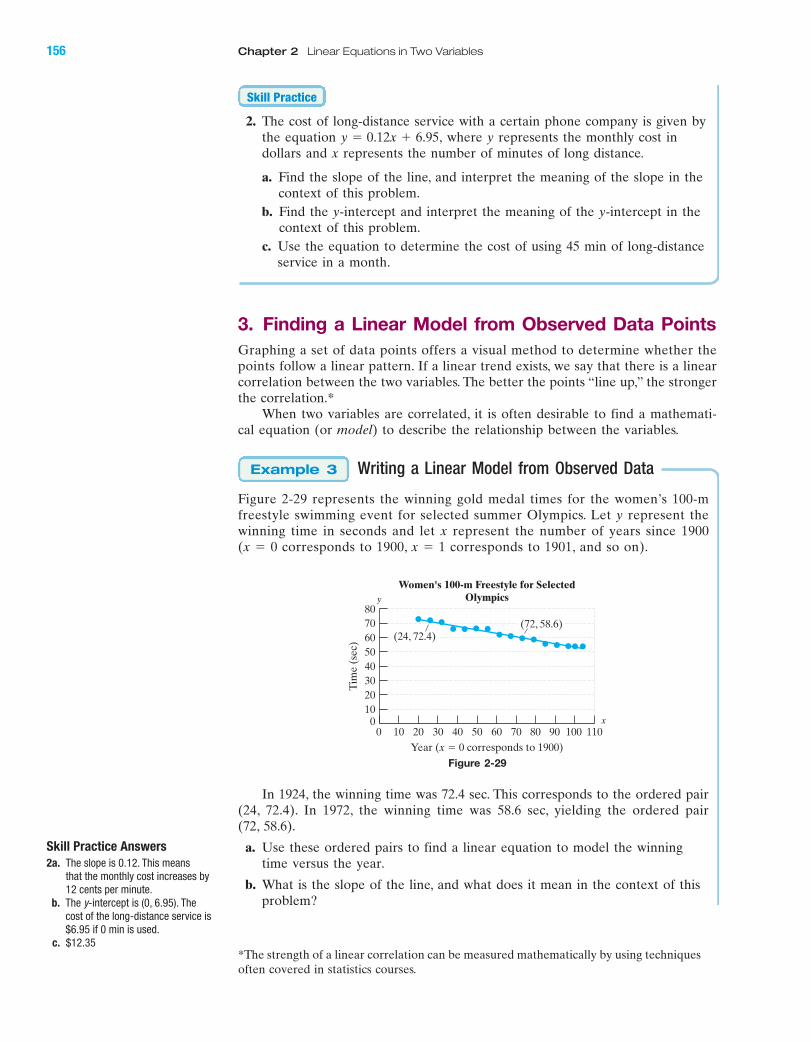
2. The cost of long-distance service with a certain phone company is given by
the equation where y represents the monthly cost in
dollars and x represents the number of minutes of long distance.
a. Find the slope of the line, and interpret the meaning of the slope in the
context of this problem.
b. Find the y-intercept and interpret the meaning of the y-intercept in the
context of this problem.
c. Use the equation to determine the cost of using 45 min of long-distance
service in a month.
3. Finding a Linear Model from Observed Data PointsGraphing a set of data points offers a visual method to determine whether the
points follow a linear pattern. If a linear trend exists, we say that there is a linear
correlation between the two variables. The better the points “line up,” the stronger
the correlation.*
When two variables are correlated, it is often desirable to find a mathemati-
cal equation (or model) to describe the relationship between the variables.
Writing a Linear Model from Observed Data
Figure 2-29 represents the winning gold medal times for the women’s 100-m
freestyle swimming event for selected summer Olympics. Let y represent the
winning time in seconds and let x represent the number of years since 1900
(x � 0 corresponds to 1900, x � 1 corresponds to 1901, and so on).
In 1924, the winning time was 72.4 sec. This corresponds to the ordered pair
(24, 72.4). In 1972, the winning time was 58.6 sec, yielding the ordered pair
(72, 58.6).
a. Use these ordered pairs to find a linear equation to model the winning
time versus the year.
b. What is the slope of the line, and what does it mean in the context of this
problem?
Example 3
y � 0.12x � 6.95,
Skill Practice
Tim
e (
sec)
Year (x � 0 corresponds to 1900)
0 10 20 30 40 50 60 70 80 90 100 1100
10
20
30
40
50
60
70
80
Women's 100-m Freestyle for SelectedOlympics
(24, 72.4)(72, 58.6)
x
y
Figure 2-29
Skill Practice Answers
2a. The slope is 0.12. This means that the monthly cost increases by12 cents per minute.
b. The y-intercept is (0, 6.95). Thecost of the long-distance service is$6.95 if 0 min is used.
c. $12.35*The strength of a linear correlation can be measured mathematically by using techniques
often covered in statistics courses.
IA
156 Chapter 2 Linear Equations in Two Variables
miL2872X_ch02_103-176 09/14/2006 06:43 PM Page 156CONFIRMING PAGES

IA
Section 2.5 Applications of Linear Equations and Graphing 157
c. Use the linear equation to approximate the winning time for the 1964
Olympics.
d. Would it be practical to use the linear model to predict the winning time
in the year 2048?
Solution:
a. The slope formula can be used to compute the slope of the line between
the two points. (Round the slope to 2 decimal places.)
(24, 72.4) and (72, 58.6)
and
Hence,
Apply the point-slope formula,
using and the point
(24, 72.4).
Clear parentheses.
Solve for y.
The answer is in slope-intercept
form.
b. The slope is �0.29 and indicates that the winning time in the women’s
100-m Olympic freestyle event has decreased on average by 0.29 sec/yr
during this period.
c. The year 1964 is 64 years after the year 1900. Substitute into the
linear model.
Substitute
According to the linear model, the winning time in 1964 was approxi-
mately 60.8 sec. (The actual winning time in 1964 was set by Dawn Fraser
from Australia in 59.5 sec. The linear equation can only be used to
approximate the winning time.)
d. It would not be practical to use the linear model to
predict the winning time in the year 2048. There is no guarantee that the
linear trend will continue beyond the last observed data point in 2004. In
fact, the linear trend cannot continue indefinitely; otherwise, the swimmers’
times would eventually be negative. The potential for error increases for
predictions made beyond the last observed data value.
3. The figure shows data relating the cost of college
textbooks in dollars to the number of pages in
the book. Let y represent the cost of the book,
and let x represent the number of pages.
a. Use the ordered pairs indicated in the figure
to write a linear equation to model the cost of
textbooks versus the number of pages.
b.
Skill Practice
y � �0.29x � 79.36
y � 60.8
y � �18.56 � 79.36
x � 64.y � �0.291642 � 79.36
y � �0.29x � 79.36
x � 64
y � �0.29x � 79.36
y � �0.29x � 6.96 � 72.4
y � 72.4 � �0.29x � 6.96
y � 72.4 � �0.291x � 242m � �0.29
y � y1 � m1x � x12m L �0.29.m �
y2 � y1
x2 � x1
�58.6 � 72.4
72 � 24� �0.2875
1x2, y221x1, y12
Co
st (
$)
Number of Pages
0 100 200 300 400 5000
20
40
60
80
100
120
Cost of Textbook versus Number of Pages
(200, 57)
(400, 107)
y
x Skill Practice Answers
3a.
b. $97y � 0.25x � 7
miL2872X_ch02_103-176 09/14/2006 06:43 PM Page 157CONFIRMING PAGES
Study Skills Exercise
1. On test day, take a look at any formulas or important points that you had to memorize before you enter the
classroom. Then when you sit down to take your test, write these formulas on the test or on scrap paper. This is
called a memory dump. Write down the formulas from Chapter 2.
Review Exercises
For Exercises 2–5,
a. Find the slope (if possible) of the line passing through the two points.
b. Find an equation of the line passing through the two points. Write the answer in slope-intercept form (if
possible) and in standard form.
c. Graph the line by using the slope and y-intercept. Verify that the line passes through the two given points.
2. 3.
4. 5.
Concept 1: Writing a Linear Model
6. A car rental company charges a flat fee of $19.95 plus $0.20 per mile.
a. Write an equation that expresses the cost y of renting a car if the car is driven for x miles.
4 5�4�5 �3 1 2 3
�2
�3
�4
�5
4
5
1
�1
y
x
2
�1
3
�24 5�4�5 �3 1 2 3
�2
�3
�4
�5
4
5
1
�1�2
y
x
2
�1
3
1�2, 42 and 1�2, 021�4, 32 and 1�2, 32
4 5�4�5 �3 1 2 3
�2
�3
�4
�5
4
5
1
�1�2
y
x
3
2
�14 5�4�5 �3 1 2 3
�2
�3
�4
�5
4
5
1
�1�2
y
x
3
2
�1
11, �12 and 13, �521�3, 02 and 13, �22
Boost your GRADE atmathzone.com!
• Practice Problems • e-Professors
• Self-Tests • Videos
• NetTutor
Section 2.5 Practice Exercises
IA
158 Chapter 2 Linear Equations in Two Variables
miL2872X_ch02_103-176 09/14/2006 06:43 PM Page 158CONFIRMING PAGES
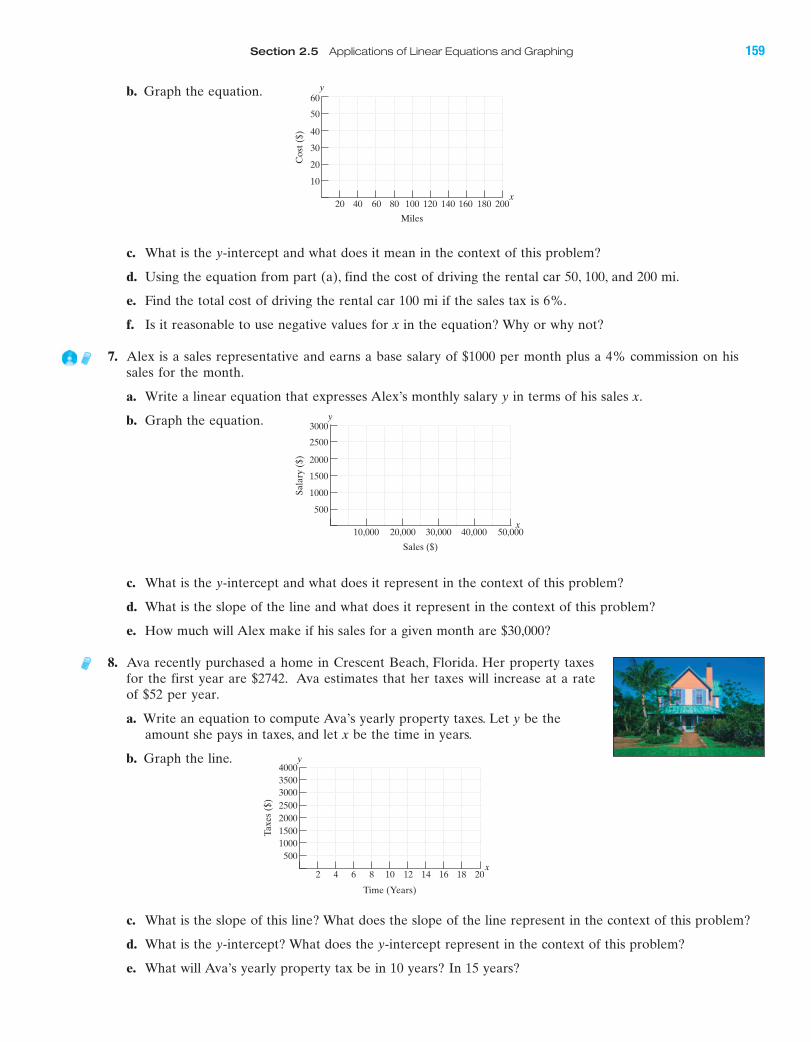
IA
Section 2.5 Applications of Linear Equations and Graphing 159
b. Graph the equation.
Sala
ry (
$)
Sales ($)
3000
500
1000
1500
2000
2500
50,00040,00030,00020,00010,000
y
x
Taxes
($)
Time (Years)
3000
3500
4000
500
1000
1500
2000
2500
2 4 6 8 10 12 14 16 18 20
y
x
Co
st (
$)
Miles
60
10
20
30
40
50
20 200180160140120100806040
y
x
c. What is the y-intercept and what does it mean in the context of this problem?
d. Using the equation from part (a), find the cost of driving the rental car 50, 100, and 200 mi.
e. Find the total cost of driving the rental car 100 mi if the sales tax is 6%.
f. Is it reasonable to use negative values for x in the equation? Why or why not?
7. Alex is a sales representative and earns a base salary of $1000 per month plus a 4% commission on his
sales for the month.
a. Write a linear equation that expresses Alex’s monthly salary y in terms of his sales x.
b. Graph the equation.
c. What is the y-intercept and what does it represent in the context of this problem?
d. What is the slope of the line and what does it represent in the context of this problem?
e. How much will Alex make if his sales for a given month are $30,000?
8. Ava recently purchased a home in Crescent Beach, Florida. Her property taxes
for the first year are $2742. Ava estimates that her taxes will increase at a rate
of $52 per year.
a. Write an equation to compute Ava’s yearly property taxes. Let y be the
amount she pays in taxes, and let x be the time in years.
b. Graph the line.
c. What is the slope of this line? What does the slope of the line represent in the context of this problem?
d. What is the y-intercept? What does the y-intercept represent in the context of this problem?
e. What will Ava’s yearly property tax be in 10 years? In 15 years?
miL2872X_ch02_103-176 09/14/2006 06:43 PM Page 159CONFIRMING PAGES
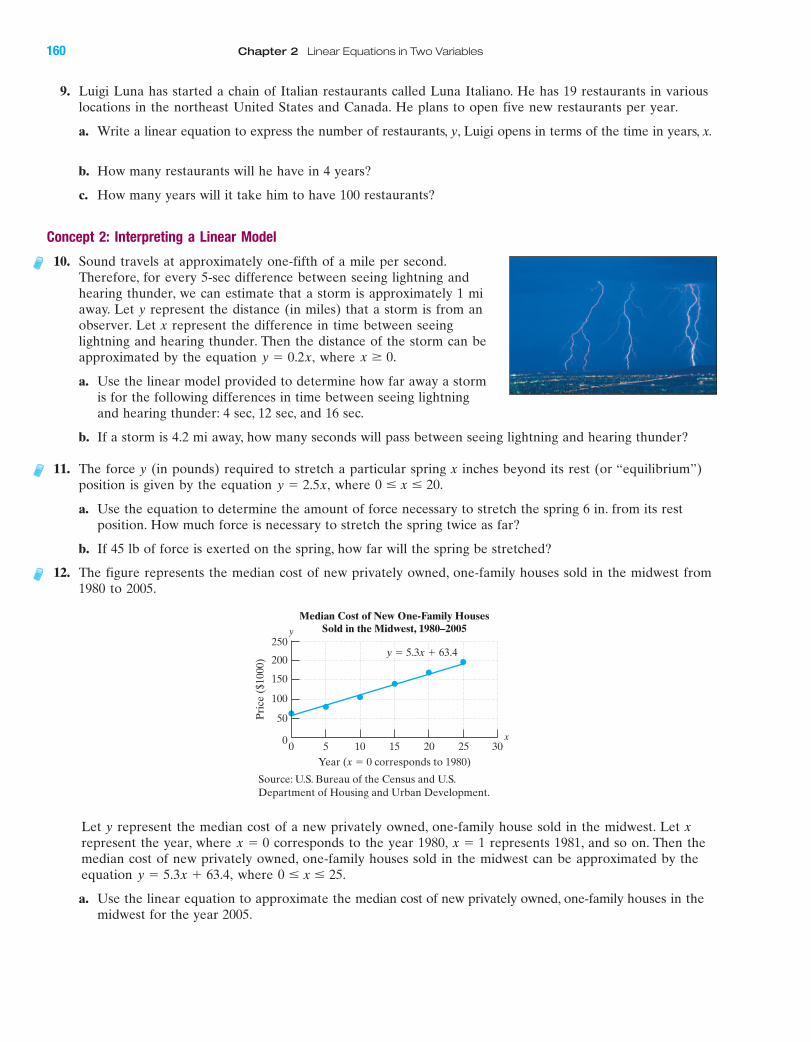
9. Luigi Luna has started a chain of Italian restaurants called Luna Italiano. He has 19 restaurants in various
locations in the northeast United States and Canada. He plans to open five new restaurants per year.
a. Write a linear equation to express the number of restaurants, y, Luigi opens in terms of the time in years, x.
b. How many restaurants will he have in 4 years?
c. How many years will it take him to have 100 restaurants?
Concept 2: Interpreting a Linear Model
10. Sound travels at approximately one-fifth of a mile per second.
Therefore, for every 5-sec difference between seeing lightning and
hearing thunder, we can estimate that a storm is approximately 1 mi
away. Let y represent the distance (in miles) that a storm is from an
observer. Let x represent the difference in time between seeing
lightning and hearing thunder. Then the distance of the storm can be
approximated by the equation where
a. Use the linear model provided to determine how far away a storm
is for the following differences in time between seeing lightning
and hearing thunder: 4 sec, 12 sec, and 16 sec.
b. If a storm is 4.2 mi away, how many seconds will pass between seeing lightning and hearing thunder?
11. The force y (in pounds) required to stretch a particular spring x inches beyond its rest (or “equilibrium”)
position is given by the equation where
a. Use the equation to determine the amount of force necessary to stretch the spring 6 in. from its rest
position. How much force is necessary to stretch the spring twice as far?
b. If 45 lb of force is exerted on the spring, how far will the spring be stretched?
12. The figure represents the median cost of new privately owned, one-family houses sold in the midwest from
1980 to 2005.
Let y represent the median cost of a new privately owned, one-family house sold in the midwest. Let xrepresent the year, where corresponds to the year 1980, represents 1981, and so on. Then the
median cost of new privately owned, one-family houses sold in the midwest can be approximated by the
equation where
a. Use the linear equation to approximate the median cost of new privately owned, one-family houses in the
midwest for the year 2005.
0 � x � 25.y � 5.3x � 63.4,
x � 1x � 0
200
250
150
100
50
00 5 10 15 20 25 30
x
y
Pri
ce (
$1000)
Year (x � 0 corresponds to 1980)
Median Cost of New One-Family HousesSold in the Midwest, 1980–2005
y � 5.3x � 63.4
0 � x � 20.y � 2.5x,
x 0.y � 0.2x,
Source: U.S. Bureau of the Census and U.S.
Department of Housing and Urban Development.
IA
160 Chapter 2 Linear Equations in Two Variables
miL2872X_ch02_103-176 09/14/2006 06:43 PM Page 160CONFIRMING PAGES

IAIA
Section 2.5 Applications of Linear Equations and Graphing 161
b. Use the linear equation to approximate the median cost for the year 1988, and compare it with the actual
median cost of $101,600.
c. What is the slope of the line and what does it mean in the context of this problem?
d. What is the y-intercept and what does it mean in the context of this problem?
13. Let y represent the average number of miles driven per year
for passenger cars in the United States between 1980 and
2005. Let x represent the year where corresponds to
1980, corresponds to 1981, and so on. The average
yearly mileage for passenger cars can be approximated by
the equation where
a. Use the linear equation to approximate the average
yearly mileage for passenger cars in the United States in
the year 2005.
b. Use the linear equation to approximate the average
mileage for the year 1985, and compare it with the actual value of 9700 mi.
c. What is the slope of the line and what does it mean in the context of this problem?
d. What is the y-intercept and what does it mean in the context of this problem?
Concept 3: Finding a Linear Model from Observed Data Points
14. The figure represents the winning heights for men’s pole vault in selected Olympic games.
a. Let y represent the winning height. Let x represent the year, where corresponds to the year 1900,
represents 1904, and so on. Use the ordered pairs given in the graph (0, 3.3) and (96, 5.92) to find a
linear equation to estimate the winning pole vault height versus the year. (Round the slope to three
decimal places.)
b. Use the linear equation from part (a) to approximate the winning vault for the 1920 Olympics.
c. Use the linear equation to approximate the winning vault for 1976.
d. The actual winning vault in 1920 was 4.09 m, and the actual winning vault in 1976 was 5.5 m. Are your
answers from parts (b) and (c) different from these? Why?
e. What is the slope of the line? What does the slope of the line mean in the context of this problem?
x � 4
x � 0
8
6
4
2
00 20 40 60 80 100 120
Heig
ht
(m)
Year (x � 0 corresponds to 1900)
(96, 5.92)
(0, 3.3)
Winning Pole Vault Height for SelectedOlympic Games
x
y
0 � x � 25.y � 142x � 9060,
x � 1
x � 012,000
14,000
10,000
8,000
6,000
4,000
2,000
00 5 10 15 20 25
Mil
es
Dri
ven
Year (x � 0 corresponds to 1980)
Average Yearly Mileage for PassengerCars, United States, 1980–2005
y � 142x � 9060
x
y
miL2872X_ch02_103-176 09/14/2006 06:43 PM Page 161CONFIRMING PAGES
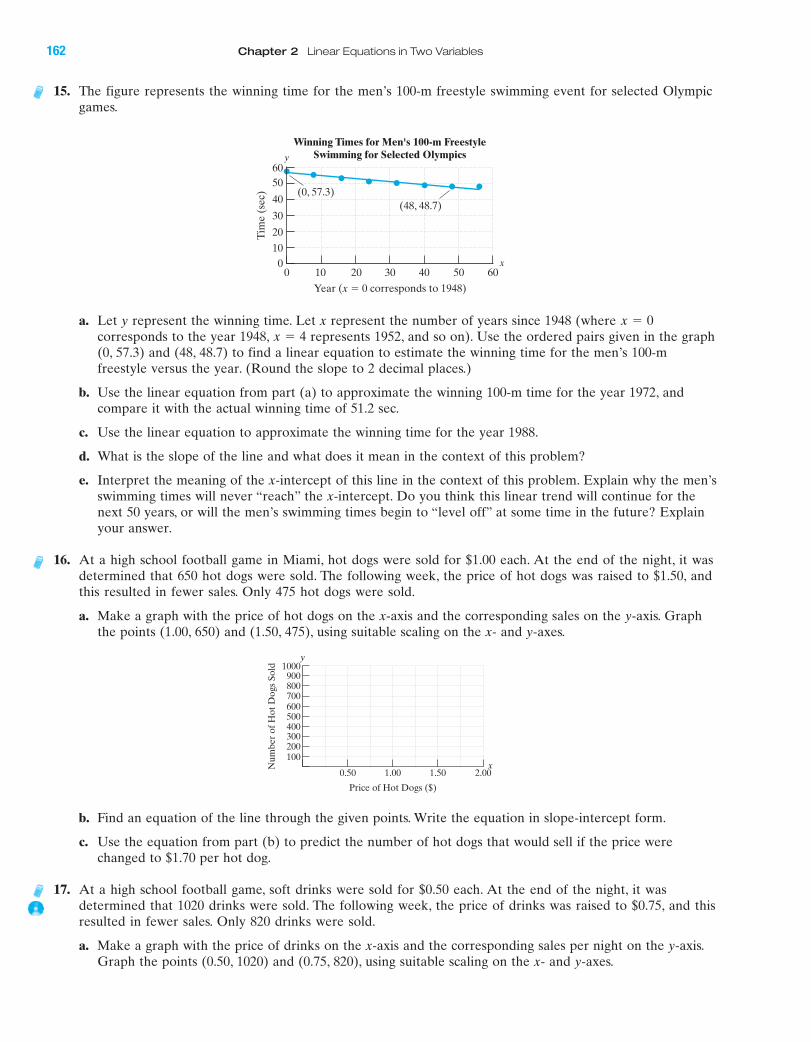
15. The figure represents the winning time for the men’s 100-m freestyle swimming event for selected Olympic
games.
a. Let y represent the winning time. Let x represent the number of years since 1948 (where
corresponds to the year 1948, represents 1952, and so on). Use the ordered pairs given in the graph
(0, 57.3) and (48, 48.7) to find a linear equation to estimate the winning time for the men’s 100-m
freestyle versus the year. (Round the slope to 2 decimal places.)
b. Use the linear equation from part (a) to approximate the winning 100-m time for the year 1972, and
compare it with the actual winning time of 51.2 sec.
c. Use the linear equation to approximate the winning time for the year 1988.
d. What is the slope of the line and what does it mean in the context of this problem?
e. Interpret the meaning of the x-intercept of this line in the context of this problem. Explain why the men’s
swimming times will never “reach” the x-intercept. Do you think this linear trend will continue for the
next 50 years, or will the men’s swimming times begin to “level off” at some time in the future? Explain
your answer.
16. At a high school football game in Miami, hot dogs were sold for $1.00 each. At the end of the night, it was
determined that 650 hot dogs were sold. The following week, the price of hot dogs was raised to $1.50, and
this resulted in fewer sales. Only 475 hot dogs were sold.
a. Make a graph with the price of hot dogs on the x-axis and the corresponding sales on the y-axis. Graph
the points (1.00, 650) and (1.50, 475), using suitable scaling on the x- and y-axes.
b. Find an equation of the line through the given points. Write the equation in slope-intercept form.
c. Use the equation from part (b) to predict the number of hot dogs that would sell if the price were
changed to $1.70 per hot dog.
17. At a high school football game, soft drinks were sold for $0.50 each. At the end of the night, it was
determined that 1020 drinks were sold. The following week, the price of drinks was raised to $0.75, and this
resulted in fewer sales. Only 820 drinks were sold.
a. Make a graph with the price of drinks on the x-axis and the corresponding sales per night on the y-axis.
Graph the points (0.50, 1020) and (0.75, 820), using suitable scaling on the x- and y-axes.
x � 4
x � 0
50
60
40
30
20
10
00 10 20 30 40 6050
Tim
e (
sec)
Year (x � 0 corresponds to 1948)
Winning Times for Men's 100-m FreestyleSwimming for Selected Olympics
(48, 48.7)
(0, 57.3)
x
y
Nu
mb
er
of
Ho
t D
ogs
So
ld
Price of Hot Dogs ($)
1000900800700600500400300200100
0.50 1.00 1.50 2.00
y
x
IA
162 Chapter 2 Linear Equations in Two Variables
miL2872X_ch02_103-176 09/14/2006 06:43 PM Page 162CONFIRMING PAGES

IA
Section 2.5 Applications of Linear Equations and Graphing 163
b. Find an equation of the line through the given points. Write the equation in slope-intercept form.
c. Use the equation from part (b) to predict the number of drinks that would sell if the price were changed
to $0.85 per drink.
Expanding Your Skills
18. Loraine is enrolled in an algebra class that meets 5 days per
week. Her instructor gives a test every Friday. Loraine has a
study plan and keeps a portfolio with notes, homework, test
corrections, and vocabulary. She also records the amount of
time per day that she studies and does homework. The
following data represent the amount of time she studied per
day and her weekly test grades.
a. Graph the points on a rectangular coordinate system. Do
the data points appear to follow a linear trend?
b. Find a linear equation that relates Loraine’s weekly test score y to the amount of time she studied per
day x. (Hint: Pick two ordered pairs from the observed data, and find an equation of the line through the
points.)
c. How many minutes should Loraine study per day in order to score at least 90% on her weekly
examination? Would the equation used to determine the time Loraine needs to study to get 90% work
for other students? Why or why not?
d. If Loraine is only able to spend hr/day studying her math, predict her test score for that week.
Points are collinear if they lie on the same line. For Exercises 19–22, use the slope formula to determine if the
points are collinear.
19. 20.
21. 22. 1�2, �22 10, �32 1�4, �1210, 22 1�2, 122 1�1, 6214, 32 1�4, �12 12, 2213, �42 10, �52 19, �22
12
Test
Sco
re (
%)
Minutes
90
80
7060
50
403020
10
10 20 30 40 50 60 70 80 90 100
y
x
Time Studied per Day Weekly Test Grade (min) (percent)
x y
60 69
70 74
80 79
90 84
100 89
Nu
mb
er
of
Dri
nk
s S
old
Price of Drinks ($)
1600
1400
1200
1000
800
600
400
200
0.25 0.50 0.75 1.00
y
x
miL2872X_ch02_103-176 09/14/2006 06:43 PM Page 163CONFIRMING PAGES

Graphing Calculator Exercises
23. Use a Table feature to confirm your answers to 24. Use a Table feature to confirm your answers to
Exercise 11. Exercise 10(a).
25. Graph the line y � �800x � 1420 on the viewing window defined by 0 � x � 1 and 0 � y � 1600. Use
the Trace key to support your answer to Exercise 17 by showing that the line passes through the points
(0.50, 1020) and (0.75, 820).
26. Graph the line y � �350x � 1000 on the viewing window defined by 0 � x � 2 and 0 � y � 1000. Use
the Trace key to support your answer to Exercise 16 by showing that the line passes through the points
(1.00, 650) and (1.50, 475).
IA
164 Chapter 2 Linear Equations in Two Variables
miL2872X_ch02_103-176 09/14/2006 06:43 PM Page 164CONFIRMING PAGES
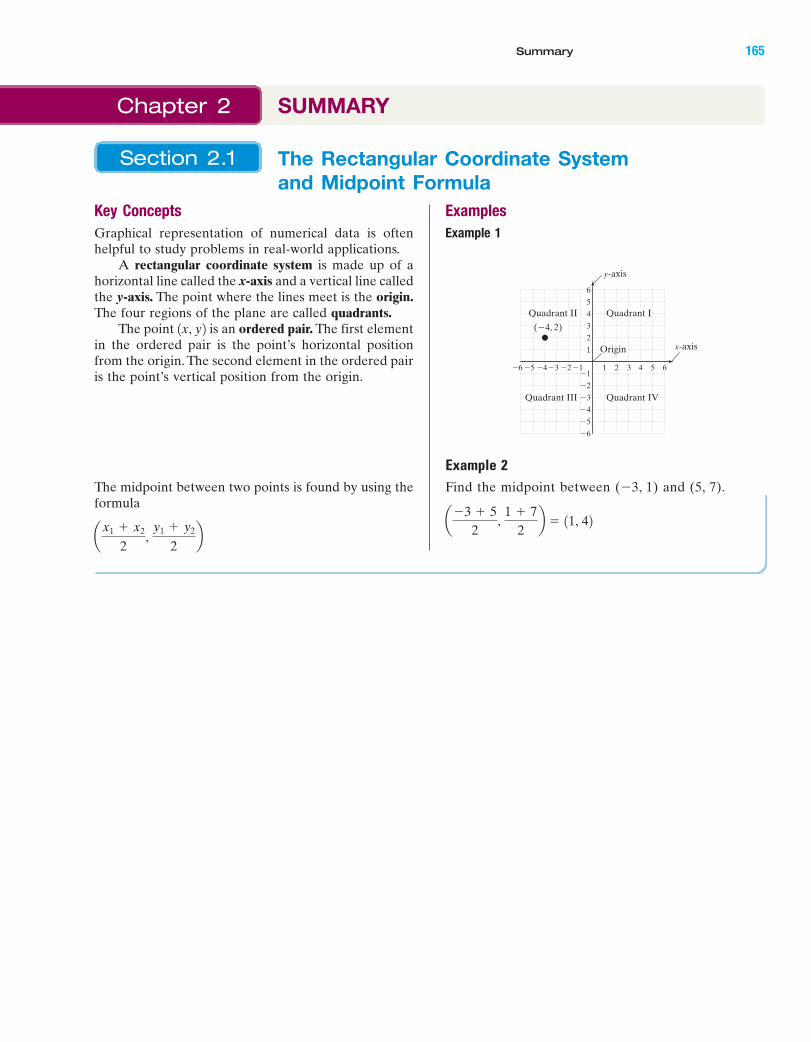
IA
The Rectangular Coordinate Systemand Midpoint Formula
Section 2.1
Key Concepts
Graphical representation of numerical data is often
helpful to study problems in real-world applications.
A rectangular coordinate system is made up of a
horizontal line called the x-axis and a vertical line called
the y-axis. The point where the lines meet is the origin.The four regions of the plane are called quadrants.
The point is an ordered pair. The first element
in the ordered pair is the point’s horizontal position
from the origin. The second element in the ordered pair
is the point’s vertical position from the origin.
The midpoint between two points is found by using the
formula
ax1 � x2
2,
y1 � y2
2b
1x, y2
Examples
Example 1
Example 2Find the midpoint between (�3, 1) and (5, 7).
a�3 � 5
2,
1 � 7
2b � 11, 42
4 5�5�6 �3�4 1 2 3
�2
�3
�4
�5
�6
4
5
6
1
�1�2 6
3
2
�1
y-axis
x-axis
Quadrant IQuadrant II
Quadrant IVQuadrant III
Origin
(�4, 2)
Summary 165
Chapter 2 SUMMARY
miL2872X_ch02_103-176 09/14/2006 06:43 PM Page 165CONFIRMING PAGES
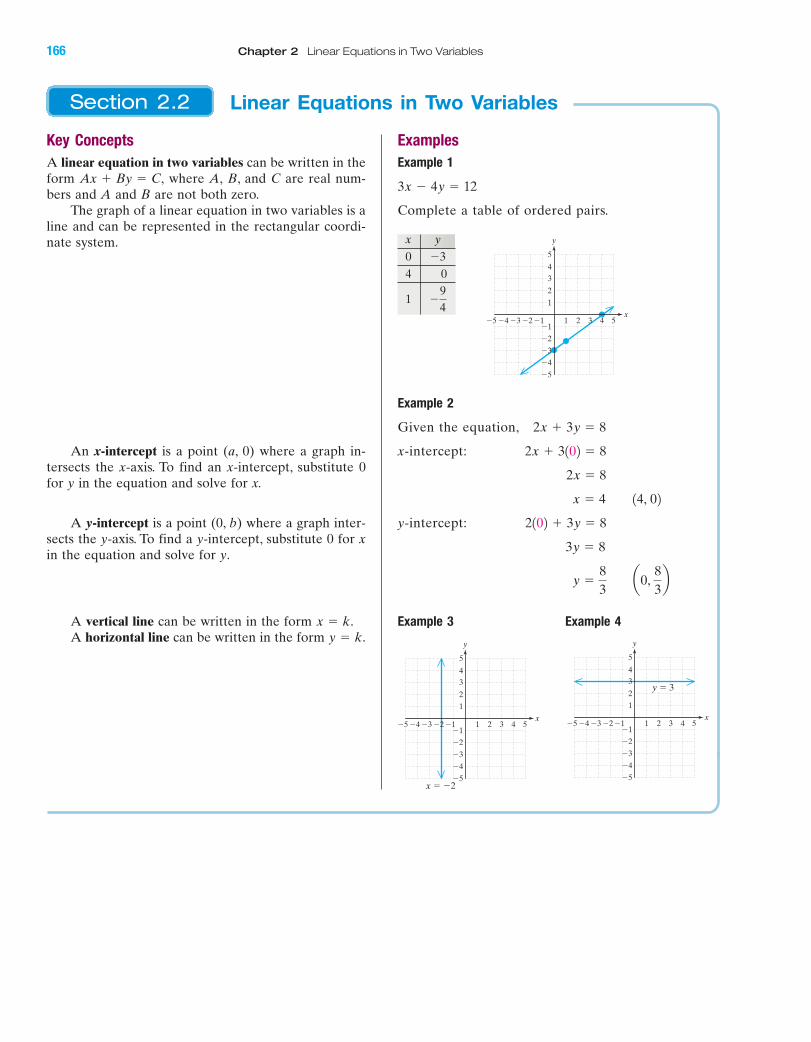
IA
Key Concepts
A linear equation in two variables can be written in the
form where A, B, and C are real num-
bers and A and B are not both zero.
The graph of a linear equation in two variables is a
line and can be represented in the rectangular coordi-
nate system.
An x-intercept is a point (a, 0) where a graph in-
tersects the x-axis. To find an x-intercept, substitute 0
for y in the equation and solve for x.
A y-intercept is a point (0, b) where a graph inter-
sects the y-axis. To find a y-intercept, substitute 0 for xin the equation and solve for y.
A vertical line can be written in the form
A horizontal line can be written in the form y � k.
x � k.
Ax � By � C,
Examples
Example 1
Complete a table of ordered pairs.
Example 2
Given the equation,
x-intercept:
y-intercept:
Example 3 Example 4
y �8
3 a0,
8
3b
3y � 8
2102 � 3y � 8
x � 4 14, 022x � 8
2x � 3102 � 8
2x � 3y � 8
y
x
�5
�4
�3
�2
�1
1
2
3
4
5
�1 1 2 3 4 5�2�3�4�5
3x � 4y � 12
x y
0
4 0
1 �9
4
�3
y
x
x � �2�5
�4
�3
�2
�1
1
2
3
4
5
�1 1 2 3 4 5�2�3�4�5
y
x
y � 3
�5
�4
�3
�2
�1
1
2
3
4
5
�1 1 2 3 4 5�2�3�4�5
Linear Equations in Two VariablesSection 2.2
166 Chapter 2 Linear Equations in Two Variables
miL2872X_ch02_103-176 09/14/2006 06:43 PM Page 166CONFIRMING PAGES
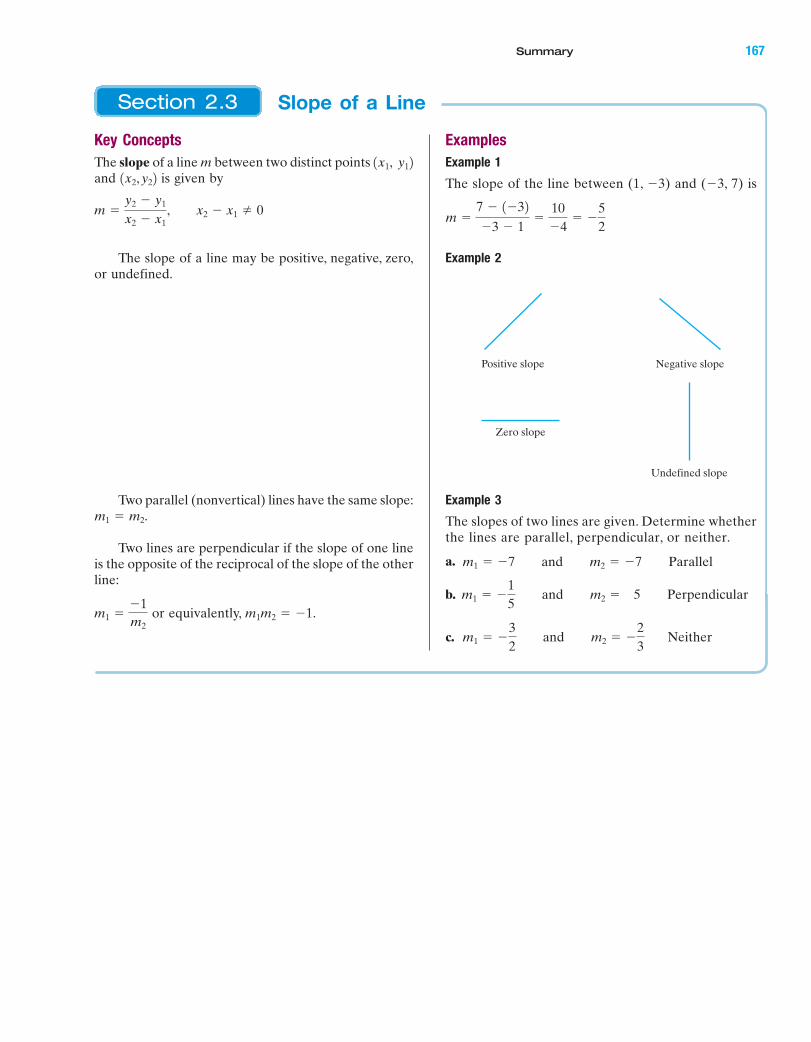
IA
Key Concepts
The slope of a line m between two distinct points
and is given by
The slope of a line may be positive, negative, zero,
or undefined.
Two parallel (nonvertical) lines have the same slope:
Two lines are perpendicular if the slope of one line
is the opposite of the reciprocal of the slope of the other
line:
or equivalently, m1m2 � �1.m1 ��1
m2
m1 � m2.
m �y2 � y1
x2 � x1
, x2 � x1 � 0
1x2, y221x1, y12
Examples
Example 1
The slope of the line between (1, �3) and (�3, 7) is
Example 2
Example 3
The slopes of two lines are given. Determine whether
the lines are parallel, perpendicular, or neither.
a.
b.
c. m1 � �3
2 and m2 � �
2
3 Neither
m1 � �1
5 and m2 � 5 Perpendicular
m1 � �7 and m2 � �7 Parallel
Positive slope Negative slope
Zero slope
Undefined slope
m �7 � 1�32�3 � 1
�10
�4� �
5
2
Slope of a LineSection 2.3
Summary 167
miL2872X_ch02_103-176 09/14/2006 06:44 PM Page 167CONFIRMING PAGES

IA
Key Concepts
Standard Form: (A and B are not both
zero)
Horizontal line:
Vertical line:
Slope-intercept form:
Point-slope formula:
Slope-intercept form is used to identify the slope
and y-intercept of a line when the equation is given.
Slope-intercept form can also be used to graph a line.
The point-slope formula can be used to construct
an equation of a line, given a point and a slope.
y � y1 � m1x � x12y � mx � b
x � k
y � k
Ax � By � C
Examples
Example 1
Find the slope and y-intercept. Then graph the
equation.
Solve for y.
Solve-intercept form
The slope is the y-intercept is
Example 2
Find an equation of the line passing through the
point (2, �3) and having slope m � �4.
Using the point-slope formula gives
y � �4x � 5
y � 3 � �4x � 8
y � 1�32 � �41x � 22y � y1 � m1x � x12
Right 2
Up 7
Start here
(0, �2)
y
x
�5
�4
�3
�2
2
3
4
5
�1 1 2 3 4 5�2�3�4�5
10, �22.72;
y �7
2x � 2
�2y � �7x � 4
7x � 2y � 4
Equations of a LineSection 2.4
168 Chapter 2 Linear Equations in Two Variables
miL2872X_ch02_103-176 09/14/2006 06:44 PM Page 168CONFIRMING PAGES

IA
Key Concepts
A linear model can often be constructed to describe
data for a given situation.
• Given two points from the data, use the point-slope
formula to find an equation of the line.
• Interpret the meaning of the slope and y-intercept in
the context of the problem.
• Use the equation to predict values.
Examples
Example 1
The graph shows the average per capita income in
the United States for 1980–2005.
The year 1980 corresponds to and income
is measured in dollars.
Write an equation of the line, using the points
(5, 11,013) and (20, 22,346).
Slope:
The slope indicates that the average in-
come has increased by $756 per year.
The y-intercept (0, 7233) means that the aver-
age income in 1980 was $7233.
Predict the average income for 2010
According to this model, the average income in 2010
will be approximately $29,913.
y � 29,913
y � 7561302 � 7233
1x � 302.
1x � 02
m � 756
y � 756x � 7233
y � 11,013 � 756x � 3780
y � 11,013 � 7561x � 52
22,346 � 11,013
20 � 5�
11,333
15� 756
25,000
20,000
15,000
10,000
5,000
00 5 10 15 20 25
Do
llars
($)
Year (x � 0 corresponds to 1980)
Average per Capita Yearly Income inUnited States (1980–2001)
(20, 22,346)
(5, 11,013)
x
y
x � 0
Applications of Linear Equationsand Graphing
Section 2.5
Summary 169
miL2872X_ch02_103-176 09/14/2006 06:44 PM Page 169CONFIRMING PAGES
IA
Section 2.1
1. Label the following on the diagram:
a. Origin
b. x-Axis
c. y-Axis
d. Quadrant I
e. Quadrant II
f. Quadrant III
g. Quadrant IV
2. Find the midpoint of the line segment between
the two points (�13, 12) and (4, �18).
3. Find the midpoint of the line segment between
the two points (1.2, �3.7) and (�4.1, �8.3).
4. Determine the coordinates of the points labeled
in the graph.
Section 2.2
For Exercises 5–7, complete the table and graph the
line defined by the points.
5. 3x � 2y � �6
4 5�4�5 �3 1 2 3
�2
�3
�4
�5
4
5
1
�1�2
3
2
�1
x
y
A
C
BFE
D G
6.
7.
For Exercises 8–11, graph the lines. In each case find
at least three points and identify the x- and y-intercepts
(if possible).
8.
9. 5x � 2y � 0
2x � 3y � 6
6 � x � 2
2y � 3 � 10
x y
0
0
1
x y
0
5
�4
x y
0
1
�2
4 5�4�5 �3 1 2 3
�2
�3
�4
�5
4
5
1
�1�2
y
x
3
2
�1
4 5�4�5 �3 1 2 3�1
�2
�3
4
5
6
7
1
�1�2
y
x
3
2
4 5�4�5 �3 1 2 3
�2
�3
�4
�5
4
5
�1�1�2
y
x
3
2
1
4 5�4�5 �3 1 2 3
�2
�3
�4
�5
4
5
�1�1�2
y
x
3
2
1
4 5�4�5 �3 1 2 3
�2
�3
�4
�5
4
5
�1�1�2
y
x
3
2
1
Chapter 2 Review Exercises
170 Chapter 2 Linear Equations in Two Variables
miL2872X_ch02_103-176 09/14/2006 06:44 PM Page 170CONFIRMING PAGES

IA
10.
11.
Section 2.3
12. Find the slope of the line.
a.
b.
�3x � 6
2y � 6 c.
13. Draw a line with slope 2 (answers may vary).
14. Draw a line with slope (answers may vary).
For Exercises 15–18, find the slope of the line that
passes through each pair of points.
15. 16.
17. 18.
19. Two points for each of two lines are given.
Determine if the lines are parallel,
perpendicular, or neither.
and
and (7, 0)13, �12L2:
13, �2214, �62L1:
a�4, 1
2b, 1�4, 1218, 22, 13, 22
17, 22, 1�3, �5212, 62, 1�1, 02
�34
4 5�4�5 �3 1 2 3
�2
�3
�4
�5
4
5
1
�1�1
�2
y
x
3
2
4 5�4�5 �3 1 2 3
�2
�3
�4
�5
4
5
1
�1�1
�2
y
x
3
2
4 5�4�5 �3 1 2 3
�2
�3
�4
�5
4
5
1
�1�1
�2
y
x
3
2
4 5�4�5 �3 1 2 3
�2
�3
�4
4
5
6
�1�1�2
y
x
3
2
1
4 5�4�5 �3 1 2 3
�2
�3
�4
�5
4
5
�1�1�2
y
x
3
2
1
4 5�4�5 �3 1 2 3
�2
�3
�4
�5
4
5
�1�1�2
y
x
3
2
1
4 5�4�5 �3 1 2 3
�2
�3
�4
�5
4
5
�1�1�2
y
x
3
2
1
Review Exercises 171
miL2872X_ch02_103-176 09/14/2006 06:44 PM Page 171CONFIRMING PAGES

IA
For Exercises 20–22, the slopes of two lines are
given. Based on the slopes, are the lines parallel,
perpendicular, or neither?
20. 21.
22.
23. The graph indicates that the enrollment for a
small college has been increasing linearly
between 1990 and 2005.
a. Use the two data points to find the slope of
the line.
b. Interpret the meaning of the slope in the
context of this problem.
24. Find the slope of the stairway pictured
here.
Section 2.4
25. Write an equation for each of the following.
a. Horizontal line
b. Point-slope formula
c. Standard form
d. Vertical line
e. Slope-intercept form
36 in.
48 in.
3000
2500
2000
1500
1000
500
01985 1990 1995 2000 2005 2010
Nu
mb
er
of
Stu
den
ts
College Enrollment by Year
(1990, 2020)
(2005, 2815)
m1 � 7, m2 � 7
m1 �5
4, m2 �
4
5m1 � �
1
3, m2 � 3
For Exercises 26–30, write your answer in slope-
intercept form or in standard form.
26. Write an equation of the line that has slope
and y-intercept (0, 6).
27. Write an equation of the line that has slope
and x-intercept (3, 0).
28. Write an equation of the line that passes
through the points (�8, �1) and (�5, 9).
29. Write an equation of the line that passes
through the point (6, �2) and is perpendicular
to the line
30. Write an equation of the line that passes
through the point (0, �3) and is parallel to the
line
31. For each of the given conditions, find an
equation of the line
a. Passing through the point (�3, �2) and
parallel to the x-axis.
b. Passing through the point (�3, �2) and
parallel to the y-axis.
c. Passing through the point (�3, �2) and
having an undefined slope.
d. Passing through the point (�3, �2) and
having a zero slope.
32. Are any of the lines in Exercise 31 the same?
Section 2.5
33. Keosha loves the beach and decides to spend
the summer selling various ice cream products
on the beach. From her accounting course, she
knows that her total cost is calculated as
She estimates that her fixed cost for the
summer season is $20 per day. She also knows
that each ice cream product costs her $0.25
from her distributor.
Total cost � fixed cost � variable cost
4x � 3y � �1.
y � �13x � 2.
�23
19
172 Chapter 2 Linear Equations in Two Variables
miL2872X_ch02_103-176 09/14/2006 06:44 PM Page 172CONFIRMING PAGES

IA
the number of rushing yards gained by the star
running back. The table shows the statistics.a. Write a relationship for the daily cost y in
terms of the number of ice cream products
sold per day x.
b. Graph the equation from part (a) by letting
the horizontal axis represent the number of
ice cream products sold per day and letting
the vertical axis represent the daily cost.
c. What does the y-intercept represent in the
context of this problem?
d. What is her cost if she sells 450 ice cream
products?
e. What is the slope of the line?
f. What does the slope of the line represent in
the context of this problem?
34. The margin of victory for a certain college
football team seems to be linearly related to
Margin of Yards Rushed Victory
100 20
60 10
120 24
50 7
Yards RushedM
arg
in o
f V
icto
ry
45
35
25
15
5
20 40 60 10080 120
y
x
a. Graph the data to determine if a linear
trend exists. Let x represent the number of
yards rushed by the star running back and yrepresent the points in the margin of victory.
b. Find an equation for the line through the
points (50, 7) and (100, 20).
c. Based on the equation, what would be the
result of the football game if the star
running back did not play?
1. Given the equation complete the
ordered pairs and graph the corresponding
points. 1 , �321 , 0210, 2x � 2
3y � 6, 2. Determine whether the following statements
are true or false and explain your answer.
a. The product of the x- and y-coordinates is
positive only for points in quadrant I.
b. The quotient of the x- and y-coordinates is
negative only for points in quadrant IV.
c. The point (�2, �3) is in quadrant III.
d. The point (0, 0) lies on the x-axis.
3. Find the midpoint of the line segment between
the points (21, �15) and (5, 32).
Co
st (
$)
Number of Ice Cream Products
20018016014012010080604020
50 100 150 200 250 300 350 400 450 500
y
x
4 5 6 7 81 2 3
�2
�3
�4
�5
�6
�7
�8
�9
4
�1�1�2
y
x
1
Chapter 2 Test
Test 173
miL2872X_ch02_103-176 09/14/2006 06:44 PM Page 173CONFIRMING PAGES

IA
4. Explain the process for finding the x- and
y-intercepts.
For Exercises 5–8, identify the x- and y-intercepts (if possible) and graph the line.
5.
6.
7.
8.
9. Find the slope of the line, given the following
information:
a. The line passes through the points (7, �3)
and (�1, �8).
b. The line is given by .6x � 5y � 1
2y � �6
3x � 5y
x � �4
6x � 8y � 24
10. Describe the relationship of the slopes of
a. Two parallel lines
b. Two perpendicular lines
11. The slope of a line is
a. Find the slope of a line parallel to the
given line.
b. Find the slope of a line perpendicular to the
given line.
12. Two points are given for each of two lines.
Determine if the lines are parallel,
perpendicular, or neither.
and
and (0, 3)
13. Given the equation
a. Write the line in slope-intercept form.
b. Determine the slope and y-intercept.
c. Graph the line, using the slope and
y-intercept.
14. Determine if the lines are parallel, perpendicular,
or neither.
a. b.
c. d.
15. Write an equation that represents a line subject
to the following conditions. (Answers may vary.)
a. A line that does not pass through the origin
and has a positive slope
b. A line with an undefined slope
3x � 5y � 10x � 0.5
5x � 3y � 93y � 6
15x � 5y � 10y � x � 3
9x � 3y � 1y � �x � 4
4 5�4�5 �3 1 2 3
�2
�3
�4
�5
4
5
�1�1�2
y
x
3
2
1
�3x � 4y � 4,
1�2, 02L2:
11, �6214, �42L1:
�7.
4 5�4�5 �3 1 2 3
�2
�3
�4
�5
4
5
�1�1�2
y
x
3
2
1
�4�5�6�7 �3 1 2 3
�2
�3
�4
�5
4
5
�1�1�2
y
x
3
2
1
4 5�4�5 �3 1 2 3
�2
�3
�4
�5
4
5
�1�1�2
y
x
3
2
1
4 5�4�5 �3 1 2 3
�2
�3
�4
�5
�6
4
�1�1�2
y
x
3
2
1
174 Chapter 2 Linear Equations in Two Variables
miL2872X_ch02_103-176 09/14/2006 06:44 PM Page 174CONFIRMING PAGES
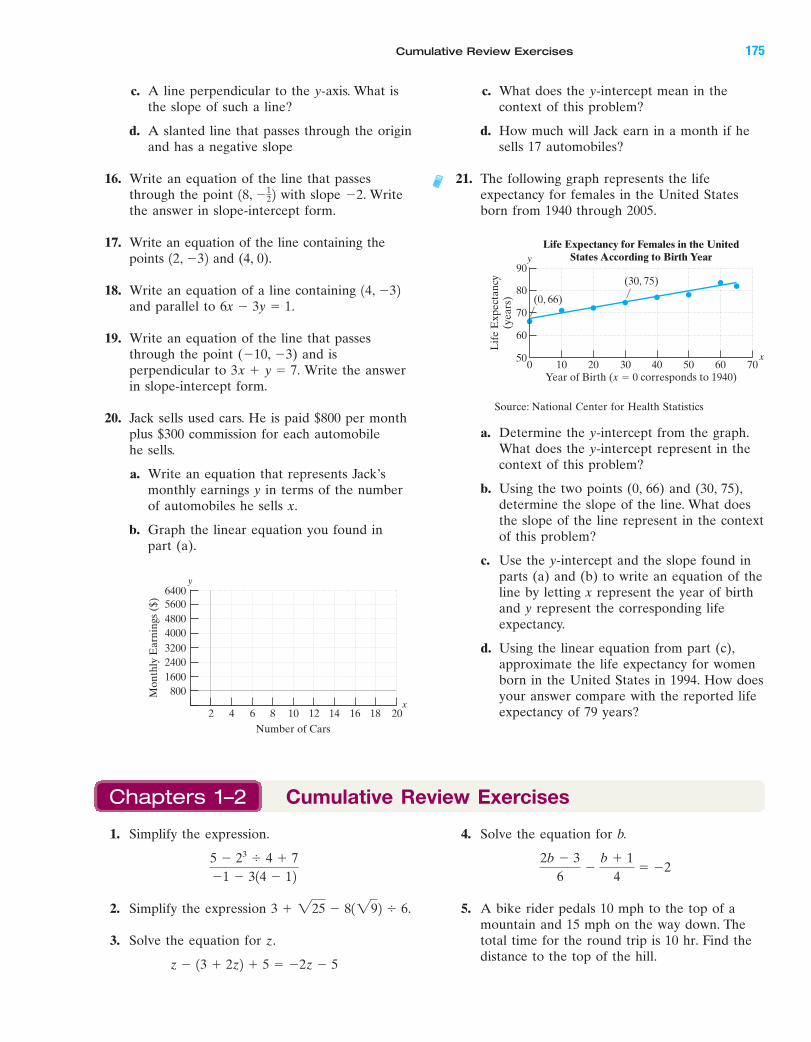
IA
c. A line perpendicular to the y-axis. What is
the slope of such a line?
d. A slanted line that passes through the origin
and has a negative slope
16. Write an equation of the line that passes
through the point with slope �2. Write
the answer in slope-intercept form.
17. Write an equation of the line containing the
points and (4, 0).
18. Write an equation of a line containing
and parallel to
19. Write an equation of the line that passes
through the point (�10, �3) and is
perpendicular to Write the answer
in slope-intercept form.
20. Jack sells used cars. He is paid $800 per month
plus $300 commission for each automobile
he sells.
a. Write an equation that represents Jack’s
monthly earnings y in terms of the number
of automobiles he sells x.
b. Graph the linear equation you found in
part (a).
3x � y � 7.
6x � 3y � 1.
14, �3212, �32
18, �12 2
c. What does the y-intercept mean in the
context of this problem?
d. How much will Jack earn in a month if he
sells 17 automobiles?
21. The following graph represents the life
expectancy for females in the United States
born from 1940 through 2005.
a. Determine the y-intercept from the graph.
What does the y-intercept represent in the
context of this problem?
b. Using the two points (0, 66) and (30, 75),
determine the slope of the line. What does
the slope of the line represent in the context
of this problem?
c. Use the y-intercept and the slope found in
parts (a) and (b) to write an equation of the
line by letting x represent the year of birth
and y represent the corresponding life
expectancy.
d. Using the linear equation from part (c),
approximate the life expectancy for women
born in the United States in 1994. How does
your answer compare with the reported life
expectancy of 79 years?
Mo
nth
ly E
arn
ings
($)
Number of Cars
6400
800
1600
2400
3200
4000
4800
5600
2 4 6 8 10 12 14 16 18 20
y
x
90
500 60 70
y
x50
Lif
e E
xp
ect
an
cy(y
ears
)
Year of Birth (x � 0 corresponds to 1940)
(30, 75)
(0, 66)
Life Expectancy for Females in the UnitedStates According to Birth Year
80
70
60
10 20 30 40
Source: National Center for Health Statistics
4. Solve the equation for b.
5. A bike rider pedals 10 mph to the top of a
mountain and 15 mph on the way down. The
total time for the round trip is 10 hr. Find the
distance to the top of the hill.
2b � 3
6�
b � 1
4� �2
1. Simplify the expression.
2. Simplify the expression
3. Solve the equation for z.
z � 13 � 2z2 � 5 � �2z � 5
3 � 225 � 81292 6.
5 � 23 4 � 7
�1 � 314 � 12
Chapters 1–2 Cumulative Review Exercises
Cumulative Review Exercises 175
miL2872X_ch02_103-176 09/14/2006 06:45 PM Page 175CONFIRMING PAGES

IA
4 5�4�5 �3 1 2 3
�2
�3
�4
�5
4
5
�1�1�2
y
x
3
2
1
4 5�4�5 �3 1 2 3
�2
�3
�4
�5
4
5
�1�1�2
y
x
3
2
1
6. The formula for the volume of a right circular
cylinder is
a. Solve for h.
b. Find h if a soda can contains 355 cm3 (which
is approximately 12 oz) of soda and the
diameter is 6.6 cm. Round the answer to
1 decimal place.
7. Solve the inequalities. Write your answers in
interval notation.
a. b.
8. Find the slope of the line that passes through
the points and
9. Find the midpoint of the line segment with
endpoints and
For Exercises 10–11, a. find the x- and y-intercept,
b. find the slope, and c. graph the line.
10.
11. 2y � 4 � 10
3x � 5y � 10
10, 152.1�2, �32
1�6, �32.14, �52
�x � 4 7 1�5x � 4 � �21x � 12
V � pr 2h.
12. Find an equation for the vertical line that
passes through the point (7, 11).
13. Find an equation for the horizontal line that
passes through the point (19, 20).
14. Find an equation of the line passing through
(1, �4) and parallel to Write the
answer in slope-intercept form.
15. Find an equation of the line passing through
(1, �4) and perpendicular to Write
the answer in slope-intercept form.
16. At the movies, Laquita paid for drinks and
popcorn for herself and her two children. She
spent twice as much on popcorn as on drinks. If
her total bill came to $17.94, how much did she
spend on drinks and how much did she spend
on popcorn?
17. Three raffle tickets are represented by three
consecutive integers. If the sum of the ticket
numbers is 1776, find the three numbers.
18. A chemist mixes a 20% salt solution with a
50% salt solution to get 25 L of a 38% salt
solution. How much of the 20% solution and
how much of the 50% solution did she use?
19. The yearly rainfall for Seattle, Washington, is
0.7 in. less than twice the yearly rainfall for
Los Angeles, California. If the total yearly
rainfall for the two cities is 50 in., how much
rain does each city get per year?
20. Simplify. 4 3�3x � 51y � 2x2 � 3 4 � 716y � x2
y � 14x � 2.
2x � y � 6.
176 Chapter 2 Linear Equations in Two Variables
miL2872X_ch02_103-176 09/14/2006 06:45 PM Page 176CONFIRMING PAGES