chaffee county housing needs assessment -...
TRANSCRIPT
Economic &
Planning Systems Real Estate Economics Regional Economics Public Finance Land Use Policy
D E N V E R
730 17th Street, Suite 630 Denver, CO 80202-3511 www.epsys.com
phone: 303-623-3557 fax: 303-623-9049
B E R K E L E Y
phone: 510-841-9190 fax: 510-841-9208
S A C R A M E N T O
phone: 916-649-8010 fax: 916-649-2070
FINAL REPORT
CHAFFEE COUNTY HOUSING NEEDS ASSESSMENT Prepared for: Chaffee County Board of Commissioners Town of Buena Vista City of Poncha Springs City of Salida Prepared by: Economic & Planning Systems, Inc. January 25, 2007 EPS #15875
TABLE OF CONTENTS
PAGE
INTRODUCTION AND SUMMARY OF FINDINGS............................................................................. 1 Background and Scope of Work.................................................................................... 1 Summary of Findings...................................................................................................... 1 Housing Action Plan....................................................................................................... 4
Existing Resources and Opportunities ....................................................................... 16
I. AFFORDABLE HOUSING OVERVIEW............................................................................... 18 Definitions ................................................................................................................... 18
II. ECONOMIC AND DEMOGRAPHIC FRAMEWORK ............................................................ 21 Population, Households, and Housing Units............................................................ 21 Housing Trends ............................................................................................................. 23 Demographic Characteristics....................................................................................... 28
Employment and Wages .............................................................................................. 33 Seasonality ................................................................................................................... 40 Commuting Patterns..................................................................................................... 42
III. HOUSING CONDITIONS................................................................................................... 44
Existing Housing Stock................................................................................................. 44 Market Conditions......................................................................................................... 47
IV. FUTURE CONDITIONS...................................................................................................... 54
V. COMMUNITY THEMES ..................................................................................................... 60
Survey Methodology..................................................................................................... 60 Economic and Demographic Characteristics............................................................. 61 Housing ................................................................................................................... 67
Business Owner and Employer Survey...................................................................... 74
Housing Targets ............................................................................................................ 79 Affordable Housing and Vandaveer Ranch .............................................................. 81
TABLE OF CONTENTS (continued)
PAGE
VI. HOUSING NEEDS ............................................................................................................. 83 Housing Indicators........................................................................................................ 83 Cost Burden ................................................................................................................... 85 Household Composition and Income......................................................................... 88
Housing Gap Analysis.................................................................................................. 91
LIST OF TABLES
PAGE
Table ES-1 Chaffee County Affordable Housing Action Plan.............................. 5 Table ES-2 2005 HUD Income Limits and Affordable Sale Prices by AMI......... 7
Table ES-3 Action Plan: Organization...................................................................... 9 Table ES-4 Action Plan: Funding Sources.............................................................. 11 Table ES-5 Action Plan: Housing Assistance ........................................................ 12 Table ES-6 Action Plan: Housing Development ................................................... 14 Table ES-7 Action Plan: Land Use .......................................................................... 15
Table 1 Population Trends, 1990-2005.............................................................. 21
Table 2 Household Trends, 1990-2005.............................................................. 22 Table 3 Household Trends, 1990-2004.............................................................. 22 Table 4 Housing Unit Trends, 2000-2005 ......................................................... 23 Table 5 Estimated Second Homes: Chaffee County, 1990-2005.................... 24 Table 6 Share of the Change in Housing Stock by Occupancy, 1990-2005.. 25
Table 7 Residential Construction by Unit Type: Chaffee County, 1999-2005................................................................................................. 26
Table 8 Chaffee County Household Composition.......................................... 28 Table 9 Tenure: Chaffee County, 2000 and 2006............................................. 29
Table 10 Median and Average Household Income: Chaffee County, 1990-2005................................................................................................. 30
Table 11 Top Counties and Total In-Migration, 1999-2004 ............................. 32
Table 12 Employment Trend: Chaffee County, 1990-2003 .............................. 34 Table 13 Wage and Salary Employment by Sector: Chaffee County,
1995-2005................................................................................................. 37 Table 14 Wage and Salary Employment and Average Wages: Chaffee
County, 2005........................................................................................... 38
Table 15 Average Annual Wage, 1997-2005 ...................................................... 39 Table 16 County Level Commuting Patters: Chaffee County, 2000............... 42 Table 17 Housing Units by Place: Chaffee County, 2005................................. 44 Table 18 Tenure by Occupied Unit Type: Chaffee County, 2000 ................... 46
Table 19 Single Family Home Sales: Chaffee County, 1998-2006 ................... 47 Table 20 Single Family Sales by Location .......................................................... 48
LIST OF TABLES (continued)
PAGE
Table 21 Attached Unit Sales: Chaffee County, 1998-2004 .............................. 51 Table 22 Colorado Division of Housing Rent Survey: Salida Market Area,
2000-2005................................................................................................. 52 Table 23 Summary of Rental Rates, Chaffee County, 2005 and 2006............. 53 Table 24 Housing and Household Forecast: Chaffee County, 2005-2020...... 55 Table 25 Chaffee County Employment Projection: Wage and Salary Jobs,
2005-2020................................................................................................. 56
Table 26 Adjusted Total Employment Projection, 2005-2020.......................... 57
Table 27 Economic Composition and Wage Levels, 2005 and 2020............... 58 Table 28 AMI Housing Targets based on Employment Needs ...................... 58 Table 29 Chaffee County Employment Projection: Total Employment,
2005-2020................................................................................................. 59 Table 30 Social Security and Retirement Pension as Primary Source of
Income..................................................................................................... 63 Table 31 Employment Characteristics vs. Years Living in Chaffee County . 65 Table 32 Condition of Home................................................................................ 67 Table 33 Housing Satisfaction ............................................................................. 67
Table 34 Reasons for Dissatisfaction with Home.............................................. 68 Table 35 Reasons for not Buying a Home .......................................................... 69 Table 36 County Residents Ranking of Affordable Housing Issue................ 70
Table 37 Ranking of Affordable Housing by Years Living in County........... 71 Table 38 Reactions to Potential Housing Policies ............................................. 73 Table 39 Location of Business.............................................................................. 74 Table 40 Number of Employees Today Compared to 5 Years Ago ............... 76 Table 41 Reason Why Number of Employees has Changed........................... 76
Table 42 Employer Opinions on Affordable Housing ..................................... 77 Table 43 Employee Turnover and Unfilled Jobs............................................... 77 Table 44 Willingness to Assist with Program to Provide Housing for Local
Employees............................................................................................... 78
Table 45 Priority Housing Types for Local Employees ................................... 78 Table 46 Rental vs. Ownership Housing Policy................................................ 80
LIST OF TABLES (continued)
PAGE
Table 47 Wages and Housing Costs, Chaffee County, 1998-2005 .................. 84 Table 48 Reasons for Not Buying a Home ......................................................... 87
Table 49 HUD 2005 Income Definitions and Descriptions, Chaffee County 88 Table 50 Households by Tenure and AMI, Chaffee County, 2005 ................. 89 Table 51 Households by Type and Area Median Income Level, Chaffee
County..................................................................................................... 90 Table 52 Home Purchasing Capacity by AMI Level ........................................ 92
Table 53 Available Homes and Purchasing Capacity by AMI Level ............. 93
Table 54 Ownership Housing Gap Analysis, Owner Households................. 94 Table 55 Ownership Housing Gap Analysis, All Households ....................... 94 Table 56 Available Rental Units .......................................................................... 95 Table 57 Rental Housing Gap Analysis.............................................................. 96
LIST OF FIGURES
PAGE
Figure 1 Share of the Change in Housing Stock by Occupancy, 1990-2005.. 25 Figure 2 Residential Construction by Unit Type: Chaffee County,
1999-2005................................................................................................. 27 Figure 3 Household Income Distribution: Chaffee County, 2005 .................. 30 Figure 4 Unemployment Rate, 1995-2005 .......................................................... 35 Figure 5 Wage and Salary Employment by Month: Chaffee County, 2005 .. 40 Figure 6 Taxable Sales by Month: Chaffee County, 2005 ................................ 41
Figure 7 Place of Work for Chaffee County Residents, 2006 .......................... 43
Figure 8 Chaffee County Housing Stock by Unit Type, 2000 ......................... 45 Figure 9 Single Family Housing Sales Volume by Price Range, 1998-2006 .. 49 Figure 10 Price Distribution for Homes Built After 2000, Sold in 2005 and
2006 .......................................................................................................... 50 Figure 11 Reasons for Moving to Chaffee County by Years Living in
Chaffee County ...................................................................................... 61 Figure 12 Average Household Income by Years Living in Chaffee County,
2006 .......................................................................................................... 62 Figure 13 Source of Income vs. When Moved to Chaffee County ................... 64
Figure 14 Age Distribution of People who Moved to Chaffee County in Last 10 Years ................................................................................................... 66
Figure 15 Opinions of Housing Conditions in Chaffee County....................... 72 Figure 16 Percent of Employees by Length of Employment............................. 75 Figure 17 Percent Responding “Strongly Agree” for Needed Housing
Types ....................................................................................................... 79 Figure 18 Salida Residents’ Support for Housing for People Priced Out
of the Market .......................................................................................... 81
Figure 19 Salida Residents’ Support for Vandaveer Ranch Workforce Housing................................................................................................... 82
Figure 20 Cost Burdened Households, Chaffee County, 2006 ......................... 85
Figure 21 Housing Cost Burden by Household Type........................................ 86 Figure 22 Households by Tenure and AMI Level .............................................. 89
APPENDIX
Table A-1 HUD 2005 Income Definitions, Chaffee County Household Survey
Employer Surveys
1
INTRODUCTION AND SUMMARY OF FINDINGS
BACKGROUND AND SCOPE OF WORK
The Chaffee County Board of Commissioners contracted with Economic & Planning Systems (EPS) to conduct a Housing Needs Assessment in Chaffee County. The purpose of this Housing Needs Assessment is to identify actions, policies, and strategies to address the region’s housing needs. The scope of work included the following tasks: Stakeholder interviews with approximately 20 citizens, business people, and
elected officials;
A countywide household and business survey to update demographic and economic conditions, and to gauge public opinions regarding housing conditions and affordability issues;
Documenting economic and demographic trends in Chaffee County;
Two community presentations mid-way through the study to provide preliminary findings and to identify specific areas of interest from community members; and
A public presentation of the study’s findings including an Action Plan with recommended strategies and policies to address affordable housing needs in Chaffee County.
SUMMARY OF FINDINGS
ECONOMIC AND DEMOGRAPHIC CONDITIONS
1. The demographic makeup of Chaffee County is shifting, reflecting a broad economic trend and transition in the Mountain West. An influx of higher income households, telecommuters, and a growing second home market are placing upward pressure on housing prices.
Year-round resident population growth slowed from 2000 to 2005, while housing construction accelerated, indicating that 80 percent of housing construction over the last five years has been oriented to second homeowners. The average household income for those who have moved to Chaffee County in the last three years is $65,500, 20 percent higher than the overall countywide average of $54,000. From the second home market viewpoint, Chaffee County is an attractive alternative and is comparatively lower priced than other Colorado mountain areas with similar recreational and environmental amenities. Housing and land prices in Chaffee County will continue to rise as outside buyers seek alternatives to more crowded and expensive communities primarily along the I-70 corridor.
Chaffee County Housing Needs Assessment Final Report
January 25, 2007
2
2. Economic conditions are changing as well, although the shift is not as dramatic as changes in demographics and market conditions.
Wage and salary jobs grew by 4.3 percent per year from 1990 to 2000; however recent growth from 2000 to 2005 was nearly flat at 0.2 percent per year. The largest employment sectors are Government (25 percent of jobs), Accommodations and Food Services (17 percent), Retail Trade (16 percent), and Construction (9 percent). The makeup of the economy has not changed significantly over the 15 year period analyzed. Housing needs will be driven primarily by growth in construction and retail and tourism businesses. To balance out these recent trends, economic development efforts should focus on diversifying the economy and growing local entrepreneurial potential. In 2000, approximately 90 percent of Chaffee County employees lived in Chaffee County, indicating a fairly well balanced labor market. However, anecdotal information indicates that in-commuting is increasing, primarily from Saguache County as employees seek lower priced housing. This trend should be closely monitored as an indicator of labor force stability. 3. One in four households in Chaffee County can be defined as cost burdened, paying
more than 30 percent of their monthly income on rent or mortgage payments. The household survey found that a significant number of households, 26 percent, are cost burdened, defined as paying more than 30 percent of their gross annual income on rent or mortgage payments, not including utilities, taxes, or other costs. There is a higher degree of cost burden among renters, with 32 percent of renter households cost burdened compared to 21 percent of owners. Nearly all cost burdened renters earn less than 60 percent of the Area Median Income (AMI) compared to cost burdened owners who are more evenly distributed between 30 and 100 percent of AMI. 4. There is currently a small but fast growing affordability gap in for-sale housing.
However, given the home price appreciation trends over the past 10 years, this gap will continue to widen significantly and is likely to accelerate over the next few years. There is an opportunity now to begin work on solutions for long-term affordability for the local labor force.
In 1998, the average home price in Chaffee County was $127,000. In 2006, the average price grew to $267,000, an increase of 82 percent, 10 percent per year compounded. Wages, which are the largest component of household income for most people, have increased by approximately 30 percent for the same time period, or 3.6 percent per year indicating that wages and local household incomes are not keeping pace with home prices. With an average price of $127,000 in 1998, 1.6 average jobs per household were required to afford a typical home. Based on the average price of $267,000 in 2006, approximately 2.5 jobs earning the average wage would be required to afford a typical home in Chaffee County.
Chaffee County Housing Needs Assessment Final Report
January 25, 2007
3
There is a supply gap of approximately -7.0 percent between the inventory of homes affordable at the 60 to 80 percent AMI level and the number of households in this income range. In the price ranges affordable to households above 80 percent of AMI, there is a narrow surplus of 2 to 5 percent. This suggests that there is a small percentage of the market that is affordable to buyers earning more than 80 percent of AMI. This analysis reflects conditions as of 2006. However, if recent trends continue, and they are likely to continue, the affordability gap will grow rapidly. 5. The rental market has not been impacted by rent increases to the same degree as the
for-sale market. Yet, many renters still experience affordability problems.
Rents are not increasing in the private rental market as fast as for-sale housing prices, however many renters still experience affordability problems. High utility costs related to an aging rental stock are contributing to renter affordability problems. Subsidized rental properties serving households earning 30 to 60 percent of AMI are fully occupied, with rents that are 15 to 20 percent less than free market properties, indicating that they have been successful at providing lower cost alternatives. Modernizing the existing rental stock and pursuing additional modern energy efficient apartment development (free market and subsidized) in the next three years could also have a positive impact on renter affordability. 6. There is a strong sense of community in Chaffee County with agreement across
many segments of the community regarding the need for affordable housing. Local residents and policymakers have expressed concerns that they do not want Chaffee County to go through the same cycles that many high-priced mountain resort communities have gone through. Furthermore, there is strong agreement that affordable housing is a significant problem in the community that should be addressed before land and housing prices are prohibitively high. Eighty-five to 90 percent of Chaffee County residents acknowledge that affordable housing is either “one of the more serious problems in the County” or a “problem that needs attention”. More longtime residents (10 years or more) indicated that housing was “one of the more serious problems” (65 percent) than people who moved to Chaffee County within the last three years (54 percent). Survey respondents place the highest priority on housing for essential community workers. This was defined broadly in the survey, and may be interpreted to include a broad range of income levels that would include retail and service employees, teachers, police and emergency personnel, entry-level office workers, and entry-level professionals. There is also a clear need for additional senior housing, as there is a two year waiting list at Mt. Shavano Manor in Salida and a six month to two year waiting list at Sunrise Manor in Buena Vista.
Chaffee County Housing Needs Assessment Final Report
January 25, 2007
4
HOUSING ACTION PLAN
OVERVIEW
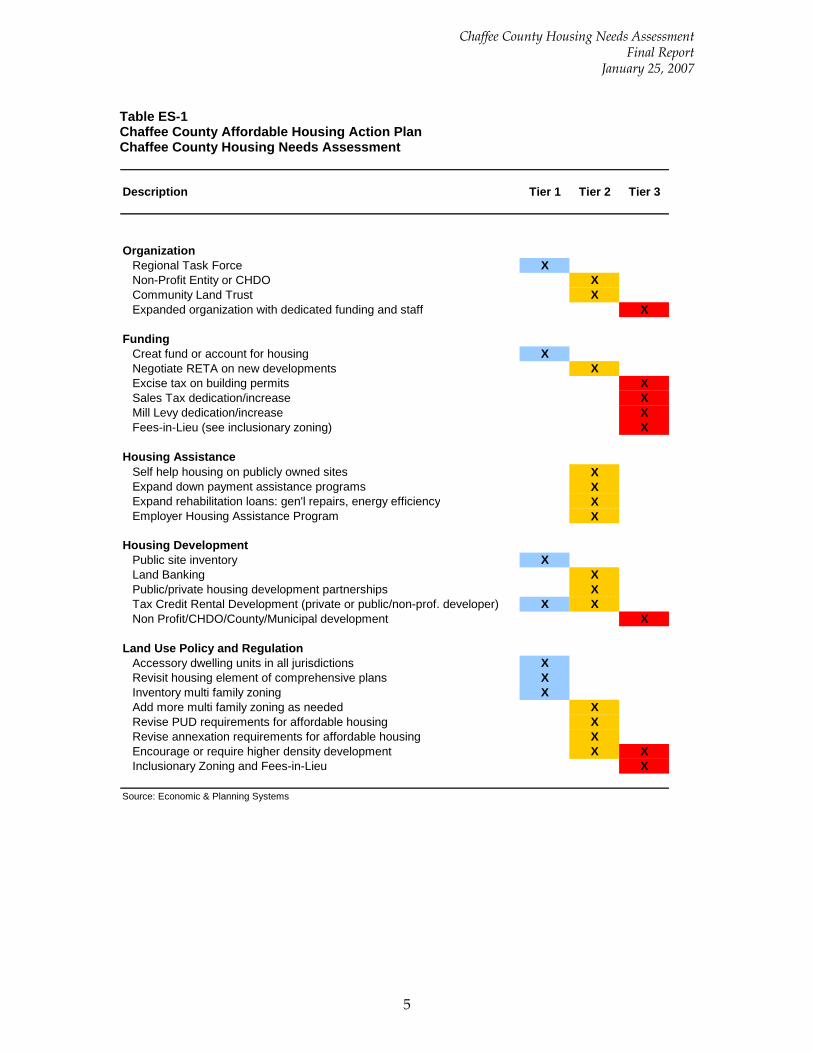
The proposed action plan has three implementation tiers. Tier 1 actions are intended to require minimal staff time, resources, and funding. They are first steps towards implementing larger solutions. Tier 2 actions may require more staff capacity, funding, and a higher degree of staff commitment. Tier 3 items are more complex, may require dedicated funding and staff resources, and require a higher degree of political and community commitment. The Action Plan is divided into five major categories listed below with tiered actions under each category following this overview. Organization – Identifies institutional arrangements and partnership opportunities
and provides a process for the community to select a structure that is appropriate considering that capacity and role of each group.
Funding – Recommends funding strategies for affordable housing development and organizations.
Housing Assistance – Describes programs for providing financial assistance towards housing to families or individuals such as low interest loans for down payment assistance.
Housing Development – Identifies ways to build the affordable housing inventory with housing development strategies that include public/private partnerships.
Land Use – Recommends ways to link land use policy with affordable and attainable housing goals to leverage private sector resources.
Table ES-1 illustrates the entire action plan, which is presented by topic after this overview.
Chaffee County Housing Needs Assessment Final Report
January 25, 2007
5
Table ES-1 Chaffee County Affordable Housing Action Plan Chaffee County Housing Needs Assessment
Description Tier 1 Tier 2 Tier 3
OrganizationRegional Task Force XNon-Profit Entity or CHDO XCommunity Land Trust XExpanded organization with dedicated funding and staff X
FundingCreat fund or account for housing XNegotiate RETA on new developments XExcise tax on building permits XSales Tax dedication/increase XMill Levy dedication/increase XFees-in-Lieu (see inclusionary zoning) X
Housing AssistanceSelf help housing on publicly owned sites XExpand down payment assistance programs XExpand rehabilitation loans: gen'l repairs, energy efficiency XEmployer Housing Assistance Program X
Housing DevelopmentPublic site inventory XLand Banking XPublic/private housing development partnerships XTax Credit Rental Development (private or public/non-prof. developer) X XNon Profit/CHDO/County/Municipal development X
Land Use Policy and RegulationAccessory dwelling units in all jurisdictions XRevisit housing element of comprehensive plans XInventory multi family zoning XAdd more multi family zoning as needed XRevise PUD requirements for affordable housing XRevise annexation requirements for affordable housing XEncourage or require higher density development X XInclusionary Zoning and Fees-in-Lieu X
Source: Economic & Planning Systems
Chaffee County Housing Needs Assessment Final Report
January 25, 2007
6
OVERVIEW (continued) Several overarching principles related to the more detailed action plan are outlined below. These concepts provide general guidance for formulating policy and implementing housing programs as described in the Action Plan. 1. Start small. The first step in this process is to form a Housing Task Force. The Task Force should review the Action Plan and identify a few short-term goals that are easily achievable within the next six months to one year. Define a schedule of implementation objectives and work to achieve them. After these objectives are reached, consider expanding them or tackling more complex institutional, funding, or development objectives. An important part of the goals setting process should include identifying the target populations and income levels for housing policies, and the types of housing to be targeted in the initial stages (e.g. rental or for-sale).
2. Affordable housing is housing for the community’s workforce and is directly linked
to economic vitality and sustainability. Affordable housing is synonymous with workforce housing. It is housing for people who earn their living in the community such as retail and service employees, mechanics, construction and trades workers, teachers, police/fire/EMS, health care service providers, and small business owners. These workers form the core of any sustainable economy and also contribute to community vitality and diversity. Many other Colorado and western mountain communities have found that high priced housing can displace local workers, resulting in unfilled jobs and high employee turnover, which negatively affects business conditions and customer experiences. Furthermore, new businesses considering a Chaffee County location will look for a stable workforce, and affordable housing is an important part of a stable workforce. 3. Build on the momentum that is in place. The community has identified housing as an important economic and quality of life issue in Chaffee County. Elected officials and staff should use this opportunity to implement housing strategies and policies while the issue is in the forefront of public awareness. Furthermore, there is interest among local jurisdictions and the County to work together towards housing goals. These relationships should be strengthened so that housing efforts can draw from the largest pool of resources and community support.
4. Regional cooperation is essential to maximize the results of housing efforts. Pooled resources and consistent policies will be the most effective way to address housing issues. Consistent policies will set an expectation that land use decision makers in each jurisdiction will look more favorably on projects that address affordable housing.
Chaffee County Housing Needs Assessment Final Report
January 25, 2007
7
5. The active development market in Chaffee County can be channeled to help implement affordable housing goals.
The pace and strength of the current real estate market can be viewed as an asset if it can be leveraged to achieve public policy goals. The County and local jurisdictions should tap into development as a funding source and as a way of increasing the supply of affordable housing. Specific actions include strengthening PUD and subdivision requirements for affordable housing, and negotiating during entitlement processes for housing unit or building lot set asides, or contributions to a multi-jurisdiction housing fund. Officials should also be willing to provide some incentives in exchange for set asides or funding contributions. Work with utility providers as well to identify ways to provide incentives for affordable housing such as fee reductions or deferrals. 6. Multiple housing programs and policies will reach the broadest spectrum of the
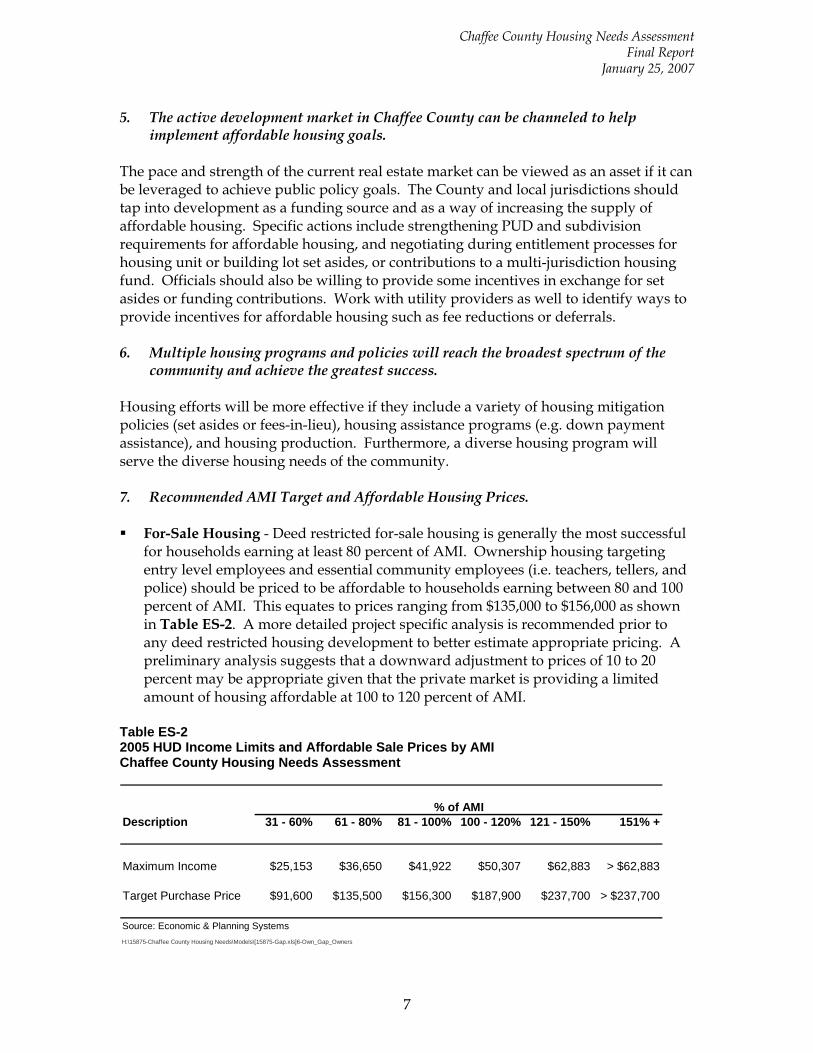
community and achieve the greatest success. Housing efforts will be more effective if they include a variety of housing mitigation policies (set asides or fees-in-lieu), housing assistance programs (e.g. down payment assistance), and housing production. Furthermore, a diverse housing program will serve the diverse housing needs of the community. 7. Recommended AMI Target and Affordable Housing Prices. For-Sale Housing - Deed restricted for-sale housing is generally the most successful
for households earning at least 80 percent of AMI. Ownership housing targeting entry level employees and essential community employees (i.e. teachers, tellers, and police) should be priced to be affordable to households earning between 80 and 100 percent of AMI. This equates to prices ranging from $135,000 to $156,000 as shown in Table ES-2. A more detailed project specific analysis is recommended prior to any deed restricted housing development to better estimate appropriate pricing. A preliminary analysis suggests that a downward adjustment to prices of 10 to 20 percent may be appropriate given that the private market is providing a limited amount of housing affordable at 100 to 120 percent of AMI.
Table ES-2 2005 HUD Income Limits and Affordable Sale Prices by AMI Chaffee County Housing Needs Assessment
Description 31 - 60% 61 - 80% 81 - 100% 100 - 120% 121 - 150% 151% +
Maximum Income $25,153 $36,650 $41,922 $50,307 $62,883 > $62,883
Target Purchase Price $91,600 $135,500 $156,300 $187,900 $237,700 > $237,700
Source: Economic & Planning SystemsH:\15875-Chaffee County Housing Needs\Models\[15875-Gap.xls]6-Own_Gap_Owners
% of AMI
Chaffee County Housing Needs Assessment Final Report
January 25, 2007
8
Rental Housing - Rental affordable housing should target the 40 to 80 percent AMI range, with the majority of units in the 50 to 60 percent AMI range, based on an analysis of wages and household incomes from secondary sources and the household survey. There is also a severe shortfall of units available to low income seniors. Units available to seniors should be a mix of rental assistance units in which tenants pay 30 percent of their annual income in rent, or units affordable to seniors with incomes of 80 percent of AMI or less.
I. ORGANIZATION
Tier 1
1. Form a multi-jurisdictional housing task force with representatives from County and local governments, major employers, builders, real estate professionals, and housing providers.
Any housing effort will need an institutional structure to formulate policy and prioritize housing efforts. The first step in developing a housing program is to form a Task Force that will evaluate the options and identify the optimal organization to move the housing issue forward in the initial years. A multi-jurisdictional countywide task force that includes local and county government representatives, existing housing providers, and business leaders could draw from a broad base of experience and knowledge, as successful affordable housing efforts draw from a range of specialized disciplines. The Task Force should represent the broad housing interests of the County, rather than focusing on one narrow housing issue. The strengths and weaknesses of existing organizations should be considered in forming the Task Force. This Task Force should not initially require new staff or funding from the County or local jurisdictions. Tier 2
2. Consider forming a Community Housing Development Organization (CHDO). A CHDO is a 501 C(3) non-profit recognized by HUD. As such, CHDOs are eligible to receive HUD funding through the Colorado State Division of Housing. Funding is available for operations and administration, as well as for housing development. While funding is competitive, the State is interested in funding rural areas outside of the Front Range and it appears likely that a Chaffee County CHDO could be successful in its request for annual funding for operations. The Upper Arkansas Area Council of Governments (UAACOG) has an existing CHDO. UAACOG has used its CHDO to assist the Salida Housing Authority in studying a development opportunity for new senior housing. It is also in discussions with a developer/investor who is interested in developing affordable housing near Buena Vista. The State may see a Chaffee County CHDO as being competitive or redundant to the UAACOG CHDO. If the Task Force decides to pursue a Chaffee County CHDO, it may be important to identify a niche that differentiates the Chaffee County CHDO from UAACOG’s CHDO, such as a community land trust approach, or linking energy conservation and environmental sustainability with affordable housing.
Chaffee County Housing Needs Assessment Final Report
January 25, 2007
9
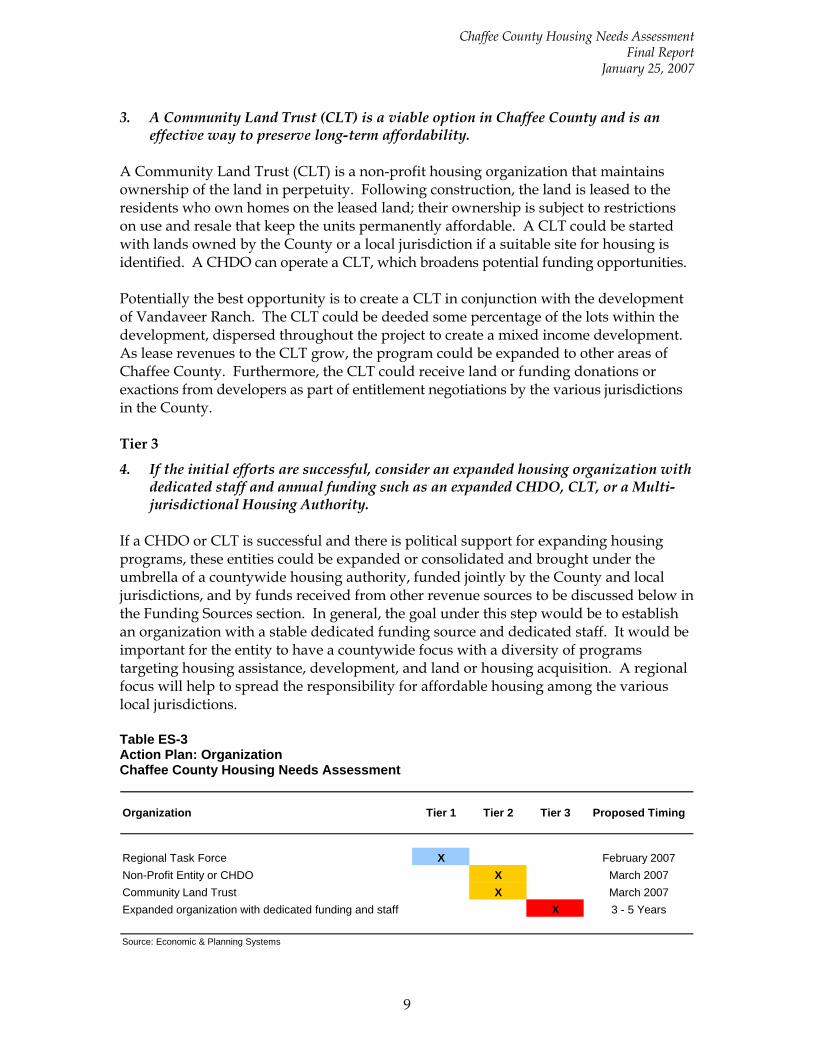
3. A Community Land Trust (CLT) is a viable option in Chaffee County and is an effective way to preserve long-term affordability.
A Community Land Trust (CLT) is a non-profit housing organization that maintains ownership of the land in perpetuity. Following construction, the land is leased to the residents who own homes on the leased land; their ownership is subject to restrictions on use and resale that keep the units permanently affordable. A CLT could be started with lands owned by the County or a local jurisdiction if a suitable site for housing is identified. A CHDO can operate a CLT, which broadens potential funding opportunities. Potentially the best opportunity is to create a CLT in conjunction with the development of Vandaveer Ranch. The CLT could be deeded some percentage of the lots within the development, dispersed throughout the project to create a mixed income development. As lease revenues to the CLT grow, the program could be expanded to other areas of Chaffee County. Furthermore, the CLT could receive land or funding donations or exactions from developers as part of entitlement negotiations by the various jurisdictions in the County. Tier 3
4. If the initial efforts are successful, consider an expanded housing organization with dedicated staff and annual funding such as an expanded CHDO, CLT, or a Multi-jurisdictional Housing Authority.
If a CHDO or CLT is successful and there is political support for expanding housing programs, these entities could be expanded or consolidated and brought under the umbrella of a countywide housing authority, funded jointly by the County and local jurisdictions, and by funds received from other revenue sources to be discussed below in the Funding Sources section. In general, the goal under this step would be to establish an organization with a stable dedicated funding source and dedicated staff. It would be important for the entity to have a countywide focus with a diversity of programs targeting housing assistance, development, and land or housing acquisition. A regional focus will help to spread the responsibility for affordable housing among the various local jurisdictions. Table ES-3 Action Plan: Organization Chaffee County Housing Needs Assessment
Organization Tier 1 Tier 2 Tier 3 Proposed Timing
Regional Task Force X February 2007Non-Profit Entity or CHDO X March 2007Community Land Trust X March 2007Expanded organization with dedicated funding and staff X 3 - 5 Years
Source: Economic & Planning Systems
Chaffee County Housing Needs Assessment Final Report
January 25, 2007
10
II. FUNDING SOURCES
A variety of funding sources are identified below. The recommendations focus on local resources, given the ever-increasing competition for state and federal grants. The funding sources identified in Table ES-4 are locally based, with some related to leveraging the private development market.
Tier 1
1. Create an account or fund for affordable housing efforts. This first step is largely symbolic of a larger effort. The County should create an account or fund for affordable housing. A nominal amount of money could be placed in the fund as a starting point. The purpose is to have the means in place to accept developer exactions, grants, or general donations for affordable housing. It would be very meaningful and show regional cooperation if each jurisdiction contributed to this fund initially.
Tier 2
2. Consider pursuing Real Estate Transfer Assessments (RETA) on new development to fund affordable housing.
A RETA is an assessment on real property paid at the time of sale, and is attached to the property in perpetuity unless otherwise specified in the terms of the assessment (e.g. a sunset clause). RETAs have been used by many communities in Colorado to fund infrastructure, community facilities, affordable housing, or as additional revenue to a general fund. RETAs are voluntary assessments typically negotiated during the entitlement process for large subdivisions, Planned Unit Developments (PUDs), or annexations. It is recommended that the County and local jurisdictions establish a coordinated policy of pursuing RETAs on significant new developments, especially projects which are anticipated to be marketed to the retiree and second home markets, as these buyers have the most direct impact on regional home prices. Preference should be given to projects that are providing housing affordable to the 80 to 120 percent AMI; the first $75,000 to $100,000 of the home price should be exempt from the RETA in these cases. It is also recommended that a RETA be applied to the Vandaveer Ranch development, as it is a large development opportunity that will be carried out in accordance with community goals and could establish a model for the use of RETAs.
Tier 3
3. Consider dedicated revenue sources for affordable housing. If initial housing efforts are successful and there is continued community support for expanding housing programs, dedicated revenue sources would provide the most reliable continual funding sources for housing. Dedicated revenue sources could include an excise tax, or sales or property tax dedications.
Chaffee County Housing Needs Assessment Final Report
January 25, 2007
11
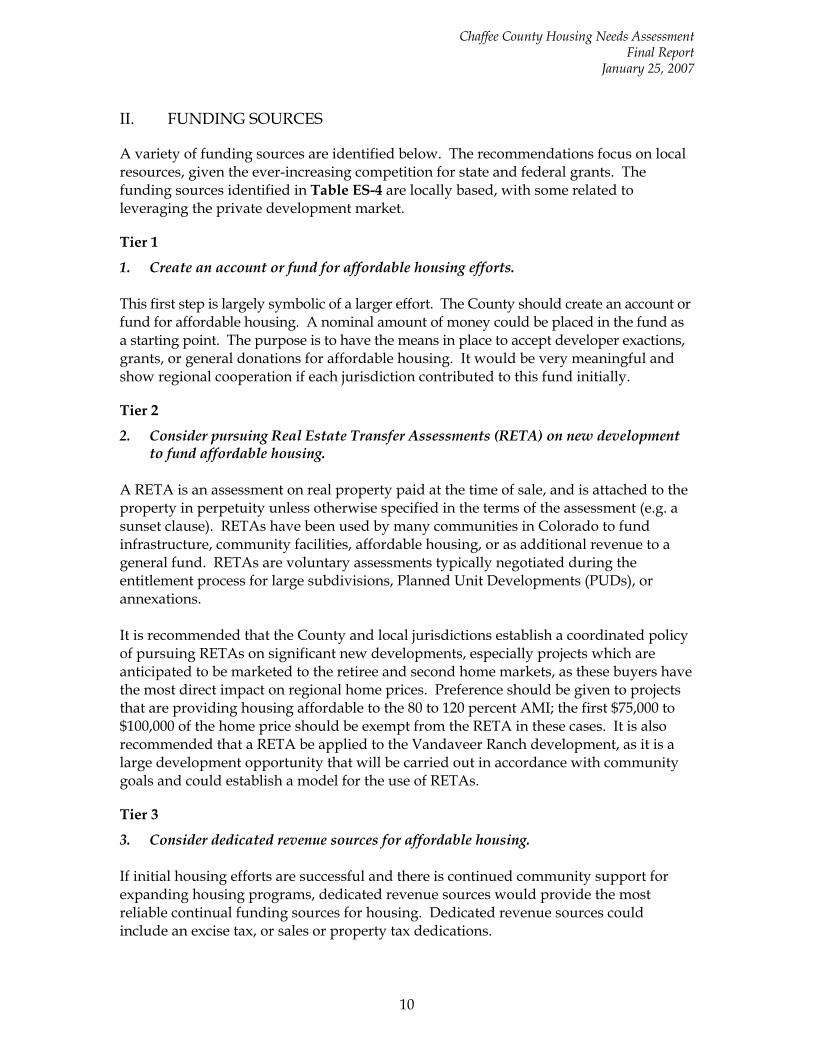
An excise tax is a tax on residential and commercial building permits administered per square foot of building area. Several communities in Colorado impose excise taxes on building permits, and at least one community uses excise tax revenue to fund affordable housing. Fees-in-Lieu would be tied to an inclusionary zoning program described later in this section. Table ES-4 Action Plan: Funding Sources Chaffee County Housing Needs Assessment
Funding Tier 1 Tier 2 Tier 3 Proposed Timing
Creat fund or account for housing X March 2007Negotiate RETA on new developments X Prepare nowExcise tax on building permits X 3 - 5+ YearsSales Tax dedication/increase X 3 - 5+ YearsMill Levy dedication/increase X 3 - 5+ YearsFees-in-Lieu (see inclusionary zoning) X 3 - 5+ Years
Source: Economic & Planning Systems
III. HOUSING ASSISTANCE
Housing assistance programs are a way of providing financial assistance to families or individuals. A common form of housing assistance is a low interest loan program for down payment assistance. A variety of housing assistance options are recommended below and in Table ES-5. Housing assistance programs are a Tier 2 level of effort since they require an existing organization to administer the programs and funding. 1. Partner with the UAACOG to pursue opportunities for Self-Help housing on
publicly owned sites. The Self Help program provides new single-family homes to first-time homeowners. Homeowners are required to help build the home, working 30 hours per week during the construction period. UAACOG’s existing self help housing program could be expanded with the availability of donated or low-cost land, or as a partner with a Chaffee County CLT. This approach provides a way to build on existing resources which is more efficient than starting a new self help program. 2. Strengthen the presence of UAACOG in Chaffee County and expand existing
housing assistance programs. While the UAACOG has a number of existing programs, they could be more effective and better utilized with a stronger local presence in Chaffee County. Chaffee County stakeholders have indicated that the COG’s location in Canon City does not provide
Chaffee County Housing Needs Assessment Final Report
January 25, 2007
12
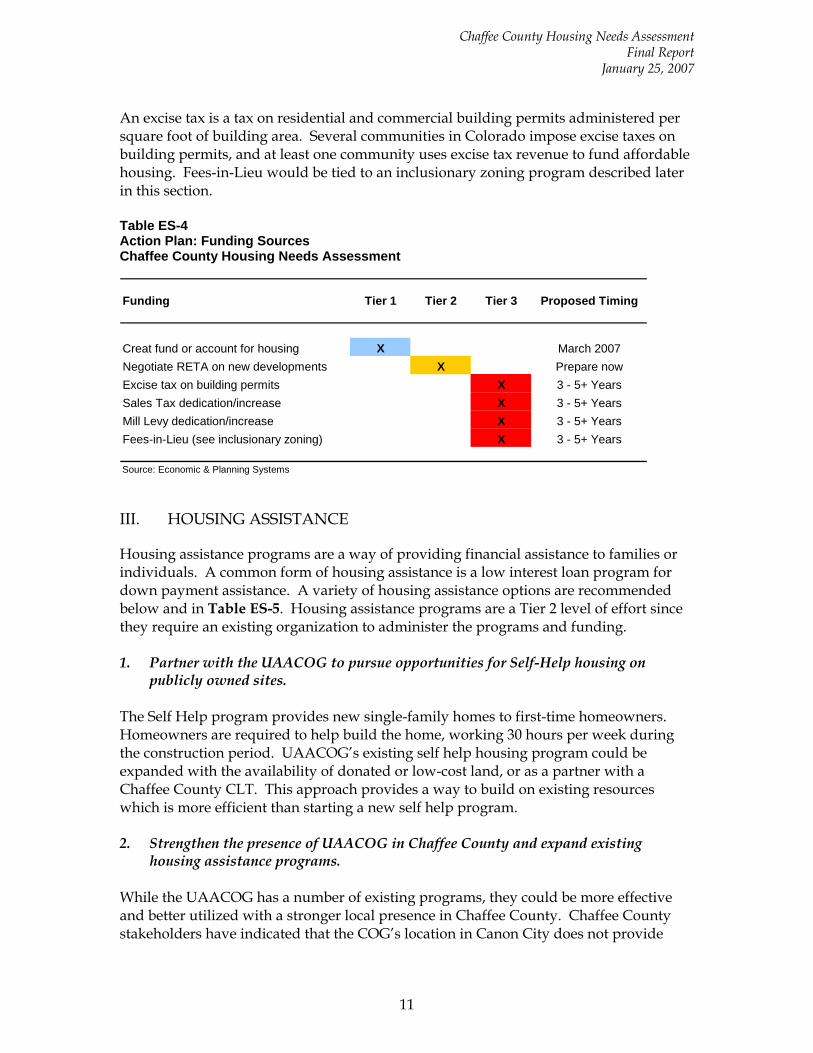
adequate exposure to serve Chaffee County clients, and that potential clients would be more likely to utilize a service provider located in or closer to their home community. Additional funding sources to expand these programs and presence in Chaffee County should be pursued, including donations from businesses, the real estate community, and high net worth donors. With additional funding, rehabilitation loan programs could be expanded, and clients could use these funds to finance general maintenance on existing homes, or energy efficiency upgrades to enhance long-term affordability. 3. Encourage and support employer housing assistance programs. The Chaffee County Homebuilders Association is exploring a housing assistance program that would include a combination of funding by its members and mutual self help housing. The program would be limited to member employees; however other guidelines for qualifying families have not yet been decided. There may be opportunities to partner with the Homebuilders in a way that gives it ownership for its efforts, but does not involve extensive administrative burdens. Table ES-5 Action Plan: Housing Assistance Chaffee County Housing Needs Assessment
Housing Assistance Tier 1 Tier 2 Tier 3 Proposed Timing
Self help housing on publicly owned sites X 2007-2008
Expand down payment assistance programs X 2007-2009
Expand rehabilitation loans: gen'l repairs, energy efficiency
X 2007-2010
Employer Housing Assistance Program X 2007-2011
Source: Economic & Planning Systems
IV. HOUSING DEVELOPMENT
Building affordable community housing is the most direct and effective way to increase the supply of community housing. Housing development strategies and actions are summarized below and in Table ES-6. 1. The Housing Task Force should create a public lands inventory, some of which
could be used for affordable housing development.
Chaffee County Housing Needs Assessment Final Report
January 25, 2007
13
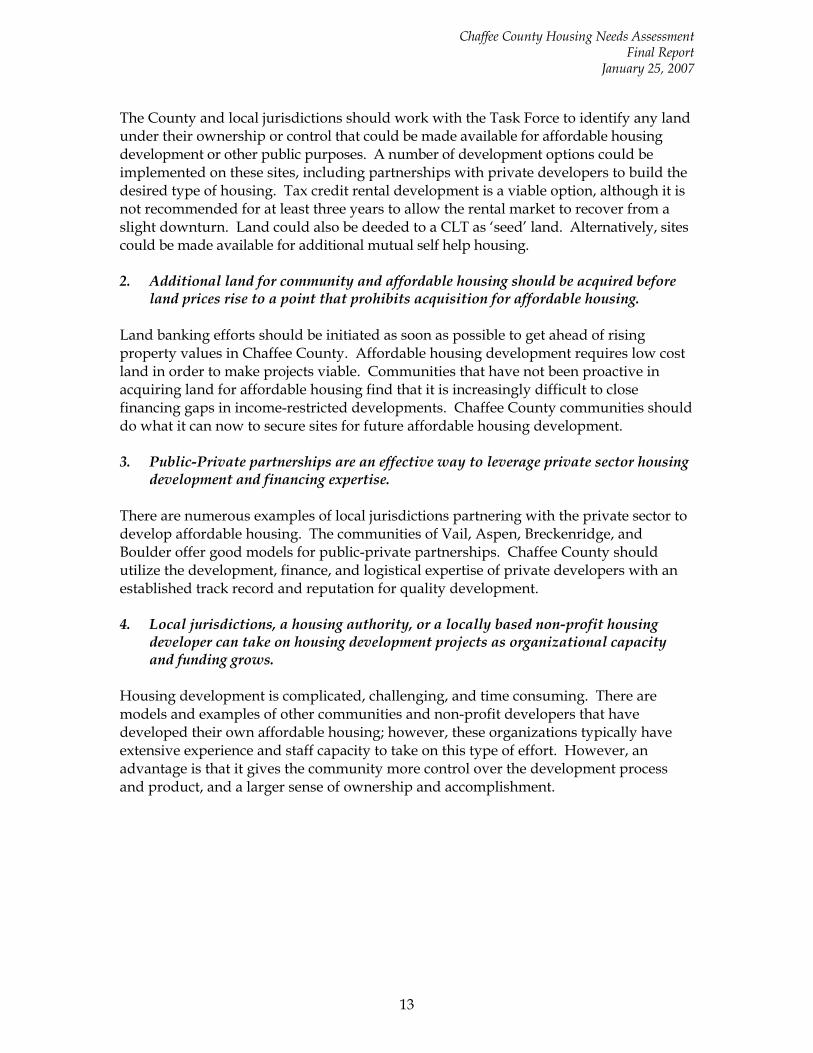
The County and local jurisdictions should work with the Task Force to identify any land under their ownership or control that could be made available for affordable housing development or other public purposes. A number of development options could be implemented on these sites, including partnerships with private developers to build the desired type of housing. Tax credit rental development is a viable option, although it is not recommended for at least three years to allow the rental market to recover from a slight downturn. Land could also be deeded to a CLT as ‘seed’ land. Alternatively, sites could be made available for additional mutual self help housing. 2. Additional land for community and affordable housing should be acquired before
land prices rise to a point that prohibits acquisition for affordable housing. Land banking efforts should be initiated as soon as possible to get ahead of rising property values in Chaffee County. Affordable housing development requires low cost land in order to make projects viable. Communities that have not been proactive in acquiring land for affordable housing find that it is increasingly difficult to close financing gaps in income-restricted developments. Chaffee County communities should do what it can now to secure sites for future affordable housing development. 3. Public-Private partnerships are an effective way to leverage private sector housing
development and financing expertise. There are numerous examples of local jurisdictions partnering with the private sector to develop affordable housing. The communities of Vail, Aspen, Breckenridge, and Boulder offer good models for public-private partnerships. Chaffee County should utilize the development, finance, and logistical expertise of private developers with an established track record and reputation for quality development. 4. Local jurisdictions, a housing authority, or a locally based non-profit housing
developer can take on housing development projects as organizational capacity and funding grows.
Housing development is complicated, challenging, and time consuming. There are models and examples of other communities and non-profit developers that have developed their own affordable housing; however, these organizations typically have extensive experience and staff capacity to take on this type of effort. However, an advantage is that it gives the community more control over the development process and product, and a larger sense of ownership and accomplishment.
Chaffee County Housing Needs Assessment Final Report
January 25, 2007
14
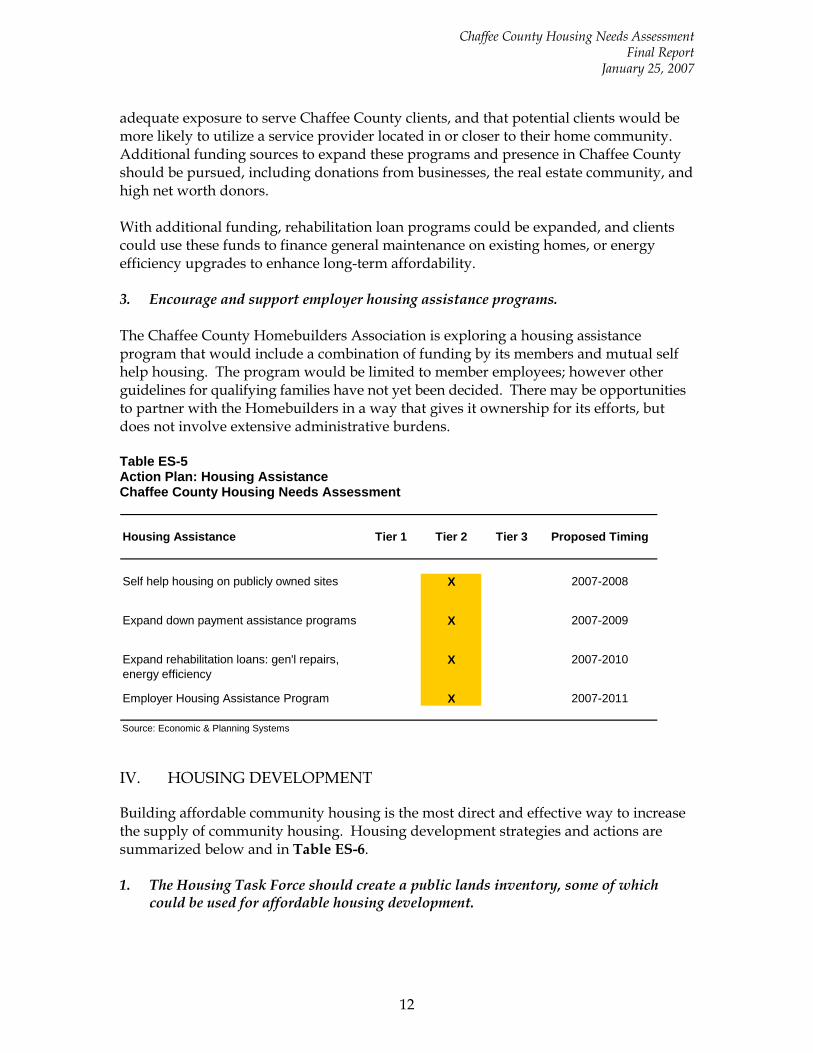
Table ES-6 Action Plan: Housing Development Chaffee County Housing Needs Assessment
Housing Development Tier 1 Tier 2 Tier 3 Proposed Timing
Public site inventory X February 2008Land Banking X OngoingPublic/private housing development partnerships X OngoingTax Credit Rental Development (private or public/non-prof. developer) X X OngoingNon Profit/CHDO/County/Municipal development X 3 - 5+ Years
Source: Economic & Planning Systems
V. LAND USE POLICY
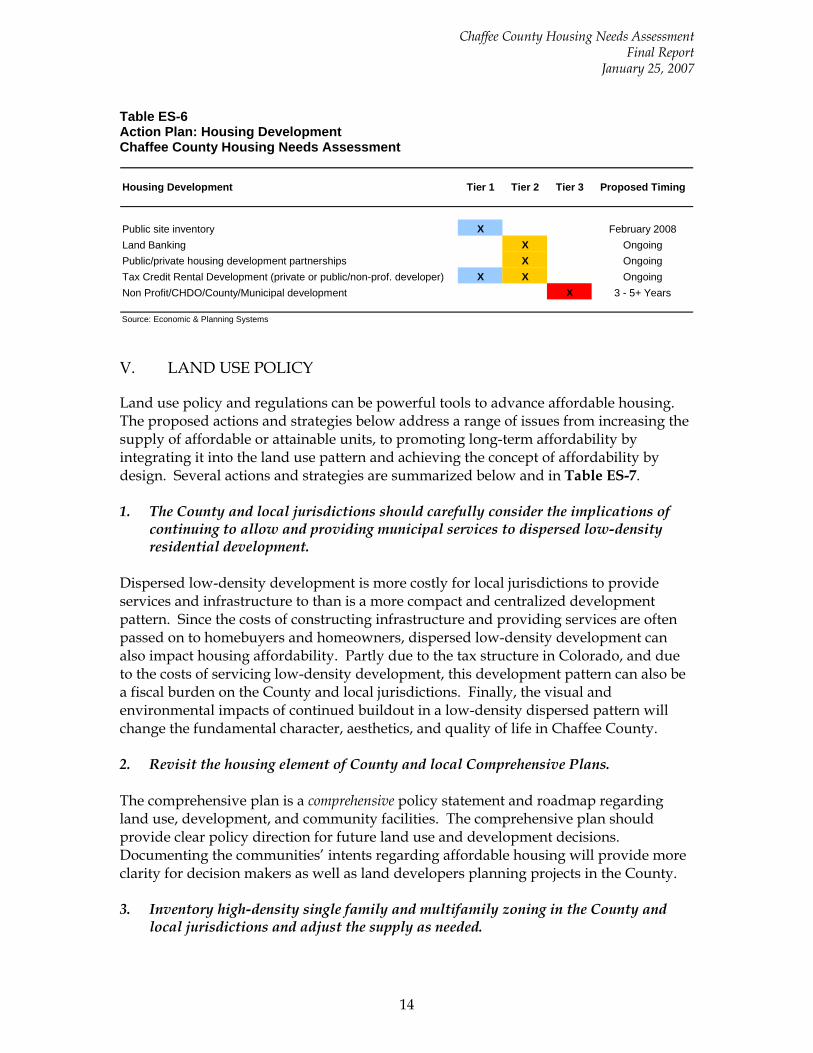
Land use policy and regulations can be powerful tools to advance affordable housing. The proposed actions and strategies below address a range of issues from increasing the supply of affordable or attainable units, to promoting long-term affordability by integrating it into the land use pattern and achieving the concept of affordability by design. Several actions and strategies are summarized below and in Table ES-7. 1. The County and local jurisdictions should carefully consider the implications of
continuing to allow and providing municipal services to dispersed low-density residential development.
Dispersed low-density development is more costly for local jurisdictions to provide services and infrastructure to than is a more compact and centralized development pattern. Since the costs of constructing infrastructure and providing services are often passed on to homebuyers and homeowners, dispersed low-density development can also impact housing affordability. Partly due to the tax structure in Colorado, and due to the costs of servicing low-density development, this development pattern can also be a fiscal burden on the County and local jurisdictions. Finally, the visual and environmental impacts of continued buildout in a low-density dispersed pattern will change the fundamental character, aesthetics, and quality of life in Chaffee County. 2. Revisit the housing element of County and local Comprehensive Plans. The comprehensive plan is a comprehensive policy statement and roadmap regarding land use, development, and community facilities. The comprehensive plan should provide clear policy direction for future land use and development decisions. Documenting the communities’ intents regarding affordable housing will provide more clarity for decision makers as well as land developers planning projects in the County. 3. Inventory high-density single family and multifamily zoning in the County and
local jurisdictions and adjust the supply as needed.
Chaffee County Housing Needs Assessment Final Report
January 25, 2007
15
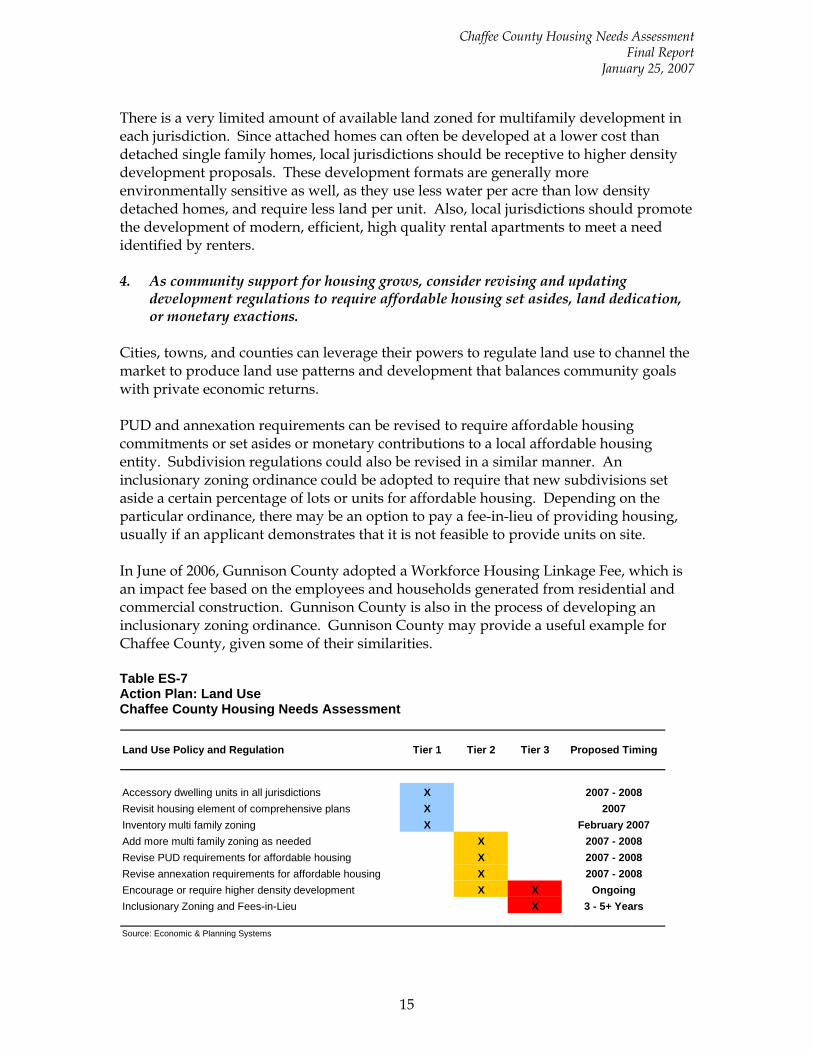
There is a very limited amount of available land zoned for multifamily development in each jurisdiction. Since attached homes can often be developed at a lower cost than detached single family homes, local jurisdictions should be receptive to higher density development proposals. These development formats are generally more environmentally sensitive as well, as they use less water per acre than low density detached homes, and require less land per unit. Also, local jurisdictions should promote the development of modern, efficient, high quality rental apartments to meet a need identified by renters. 4. As community support for housing grows, consider revising and updating
development regulations to require affordable housing set asides, land dedication, or monetary exactions.
Cities, towns, and counties can leverage their powers to regulate land use to channel the market to produce land use patterns and development that balances community goals with private economic returns. PUD and annexation requirements can be revised to require affordable housing commitments or set asides or monetary contributions to a local affordable housing entity. Subdivision regulations could also be revised in a similar manner. An inclusionary zoning ordinance could be adopted to require that new subdivisions set aside a certain percentage of lots or units for affordable housing. Depending on the particular ordinance, there may be an option to pay a fee-in-lieu of providing housing, usually if an applicant demonstrates that it is not feasible to provide units on site. In June of 2006, Gunnison County adopted a Workforce Housing Linkage Fee, which is an impact fee based on the employees and households generated from residential and commercial construction. Gunnison County is also in the process of developing an inclusionary zoning ordinance. Gunnison County may provide a useful example for Chaffee County, given some of their similarities. Table ES-7 Action Plan: Land Use Chaffee County Housing Needs Assessment
Land Use Policy and Regulation Tier 1 Tier 2 Tier 3 Proposed Timing
Accessory dwelling units in all jurisdictions X 2007 - 2008Revisit housing element of comprehensive plans X 2007Inventory multi family zoning X February 2007Add more multi family zoning as needed X 2007 - 2008Revise PUD requirements for affordable housing X 2007 - 2008Revise annexation requirements for affordable housing X 2007 - 2008Encourage or require higher density development X X OngoingInclusionary Zoning and Fees-in-Lieu X 3 - 5+ Years
Source: Economic & Planning Systems
Chaffee County Housing Needs Assessment Final Report
January 25, 2007
16
EXISTING RESOURCES AND OPPORTUNITIES
The Chaffee County region has a number of existing housing resources. The Housing Task Force should consider these organizations and their potential for expansion or partnerships based on the Task Force’s objectives. In some cases, a housing agency with a local presence can be more effective than agencies in more outlying areas. However, the potential for partnerships with other housing providers should also be considered. 1. The Salida Housing Authority has interest in expanding its role in senior and
affordable housing. However, it has limited staff and is concerned with losing funding for its current development, Mt. Shavano Manor.
The Salida Housing Authority operates the 50-unit Mt. Shavano Manor property that houses seniors and people with disabilities. Currently it has one full time staff that manages Mt. Shavano Manor, and a volunteer Board of Directors. The Salida Housing Authority has interest in developing more senior housing, but is concerned with the impacts that expanding its role may have on its existing funding sources. It should be clarified whether the funding issue is an administrative hurdle or a true impediment to its developing additional senior housing. The Task Force should also consider the role that the Salida Housing Authority could play in a larger housing effort based on its level of interest and staff capacity. 2. The Upper Arkansas Area Council of Governments (UAACOG) is the largest and
most established housing resource in the region. With an existing organizational structure and funding sources, its potential to expand or diversify should be considered in light of the Chaffee County Housing Task Force goals.
UAACOG’s mission is to provide quality services to promote self-sufficiency and healthy lifestyles of individuals and families by enabling them to improve their lives. UAACOG’s jurisdiction includes Fremont, Chaffee, Custer, and Lake Counties. The UAACOG housing programs include mutual self help housing (low interest loans and sweat equity), Section 8 rental vouchers, low interest rehabilitation loans, a new down payment assistance loan fund, and homebuyer counseling. UAACOG has expressed some interest in expanding its programs, and applying to the State Division of Housing for a $100,000 grant to expand the down payment assistance program into Chaffee County. With an existing organizational structure, staff, and funding, there may be opportunities to work with UAACOG to expand its programs in Chaffee County. Some local stakeholders have suggested that a local presence in Chaffee County may reach more clients, as UAACOG is based in Canon City. 3. The County and local jurisdictions have significant public land holdings that could
be made available for affordable housing development. A first step is for each jurisdiction to identify sites that may be suitable for housing development.
Chaffee County Housing Needs Assessment Final Report
January 25, 2007
17
The County and local jurisdictions should identify any land under their ownership or control that could be made available for housing development. It is recommended that lands be deeded to a newly formed CLT as ‘seed’ land. Alternatively, the jurisdictions could partner with a private developer to build for-sale or rental affordable housing. 4. The private development market has been successful in filling some of the need for
attainable housing priced from approximately $150,000 to $200,000. These efforts are laudable, and the County and local jurisdictions should encourage and promote the development of high quality lower cost housing.
The County and local jurisdictions should work to channel the private market to help achieve community housing and land use goals. This includes the concept of “affordability by design”, which entails ensuring that small lots (3,500 to 8,000 sq. ft.) are available for development close to existing infrastructure and services to minimize development costs related to extending infrastructure. Local land use policies should also look favorably at attached and multifamily housing proposals, such as townhomes, duplexes, and stacked multifamily units including modern rental apartments.
18
I. AFFORDABLE HOUSING OVERVIEW
This chapter provides a brief overview of affordable housing in general. It provides general examples of property types, as well as descriptions of some of the most common affordable housing programs.
DEFINITIONS
The generally accepted definition of affordable housing, including the definition used by the U.S. Department of Housing and Urban Development (HUD), is housing that costs no more than 30 percent of gross household income. In other words, an affordable mortgage or rental payment should be no more than 30 percent of monthly income. Market rate housing can be considered affordable as long as it corresponds to these terms. There are public and private means of providing housing at prices below market prices to targeted income or population groups, such as low-income families, the elderly, and the disabled. This study attempts to identify the local population groups in need of housing assistance and ways the community can address these needs.
SECTION 8 VOUCHERS
Section 8 Housing Choice Vouchers allow very low-income families to choose and lease or purchase privately-owned rental housing. Section 8 vouchers are administered by a public housing authority, such as the Salida Housing Authority. The program is open to very low-income families defined as families earning less than 50 percent of the Area Median Income (AMI), senior citizens, disabled and handicapped individuals. Under this program, tenants are responsible for finding a rental unit that is suitable with a landlord that accepts Section 8 vouchers. The Section 8 voucher pays the owner the difference between 30 percent of adjusted family income and a fair market rent, determined by the public housing authority and HUD, or the gross rent for the unit, whichever is lower. The family may choose a unit with a higher rent than the payment standard and pay the owner the difference. The advantage of the Section 8 program is that it allows the private market to provide housing, and integrates low-income families into the community.
LOW INCOME HOUSING TAX CREDIT
The Low Income Housing Tax Credit (LIHTC) program provides financing for affordable housing development. In Colorado, the LIHTC program is administered by the Colorado Housing and Finance Authority (CHFA). Corporations and individuals provide equity to a development by purchasing tax credits to offset their tax liability. Through a competitive process, CHFA awards financing to affordable housing developers with projects that CHFA believes will be successful in the market and will
Chaffee County Housing Needs Assessment Final Report
January 25, 2007
19
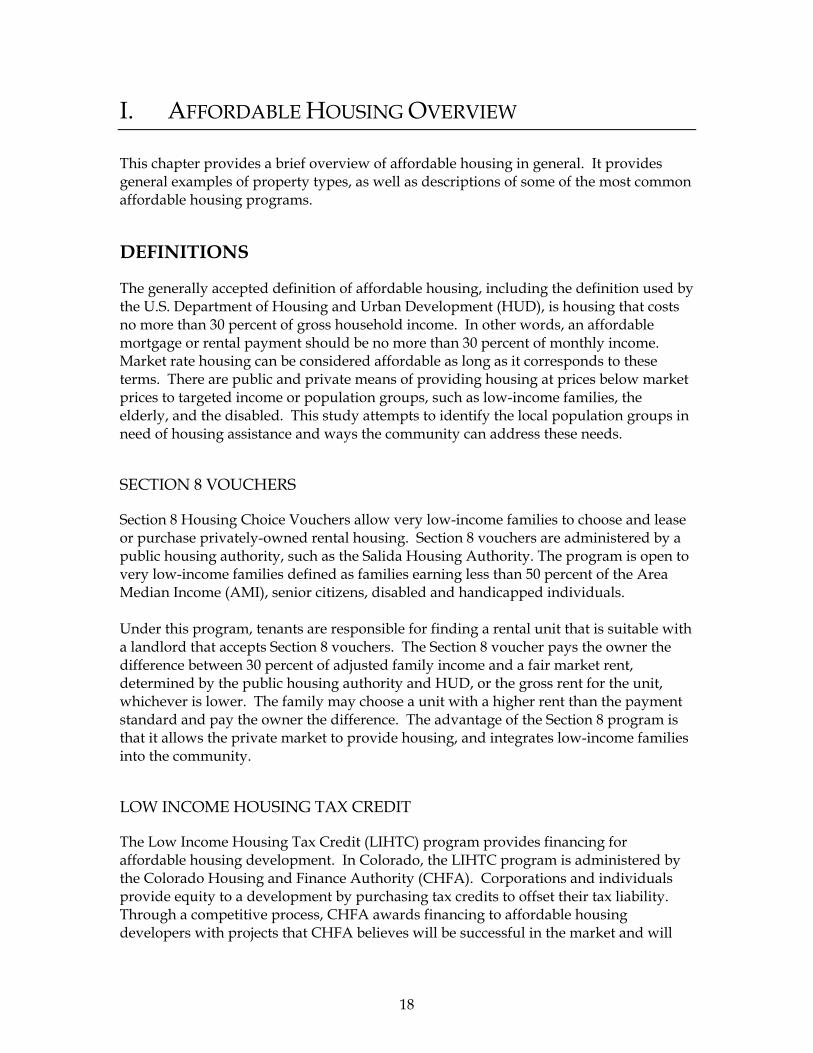
help meet a demonstrated need. Local examples include DeAnza Vista in Poncha Springs and Riverbend in Salida. An advantage of the tax credit program is that it helps enable the private market to develop affordable housing. A shortcoming is that tax credit developments often still require low cost land to make projects feasible; LIHTC financing can’t always overcome high land costs. LIHTC development works well when there is a broad spectrum of household income represented. The most successful projects are those with a mix of market rate and LIHTC units.
Mercy Housing’s Merced de Las Animas LIHTC, Durango, CO
SELF HELP HOUSING
The Self Help program provides new single-family homes to first-time homeowners. Homeowners are required to help build the home, working 30 hours per week during the construction period. The program includes low-interest financing through the 502 Direct Loan Program through USDA Rural Development, ranging from 1 to 7.25 percent rates, depending upon family income. To be eligible to participate, households must earn less than 80 percent of the Area Median Income (AMI), which equates to $43,000 for a family of four in 2005. Additionally, potential participants must have a sufficient income to qualify for financing and must have reasonable credit.
COMMUNITY LAND TRUST
Community Land Trusts are typical private, non-profit organizations that develop and administer affordable ownership projects. The Trust will purchase land (often assisted by a local government or another source), construct the housing, and then sell to qualified households at below market rates. Traditionally, sales prices are based only on the cost of construction. Residents own their units but the land is held by the Trust. Resale prices are capped and in some cases the Trust and the homeowner divide the equity generated by market appreciation, with the Trust using proceeds to develop additional projects.
Chaffee County Housing Needs Assessment Final Report
January 25, 2007
20
WORKFORCE AND COMMUNITY HOUSING
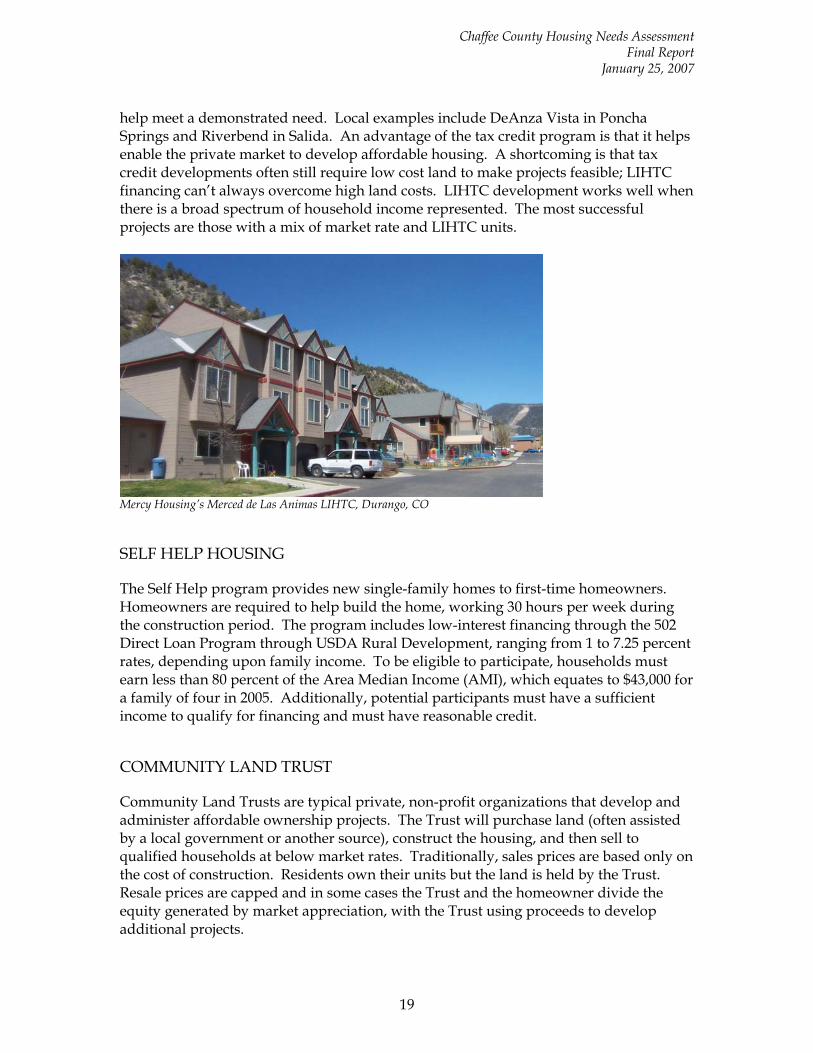
The terms ‘Workforce Housing’ and ‘Community Housing’ do not describe any established federal or state local affordable housing programs. Workforce and community housing are industry terms that describe housing programs targeted at providing housing opportunities for local employees. A range of historic housing programs, such as Self Help Housing or LIHTC, also provide workforce housing given that the residents usually are employed. However, the recently expanding category of workforce housing targets higher income households that are ineligible for traditional programs. Thus, the targeted groups include employment positions like teachers, tellers, and police officers. Workforce housing can be rental or for-sale housing, and is typically restricted to people who are employed within the community. The Wellington Neighborhood in Breckenridge, Colorado is a model for workforce housing in the state.
Wellington Neighborhood, Breckenridge, CO Housing advocates indicate that workforce housing helps to maintain community diversity and strength by enabling the people who are responsible for running the daily service needs of a community to live in the same community.
21
II. ECONOMIC AND DEMOGRAPHIC FRAMEWORK
This chapter presents an analysis of economic and demographic trends in Chaffee County. This chapter documents population, household, and housing unit growth trends from 1990 to 2005. Along with these trends, estimates on the growth in second homes are also presented. Finally, the chapter characterizes the Chaffee County economic base and describes employment trends since 1990. Any housing or land use policy actions in Chaffee County should be grounded by the fundamental market and economic characteristics of the County.
POPULATION, HOUSEHOLDS, AND HOUSING UNITS
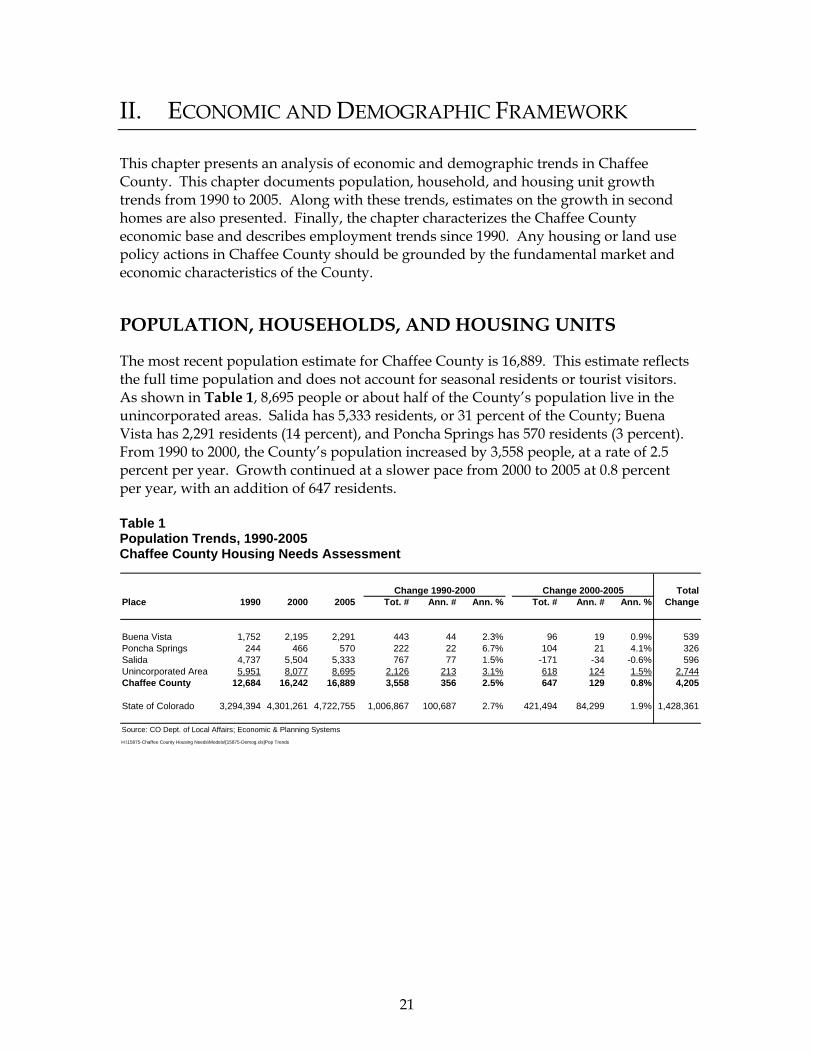
The most recent population estimate for Chaffee County is 16,889. This estimate reflects the full time population and does not account for seasonal residents or tourist visitors. As shown in Table 1, 8,695 people or about half of the County’s population live in the unincorporated areas. Salida has 5,333 residents, or 31 percent of the County; Buena Vista has 2,291 residents (14 percent), and Poncha Springs has 570 residents (3 percent). From 1990 to 2000, the County’s population increased by 3,558 people, at a rate of 2.5 percent per year. Growth continued at a slower pace from 2000 to 2005 at 0.8 percent per year, with an addition of 647 residents. Table 1 Population Trends, 1990-2005 Chaffee County Housing Needs Assessment
TotalPlace 1990 2000 2005 Tot. # Ann. # Ann. % Tot. # Ann. # Ann. % Change
Buena Vista 1,752 2,195 2,291 443 44 2.3% 96 19 0.9% 539Poncha Springs 244 466 570 222 22 6.7% 104 21 4.1% 326Salida 4,737 5,504 5,333 767 77 1.5% -171 -34 -0.6% 596Unincorporated Area 5,951 8,077 8,695 2,126 213 3.1% 618 124 1.5% 2,744Chaffee County 12,684 16,242 16,889 3,558 356 2.5% 647 129 0.8% 4,205
State of Colorado 3,294,394 4,301,261 4,722,755 1,006,867 100,687 2.7% 421,494 84,299 1.9% 1,428,361
Source: CO Dept. of Local Affairs; Economic & Planning SystemsH:\15875-Chaffee County Housing Needs\Models\[15875-Demog.xls]Pop Trends
Change 1990-2000 Change 2000-2005
Chaffee County Housing Needs Assessment Final Report
January 25, 2007
22
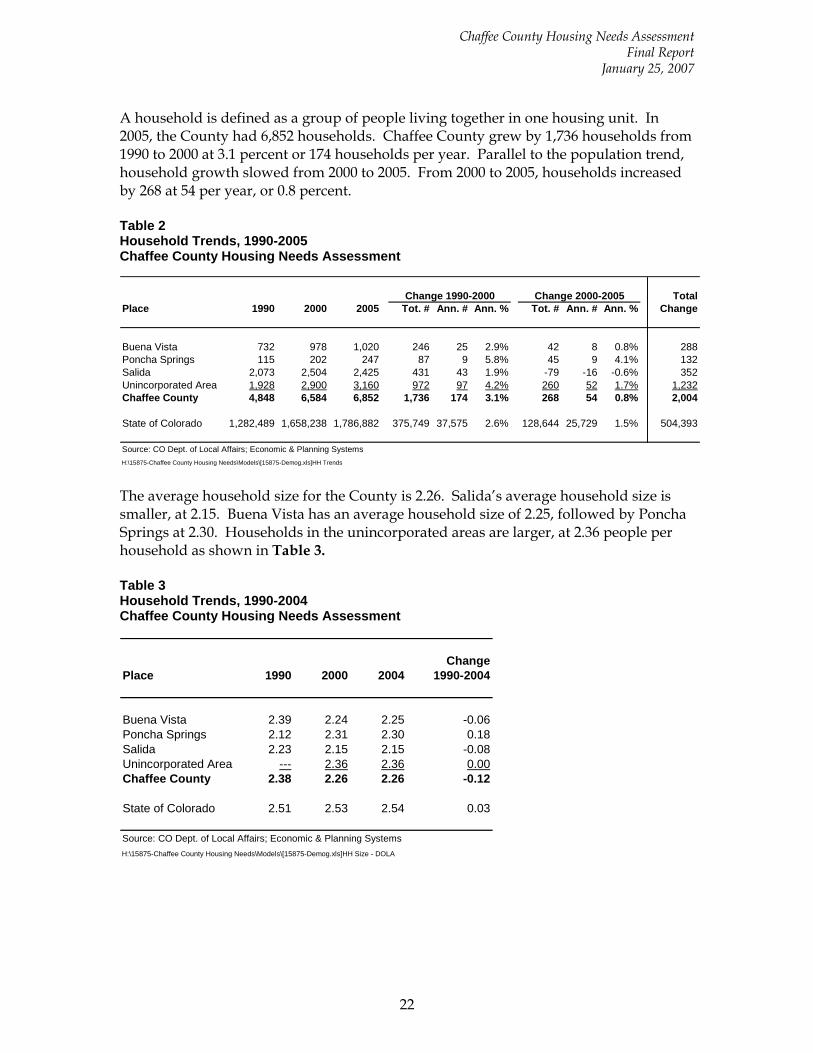
A household is defined as a group of people living together in one housing unit. In 2005, the County had 6,852 households. Chaffee County grew by 1,736 households from 1990 to 2000 at 3.1 percent or 174 households per year. Parallel to the population trend, household growth slowed from 2000 to 2005. From 2000 to 2005, households increased by 268 at 54 per year, or 0.8 percent. Table 2 Household Trends, 1990-2005 Chaffee County Housing Needs Assessment
TotalPlace 1990 2000 2005 Tot. # Ann. # Ann. % Tot. # Ann. # Ann. % Change
Buena Vista 732 978 1,020 246 25 2.9% 42 8 0.8% 288Poncha Springs 115 202 247 87 9 5.8% 45 9 4.1% 132Salida 2,073 2,504 2,425 431 43 1.9% -79 -16 -0.6% 352Unincorporated Area 1,928 2,900 3,160 972 97 4.2% 260 52 1.7% 1,232Chaffee County 4,848 6,584 6,852 1,736 174 3.1% 268 54 0.8% 2,004
State of Colorado 1,282,489 1,658,238 1,786,882 375,749 37,575 2.6% 128,644 25,729 1.5% 504,393
Source: CO Dept. of Local Affairs; Economic & Planning SystemsH:\15875-Chaffee County Housing Needs\Models\[15875-Demog.xls]HH Trends
Change 1990-2000 Change 2000-2005
The average household size for the County is 2.26. Salida’s average household size is smaller, at 2.15. Buena Vista has an average household size of 2.25, followed by Poncha Springs at 2.30. Households in the unincorporated areas are larger, at 2.36 people per household as shown in Table 3. Table 3 Household Trends, 1990-2004 Chaffee County Housing Needs Assessment
ChangePlace 1990 2000 2004 1990-2004
Buena Vista 2.39 2.24 2.25 -0.06Poncha Springs 2.12 2.31 2.30 0.18Salida 2.23 2.15 2.15 -0.08Unincorporated Area --- 2.36 2.36 0.00Chaffee County 2.38 2.26 2.26 -0.12
State of Colorado 2.51 2.53 2.54 0.03
Source: CO Dept. of Local Affairs; Economic & Planning SystemsH:\15875-Chaffee County Housing Needs\Models\[15875-Demog.xls]HH Size - DOLA
Chaffee County Housing Needs Assessment Final Report
January 25, 2007
23
HOUSING TRENDS
INVENTORY AND TRENDS
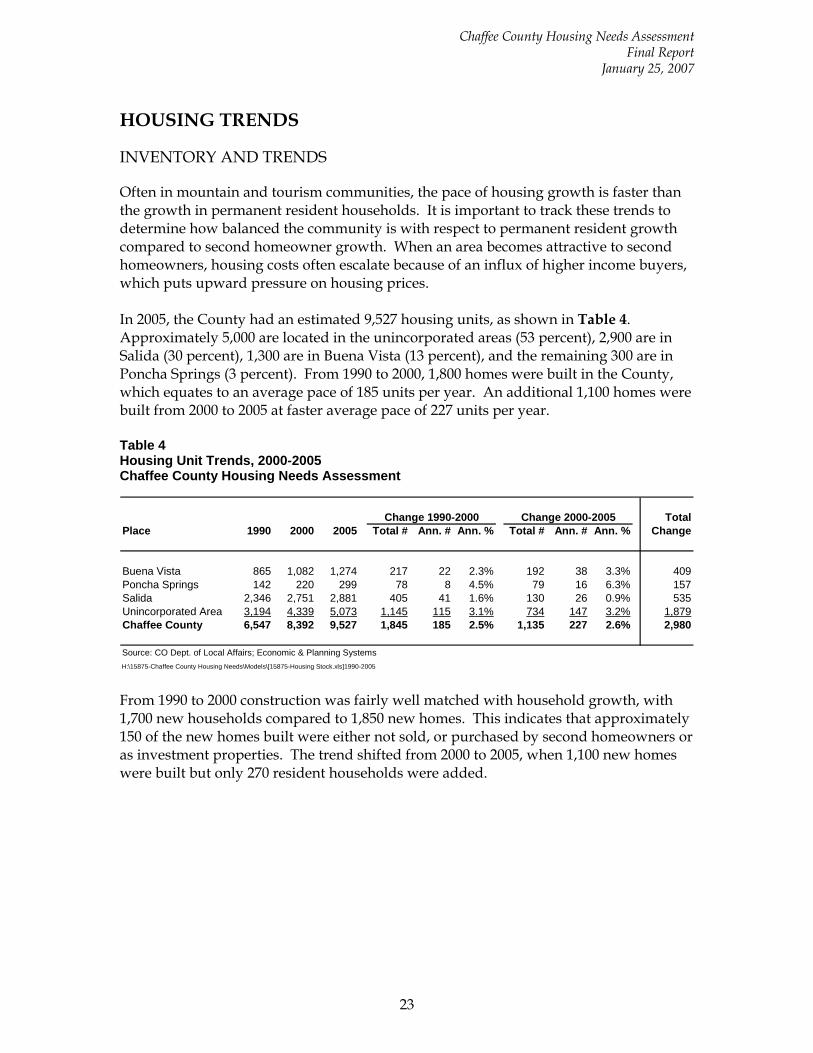
Often in mountain and tourism communities, the pace of housing growth is faster than the growth in permanent resident households. It is important to track these trends to determine how balanced the community is with respect to permanent resident growth compared to second homeowner growth. When an area becomes attractive to second homeowners, housing costs often escalate because of an influx of higher income buyers, which puts upward pressure on housing prices. In 2005, the County had an estimated 9,527 housing units, as shown in Table 4. Approximately 5,000 are located in the unincorporated areas (53 percent), 2,900 are in Salida (30 percent), 1,300 are in Buena Vista (13 percent), and the remaining 300 are in Poncha Springs (3 percent). From 1990 to 2000, 1,800 homes were built in the County, which equates to an average pace of 185 units per year. An additional 1,100 homes were built from 2000 to 2005 at faster average pace of 227 units per year. Table 4 Housing Unit Trends, 2000-2005 Chaffee County Housing Needs Assessment
TotalPlace 1990 2000 2005 Total # Ann. # Ann. % Total # Ann. # Ann. % Change
Buena Vista 865 1,082 1,274 217 22 2.3% 192 38 3.3% 409Poncha Springs 142 220 299 78 8 4.5% 79 16 6.3% 157Salida 2,346 2,751 2,881 405 41 1.6% 130 26 0.9% 535Unincorporated Area 3,194 4,339 5,073 1,145 115 3.1% 734 147 3.2% 1,879Chaffee County 6,547 8,392 9,527 1,845 185 2.5% 1,135 227 2.6% 2,980
Source: CO Dept. of Local Affairs; Economic & Planning SystemsH:\15875-Chaffee County Housing Needs\Models\[15875-Housing Stock.xls]1990-2005
Change 1990-2000 Change 2000-2005
From 1990 to 2000 construction was fairly well matched with household growth, with 1,700 new households compared to 1,850 new homes. This indicates that approximately 150 of the new homes built were either not sold, or purchased by second homeowners or as investment properties. The trend shifted from 2000 to 2005, when 1,100 new homes were built but only 270 resident households were added.
Chaffee County Housing Needs Assessment Final Report
January 25, 2007
24
SECOND HOMES
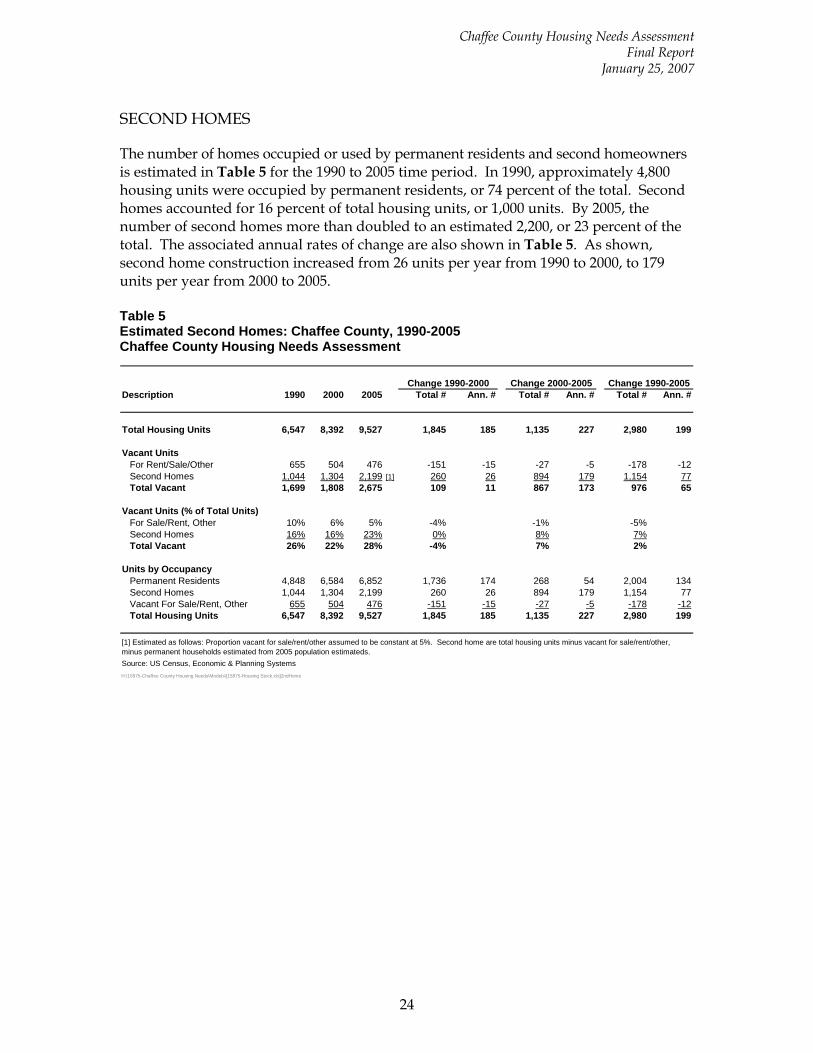
The number of homes occupied or used by permanent residents and second homeowners is estimated in Table 5 for the 1990 to 2005 time period. In 1990, approximately 4,800 housing units were occupied by permanent residents, or 74 percent of the total. Second homes accounted for 16 percent of total housing units, or 1,000 units. By 2005, the number of second homes more than doubled to an estimated 2,200, or 23 percent of the total. The associated annual rates of change are also shown in Table 5. As shown, second home construction increased from 26 units per year from 1990 to 2000, to 179 units per year from 2000 to 2005. Table 5 Estimated Second Homes: Chaffee County, 1990-2005 Chaffee County Housing Needs Assessment
Description 1990 2000 2005 Total # Ann. # Total # Ann. # Total # Ann. #
Total Housing Units 6,547 8,392 9,527 1,845 185 1,135 227 2,980 199
Vacant UnitsFor Rent/Sale/Other 655 504 476 -151 -15 -27 -5 -178 -12Second Homes 1,044 1,304 2,199 [1] 260 26 894 179 1,154 77Total Vacant 1,699 1,808 2,675 109 11 867 173 976 65
Vacant Units (% of Total Units)For Sale/Rent, Other 10% 6% 5% -4% -1% -5%Second Homes 16% 16% 23% 0% 8% 7%Total Vacant 26% 22% 28% -4% 7% 2%
Units by OccupancyPermanent Residents 4,848 6,584 6,852 1,736 174 268 54 2,004 134Second Homes 1,044 1,304 2,199 260 26 894 179 1,154 77Vacant For Sale/Rent, Other 655 504 476 -151 -15 -27 -5 -178 -12Total Housing Units 6,547 8,392 9,527 1,845 185 1,135 227 2,980 199
Source: US Census, Economic & Planning SystemsH:\15875-Chaffee County Housing Needs\Models\[15875-Housing Stock.xls]2ndHome
Change 1990-2000 Change 2000-2005 Change 1990-2005
[1] Estimated as follows: Proportion vacant for sale/rent/other assumed to be constant at 5%. Second home are total housing units minus vacant for sale/rent/other, minus permanent households estimated from 2005 population estimateds.
Chaffee County Housing Needs Assessment Final Report
January 25, 2007
25
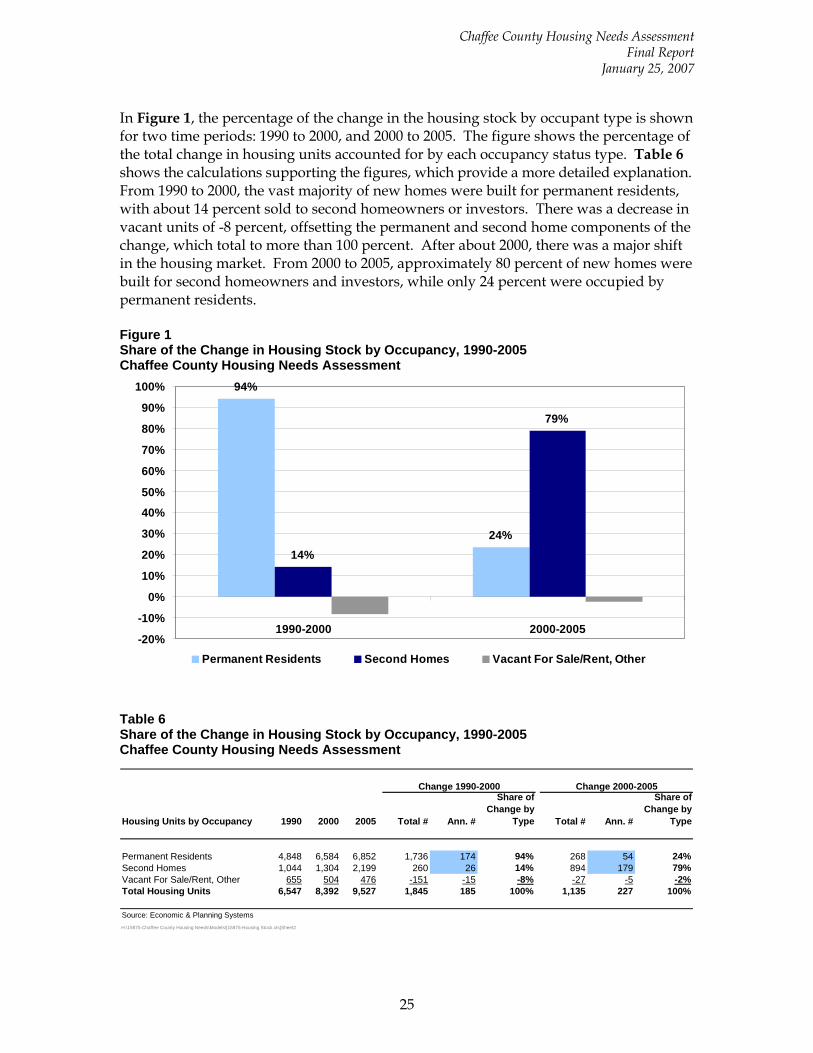
In Figure 1, the percentage of the change in the housing stock by occupant type is shown for two time periods: 1990 to 2000, and 2000 to 2005. The figure shows the percentage of the total change in housing units accounted for by each occupancy status type. Table 6 shows the calculations supporting the figures, which provide a more detailed explanation. From 1990 to 2000, the vast majority of new homes were built for permanent residents, with about 14 percent sold to second homeowners or investors. There was a decrease in vacant units of -8 percent, offsetting the permanent and second home components of the change, which total to more than 100 percent. After about 2000, there was a major shift in the housing market. From 2000 to 2005, approximately 80 percent of new homes were built for second homeowners and investors, while only 24 percent were occupied by permanent residents. Figure 1 Share of the Change in Housing Stock by Occupancy, 1990-2005 Chaffee County Housing Needs Assessment
94%
24%14%
79%
-20%
-10%
0%
10%
20%
30%
40%
50%
60%
70%
80%
90%
100%
1990-2000 2000-2005
Permanent Residents Second Homes Vacant For Sale/Rent, Other
Table 6 Share of the Change in Housing Stock by Occupancy, 1990-2005 Chaffee County Housing Needs Assessment
Housing Units by Occupancy 1990 2000 2005 Total # Ann. #
Share of Change by
Type Total # Ann. #
Share of Change by
Type
Permanent Residents 4,848 6,584 6,852 1,736 174 94% 268 54 24%Second Homes 1,044 1,304 2,199 260 26 14% 894 179 79%Vacant For Sale/Rent, Other 655 504 476 -151 -15 -8% -27 -5 -2%Total Housing Units 6,547 8,392 9,527 1,845 185 100% 1,135 227 100%
Source: Economic & Planning SystemsH:\15875-Chaffee County Housing Needs\Models\[15875-Housing Stock.xls]Sheet2
Change 1990-2000 Change 2000-2005
Chaffee County Housing Needs Assessment Final Report
January 25, 2007
26
CONSTRUCTION TRENDS
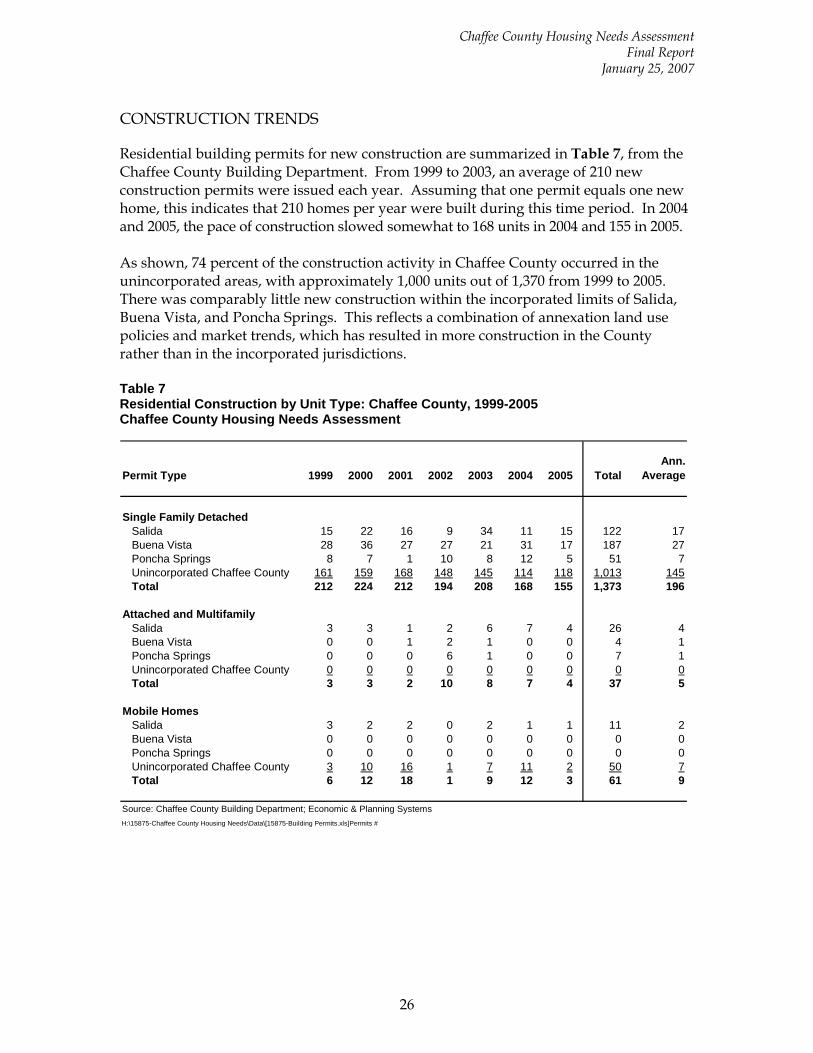
Residential building permits for new construction are summarized in Table 7, from the Chaffee County Building Department. From 1999 to 2003, an average of 210 new construction permits were issued each year. Assuming that one permit equals one new home, this indicates that 210 homes per year were built during this time period. In 2004 and 2005, the pace of construction slowed somewhat to 168 units in 2004 and 155 in 2005. As shown, 74 percent of the construction activity in Chaffee County occurred in the unincorporated areas, with approximately 1,000 units out of 1,370 from 1999 to 2005. There was comparably little new construction within the incorporated limits of Salida, Buena Vista, and Poncha Springs. This reflects a combination of annexation land use policies and market trends, which has resulted in more construction in the County rather than in the incorporated jurisdictions. Table 7 Residential Construction by Unit Type: Chaffee County, 1999-2005 Chaffee County Housing Needs Assessment
Permit Type 1999 2000 2001 2002 2003 2004 2005 TotalAnn.
Average
Single Family DetachedSalida 15 22 16 9 34 11 15 122 17Buena Vista 28 36 27 27 21 31 17 187 27Poncha Springs 8 7 1 10 8 12 5 51 7Unincorporated Chaffee County 161 159 168 148 145 114 118 1,013 145Total 212 224 212 194 208 168 155 1,373 196
Attached and MultifamilySalida 3 3 1 2 6 7 4 26 4Buena Vista 0 0 1 2 1 0 0 4 1Poncha Springs 0 0 0 6 1 0 0 7 1Unincorporated Chaffee County 0 0 0 0 0 0 0 0 0Total 3 3 2 10 8 7 4 37 5
Mobile HomesSalida 3 2 2 0 2 1 1 11 2Buena Vista 0 0 0 0 0 0 0 0 0Poncha Springs 0 0 0 0 0 0 0 0 0Unincorporated Chaffee County 3 10 16 1 7 11 2 50 7Total 6 12 18 1 9 12 3 61 9
Source: Chaffee County Building Department; Economic & Planning SystemsH:\15875-Chaffee County Housing Needs\Data\[15875-Building Permits.xls]Permits #
Chaffee County Housing Needs Assessment Final Report
January 25, 2007
27
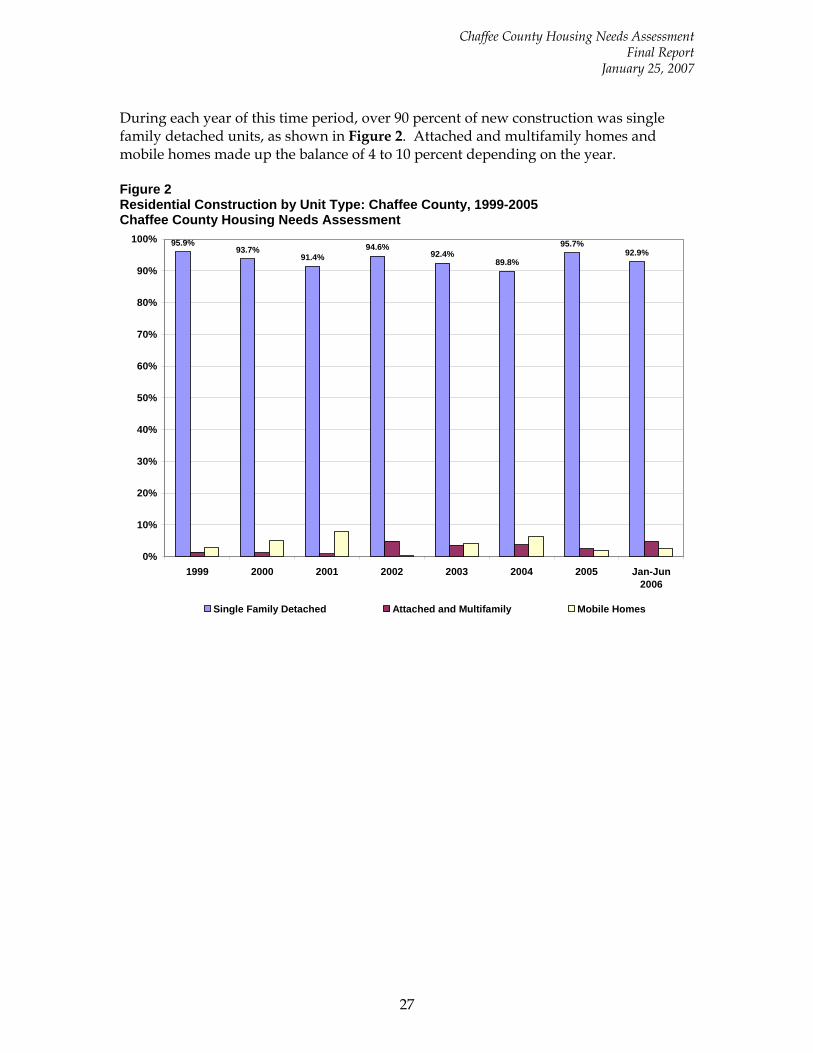
During each year of this time period, over 90 percent of new construction was single family detached units, as shown in Figure 2. Attached and multifamily homes and mobile homes made up the balance of 4 to 10 percent depending on the year. Figure 2 Residential Construction by Unit Type: Chaffee County, 1999-2005 Chaffee County Housing Needs Assessment
93.7%91.4%
94.6%92.4%
89.8%
95.7%92.9%
95.9%
0%
10%
20%
30%
40%
50%
60%
70%
80%
90%
100%
1999 2000 2001 2002 2003 2004 2005 Jan-Jun2006
Single Family Detached Attached and Multifamily Mobile Homes
Chaffee County Housing Needs Assessment Final Report
January 25, 2007
28
DEMOGRAPHIC CHARACTERISTICS
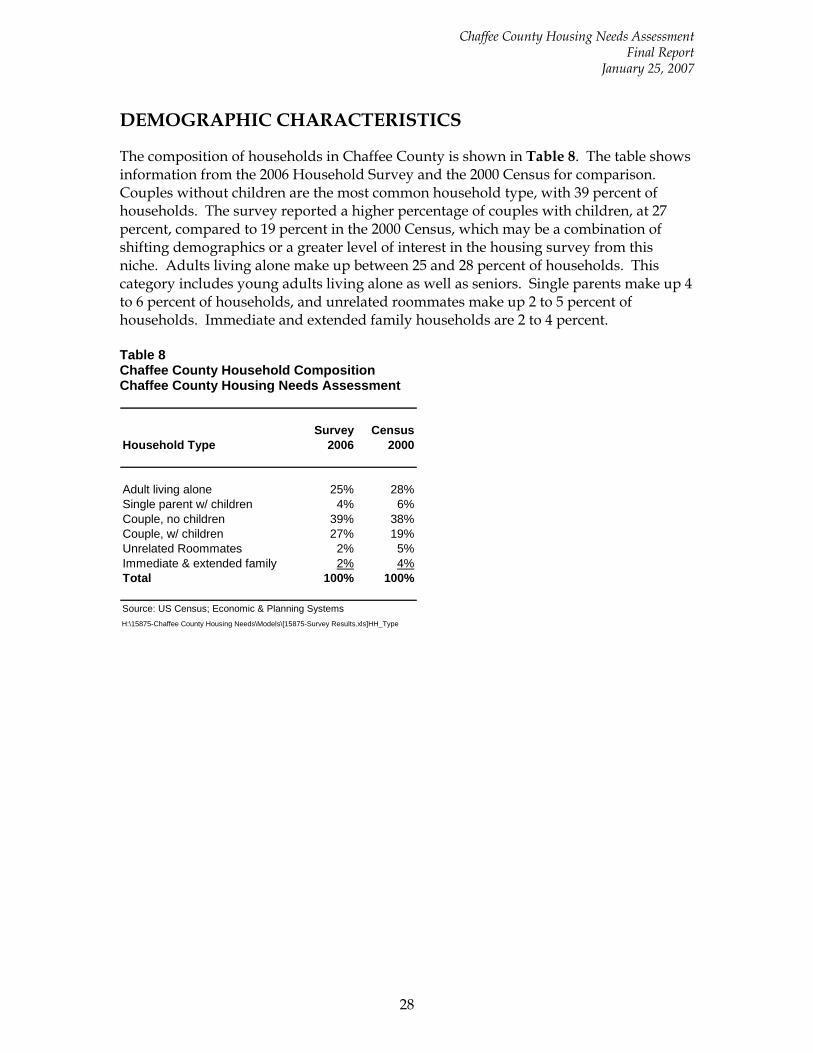
The composition of households in Chaffee County is shown in Table 8. The table shows information from the 2006 Household Survey and the 2000 Census for comparison. Couples without children are the most common household type, with 39 percent of households. The survey reported a higher percentage of couples with children, at 27 percent, compared to 19 percent in the 2000 Census, which may be a combination of shifting demographics or a greater level of interest in the housing survey from this niche. Adults living alone make up between 25 and 28 percent of households. This category includes young adults living alone as well as seniors. Single parents make up 4 to 6 percent of households, and unrelated roommates make up 2 to 5 percent of households. Immediate and extended family households are 2 to 4 percent. Table 8 Chaffee County Household Composition Chaffee County Housing Needs Assessment
Survey CensusHousehold Type 2006 2000
Adult living alone 25% 28%Single parent w/ children 4% 6%Couple, no children 39% 38%Couple, w/ children 27% 19%Unrelated Roommates 2% 5%Immediate & extended family 2% 4%Total 100% 100%
Source: US Census; Economic & Planning SystemsH:\15875-Chaffee County Housing Needs\Models\[15875-Survey Results.xls]HH_Type
Chaffee County Housing Needs Assessment Final Report
January 25, 2007
29
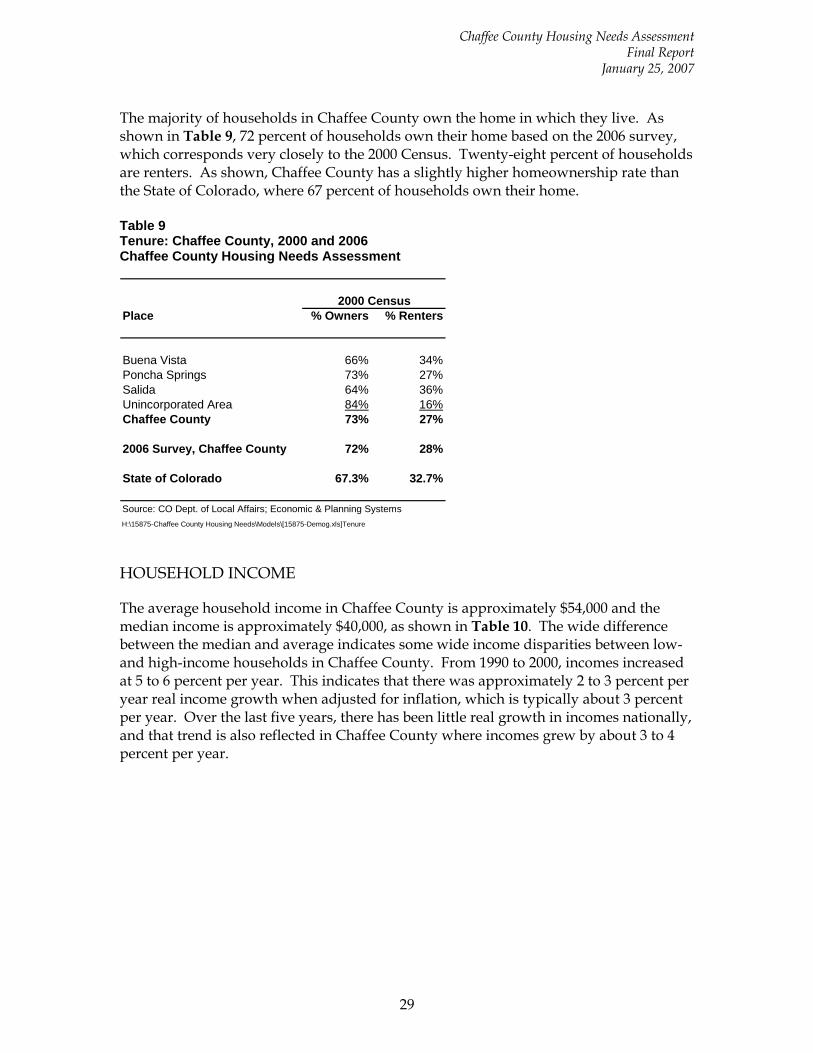
The majority of households in Chaffee County own the home in which they live. As shown in Table 9, 72 percent of households own their home based on the 2006 survey, which corresponds very closely to the 2000 Census. Twenty-eight percent of households are renters. As shown, Chaffee County has a slightly higher homeownership rate than the State of Colorado, where 67 percent of households own their home. Table 9 Tenure: Chaffee County, 2000 and 2006 Chaffee County Housing Needs Assessment
Place % Owners % Renters
Buena Vista 66% 34%Poncha Springs 73% 27%Salida 64% 36%Unincorporated Area 84% 16%Chaffee County 73% 27%
2006 Survey, Chaffee County 72% 28%
State of Colorado 67.3% 32.7%
Source: CO Dept. of Local Affairs; Economic & Planning SystemsH:\15875-Chaffee County Housing Needs\Models\[15875-Demog.xls]Tenure
2000 Census
HOUSEHOLD INCOME
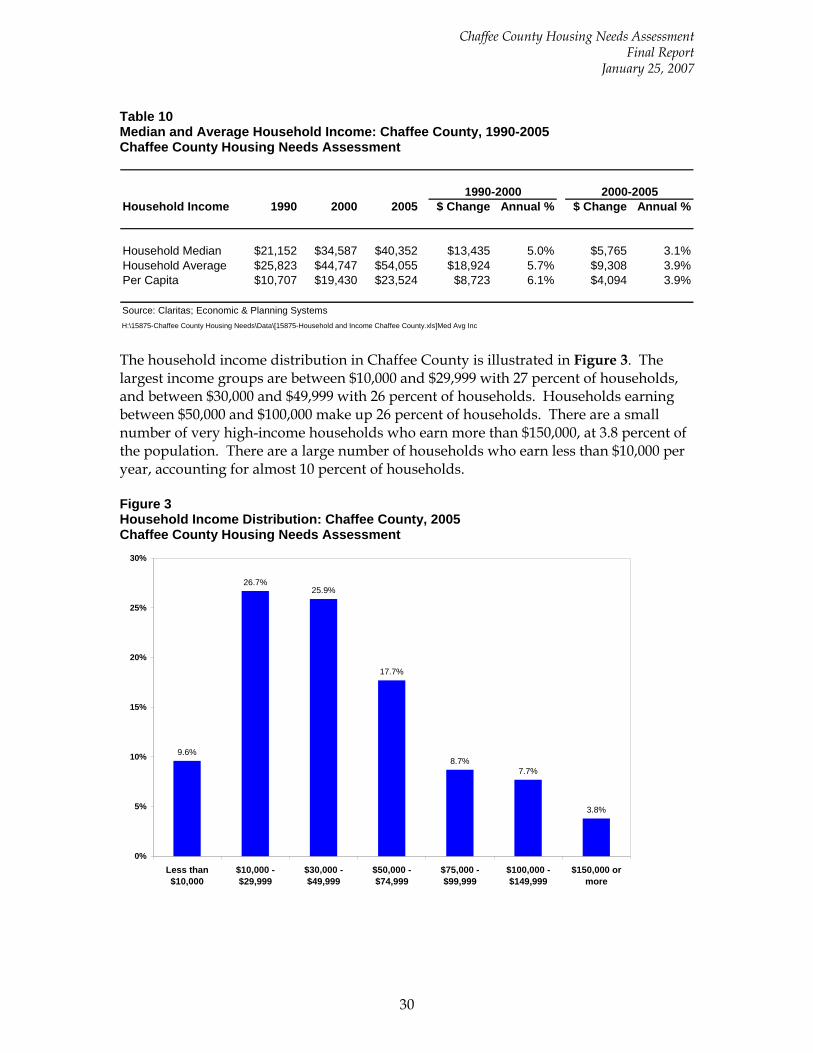
The average household income in Chaffee County is approximately $54,000 and the median income is approximately $40,000, as shown in Table 10. The wide difference between the median and average indicates some wide income disparities between low- and high-income households in Chaffee County. From 1990 to 2000, incomes increased at 5 to 6 percent per year. This indicates that there was approximately 2 to 3 percent per year real income growth when adjusted for inflation, which is typically about 3 percent per year. Over the last five years, there has been little real growth in incomes nationally, and that trend is also reflected in Chaffee County where incomes grew by about 3 to 4 percent per year.
Chaffee County Housing Needs Assessment Final Report
January 25, 2007
30
Table 10 Median and Average Household Income: Chaffee County, 1990-2005 Chaffee County Housing Needs Assessment
Household Income 1990 2000 2005 $ Change Annual % $ Change Annual %
Household Median $21,152 $34,587 $40,352 $13,435 5.0% $5,765 3.1%Household Average $25,823 $44,747 $54,055 $18,924 5.7% $9,308 3.9%Per Capita $10,707 $19,430 $23,524 $8,723 6.1% $4,094 3.9%
Source: Claritas; Economic & Planning SystemsH:\15875-Chaffee County Housing Needs\Data\[15875-Household and Income Chaffee County.xls]Med Avg Inc
1990-2000 2000-2005
The household income distribution in Chaffee County is illustrated in Figure 3. The largest income groups are between $10,000 and $29,999 with 27 percent of households, and between $30,000 and $49,999 with 26 percent of households. Households earning between $50,000 and $100,000 make up 26 percent of households. There are a small number of very high-income households who earn more than $150,000, at 3.8 percent of the population. There are a large number of households who earn less than $10,000 per year, accounting for almost 10 percent of households. Figure 3 Household Income Distribution: Chaffee County, 2005 Chaffee County Housing Needs Assessment
9.6%
26.7%25.9%
17.7%
8.7%7.7%
3.8%
0%
5%
10%
15%
20%
25%
30%
Less than$10,000
$10,000 -$29,999
$30,000 -$49,999
$50,000 -$74,999
$75,000 -$99,999
$100,000 -$149,999
$150,000 ormore
Chaffee County Housing Needs Assessment Final Report
January 25, 2007
31
MIGRATION
The U.S. Internal Revenue Service tracks address changes on tax returns from year to year. This information can be used to gauge migration flows and interactions between counties. Chaffee County has the most interaction with El Paso and Freemont Counties. Movement to and from El Paso County accounts for 6 to 8 percent of total migration in and out of Chaffee County. There appears to be a small amount of net in-migration from El Paso County to Chaffee County, and some net out-migration from Chaffee County to Freemont County. Most of these household movements are likely to be related to employment opportunities in the State correctional facilities in these communities. There is also interaction between Chaffee County and the Front Range counties of Denver, Jefferson, and Arapahoe, although these movements are small and do not amount to a large amount of net migration in or out of Chaffee County. Since this information is based on address changes, it would not reflect second homeowners entering the market, although it would capture some movement of retirees and location-independent workers.
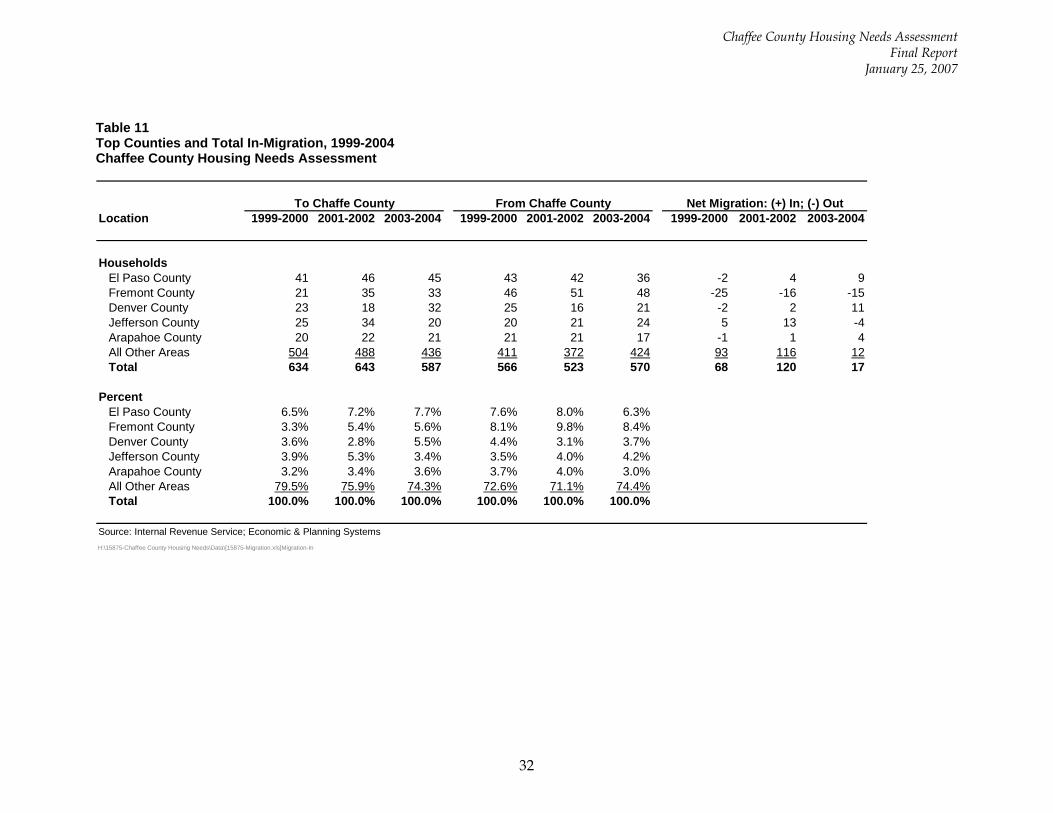
Chaffee County Housing Needs Assessment Final Report
January 25, 2007
32
Table 11 Top Counties and Total In-Migration, 1999-2004 Chaffee County Housing Needs Assessment
Location 1999-2000 2001-2002 2003-2004 1999-2000 2001-2002 2003-2004 1999-2000 2001-2002 2003-2004
HouseholdsEl Paso County 41 46 45 43 42 36 -2 4 9Fremont County 21 35 33 46 51 48 -25 -16 -15Denver County 23 18 32 25 16 21 -2 2 11Jefferson County 25 34 20 20 21 24 5 13 -4Arapahoe County 20 22 21 21 21 17 -1 1 4All Other Areas 504 488 436 411 372 424 93 116 12Total 634 643 587 566 523 570 68 120 17
PercentEl Paso County 6.5% 7.2% 7.7% 7.6% 8.0% 6.3%Fremont County 3.3% 5.4% 5.6% 8.1% 9.8% 8.4%Denver County 3.6% 2.8% 5.5% 4.4% 3.1% 3.7%Jefferson County 3.9% 5.3% 3.4% 3.5% 4.0% 4.2%Arapahoe County 3.2% 3.4% 3.6% 3.7% 4.0% 3.0%All Other Areas 79.5% 75.9% 74.3% 72.6% 71.1% 74.4%Total 100.0% 100.0% 100.0% 100.0% 100.0% 100.0%
Source: Internal Revenue Service; Economic & Planning SystemsH:\15875-Chaffee County Housing Needs\Data\[15875-Migration.xls]Migration-In
Net Migration: (+) In; (-) OutTo Chaffe County From Chaffe County
Chaffee County Housing Needs Assessment Final Report
January 25, 2007
33
EMPLOYMENT AND WAGES
EMPLOYMENT TRENDS
Employment data presented throughout this report comes primarily from two sources: the U.S. Bureau of Economic Analysis (BEA) and the U.S. Bureau of Labor Statistics (BLS). Total Employment reported by BEA includes wage and salary employment covered by FICA (unemployment insurance) and estimates of sole proprietors and other jobs not covered under FICA. Total employment estimates from BEA typically lag two years behind the current year. The second type of data, Wage and Salary Employment reported by BLS is more current, although it is not adjusted to include sole proprietor jobs and other jobs not covered by unemployment insurance. It is therefore typically 20 to 25 percent less than BEA estimates. The advantage of BLS data is that it is more current, lagging approximately three to four quarters, which allows one to evaluate more recent growth trends. It should be noted that neither source adjusts for multiple jobholders; for example, a person who holds two part time jobs would be counted twice. It is important to be aware of the distinctions between these two data sources to avoid confusion in the analysis that follows. There are currently approximately 9,900 jobs in Chaffee County, based on the most recent BEA estimates shown in Table 12. From 1990 to 2000, job growth was strong at 4.3 to 4.7 percent per year. Approximately 3,400 jobs were added to the economy over this time period, or about 340 jobs per year. From 2001 to 2005, growth was slower reflecting a national recession that began in 2001. There were some small job losses, but an overall net gain of about 380 to 400 jobs for the five-year period from 2001 to 2005.
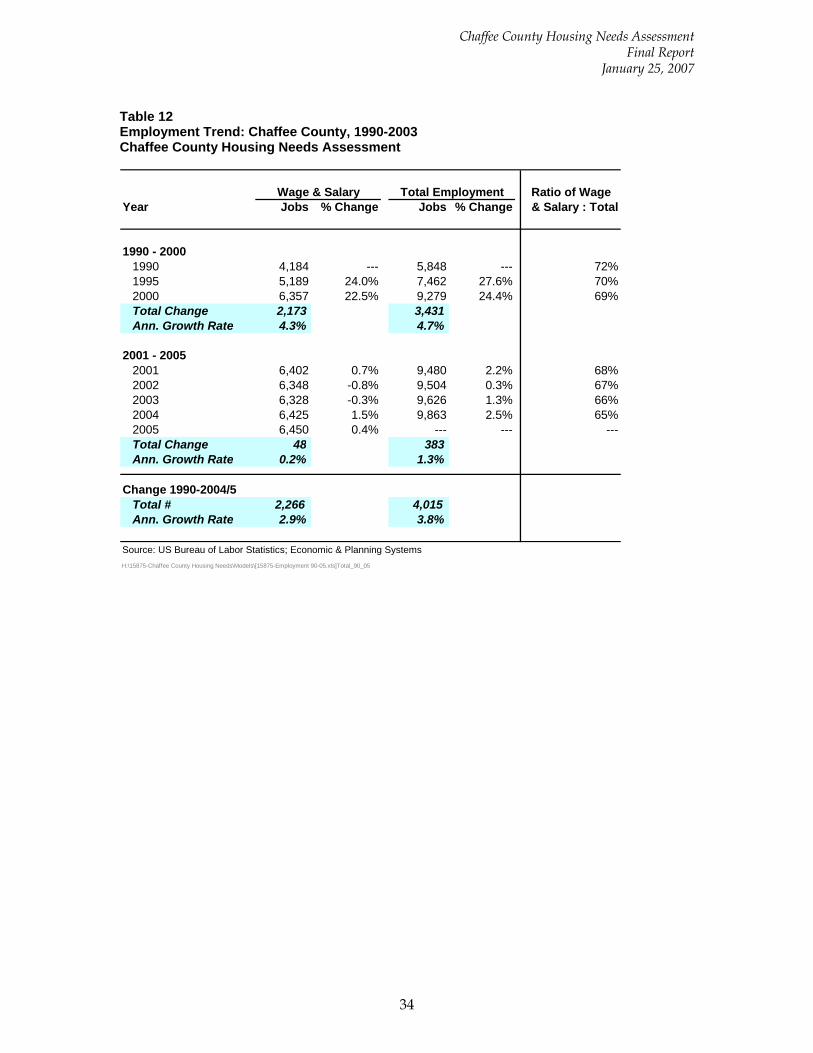
Chaffee County Housing Needs Assessment Final Report
January 25, 2007
34
Table 12 Employment Trend: Chaffee County, 1990-2003 Chaffee County Housing Needs Assessment
Ratio of WageYear Jobs % Change Jobs % Change & Salary : Total
1990 - 20001990 4,184 --- 5,848 --- 72%1995 5,189 24.0% 7,462 27.6% 70%2000 6,357 22.5% 9,279 24.4% 69%Total Change 2,173 3,431Ann. Growth Rate 4.3% 4.7%
2001 - 20052001 6,402 0.7% 9,480 2.2% 68%2002 6,348 -0.8% 9,504 0.3% 67%2003 6,328 -0.3% 9,626 1.3% 66%2004 6,425 1.5% 9,863 2.5% 65%2005 6,450 0.4% --- --- ---Total Change 48 383Ann. Growth Rate 0.2% 1.3%
Change 1990-2004/5Total # 2,266 4,015 Ann. Growth Rate 2.9% 3.8%
Source: US Bureau of Labor Statistics; Economic & Planning SystemsH:\15875-Chaffee County Housing Needs\Models\[15875-Employment 90-05.xls]Total_90_05
Wage & Salary Total Employment
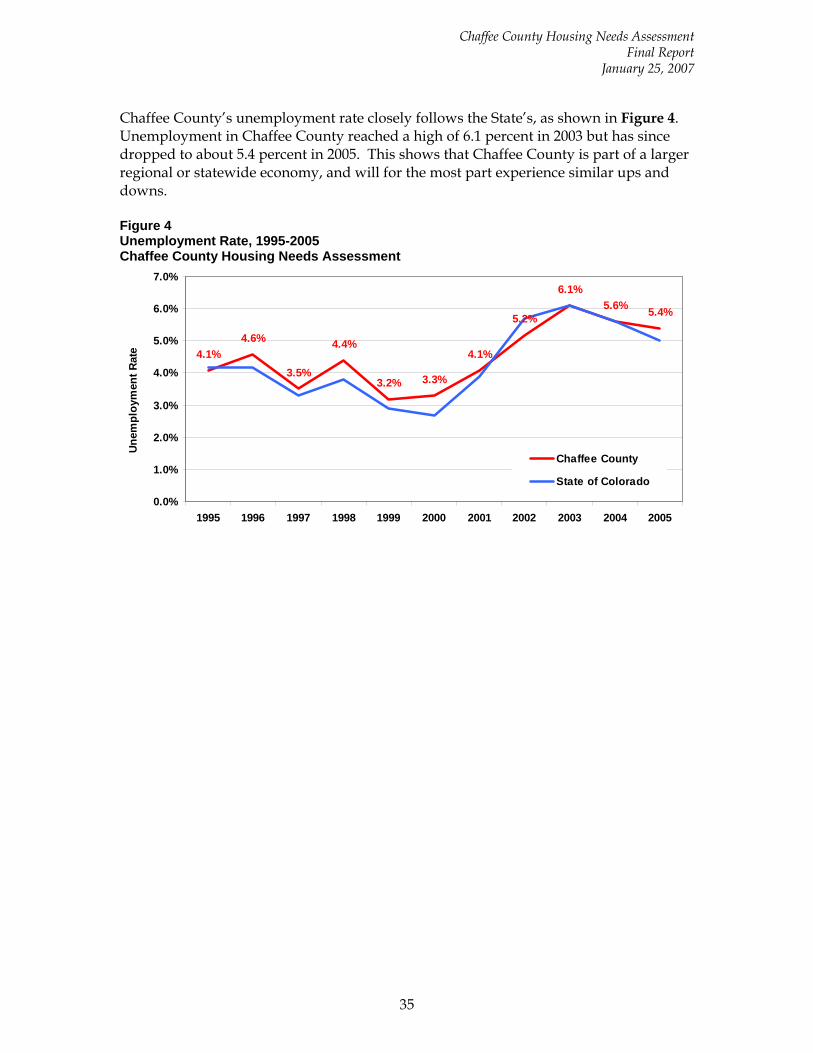
Chaffee County Housing Needs Assessment Final Report
January 25, 2007
35
Chaffee County’s unemployment rate closely follows the State’s, as shown in Figure 4. Unemployment in Chaffee County reached a high of 6.1 percent in 2003 but has since dropped to about 5.4 percent in 2005. This shows that Chaffee County is part of a larger regional or statewide economy, and will for the most part experience similar ups and downs. Figure 4 Unemployment Rate, 1995-2005 Chaffee County Housing Needs Assessment
4.1%4.6%
3.5%
4.4%
3.2% 3.3%
4.1%
5.2%
6.1%5.6% 5.4%
0.0%
1.0%
2.0%
3.0%
4.0%
5.0%
6.0%
7.0%
1995 1996 1997 1998 1999 2000 2001 2002 2003 2004 2005
Unem
ploy
men
t Rat
e
Chaffee County
State of Colorado
Chaffee County Housing Needs Assessment Final Report
January 25, 2007
36
ECONOMIC BASE
In Table 13, employment in each industry sector is shown from 1990 to 2005. Construction grew by 395 jobs from 1990 to 2000, and then dropped by 22 jobs from 2001 to 20051. Retail Trade also grew, adding 381 jobs from 1990 to 2000, and grew again by 91 jobs from 2001 to 2005. Real Estate and Rental and Leasing grew by almost 100 jobs from 1990 to 2000, and declined slightly after 2001. There was also significant growth in Arts, Entertainment, and Recreation, and Accommodations and Food Services from 1990 to 2000, however Accommodations and Food Services declined slightly after 2001. There was some slow but steady growth in professional and business-to-business services such as Finance and Insurance, and Information. Professional and Technical Services increased from 69 to 225 jobs from 1990 to 2005, and accelerated from 2000 to 2005. From a local perspective, the growth is beneficial as this industry group includes many high paying professional occupations such as engineers, architects, and other business services. Weaker sectors in Chaffee County include Manufacturing and Wholesale Trade. Manufacturing declined from 2001 to 2005 after seeing growth of only 58 jobs from 1990 to 2000. Wholesale Trade was essentially flat from 1990 to 2005, starting at 141 jobs in 1990 and ending at 164 jobs in 2005.
1 Before 2001, employment was reported under the Standard Industrial Classification System (SIC). After 2001, classifications changed to the North American Industrial Classification System (NAICS). This data series has been reconstructed by the BLS to bridge the SIC and NAICS categories. Trends are discussed prior to 2001 and after 2001 for continuity across categories.
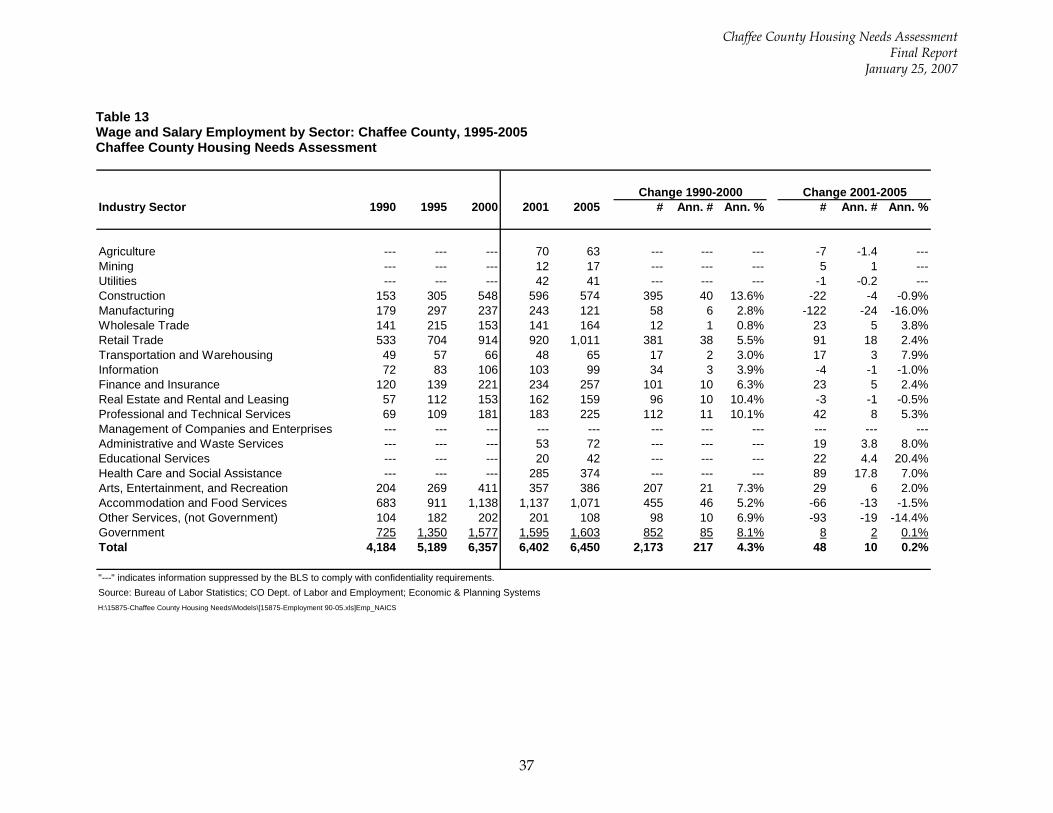
Chaffee County Housing Needs Assessment Final Report
January 25, 2007
37
Table 13 Wage and Salary Employment by Sector: Chaffee County, 1995-2005 Chaffee County Housing Needs Assessment
Industry Sector 1990 1995 2000 2001 2005 # Ann. # Ann. % # Ann. # Ann. %
Agriculture --- --- --- 70 63 --- --- --- -7 -1.4 ---Mining --- --- --- 12 17 --- --- --- 5 1 ---Utilities --- --- --- 42 41 --- --- --- -1 -0.2 ---Construction 153 305 548 596 574 395 40 13.6% -22 -4 -0.9%Manufacturing 179 297 237 243 121 58 6 2.8% -122 -24 -16.0%Wholesale Trade 141 215 153 141 164 12 1 0.8% 23 5 3.8%Retail Trade 533 704 914 920 1,011 381 38 5.5% 91 18 2.4%Transportation and Warehousing 49 57 66 48 65 17 2 3.0% 17 3 7.9%Information 72 83 106 103 99 34 3 3.9% -4 -1 -1.0%Finance and Insurance 120 139 221 234 257 101 10 6.3% 23 5 2.4%Real Estate and Rental and Leasing 57 112 153 162 159 96 10 10.4% -3 -1 -0.5%Professional and Technical Services 69 109 181 183 225 112 11 10.1% 42 8 5.3%Management of Companies and Enterprises --- --- --- --- --- --- --- --- --- --- ---Administrative and Waste Services --- --- --- 53 72 --- --- --- 19 3.8 8.0%Educational Services --- --- --- 20 42 --- --- --- 22 4.4 20.4%Health Care and Social Assistance --- --- --- 285 374 --- --- --- 89 17.8 7.0%Arts, Entertainment, and Recreation 204 269 411 357 386 207 21 7.3% 29 6 2.0%Accommodation and Food Services 683 911 1,138 1,137 1,071 455 46 5.2% -66 -13 -1.5%Other Services, (not Government) 104 182 202 201 108 98 10 6.9% -93 -19 -14.4%Government 725 1,350 1,577 1,595 1,603 852 85 8.1% 8 2 0.1%Total 4,184 5,189 6,357 6,402 6,450 2,173 217 4.3% 48 10 0.2%
"---" indicates information suppressed by the BLS to comply with confidentiality requirements.Source: Bureau of Labor Statistics; CO Dept. of Labor and Employment; Economic & Planning SystemsH:\15875-Chaffee County Housing Needs\Models\[15875-Employment 90-05.xls]Emp_NAICS
Change 1990-2000 Change 2001-2005
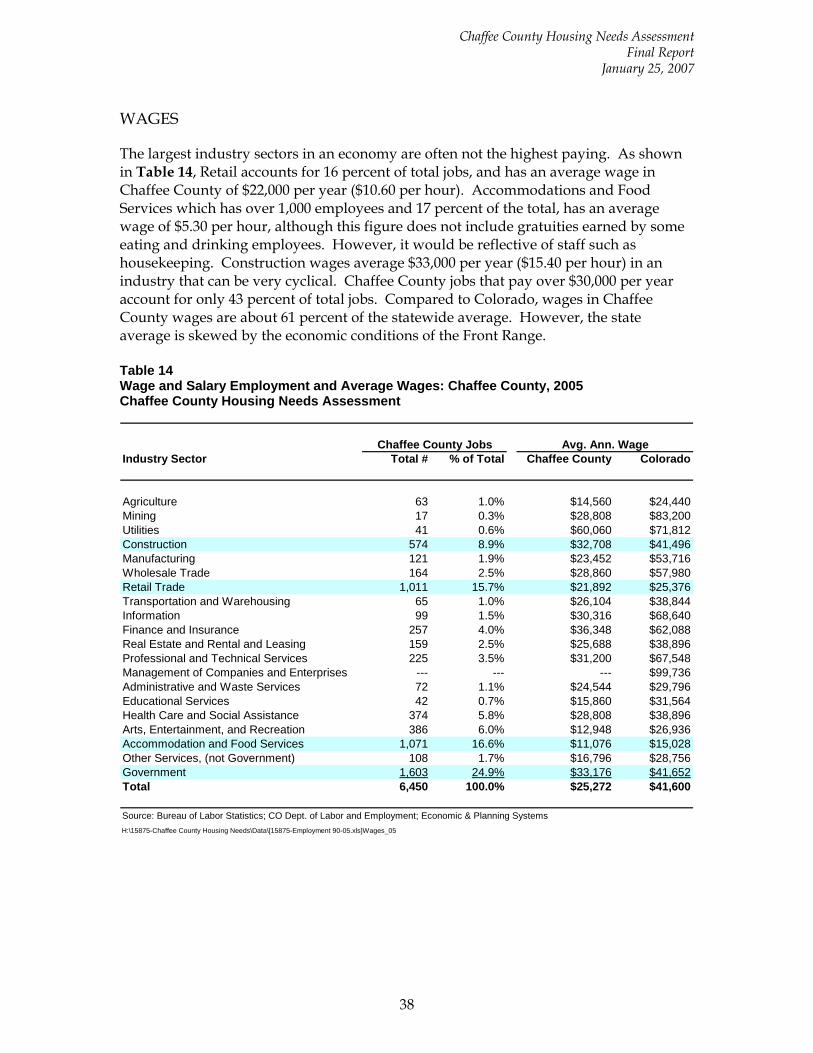
Chaffee County Housing Needs Assessment Final Report
January 25, 2007
38
WAGES
The largest industry sectors in an economy are often not the highest paying. As shown in Table 14, Retail accounts for 16 percent of total jobs, and has an average wage in Chaffee County of $22,000 per year ($10.60 per hour). Accommodations and Food Services which has over 1,000 employees and 17 percent of the total, has an average wage of $5.30 per hour, although this figure does not include gratuities earned by some eating and drinking employees. However, it would be reflective of staff such as housekeeping. Construction wages average $33,000 per year ($15.40 per hour) in an industry that can be very cyclical. Chaffee County jobs that pay over $30,000 per year account for only 43 percent of total jobs. Compared to Colorado, wages in Chaffee County wages are about 61 percent of the statewide average. However, the state average is skewed by the economic conditions of the Front Range. Table 14 Wage and Salary Employment and Average Wages: Chaffee County, 2005 Chaffee County Housing Needs Assessment
Industry Sector Total # % of Total Chaffee County Colorado
Agriculture 63 1.0% $14,560 $24,440Mining 17 0.3% $28,808 $83,200Utilities 41 0.6% $60,060 $71,812Construction 574 8.9% $32,708 $41,496Manufacturing 121 1.9% $23,452 $53,716Wholesale Trade 164 2.5% $28,860 $57,980Retail Trade 1,011 15.7% $21,892 $25,376Transportation and Warehousing 65 1.0% $26,104 $38,844Information 99 1.5% $30,316 $68,640Finance and Insurance 257 4.0% $36,348 $62,088Real Estate and Rental and Leasing 159 2.5% $25,688 $38,896Professional and Technical Services 225 3.5% $31,200 $67,548Management of Companies and Enterprises --- --- --- $99,736Administrative and Waste Services 72 1.1% $24,544 $29,796Educational Services 42 0.7% $15,860 $31,564Health Care and Social Assistance 374 5.8% $28,808 $38,896Arts, Entertainment, and Recreation 386 6.0% $12,948 $26,936Accommodation and Food Services 1,071 16.6% $11,076 $15,028Other Services, (not Government) 108 1.7% $16,796 $28,756Government 1,603 24.9% $33,176 $41,652Total 6,450 100.0% $25,272 $41,600
Source: Bureau of Labor Statistics; CO Dept. of Labor and Employment; Economic & Planning SystemsH:\15875-Chaffee County Housing Needs\Data\[15875-Employment 90-05.xls]Wages_05
Avg. Ann. WageChaffee County Jobs
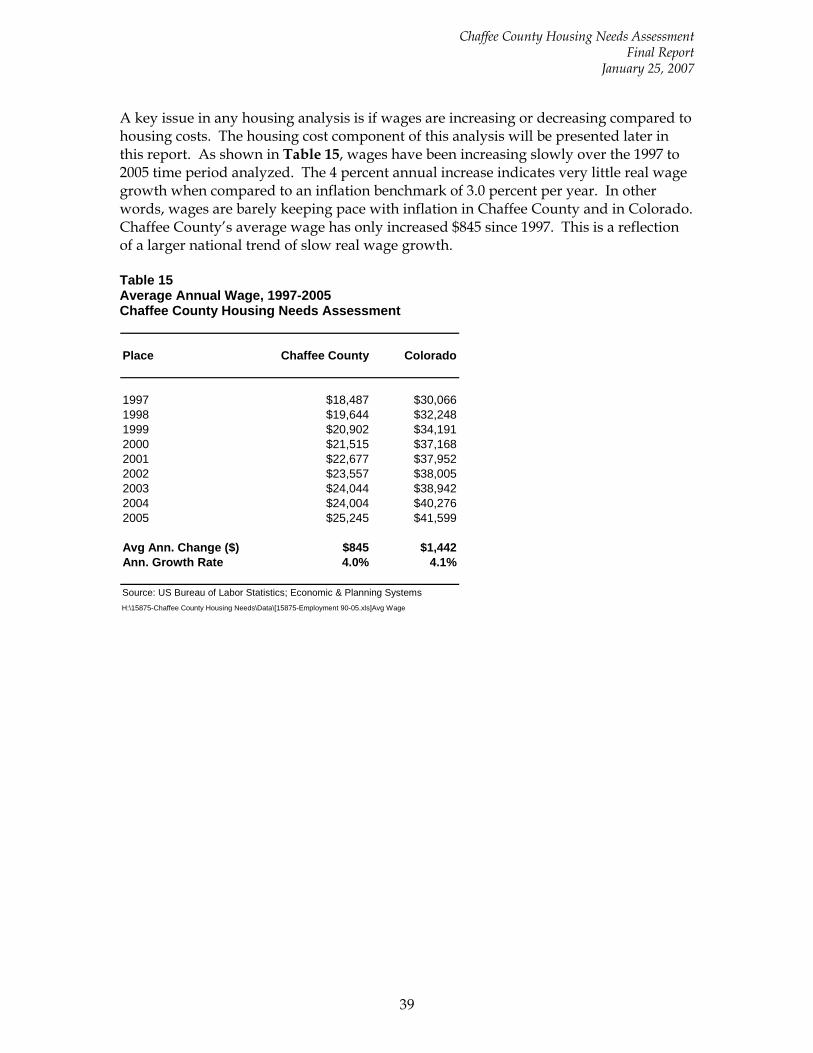
Chaffee County Housing Needs Assessment Final Report
January 25, 2007
39
A key issue in any housing analysis is if wages are increasing or decreasing compared to housing costs. The housing cost component of this analysis will be presented later in this report. As shown in Table 15, wages have been increasing slowly over the 1997 to 2005 time period analyzed. The 4 percent annual increase indicates very little real wage growth when compared to an inflation benchmark of 3.0 percent per year. In other words, wages are barely keeping pace with inflation in Chaffee County and in Colorado. Chaffee County’s average wage has only increased $845 since 1997. This is a reflection of a larger national trend of slow real wage growth. Table 15 Average Annual Wage, 1997-2005 Chaffee County Housing Needs Assessment
Place Chaffee County Colorado
1997 $18,487 $30,0661998 $19,644 $32,2481999 $20,902 $34,1912000 $21,515 $37,1682001 $22,677 $37,9522002 $23,557 $38,0052003 $24,044 $38,9422004 $24,004 $40,2762005 $25,245 $41,599
Avg Ann. Change ($) $845 $1,442Ann. Growth Rate 4.0% 4.1%
Source: US Bureau of Labor Statistics; Economic & Planning SystemsH:\15875-Chaffee County Housing Needs\Data\[15875-Employment 90-05.xls]Avg Wage
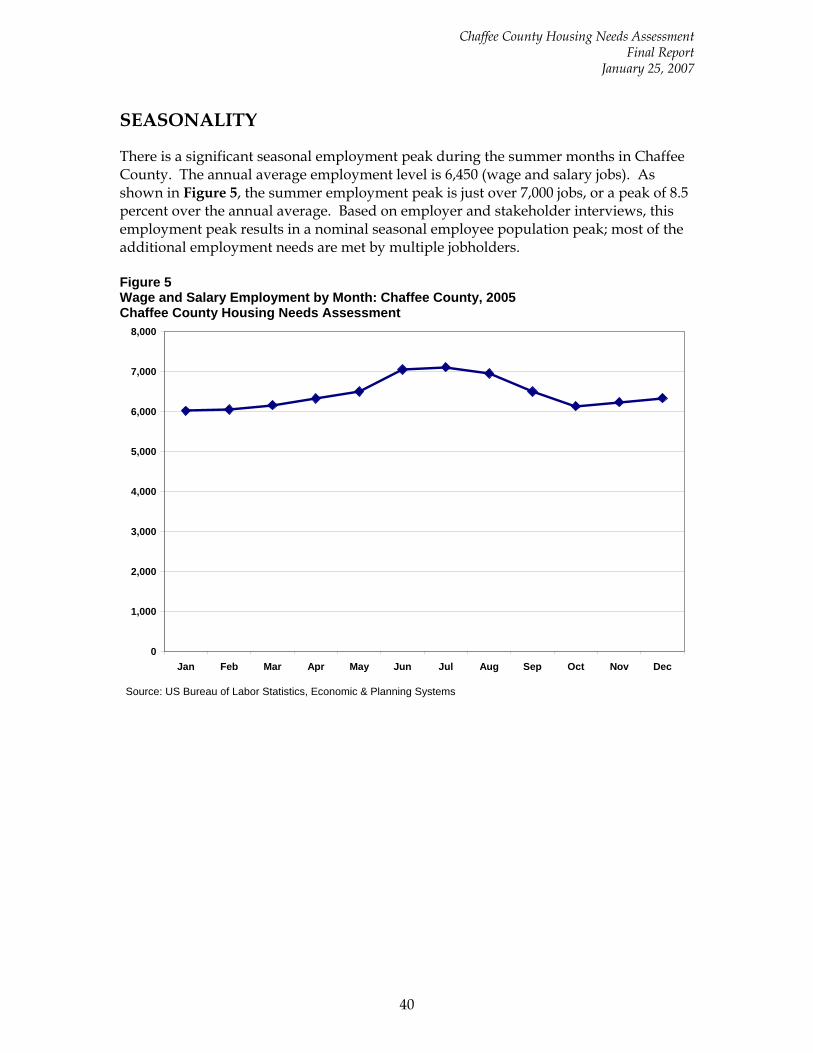
Chaffee County Housing Needs Assessment Final Report
January 25, 2007
40
SEASONALITY
There is a significant seasonal employment peak during the summer months in Chaffee County. The annual average employment level is 6,450 (wage and salary jobs). As shown in Figure 5, the summer employment peak is just over 7,000 jobs, or a peak of 8.5 percent over the annual average. Based on employer and stakeholder interviews, this employment peak results in a nominal seasonal employee population peak; most of the additional employment needs are met by multiple jobholders. Figure 5 Wage and Salary Employment by Month: Chaffee County, 2005 Chaffee County Housing Needs Assessment
0
1,000
2,000
3,000
4,000
5,000
6,000
7,000
8,000
Jan Feb Mar Apr May Jun Jul Aug Sep Oct Nov Dec
Source: US Bureau of Labor Statistics, Economic & Planning Systems
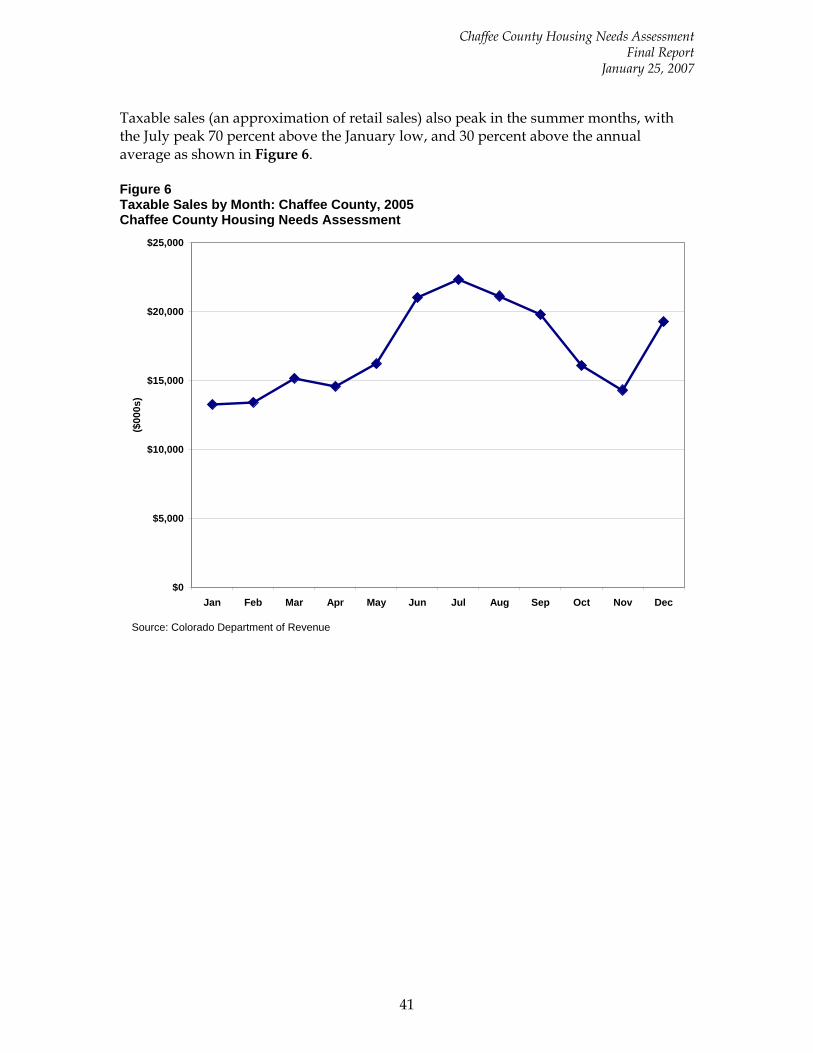
Chaffee County Housing Needs Assessment Final Report
January 25, 2007
41
Taxable sales (an approximation of retail sales) also peak in the summer months, with the July peak 70 percent above the January low, and 30 percent above the annual average as shown in Figure 6. Figure 6 Taxable Sales by Month: Chaffee County, 2005 Chaffee County Housing Needs Assessment
$0
$5,000
$10,000
$15,000
$20,000
$25,000
Jan Feb Mar Apr May Jun Jul Aug Sep Oct Nov Dec
($00
0s)
Source: Colorado Department of Revenue
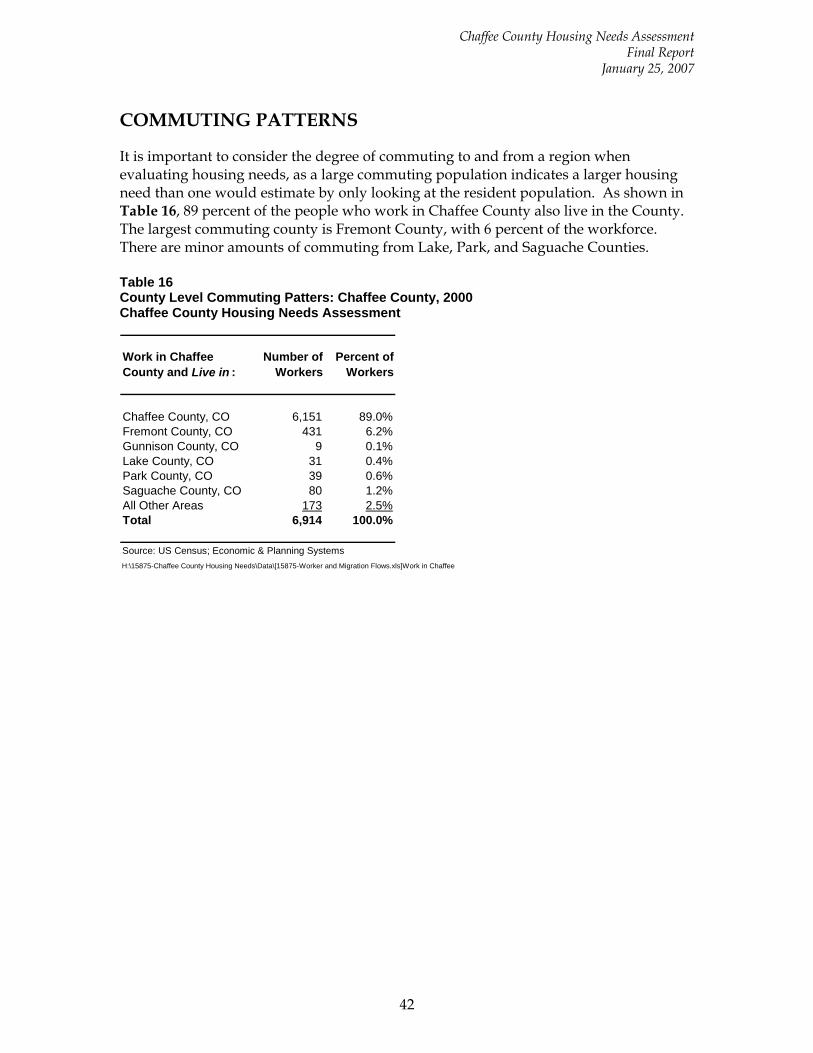
Chaffee County Housing Needs Assessment Final Report
January 25, 2007
42
COMMUTING PATTERNS
It is important to consider the degree of commuting to and from a region when evaluating housing needs, as a large commuting population indicates a larger housing need than one would estimate by only looking at the resident population. As shown in Table 16, 89 percent of the people who work in Chaffee County also live in the County. The largest commuting county is Fremont County, with 6 percent of the workforce. There are minor amounts of commuting from Lake, Park, and Saguache Counties. Table 16 County Level Commuting Patters: Chaffee County, 2000 Chaffee County Housing Needs Assessment
Work in Chaffee County and Live in :
Number of Workers
Percent of Workers
Chaffee County, CO 6,151 89.0%Fremont County, CO 431 6.2%Gunnison County, CO 9 0.1%Lake County, CO 31 0.4%Park County, CO 39 0.6%Saguache County, CO 80 1.2%All Other Areas 173 2.5%Total 6,914 100.0%
Source: US Census; Economic & Planning SystemsH:\15875-Chaffee County Housing Needs\Data\[15875-Worker and Migration Flows.xls]Work in Chaffee
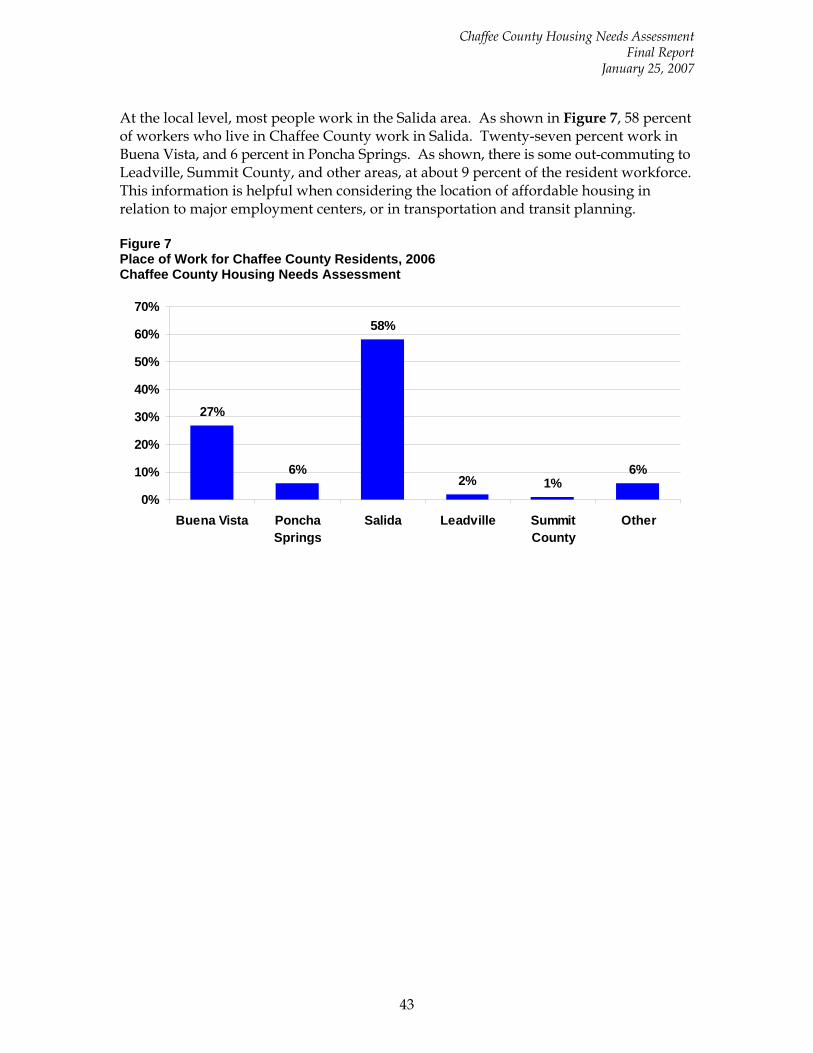
Chaffee County Housing Needs Assessment Final Report
January 25, 2007
43
At the local level, most people work in the Salida area. As shown in Figure 7, 58 percent of workers who live in Chaffee County work in Salida. Twenty-seven percent work in Buena Vista, and 6 percent in Poncha Springs. As shown, there is some out-commuting to Leadville, Summit County, and other areas, at about 9 percent of the resident workforce. This information is helpful when considering the location of affordable housing in relation to major employment centers, or in transportation and transit planning. Figure 7 Place of Work for Chaffee County Residents, 2006 Chaffee County Housing Needs Assessment
27%
6%
58%
2% 1%6%
0%
10%
20%
30%
40%
50%
60%
70%
Buena Vista PonchaSprings
Salida Leadville SummitCounty
Other
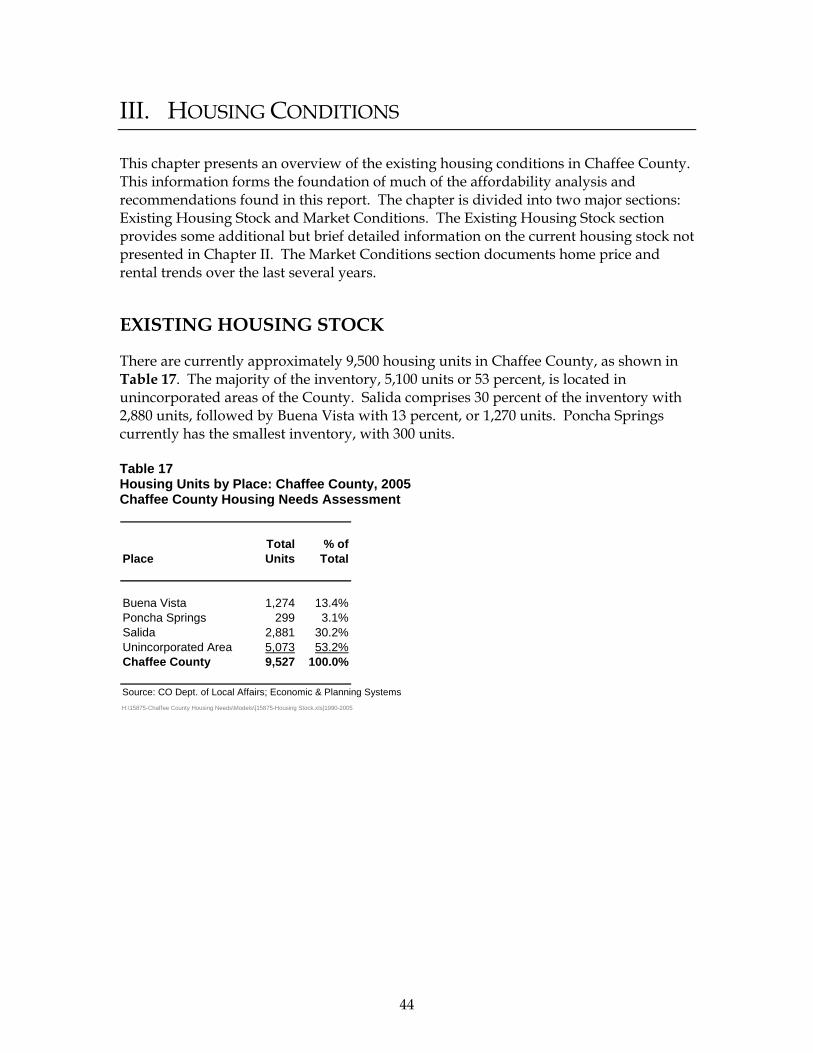
44
III. HOUSING CONDITIONS
This chapter presents an overview of the existing housing conditions in Chaffee County. This information forms the foundation of much of the affordability analysis and recommendations found in this report. The chapter is divided into two major sections: Existing Housing Stock and Market Conditions. The Existing Housing Stock section provides some additional but brief detailed information on the current housing stock not presented in Chapter II. The Market Conditions section documents home price and rental trends over the last several years.
EXISTING HOUSING STOCK
There are currently approximately 9,500 housing units in Chaffee County, as shown in Table 17. The majority of the inventory, 5,100 units or 53 percent, is located in unincorporated areas of the County. Salida comprises 30 percent of the inventory with 2,880 units, followed by Buena Vista with 13 percent, or 1,270 units. Poncha Springs currently has the smallest inventory, with 300 units. Table 17 Housing Units by Place: Chaffee County, 2005 Chaffee County Housing Needs Assessment
Total % ofPlace Units Total
Buena Vista 1,274 13.4%Poncha Springs 299 3.1%Salida 2,881 30.2%Unincorporated Area 5,073 53.2%Chaffee County 9,527 100.0%
Source: CO Dept. of Local Affairs; Economic & Planning SystemsH:\15875-Chaffee County Housing Needs\Models\[15875-Housing Stock.xls]1990-2005
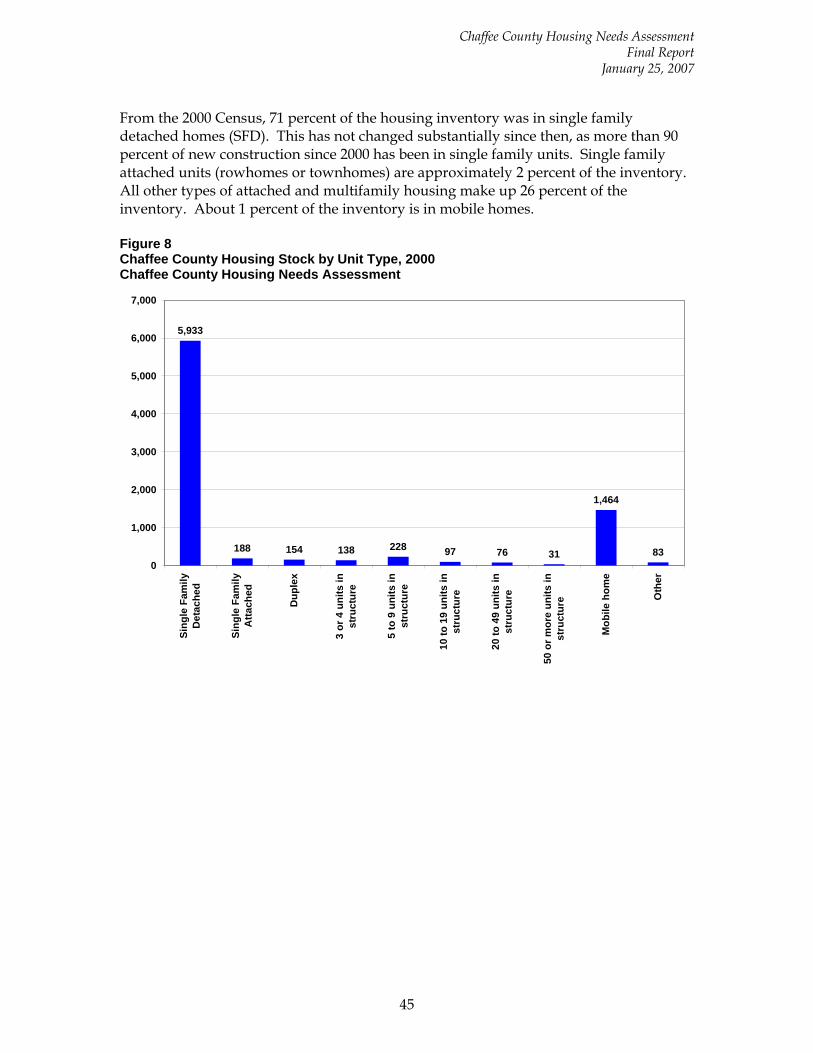
Chaffee County Housing Needs Assessment Final Report
January 25, 2007
45
From the 2000 Census, 71 percent of the housing inventory was in single family detached homes (SFD). This has not changed substantially since then, as more than 90 percent of new construction since 2000 has been in single family units. Single family attached units (rowhomes or townhomes) are approximately 2 percent of the inventory. All other types of attached and multifamily housing make up 26 percent of the inventory. About 1 percent of the inventory is in mobile homes. Figure 8 Chaffee County Housing Stock by Unit Type, 2000 Chaffee County Housing Needs Assessment
5,933
188 154 138 228 97 76 31
1,464
830
1,000
2,000
3,000
4,000
5,000
6,000
7,000
Sing
le F
amily
Det
ache
d
Sing
le F
amily
Atta
ched
Dup
lex
3 or
4 u
nits
inst
ruct
ure
5 to
9 u
nits
inst
ruct
ure
10 to
19
units
inst
ruct
ure
20 to
49
units
inst
ruct
ure
50 o
r mor
e un
its in
stru
ctur
e
Mob
ile h
ome
Oth
er
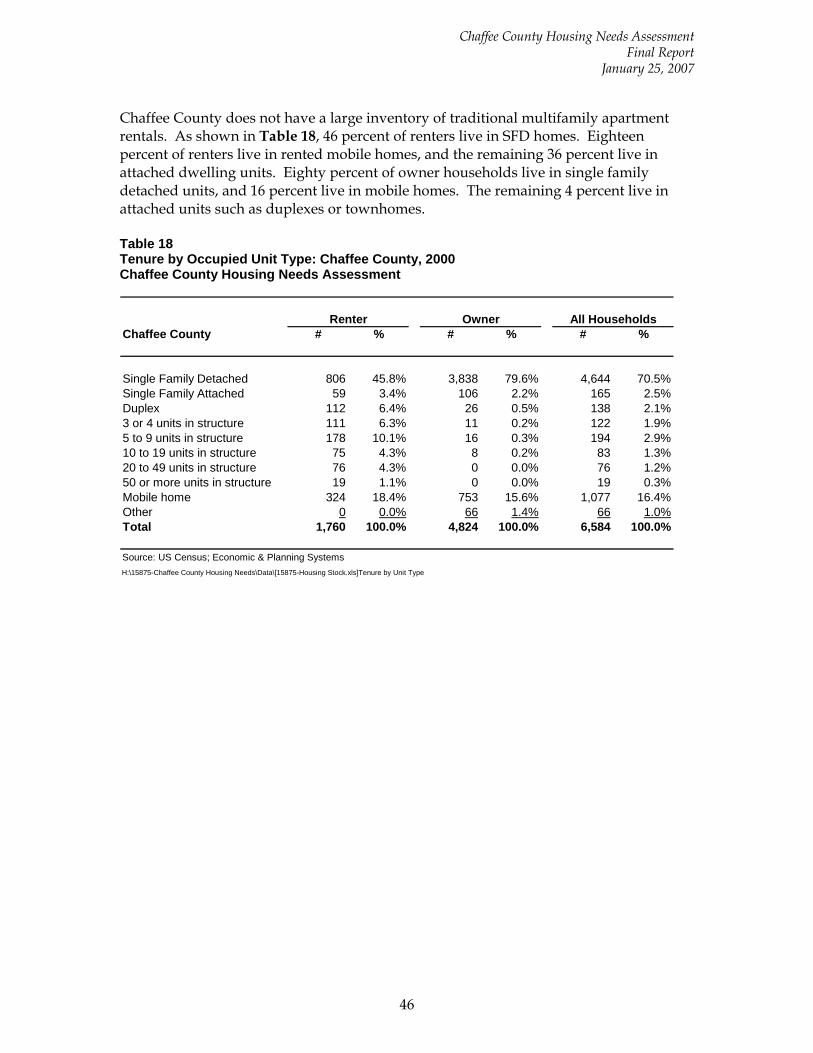
Chaffee County Housing Needs Assessment Final Report
January 25, 2007
46
Chaffee County does not have a large inventory of traditional multifamily apartment rentals. As shown in Table 18, 46 percent of renters live in SFD homes. Eighteen percent of renters live in rented mobile homes, and the remaining 36 percent live in attached dwelling units. Eighty percent of owner households live in single family detached units, and 16 percent live in mobile homes. The remaining 4 percent live in attached units such as duplexes or townhomes. Table 18 Tenure by Occupied Unit Type: Chaffee County, 2000 Chaffee County Housing Needs Assessment
Chaffee County # % # % # %
Single Family Detached 806 45.8% 3,838 79.6% 4,644 70.5%Single Family Attached 59 3.4% 106 2.2% 165 2.5%Duplex 112 6.4% 26 0.5% 138 2.1%3 or 4 units in structure 111 6.3% 11 0.2% 122 1.9%5 to 9 units in structure 178 10.1% 16 0.3% 194 2.9%10 to 19 units in structure 75 4.3% 8 0.2% 83 1.3%20 to 49 units in structure 76 4.3% 0 0.0% 76 1.2%50 or more units in structure 19 1.1% 0 0.0% 19 0.3%Mobile home 324 18.4% 753 15.6% 1,077 16.4%Other 0 0.0% 66 1.4% 66 1.0%Total 1,760 100.0% 4,824 100.0% 6,584 100.0%
Source: US Census; Economic & Planning SystemsH:\15875-Chaffee County Housing Needs\Data\[15875-Housing Stock.xls]Tenure by Unit Type
Renter Owner All Households
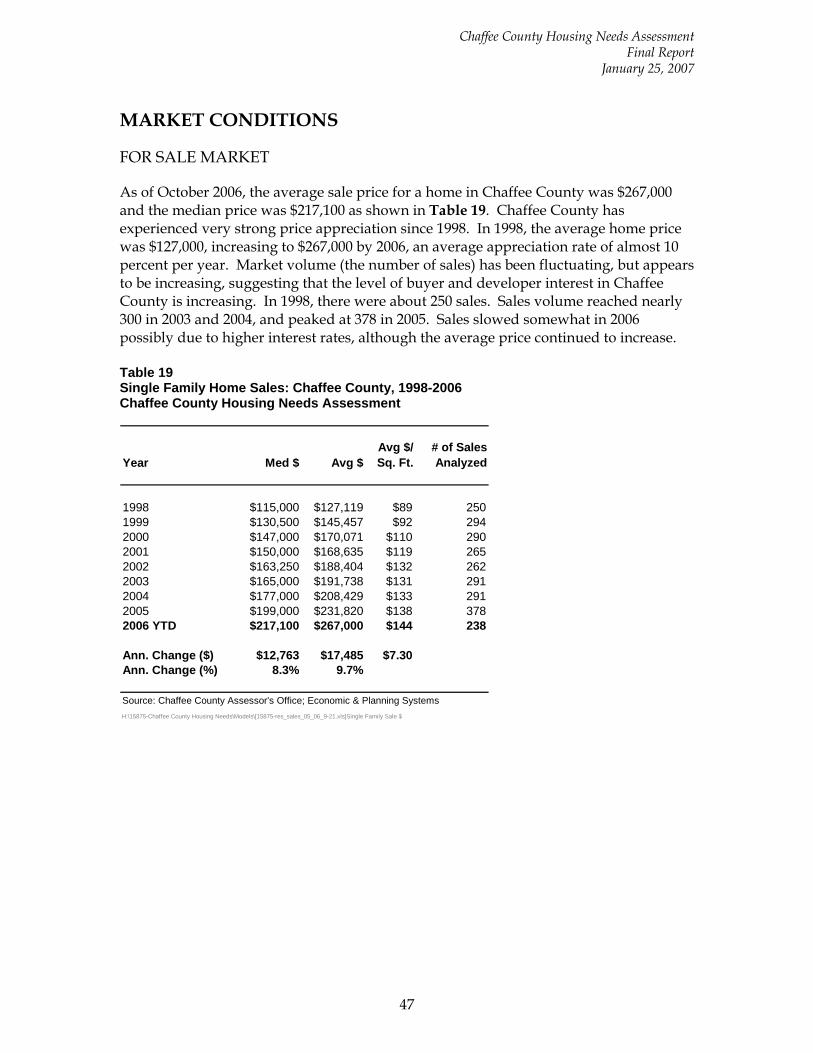
Chaffee County Housing Needs Assessment Final Report
January 25, 2007
47
MARKET CONDITIONS
FOR SALE MARKET
As of October 2006, the average sale price for a home in Chaffee County was $267,000 and the median price was $217,100 as shown in Table 19. Chaffee County has experienced very strong price appreciation since 1998. In 1998, the average home price was $127,000, increasing to $267,000 by 2006, an average appreciation rate of almost 10 percent per year. Market volume (the number of sales) has been fluctuating, but appears to be increasing, suggesting that the level of buyer and developer interest in Chaffee County is increasing. In 1998, there were about 250 sales. Sales volume reached nearly 300 in 2003 and 2004, and peaked at 378 in 2005. Sales slowed somewhat in 2006 possibly due to higher interest rates, although the average price continued to increase. Table 19 Single Family Home Sales: Chaffee County, 1998-2006 Chaffee County Housing Needs Assessment
Year Med $ Avg $Avg $/ Sq. Ft.
# of Sales Analyzed
1998 $115,000 $127,119 $89 2501999 $130,500 $145,457 $92 2942000 $147,000 $170,071 $110 2902001 $150,000 $168,635 $119 2652002 $163,250 $188,404 $132 2622003 $165,000 $191,738 $131 2912004 $177,000 $208,429 $133 2912005 $199,000 $231,820 $138 3782006 YTD $217,100 $267,000 $144 238
Ann. Change ($) $12,763 $17,485 $7.30Ann. Change (%) 8.3% 9.7%
Source: Chaffee County Assessor's Office; Economic & Planning SystemsH:\15875-Chaffee County Housing Needs\Models\[15875-res_sales_05_06_9-21.xls]Single Family Sale $
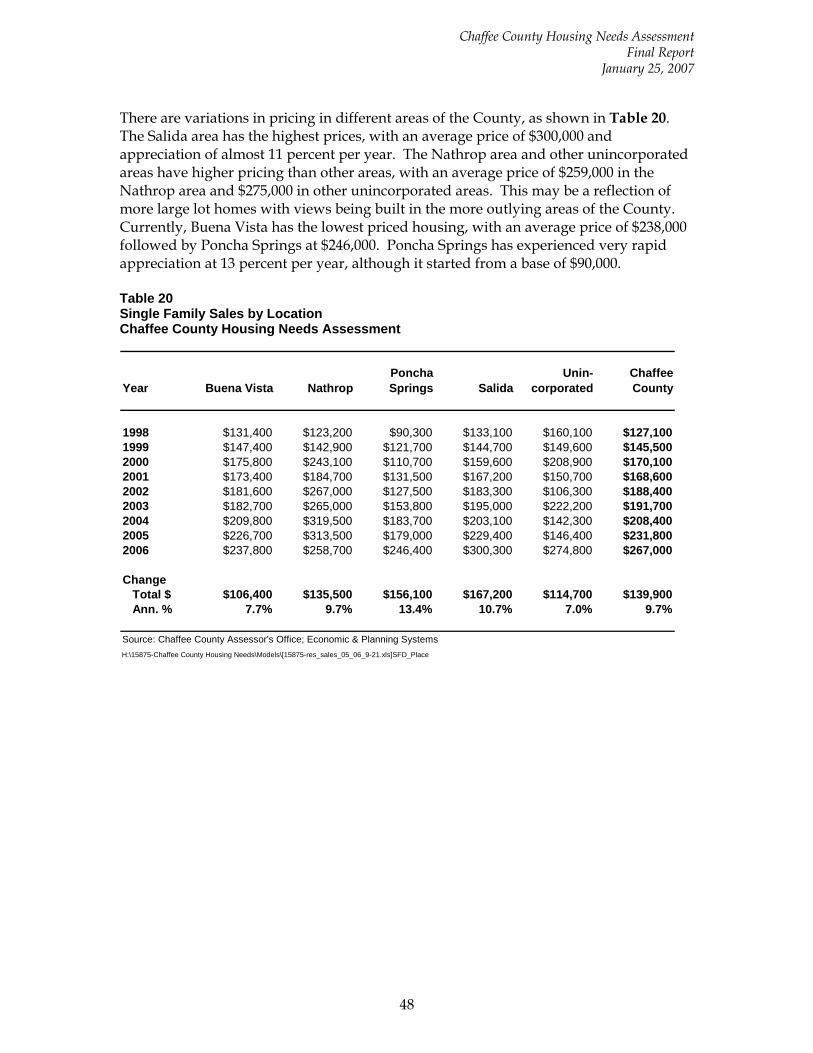
Chaffee County Housing Needs Assessment Final Report
January 25, 2007
48
There are variations in pricing in different areas of the County, as shown in Table 20. The Salida area has the highest prices, with an average price of $300,000 and appreciation of almost 11 percent per year. The Nathrop area and other unincorporated areas have higher pricing than other areas, with an average price of $259,000 in the Nathrop area and $275,000 in other unincorporated areas. This may be a reflection of more large lot homes with views being built in the more outlying areas of the County. Currently, Buena Vista has the lowest priced housing, with an average price of $238,000 followed by Poncha Springs at $246,000. Poncha Springs has experienced very rapid appreciation at 13 percent per year, although it started from a base of $90,000. Table 20 Single Family Sales by Location Chaffee County Housing Needs Assessment
Year Buena Vista NathropPoncha Springs Salida
Unin- corporated
Chaffee County
1998 $131,400 $123,200 $90,300 $133,100 $160,100 $127,1001999 $147,400 $142,900 $121,700 $144,700 $149,600 $145,5002000 $175,800 $243,100 $110,700 $159,600 $208,900 $170,1002001 $173,400 $184,700 $131,500 $167,200 $150,700 $168,6002002 $181,600 $267,000 $127,500 $183,300 $106,300 $188,4002003 $182,700 $265,000 $153,800 $195,000 $222,200 $191,7002004 $209,800 $319,500 $183,700 $203,100 $142,300 $208,4002005 $226,700 $313,500 $179,000 $229,400 $146,400 $231,8002006 $237,800 $258,700 $246,400 $300,300 $274,800 $267,000
ChangeTotal $ $106,400 $135,500 $156,100 $167,200 $114,700 $139,900Ann. % 7.7% 9.7% 13.4% 10.7% 7.0% 9.7%
Source: Chaffee County Assessor's Office; Economic & Planning SystemsH:\15875-Chaffee County Housing Needs\Models\[15875-res_sales_05_06_9-21.xls]SFD_Place
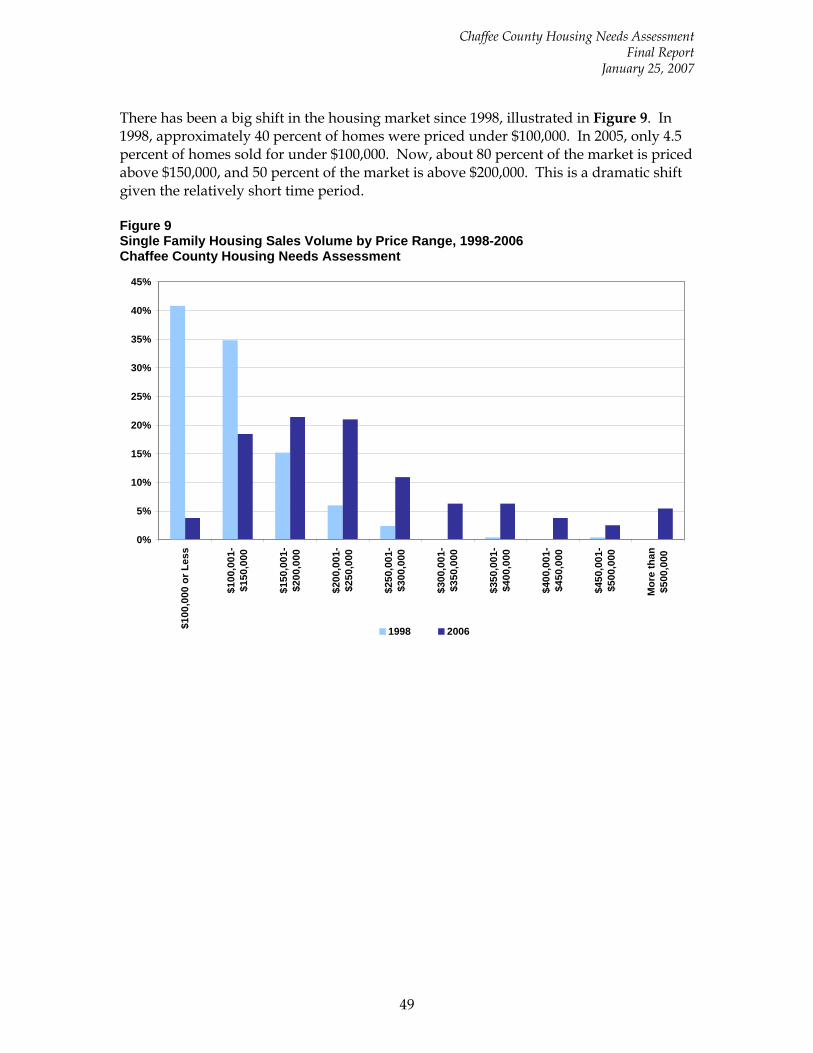
Chaffee County Housing Needs Assessment Final Report
January 25, 2007
49
There has been a big shift in the housing market since 1998, illustrated in Figure 9. In 1998, approximately 40 percent of homes were priced under $100,000. In 2005, only 4.5 percent of homes sold for under $100,000. Now, about 80 percent of the market is priced above $150,000, and 50 percent of the market is above $200,000. This is a dramatic shift given the relatively short time period. Figure 9 Single Family Housing Sales Volume by Price Range, 1998-2006 Chaffee County Housing Needs Assessment
0%
5%
10%
15%
20%
25%
30%
35%
40%
45%
$100
,000
or L
ess
$100
,001
-$1
50,0
00
$150
,001
-$2
00,0
00
$200
,001
-$2
50,0
00
$250
,001
-$3
00,0
00
$300
,001
-$3
50,0
00
$350
,001
-$4
00,0
00
$400
,001
-$4
50,0
00
$450
,001
-$5
00,0
00
Mor
e th
an$5
00,0
00
1998 2006
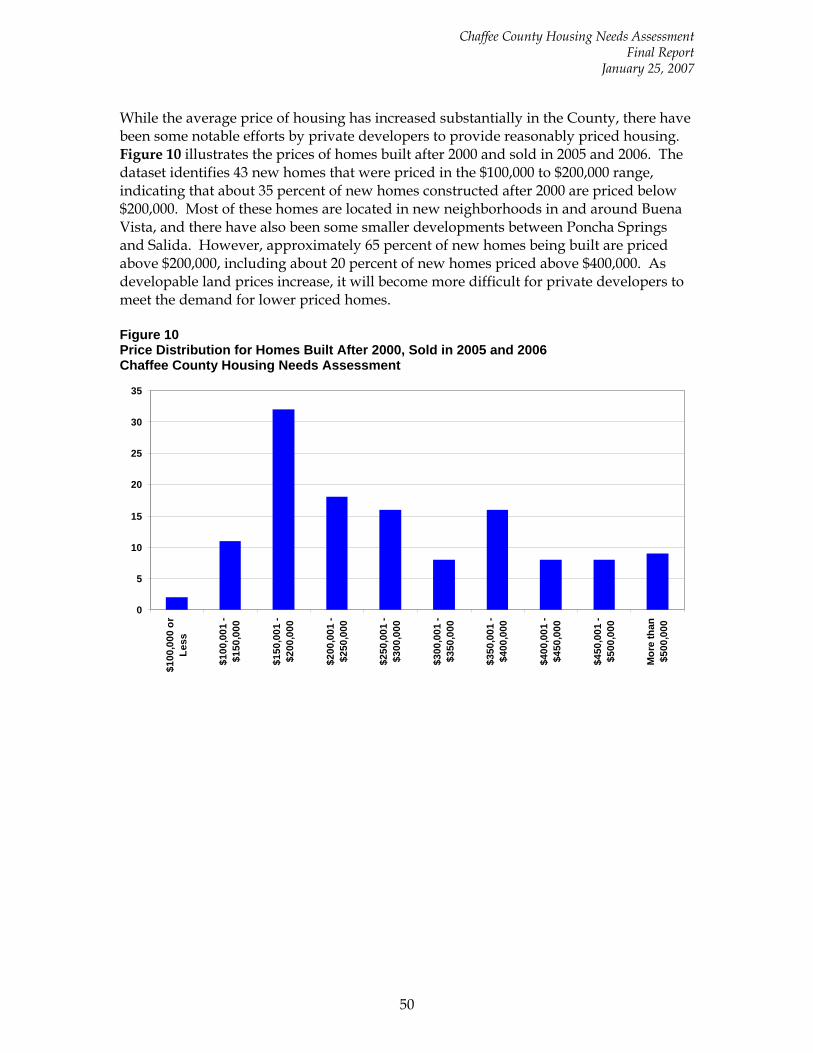
Chaffee County Housing Needs Assessment Final Report
January 25, 2007
50
While the average price of housing has increased substantially in the County, there have been some notable efforts by private developers to provide reasonably priced housing. Figure 10 illustrates the prices of homes built after 2000 and sold in 2005 and 2006. The dataset identifies 43 new homes that were priced in the $100,000 to $200,000 range, indicating that about 35 percent of new homes constructed after 2000 are priced below $200,000. Most of these homes are located in new neighborhoods in and around Buena Vista, and there have also been some smaller developments between Poncha Springs and Salida. However, approximately 65 percent of new homes being built are priced above $200,000, including about 20 percent of new homes priced above $400,000. As developable land prices increase, it will become more difficult for private developers to meet the demand for lower priced homes. Figure 10 Price Distribution for Homes Built After 2000, Sold in 2005 and 2006 Chaffee County Housing Needs Assessment
0
5
10
15
20
25
30
35
$100
,000
or
Less
$100
,001
-$1
50,0
00
$150
,001
-$2
00,0
00
$200
,001
-$2
50,0
00
$250
,001
-$3
00,0
00
$300
,001
-$3
50,0
00
$350
,001
-$4
00,0
00
$400
,001
-$4
50,0
00
$450
,001
-$5
00,0
00
Mor
e th
an$5
00,0
00
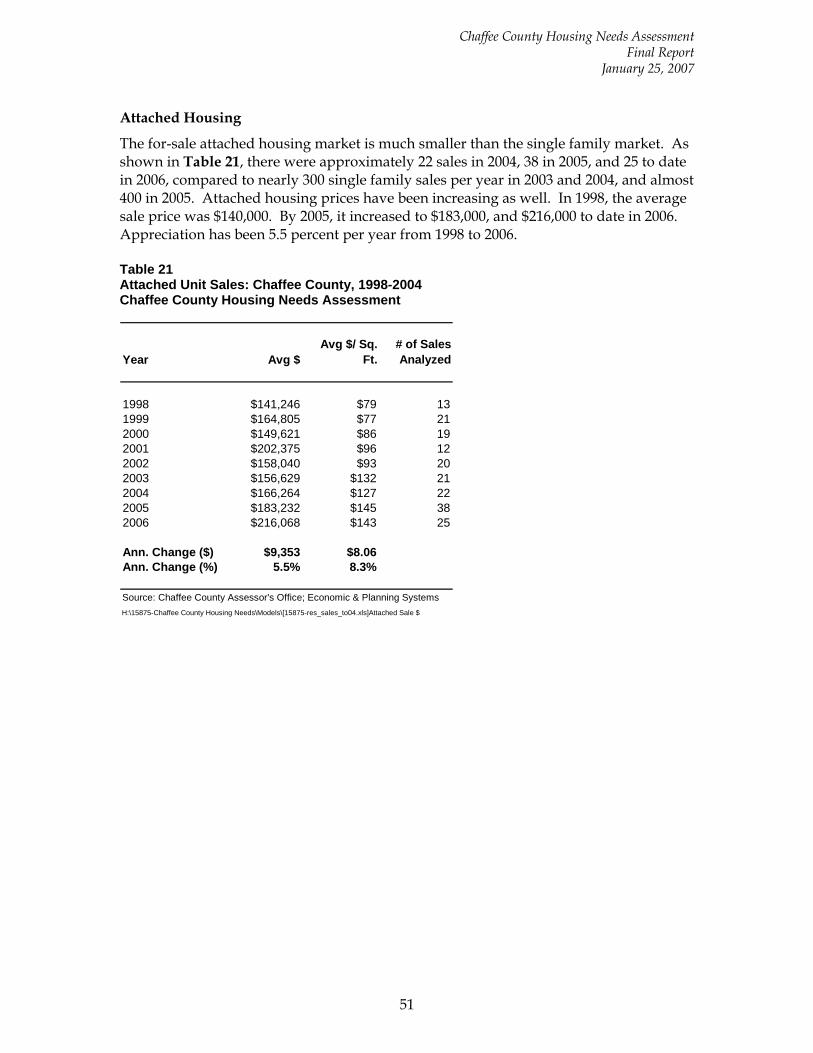
Chaffee County Housing Needs Assessment Final Report
January 25, 2007
51
Attached Housing
The for-sale attached housing market is much smaller than the single family market. As shown in Table 21, there were approximately 22 sales in 2004, 38 in 2005, and 25 to date in 2006, compared to nearly 300 single family sales per year in 2003 and 2004, and almost 400 in 2005. Attached housing prices have been increasing as well. In 1998, the average sale price was $140,000. By 2005, it increased to $183,000, and $216,000 to date in 2006. Appreciation has been 5.5 percent per year from 1998 to 2006. Table 21 Attached Unit Sales: Chaffee County, 1998-2004 Chaffee County Housing Needs Assessment
Year Avg $Avg $/ Sq.
Ft.# of Sales Analyzed
1998 $141,246 $79 131999 $164,805 $77 212000 $149,621 $86 192001 $202,375 $96 122002 $158,040 $93 202003 $156,629 $132 212004 $166,264 $127 222005 $183,232 $145 382006 $216,068 $143 25
Ann. Change ($) $9,353 $8.06Ann. Change (%) 5.5% 8.3%
Source: Chaffee County Assessor's Office; Economic & Planning SystemsH:\15875-Chaffee County Housing Needs\Models\[15875-res_sales_to04.xls]Attached Sale $
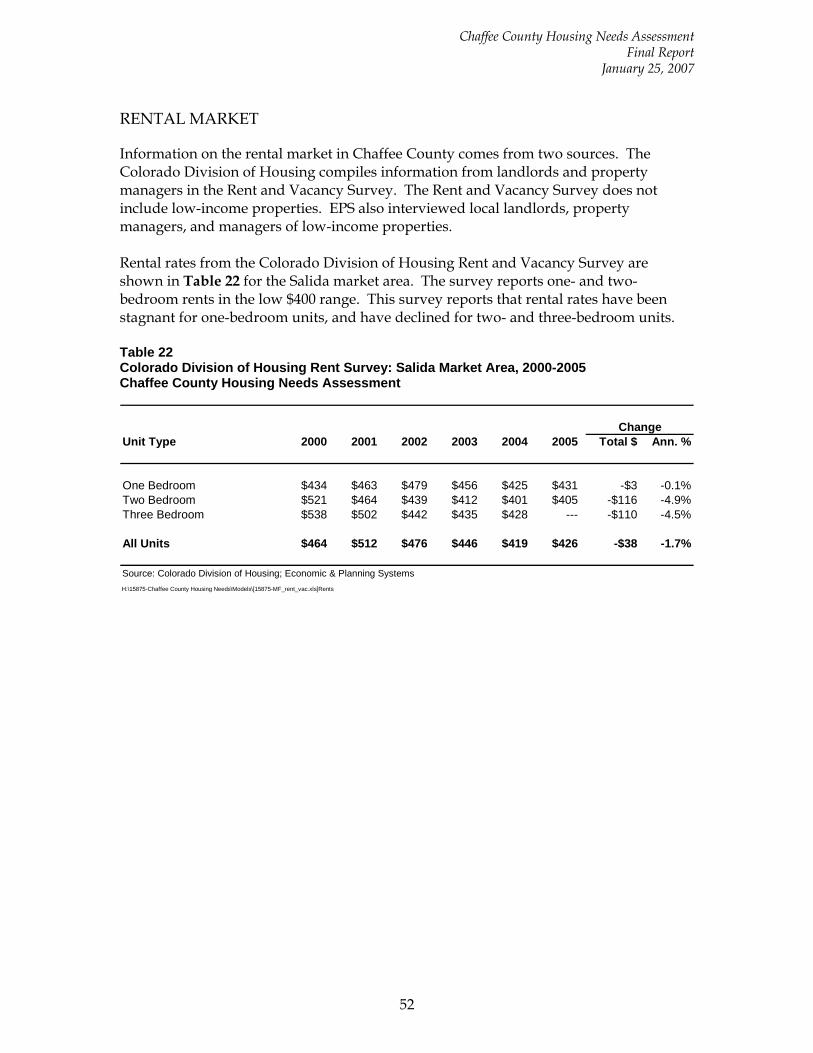
Chaffee County Housing Needs Assessment Final Report
January 25, 2007
52
RENTAL MARKET
Information on the rental market in Chaffee County comes from two sources. The Colorado Division of Housing compiles information from landlords and property managers in the Rent and Vacancy Survey. The Rent and Vacancy Survey does not include low-income properties. EPS also interviewed local landlords, property managers, and managers of low-income properties. Rental rates from the Colorado Division of Housing Rent and Vacancy Survey are shown in Table 22 for the Salida market area. The survey reports one- and two-bedroom rents in the low $400 range. This survey reports that rental rates have been stagnant for one-bedroom units, and have declined for two- and three-bedroom units. Table 22 Colorado Division of Housing Rent Survey: Salida Market Area, 2000-2005 Chaffee County Housing Needs Assessment
Unit Type 2000 2001 2002 2003 2004 2005 Total $ Ann. %
One Bedroom $434 $463 $479 $456 $425 $431 -$3 -0.1%Two Bedroom $521 $464 $439 $412 $401 $405 -$116 -4.9%Three Bedroom $538 $502 $442 $435 $428 --- -$110 -4.5%
All Units $464 $512 $476 $446 $419 $426 -$38 -1.7%
Source: Colorado Division of Housing; Economic & Planning SystemsH:\15875-Chaffee County Housing Needs\Models\[15875-MF_rent_vac.xls]Rents
Change
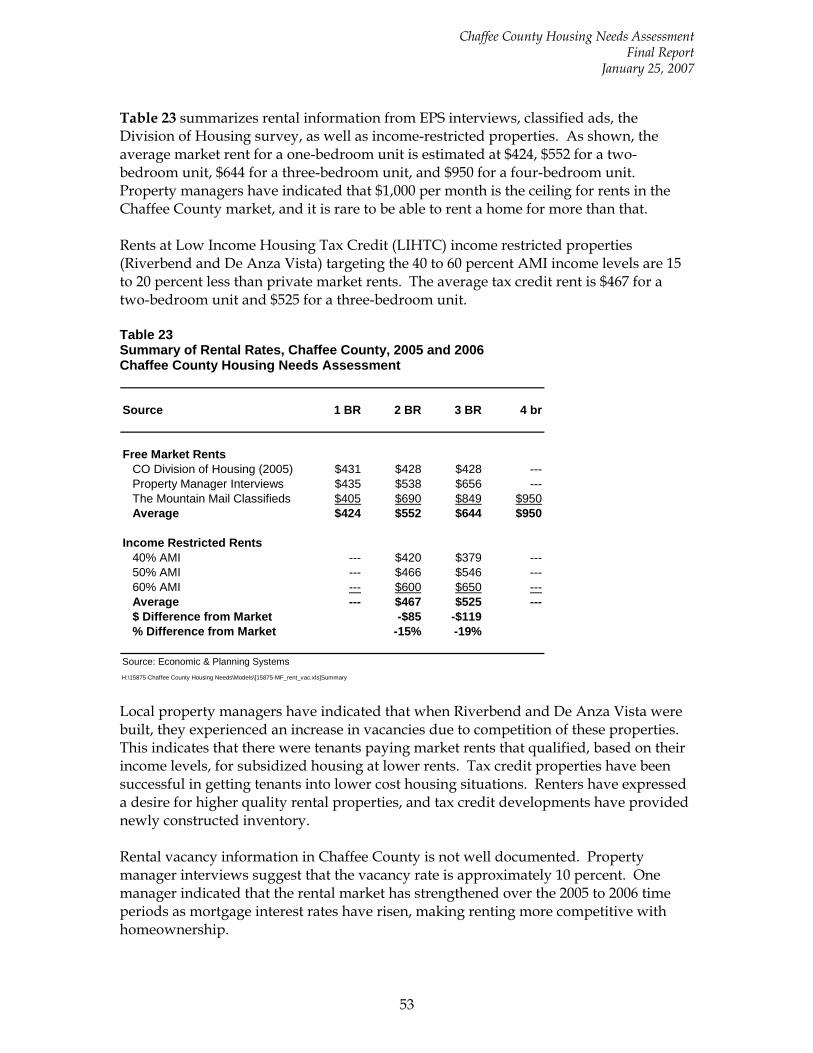
Chaffee County Housing Needs Assessment Final Report
January 25, 2007
53
Table 23 summarizes rental information from EPS interviews, classified ads, the Division of Housing survey, as well as income-restricted properties. As shown, the average market rent for a one-bedroom unit is estimated at $424, $552 for a two- bedroom unit, $644 for a three-bedroom unit, and $950 for a four-bedroom unit. Property managers have indicated that $1,000 per month is the ceiling for rents in the Chaffee County market, and it is rare to be able to rent a home for more than that. Rents at Low Income Housing Tax Credit (LIHTC) income restricted properties (Riverbend and De Anza Vista) targeting the 40 to 60 percent AMI income levels are 15 to 20 percent less than private market rents. The average tax credit rent is $467 for a two-bedroom unit and $525 for a three-bedroom unit. Table 23 Summary of Rental Rates, Chaffee County, 2005 and 2006 Chaffee County Housing Needs Assessment
Source 1 BR 2 BR 3 BR 4 br
Free Market RentsCO Division of Housing (2005) $431 $428 $428 ---Property Manager Interviews $435 $538 $656 ---The Mountain Mail Classifieds $405 $690 $849 $950Average $424 $552 $644 $950
Income Restricted Rents40% AMI --- $420 $379 ---50% AMI --- $466 $546 ---60% AMI --- $600 $650 ---Average --- $467 $525 ---$ Difference from Market -$85 -$119% Difference from Market -15% -19%
Source: Economic & Planning SystemsH:\15875-Chaffee County Housing Needs\Models\[15875-MF_rent_vac.xls]Summary Local property managers have indicated that when Riverbend and De Anza Vista were built, they experienced an increase in vacancies due to competition of these properties. This indicates that there were tenants paying market rents that qualified, based on their income levels, for subsidized housing at lower rents. Tax credit properties have been successful in getting tenants into lower cost housing situations. Renters have expressed a desire for higher quality rental properties, and tax credit developments have provided newly constructed inventory. Rental vacancy information in Chaffee County is not well documented. Property manager interviews suggest that the vacancy rate is approximately 10 percent. One manager indicated that the rental market has strengthened over the 2005 to 2006 time periods as mortgage interest rates have risen, making renting more competitive with homeownership.
54
IV. FUTURE CONDITIONS
This chapter provides two projections based on recent trends to illustrate the potential outcomes if Chaffee County continues to grow in the same manner it has over the last five to ten years. A housing and population projection is presented, followed by an employment projection by industry sector. The housing and population projection estimates the future composition of the County in terms of permanent residents and second homeowners. The employment projection estimates the future housing needs for employees by correlating wage levels to approximate Area Median Income (AMI). These AMI levels are then used to develop income targets for housing policies compared to wages.
HOUSING
A 15 year housing and population projection for Chaffee County is shown in Table 24. The underlying assumption behind the projection is that current relationships in construction, permanent population/household growth, and second home development will continue at similar rates in the future. A household is a group of people living in a housing unit, and therefore one new occupied housing unit is equivalent to one new household. As shown, from 2000 to 2005, permanent households (equivalently housing units occupied by permanent residents) grew by 54 per year compared to second homes, which increased by 179 per year, reflecting 23 percent and 77 percent of the new construction, respectively. Going forward, the growth in second homes is estimated at 225 per year from 2005 to 2010, decreasing to 200 per year after 2010. These figures reflect an average of 72 percent of the total permit activity. Second home construction is expected to remain strong in the future as the baby boomer generation, who are active in the second home market, will continue to influence the market for at least another 10 years. Also, the growth of the Front Range and congestion of the I-70 corridor will continue to contribute to the demand for weekend second homes. It is assumed that growth in the permanent population will continue as the community matures and diversifies, and to fill the employment needs of the growing County. As shown in the bottom row of Table 24, the 2020 permanent population is estimated to increase to approximately 20,000 with 8,100 households, an increase of 3,100 residents. The current distribution of homes is estimated at 76 percent permanent residents and 24 percent second homes. This is expected to shift substantially in the future, with 60 percent permanent resident homes and 40 percent second homes estimated in 2020. Since second homeowners typically have higher incomes and more wealth than the local population, they will continue to exert upward pressure on home and land prices.
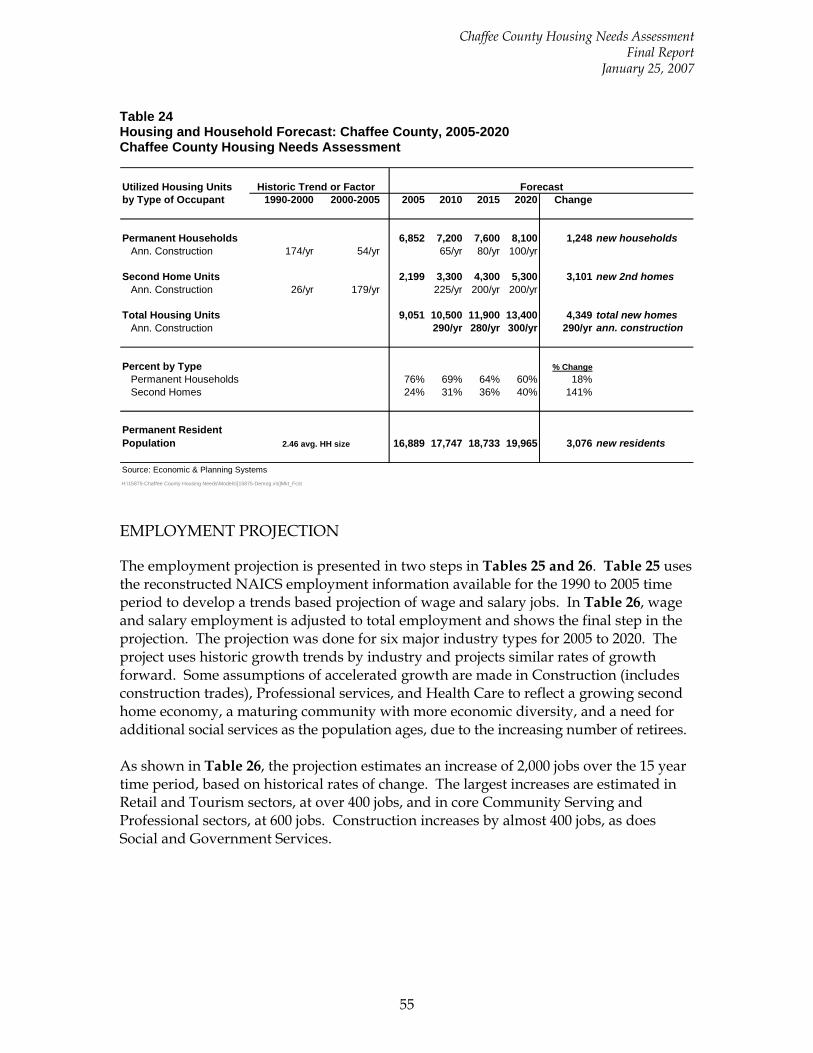
Chaffee County Housing Needs Assessment Final Report
January 25, 2007
55
Table 24 Housing and Household Forecast: Chaffee County, 2005-2020 Chaffee County Housing Needs Assessment
Utilized Housing Unitsby Type of Occupant 1990-2000 2000-2005 2005 2010 2015 2020 Change
Permanent Households 6,852 7,200 7,600 8,100 1,248 new householdsAnn. Construction 174/yr 54/yr 65/yr 80/yr 100/yr
Second Home Units 2,199 3,300 4,300 5,300 3,101 new 2nd homesAnn. Construction 26/yr 179/yr 225/yr 200/yr 200/yr
Total Housing Units 9,051 10,500 11,900 13,400 4,349 total new homesAnn. Construction 290/yr 280/yr 300/yr 290/yr ann. construction
Percent by Type % ChangePermanent Households 76% 69% 64% 60% 18%Second Homes 24% 31% 36% 40% 141%
Permanent Resident Population 16,889 17,747 18,733 19,965 3,076 new residents
Source: Economic & Planning SystemsH:\15875-Chaffee County Housing Needs\Models\[15875-Demog.xls]Mkt_Fcst
Historic Trend or Factor Forecast
2.46 avg. HH size
EMPLOYMENT PROJECTION
The employment projection is presented in two steps in Tables 25 and 26. Table 25 uses the reconstructed NAICS employment information available for the 1990 to 2005 time period to develop a trends based projection of wage and salary jobs. In Table 26, wage and salary employment is adjusted to total employment and shows the final step in the projection. The projection was done for six major industry types for 2005 to 2020. The project uses historic growth trends by industry and projects similar rates of growth forward. Some assumptions of accelerated growth are made in Construction (includes construction trades), Professional services, and Health Care to reflect a growing second home economy, a maturing community with more economic diversity, and a need for additional social services as the population ages, due to the increasing number of retirees. As shown in Table 26, the projection estimates an increase of 2,000 jobs over the 15 year time period, based on historical rates of change. The largest increases are estimated in Retail and Tourism sectors, at over 400 jobs, and in core Community Serving and Professional sectors, at 600 jobs. Construction increases by almost 400 jobs, as does Social and Government Services.
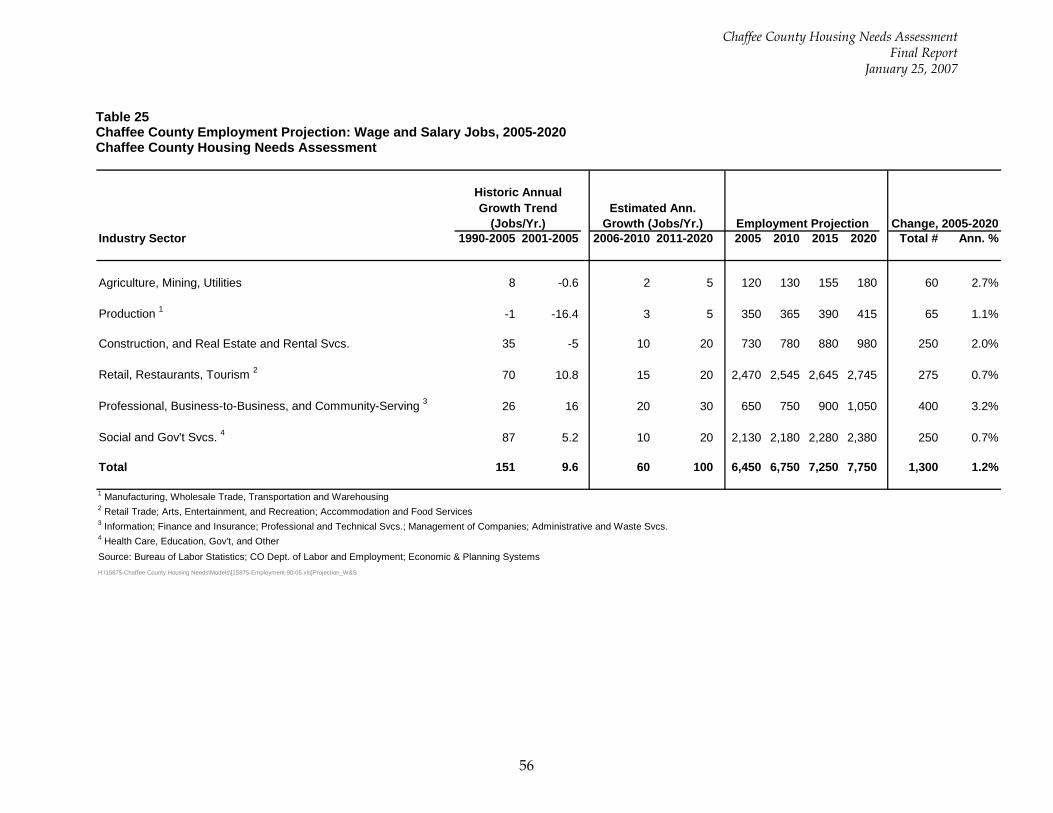
Chaffee County Housing Needs Assessment Final Report
January 25, 2007
56
Table 25 Chaffee County Employment Projection: Wage and Salary Jobs, 2005-2020 Chaffee County Housing Needs Assessment
Industry Sector 1990-2005 2001-2005 2006-2010 2011-2020 2005 2010 2015 2020 Total # Ann. %
Agriculture, Mining, Utilities 8 -0.6 2 5 120 130 155 180 60 2.7%
Production 1 -1 -16.4 3 5 350 365 390 415 65 1.1%
Construction, and Real Estate and Rental Svcs. 35 -5 10 20 730 780 880 980 250 2.0%
Retail, Restaurants, Tourism 2 70 10.8 15 20 2,470 2,545 2,645 2,745 275 0.7%
Professional, Business-to-Business, and Community-Serving 3 26 16 20 30 650 750 900 1,050 400 3.2%
Social and Gov't Svcs. 4 87 5.2 10 20 2,130 2,180 2,280 2,380 250 0.7%
Total 151 9.6 60 100 6,450 6,750 7,250 7,750 1,300 1.2%
1 Manufacturing, Wholesale Trade, Transportation and Warehousing2 Retail Trade; Arts, Entertainment, and Recreation; Accommodation and Food Services3 Information; Finance and Insurance; Professional and Technical Svcs.; Management of Companies; Administrative and Waste Svcs.4 Health Care, Education, Gov't, and OtherSource: Bureau of Labor Statistics; CO Dept. of Labor and Employment; Economic & Planning SystemsH:\15875-Chaffee County Housing Needs\Models\[15875-Employment 90-05.xls]Projection_W&S
Historic Annual
Change, 2005-2020Employment ProjectionEstimated Ann.
Growth (Jobs/Yr.)Growth Trend
(Jobs/Yr.)
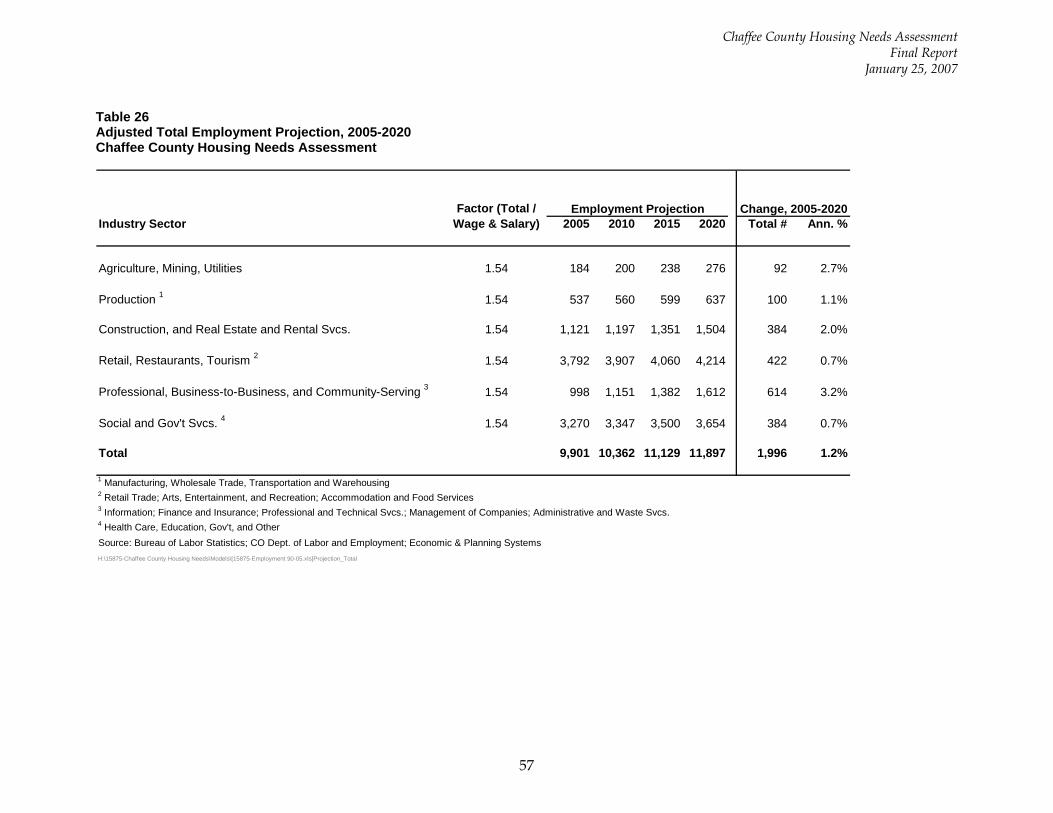
Chaffee County Housing Needs Assessment Final Report
January 25, 2007
57
Table 26 Adjusted Total Employment Projection, 2005-2020 Chaffee County Housing Needs Assessment
Industry Sector 2005 2010 2015 2020 Total # Ann. %
Agriculture, Mining, Utilities 1.54 184 200 238 276 92 2.7%
Production 1 1.54 537 560 599 637 100 1.1%
Construction, and Real Estate and Rental Svcs. 1.54 1,121 1,197 1,351 1,504 384 2.0%
Retail, Restaurants, Tourism 2 1.54 3,792 3,907 4,060 4,214 422 0.7%
Professional, Business-to-Business, and Community-Serving 3 1.54 998 1,151 1,382 1,612 614 3.2%
Social and Gov't Svcs. 4 1.54 3,270 3,347 3,500 3,654 384 0.7%
Total 9,901 10,362 11,129 11,897 1,996 1.2%
1 Manufacturing, Wholesale Trade, Transportation and Warehousing2 Retail Trade; Arts, Entertainment, and Recreation; Accommodation and Food Services3 Information; Finance and Insurance; Professional and Technical Svcs.; Management of Companies; Administrative and Waste Svcs.4 Health Care, Education, Gov't, and OtherSource: Bureau of Labor Statistics; CO Dept. of Labor and Employment; Economic & Planning SystemsH:\15875-Chaffee County Housing Needs\Models\[15875-Employment 90-05.xls]Projection_Total
Employment Projection Change, 2005-2020Factor (Total / Wage & Salary)
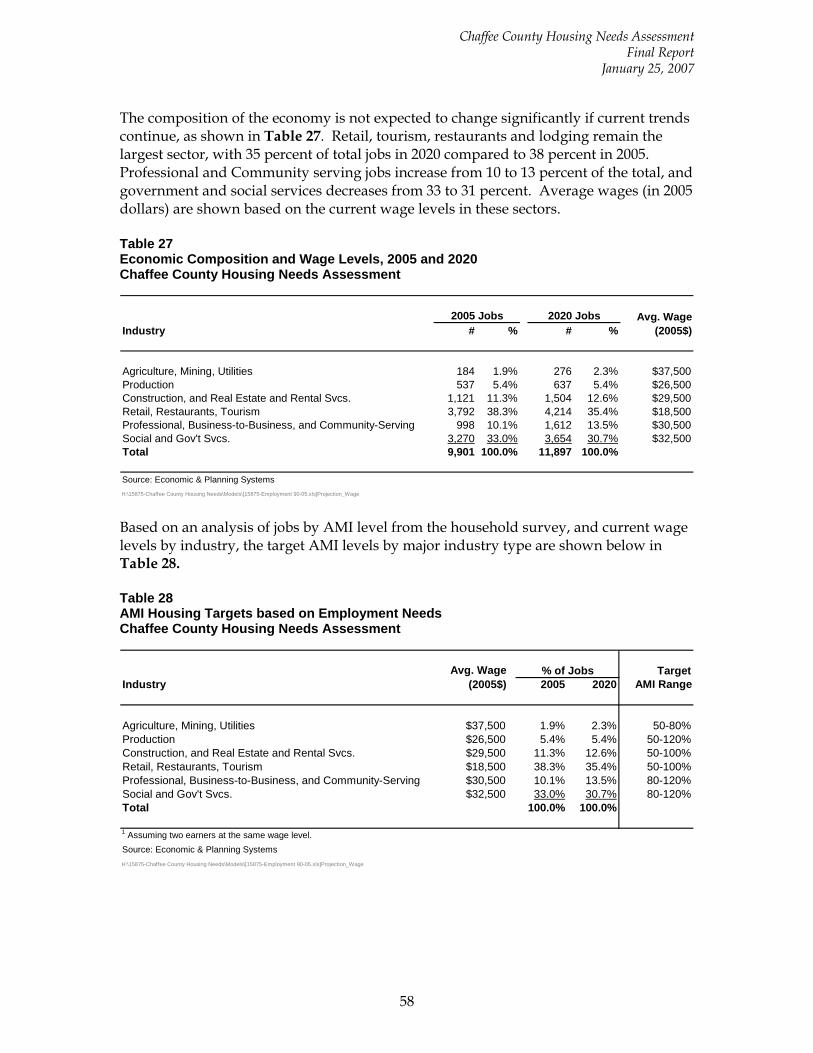
Chaffee County Housing Needs Assessment Final Report
January 25, 2007
58
The composition of the economy is not expected to change significantly if current trends continue, as shown in Table 27. Retail, tourism, restaurants and lodging remain the largest sector, with 35 percent of total jobs in 2020 compared to 38 percent in 2005. Professional and Community serving jobs increase from 10 to 13 percent of the total, and government and social services decreases from 33 to 31 percent. Average wages (in 2005 dollars) are shown based on the current wage levels in these sectors. Table 27 Economic Composition and Wage Levels, 2005 and 2020 Chaffee County Housing Needs Assessment
Industry # % # %
Agriculture, Mining, Utilities 184 1.9% 276 2.3% $37,500Production 537 5.4% 637 5.4% $26,500Construction, and Real Estate and Rental Svcs. 1,121 11.3% 1,504 12.6% $29,500Retail, Restaurants, Tourism 3,792 38.3% 4,214 35.4% $18,500Professional, Business-to-Business, and Community-Serving 998 10.1% 1,612 13.5% $30,500Social and Gov't Svcs. 3,270 33.0% 3,654 30.7% $32,500Total 9,901 100.0% 11,897 100.0%
Source: Economic & Planning SystemsH:\15875-Chaffee County Housing Needs\Models\[15875-Employment 90-05.xls]Projection_Wage
2005 Jobs 2020 Jobs Avg. Wage (2005$)
Based on an analysis of jobs by AMI level from the household survey, and current wage levels by industry, the target AMI levels by major industry type are shown below in Table 28. Table 28 AMI Housing Targets based on Employment Needs Chaffee County Housing Needs Assessment
TargetIndustry 2005 2020 AMI Range
Agriculture, Mining, Utilities $37,500 1.9% 2.3% 50-80%Production $26,500 5.4% 5.4% 50-120%Construction, and Real Estate and Rental Svcs. $29,500 11.3% 12.6% 50-100%Retail, Restaurants, Tourism $18,500 38.3% 35.4% 50-100%Professional, Business-to-Business, and Community-Serving $30,500 10.1% 13.5% 80-120%Social and Gov't Svcs. $32,500 33.0% 30.7% 80-120%Total 100.0% 100.0%
1 Assuming two earners at the same wage level.Source: Economic & Planning SystemsH:\15875-Chaffee County Housing Needs\Models\[15875-Employment 90-05.xls]Projection_Wage
% of JobsAvg. Wage (2005$)
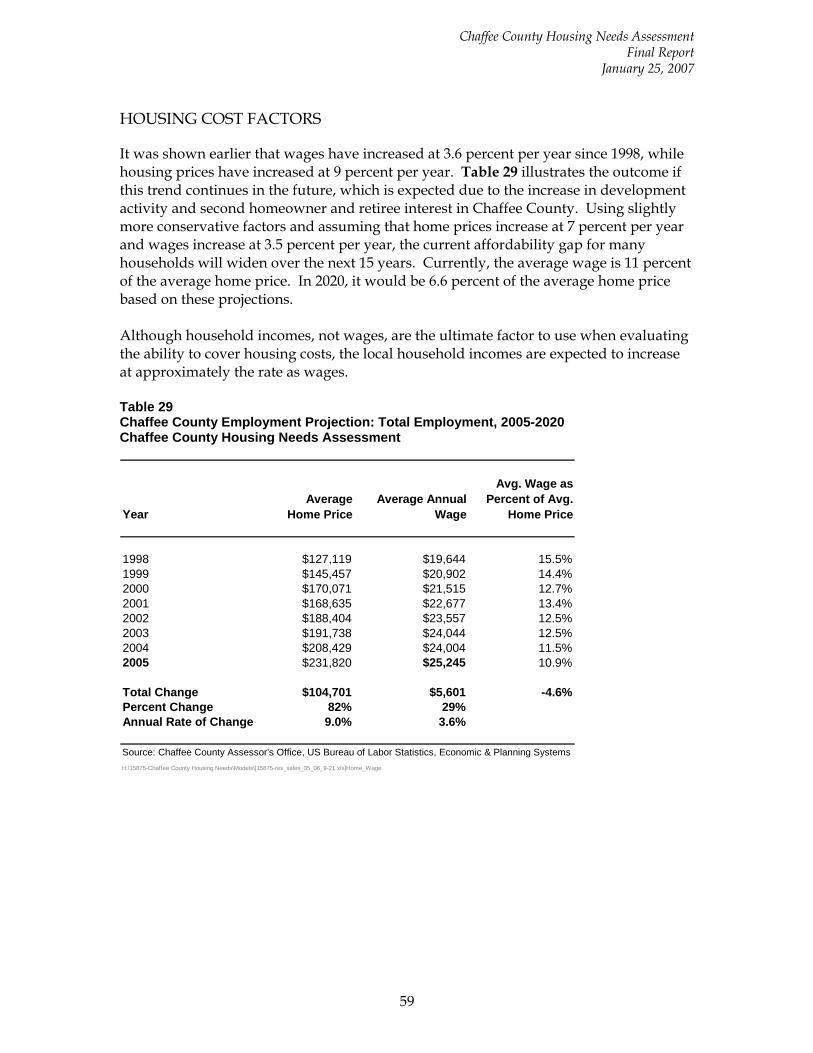
Chaffee County Housing Needs Assessment Final Report
January 25, 2007
59
HOUSING COST FACTORS
It was shown earlier that wages have increased at 3.6 percent per year since 1998, while housing prices have increased at 9 percent per year. Table 29 illustrates the outcome if this trend continues in the future, which is expected due to the increase in development activity and second homeowner and retiree interest in Chaffee County. Using slightly more conservative factors and assuming that home prices increase at 7 percent per year and wages increase at 3.5 percent per year, the current affordability gap for many households will widen over the next 15 years. Currently, the average wage is 11 percent of the average home price. In 2020, it would be 6.6 percent of the average home price based on these projections. Although household incomes, not wages, are the ultimate factor to use when evaluating the ability to cover housing costs, the local household incomes are expected to increase at approximately the rate as wages. Table 29 Chaffee County Employment Projection: Total Employment, 2005-2020 Chaffee County Housing Needs Assessment
YearAverage
Home PriceAverage Annual
Wage
Avg. Wage as Percent of Avg.
Home Price
1998 $127,119 $19,644 15.5%1999 $145,457 $20,902 14.4%2000 $170,071 $21,515 12.7%2001 $168,635 $22,677 13.4%2002 $188,404 $23,557 12.5%2003 $191,738 $24,044 12.5%2004 $208,429 $24,004 11.5%2005 $231,820 $25,245 10.9%
Total Change $104,701 $5,601 -4.6%Percent Change 82% 29%Annual Rate of Change 9.0% 3.6%
Source: Chaffee County Assessor's Office, US Bureau of Labor Statistics, Economic & Planning SystemsH:\15875-Chaffee County Housing Needs\Models\[15875-res_sales_05_06_9-21.xls]Home_Wage
60
V. COMMUNITY THEMES
This chapter presents key findings from the household survey fielded in Chaffee County in the summer of 2006. The chapter highlights relevant demographic and economic characteristics of the County’s residents, with a focus on how the County’s demographics are changing. These findings are used and should be considered in framing housing and land use policy discussions.
SURVEY METHODOLOGY
Approximately 2,300 households within the county limits of Chaffee were randomly selected to participate in the survey using a stratified, systematic sampling method of addresses within carrier routes. (Systematic sampling is a method that closely approximates random sampling by selecting every Nth address until the desired numbers of households are chosen. Carrier routes are mail carrier delivery zones defined by the U.S. Postal Service.) An individual within each household was asked to complete the survey using the birthday method. (The birthday method selects a person within the household by asking the “person whose birthday has most recently passed” to complete the questionnaire. The underlying assumption in this method is that day of birth has no relationship to the way people respond to surveys.) A copy of the survey is provided in the Appendix. Of the 2,160 eligible households, 584 completed the survey, providing a response rate of 27 percent. Approximately 6 percent of the surveys were returned because the housing unit was vacant or the postal service was unable to deliver the survey as addressed. This is a good response rate as any response rate over 20 percent reflects broad participation.
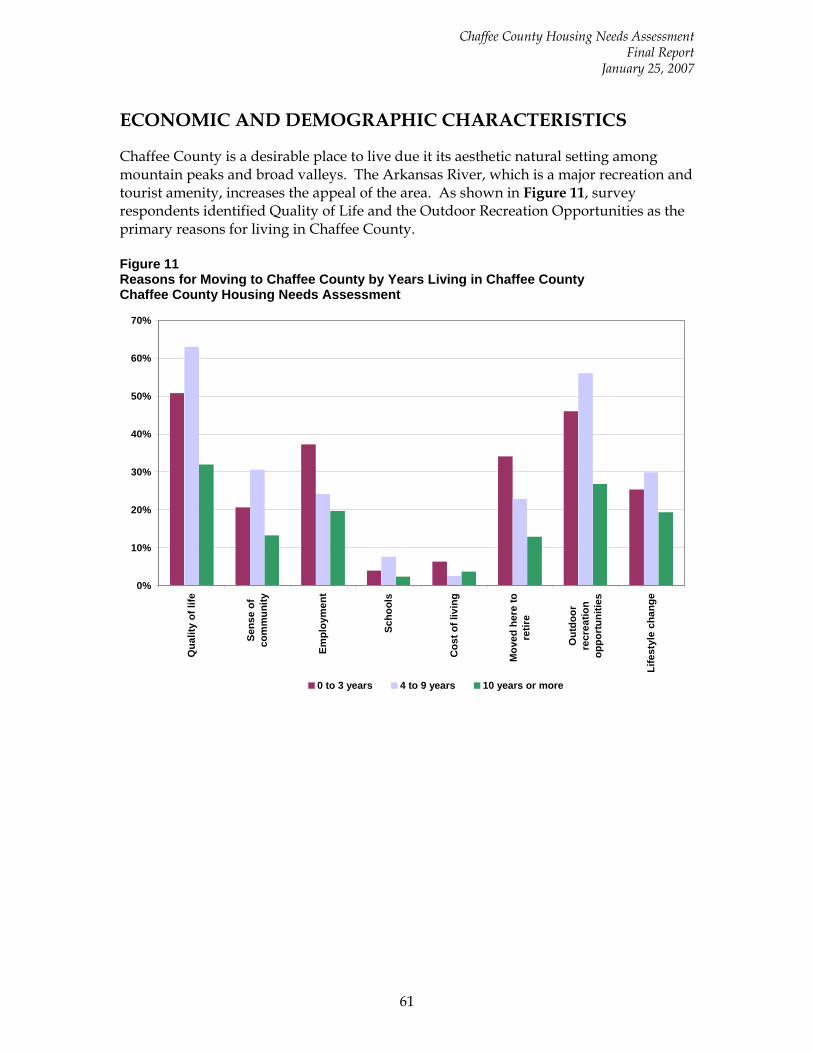
Chaffee County Housing Needs Assessment Final Report
January 25, 2007
61
ECONOMIC AND DEMOGRAPHIC CHARACTERISTICS
Chaffee County is a desirable place to live due it its aesthetic natural setting among mountain peaks and broad valleys. The Arkansas River, which is a major recreation and tourist amenity, increases the appeal of the area. As shown in Figure 11, survey respondents identified Quality of Life and the Outdoor Recreation Opportunities as the primary reasons for living in Chaffee County. Figure 11 Reasons for Moving to Chaffee County by Years Living in Chaffee County Chaffee County Housing Needs Assessment
0%
10%
20%
30%
40%
50%
60%
70%
Qua
lity
of li
fe
Sens
e of
com
mun
ity
Empl
oym
ent
Scho
ols
Cos
t of l
ivin
g
Mov
ed h
ere
tore
tire
Out
door
recr
eatio
nop
port
uniti
es
Life
styl
e ch
ange
0 to 3 years 4 to 9 years 10 years or more
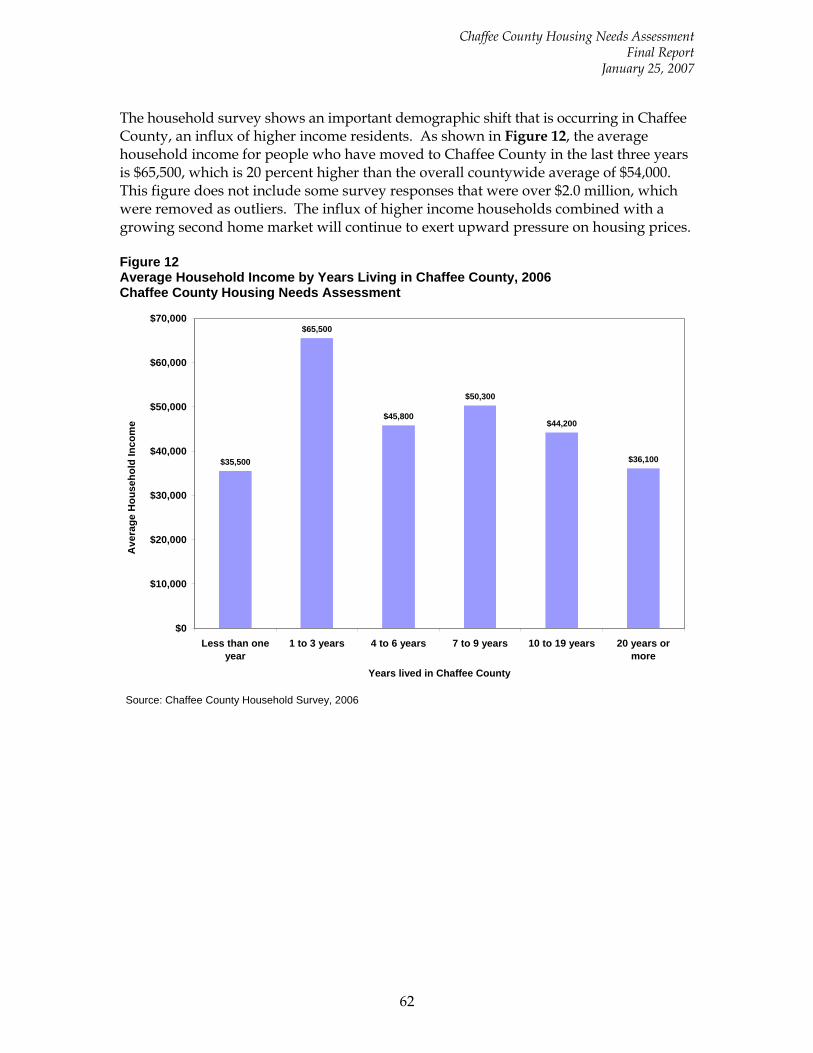
Chaffee County Housing Needs Assessment Final Report
January 25, 2007
62
The household survey shows an important demographic shift that is occurring in Chaffee County, an influx of higher income residents. As shown in Figure 12, the average household income for people who have moved to Chaffee County in the last three years is $65,500, which is 20 percent higher than the overall countywide average of $54,000. This figure does not include some survey responses that were over $2.0 million, which were removed as outliers. The influx of higher income households combined with a growing second home market will continue to exert upward pressure on housing prices. Figure 12 Average Household Income by Years Living in Chaffee County, 2006 Chaffee County Housing Needs Assessment
$35,500
$65,500
$45,800
$50,300
$44,200
$36,100
$0
$10,000
$20,000
$30,000
$40,000
$50,000
$60,000
$70,000
Less than oneyear
1 to 3 years 4 to 6 years 7 to 9 years 10 to 19 years 20 years ormore
Years lived in Chaffee County
Ave
rage
Hou
seho
ld In
com
e
Source: Chaffee County Household Survey, 2006
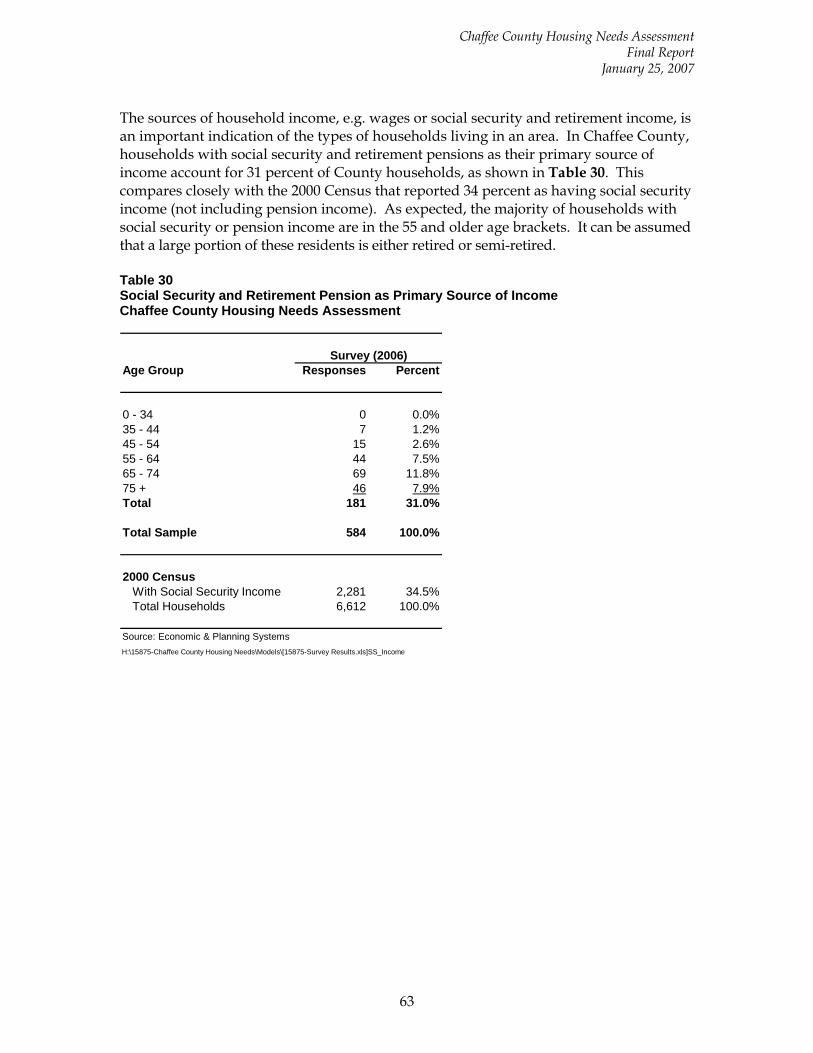
Chaffee County Housing Needs Assessment Final Report
January 25, 2007
63
The sources of household income, e.g. wages or social security and retirement income, is an important indication of the types of households living in an area. In Chaffee County, households with social security and retirement pensions as their primary source of income account for 31 percent of County households, as shown in Table 30. This compares closely with the 2000 Census that reported 34 percent as having social security income (not including pension income). As expected, the majority of households with social security or pension income are in the 55 and older age brackets. It can be assumed that a large portion of these residents is either retired or semi-retired. Table 30 Social Security and Retirement Pension as Primary Source of Income Chaffee County Housing Needs Assessment
Age Group Responses Percent
0 - 34 0 0.0%35 - 44 7 1.2%45 - 54 15 2.6%55 - 64 44 7.5%65 - 74 69 11.8%75 + 46 7.9%Total 181 31.0%
Total Sample 584 100.0%
2000 CensusWith Social Security Income 2,281 34.5%Total Households 6,612 100.0%
Source: Economic & Planning SystemsH:\15875-Chaffee County Housing Needs\Models\[15875-Survey Results.xls]SS_Income
Survey (2006)
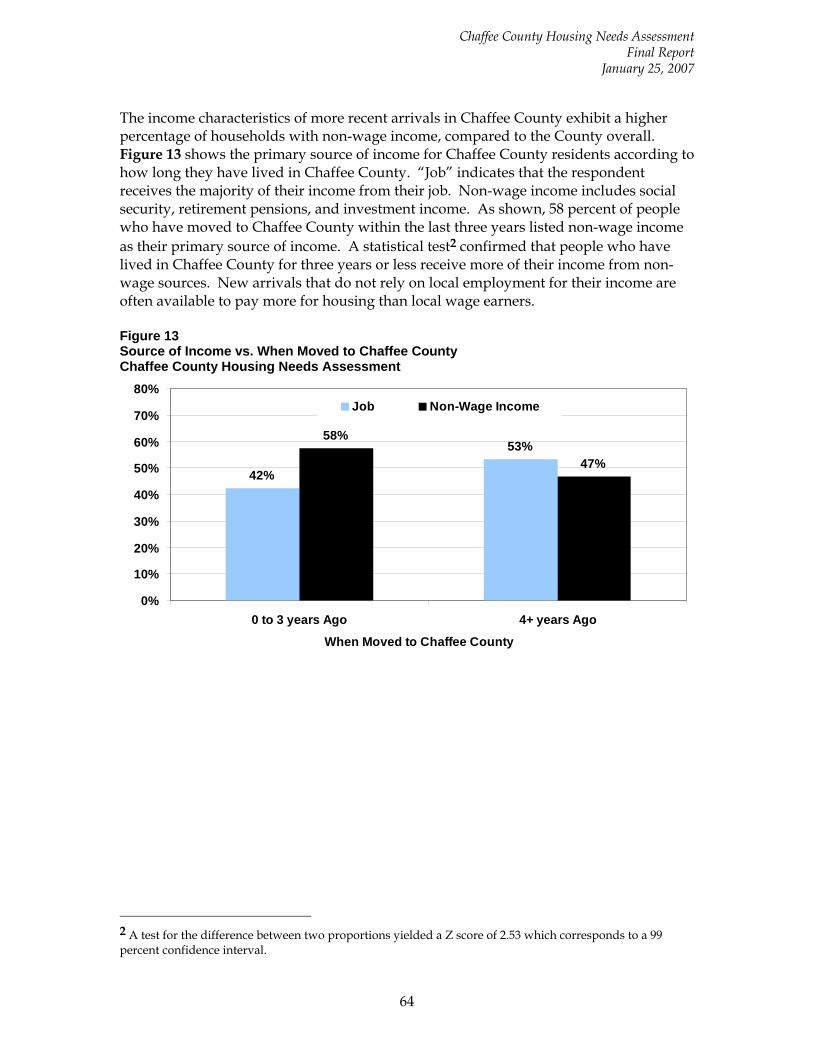
Chaffee County Housing Needs Assessment Final Report
January 25, 2007
64
The income characteristics of more recent arrivals in Chaffee County exhibit a higher percentage of households with non-wage income, compared to the County overall. Figure 13 shows the primary source of income for Chaffee County residents according to how long they have lived in Chaffee County. “Job” indicates that the respondent receives the majority of their income from their job. Non-wage income includes social security, retirement pensions, and investment income. As shown, 58 percent of people who have moved to Chaffee County within the last three years listed non-wage income as their primary source of income. A statistical test2 confirmed that people who have lived in Chaffee County for three years or less receive more of their income from non-wage sources. New arrivals that do not rely on local employment for their income are often available to pay more for housing than local wage earners. Figure 13 Source of Income vs. When Moved to Chaffee County Chaffee County Housing Needs Assessment
42%
53%58%
47%
0%
10%
20%
30%
40%
50%
60%
70%
80%
0 to 3 years Ago 4+ years Ago
When Moved to Chaffee County
Job Non-Wage Income
2 A test for the difference between two proportions yielded a Z score of 2.53 which corresponds to a 99 percent confidence interval.
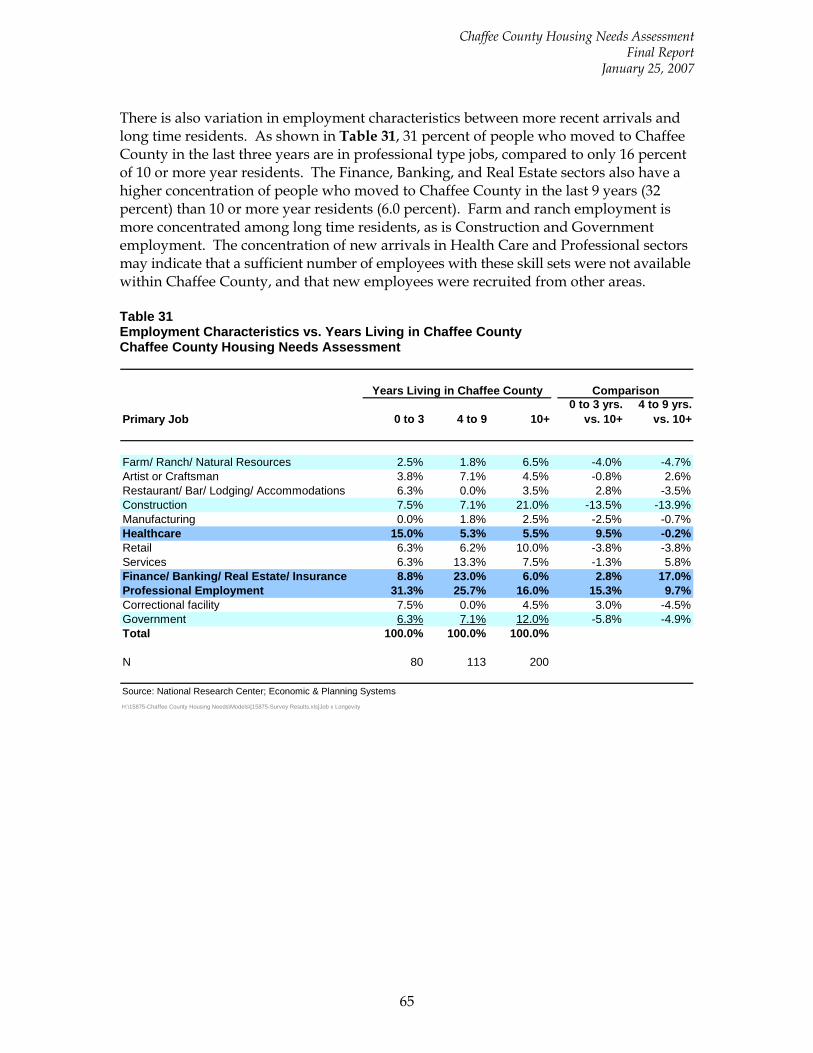
Chaffee County Housing Needs Assessment Final Report
January 25, 2007
65
There is also variation in employment characteristics between more recent arrivals and long time residents. As shown in Table 31, 31 percent of people who moved to Chaffee County in the last three years are in professional type jobs, compared to only 16 percent of 10 or more year residents. The Finance, Banking, and Real Estate sectors also have a higher concentration of people who moved to Chaffee County in the last 9 years (32 percent) than 10 or more year residents (6.0 percent). Farm and ranch employment is more concentrated among long time residents, as is Construction and Government employment. The concentration of new arrivals in Health Care and Professional sectors may indicate that a sufficient number of employees with these skill sets were not available within Chaffee County, and that new employees were recruited from other areas. Table 31 Employment Characteristics vs. Years Living in Chaffee County Chaffee County Housing Needs Assessment
Primary Job 0 to 3 4 to 9 10+0 to 3 yrs.
vs. 10+4 to 9 yrs.
vs. 10+
Farm/ Ranch/ Natural Resources 2.5% 1.8% 6.5% -4.0% -4.7%Artist or Craftsman 3.8% 7.1% 4.5% -0.8% 2.6%Restaurant/ Bar/ Lodging/ Accommodations 6.3% 0.0% 3.5% 2.8% -3.5%Construction 7.5% 7.1% 21.0% -13.5% -13.9%Manufacturing 0.0% 1.8% 2.5% -2.5% -0.7%Healthcare 15.0% 5.3% 5.5% 9.5% -0.2%Retail 6.3% 6.2% 10.0% -3.8% -3.8%Services 6.3% 13.3% 7.5% -1.3% 5.8%Finance/ Banking/ Real Estate/ Insurance 8.8% 23.0% 6.0% 2.8% 17.0%Professional Employment 31.3% 25.7% 16.0% 15.3% 9.7%Correctional facility 7.5% 0.0% 4.5% 3.0% -4.5%Government 6.3% 7.1% 12.0% -5.8% -4.9%Total 100.0% 100.0% 100.0%
N 80 113 200
Source: National Research Center; Economic & Planning SystemsH:\15875-Chaffee County Housing Needs\Models\[15875-Survey Results.xls]Job x Longevity
ComparisonYears Living in Chaffee County
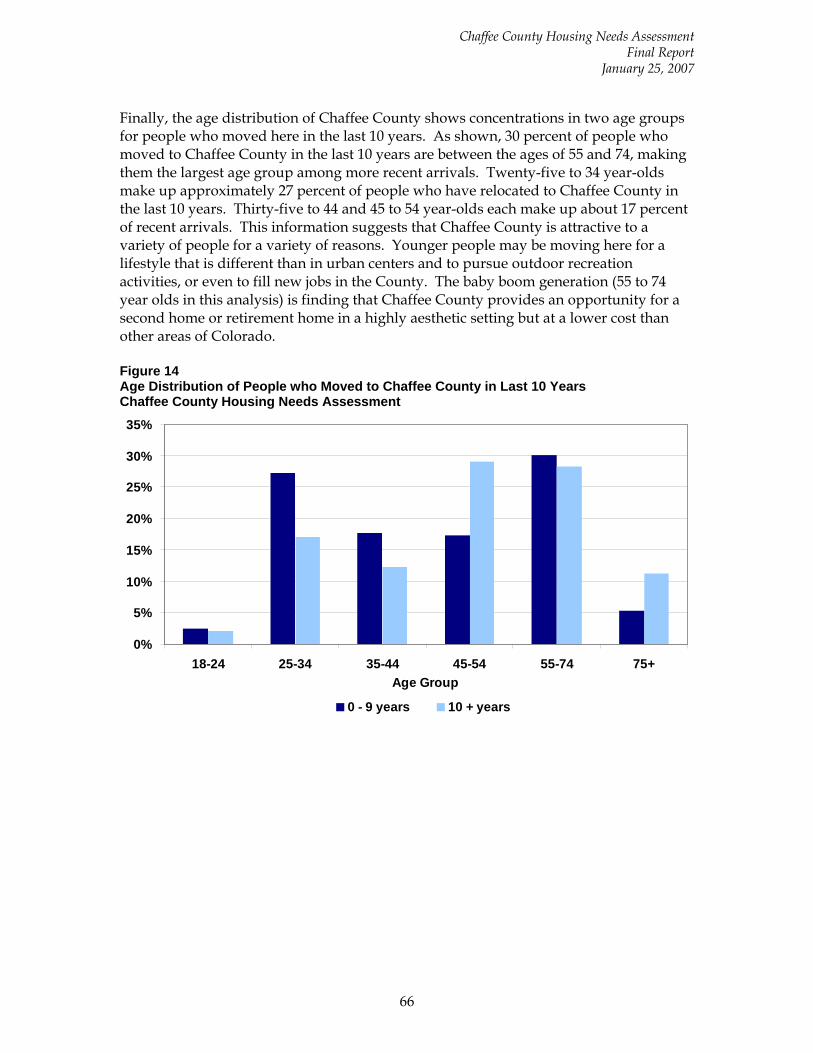
Chaffee County Housing Needs Assessment Final Report
January 25, 2007
66
Finally, the age distribution of Chaffee County shows concentrations in two age groups for people who moved here in the last 10 years. As shown, 30 percent of people who moved to Chaffee County in the last 10 years are between the ages of 55 and 74, making them the largest age group among more recent arrivals. Twenty-five to 34 year-olds make up approximately 27 percent of people who have relocated to Chaffee County in the last 10 years. Thirty-five to 44 and 45 to 54 year-olds each make up about 17 percent of recent arrivals. This information suggests that Chaffee County is attractive to a variety of people for a variety of reasons. Younger people may be moving here for a lifestyle that is different than in urban centers and to pursue outdoor recreation activities, or even to fill new jobs in the County. The baby boom generation (55 to 74 year olds in this analysis) is finding that Chaffee County provides an opportunity for a second home or retirement home in a highly aesthetic setting but at a lower cost than other areas of Colorado. Figure 14 Age Distribution of People who Moved to Chaffee County in Last 10 Years Chaffee County Housing Needs Assessment
0%
5%
10%
15%
20%
25%
30%
35%
18-24 25-34 35-44 45-54 55-74 75+Age Group
0 - 9 years 10 + years
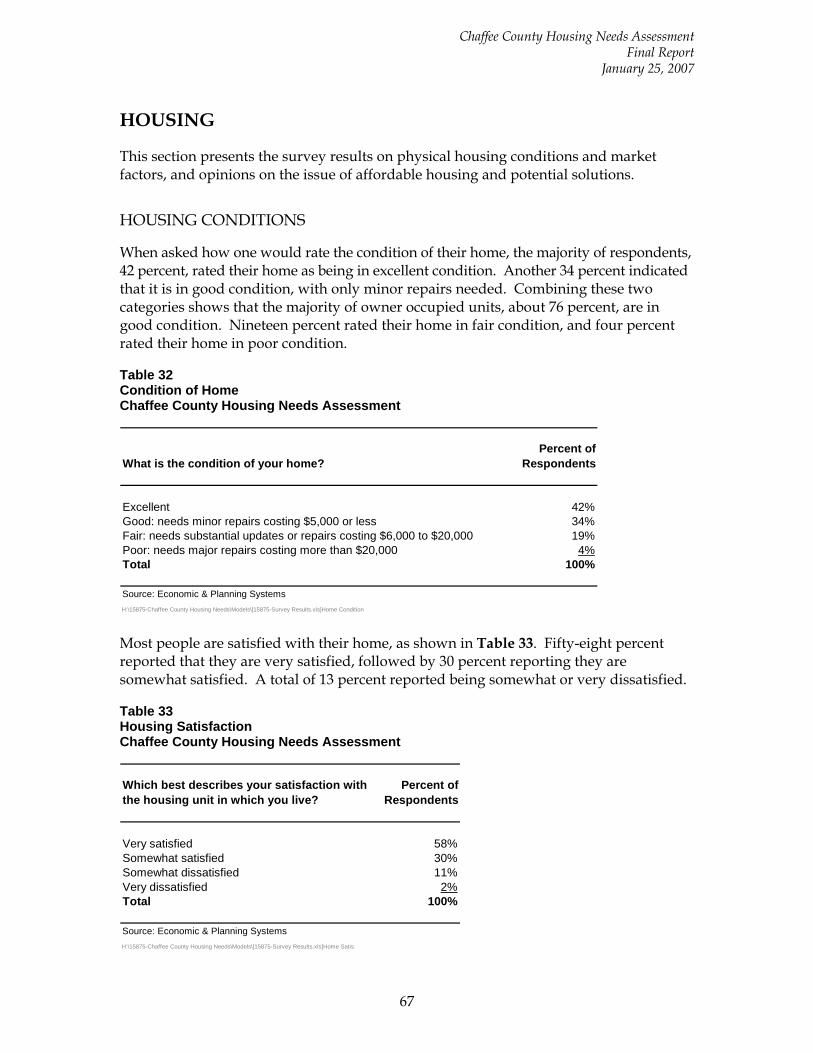
Chaffee County Housing Needs Assessment Final Report
January 25, 2007
67
HOUSING
This section presents the survey results on physical housing conditions and market factors, and opinions on the issue of affordable housing and potential solutions.
HOUSING CONDITIONS
When asked how one would rate the condition of their home, the majority of respondents, 42 percent, rated their home as being in excellent condition. Another 34 percent indicated that it is in good condition, with only minor repairs needed. Combining these two categories shows that the majority of owner occupied units, about 76 percent, are in good condition. Nineteen percent rated their home in fair condition, and four percent rated their home in poor condition. Table 32 Condition of Home Chaffee County Housing Needs Assessment
What is the condition of your home?Percent of
Respondents
Excellent 42%Good: needs minor repairs costing $5,000 or less 34%Fair: needs substantial updates or repairs costing $6,000 to $20,000 19%Poor: needs major repairs costing more than $20,000 4%Total 100%
Source: Economic & Planning SystemsH:\15875-Chaffee County Housing Needs\Models\[15875-Survey Results.xls]Home Condition Most people are satisfied with their home, as shown in Table 33. Fifty-eight percent reported that they are very satisfied, followed by 30 percent reporting they are somewhat satisfied. A total of 13 percent reported being somewhat or very dissatisfied. Table 33 Housing Satisfaction Chaffee County Housing Needs Assessment
Which best describes your satisfaction with the housing unit in which you live?
Percent of Respondents
Very satisfied 58%Somewhat satisfied 30%Somewhat dissatisfied 11%Very dissatisfied 2%Total 100%
Source: Economic & Planning SystemsH:\15875-Chaffee County Housing Needs\Models\[15875-Survey Results.xls]Home Satis
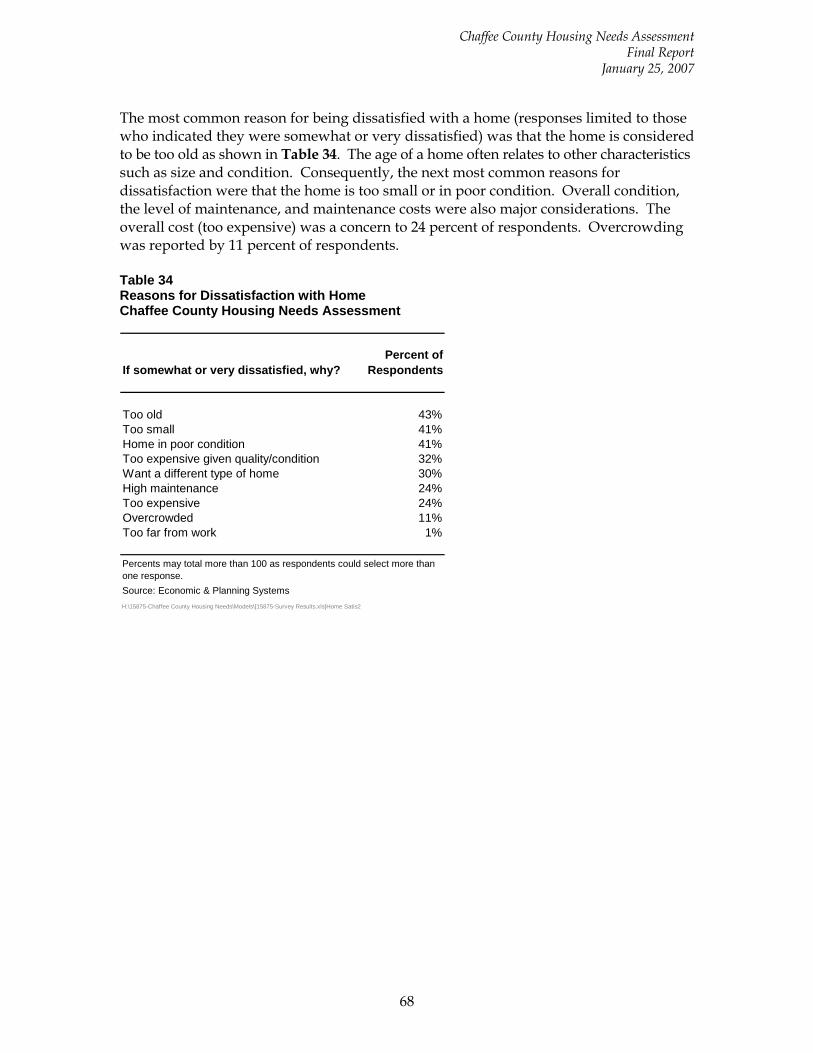
Chaffee County Housing Needs Assessment Final Report
January 25, 2007
68
The most common reason for being dissatisfied with a home (responses limited to those who indicated they were somewhat or very dissatisfied) was that the home is considered to be too old as shown in Table 34. The age of a home often relates to other characteristics such as size and condition. Consequently, the next most common reasons for dissatisfaction were that the home is too small or in poor condition. Overall condition, the level of maintenance, and maintenance costs were also major considerations. The overall cost (too expensive) was a concern to 24 percent of respondents. Overcrowding was reported by 11 percent of respondents. Table 34 Reasons for Dissatisfaction with Home Chaffee County Housing Needs Assessment
If somewhat or very dissatisfied, why?Percent of
Respondents
Too old 43%Too small 41%Home in poor condition 41%Too expensive given quality/condition 32%Want a different type of home 30%High maintenance 24%Too expensive 24%Overcrowded 11%Too far from work 1%
Source: Economic & Planning SystemsH:\15875-Chaffee County Housing Needs\Models\[15875-Survey Results.xls]Home Satis2
Percents may total more than 100 as respondents could select more than one response.

Chaffee County Housing Needs Assessment Final Report
January 25, 2007
69
The survey asked people if they wanted to buy a home but have not done so, what the primary reasons were. As shown in Table 35, 73 percent respondents indicated that the total cost was too high. The next most common reason was lacking an adequate down payment (53 percent). The third most common choice was that the housing affordable to respondents is not what they want. This could be interpreted numerous ways; including poor condition for the money, too small or not up to current market preferences or design standards. Twenty-two percent reported that they could not qualify for a loan, followed by 19 percent who indicated that the loan process was intimidating. Table 35 Reasons for not Buying a Home Chaffee County Housing Needs Assessment
If you have wanted to buy a home but have not done so, why not?
% of Responses
Total cost too high 73%Lack adequate down payment 53%Housing I can afford not what I want 42%Can't qualify for a loan 22%Intimidating loan process 19%Cheaper to rent 18%Have poor credit 17%Other 17%
Total is more than 100% because respondants could make more than one choice.Source: Chaffee County Household Survey (2006), Economic & Planning SystemsH:\15875-Chaffee County Housing Needs\Models\[15875-Survey Results.xls]Why Not Buy
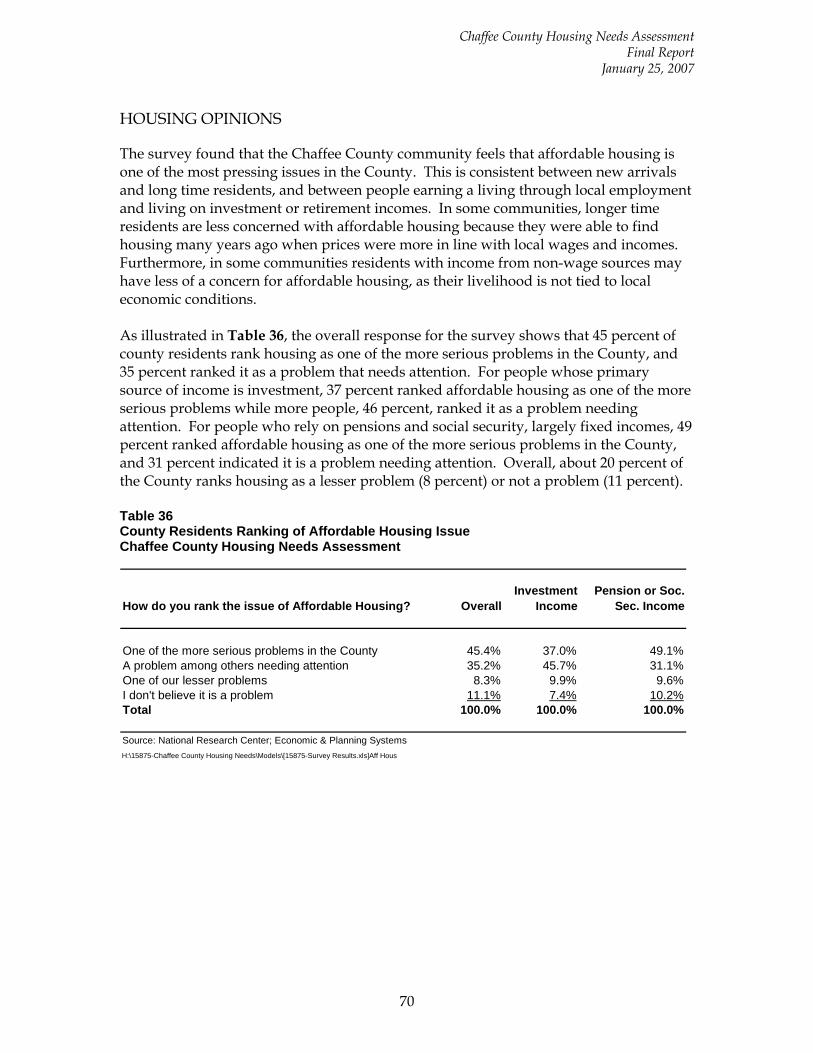
Chaffee County Housing Needs Assessment Final Report
January 25, 2007
70
HOUSING OPINIONS
The survey found that the Chaffee County community feels that affordable housing is one of the most pressing issues in the County. This is consistent between new arrivals and long time residents, and between people earning a living through local employment and living on investment or retirement incomes. In some communities, longer time residents are less concerned with affordable housing because they were able to find housing many years ago when prices were more in line with local wages and incomes. Furthermore, in some communities residents with income from non-wage sources may have less of a concern for affordable housing, as their livelihood is not tied to local economic conditions. As illustrated in Table 36, the overall response for the survey shows that 45 percent of county residents rank housing as one of the more serious problems in the County, and 35 percent ranked it as a problem that needs attention. For people whose primary source of income is investment, 37 percent ranked affordable housing as one of the more serious problems while more people, 46 percent, ranked it as a problem needing attention. For people who rely on pensions and social security, largely fixed incomes, 49 percent ranked affordable housing as one of the more serious problems in the County, and 31 percent indicated it is a problem needing attention. Overall, about 20 percent of the County ranks housing as a lesser problem (8 percent) or not a problem (11 percent). Table 36 County Residents Ranking of Affordable Housing Issue Chaffee County Housing Needs Assessment
How do you rank the issue of Affordable Housing? OverallInvestment
IncomePension or Soc.
Sec. Income
One of the more serious problems in the County 45.4% 37.0% 49.1%A problem among others needing attention 35.2% 45.7% 31.1%One of our lesser problems 8.3% 9.9% 9.6%I don't believe it is a problem 11.1% 7.4% 10.2%Total 100.0% 100.0% 100.0%
Source: National Research Center; Economic & Planning SystemsH:\15875-Chaffee County Housing Needs\Models\[15875-Survey Results.xls]Aff Hous
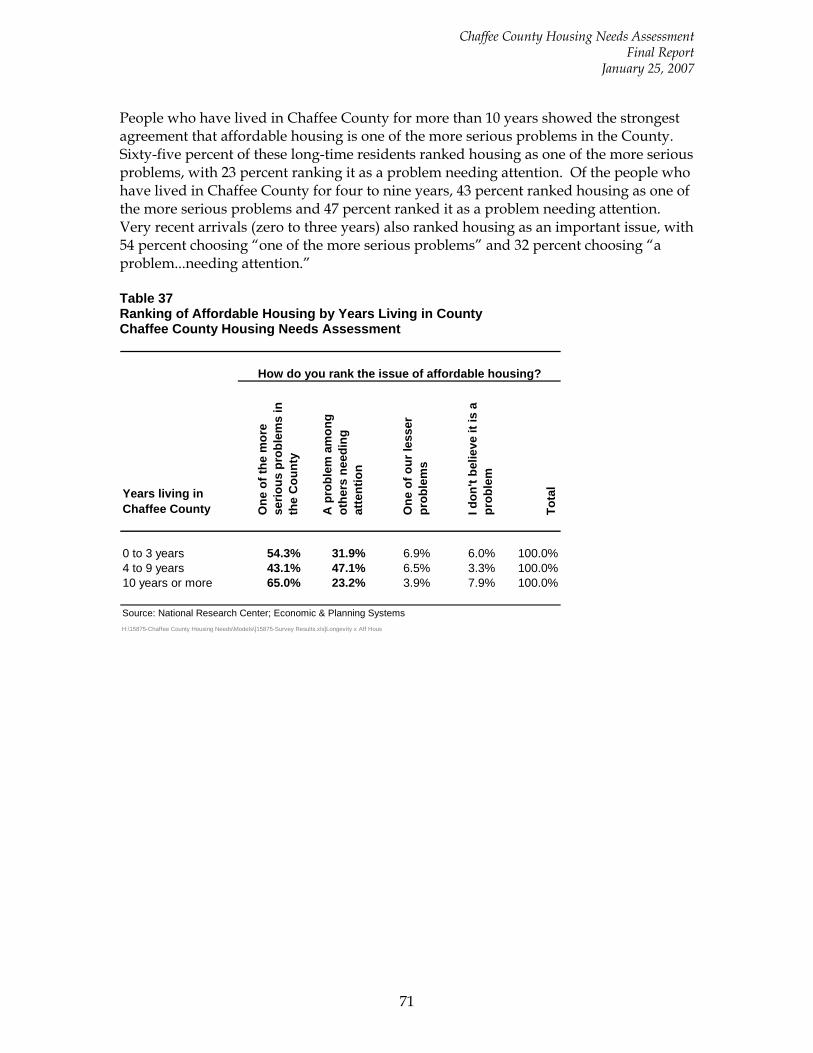
Chaffee County Housing Needs Assessment Final Report
January 25, 2007
71
People who have lived in Chaffee County for more than 10 years showed the strongest agreement that affordable housing is one of the more serious problems in the County. Sixty-five percent of these long-time residents ranked housing as one of the more serious problems, with 23 percent ranking it as a problem needing attention. Of the people who have lived in Chaffee County for four to nine years, 43 percent ranked housing as one of the more serious problems and 47 percent ranked it as a problem needing attention. Very recent arrivals (zero to three years) also ranked housing as an important issue, with 54 percent choosing “one of the more serious problems” and 32 percent choosing “a problem...needing attention.” Table 37 Ranking of Affordable Housing by Years Living in County Chaffee County Housing Needs Assessment
Years living in Chaffee County O
ne o
f the
mor
e se
rious
pro
blem
s in
th
e C
ount
y
A p
robl
em a
mon
g ot
hers
nee
ding
at
tent
ion
One
of o
ur le
sser
pr
oble
ms
I don
't be
lieve
it is
a
prob
lem
Tota
l0 to 3 years 54.3% 31.9% 6.9% 6.0% 100.0%4 to 9 years 43.1% 47.1% 6.5% 3.3% 100.0%10 years or more 65.0% 23.2% 3.9% 7.9% 100.0%
Source: National Research Center; Economic & Planning SystemsH:\15875-Chaffee County Housing Needs\Models\[15875-Survey Results.xls]Longevity x Aff Hous
How do you rank the issue of affordable housing?
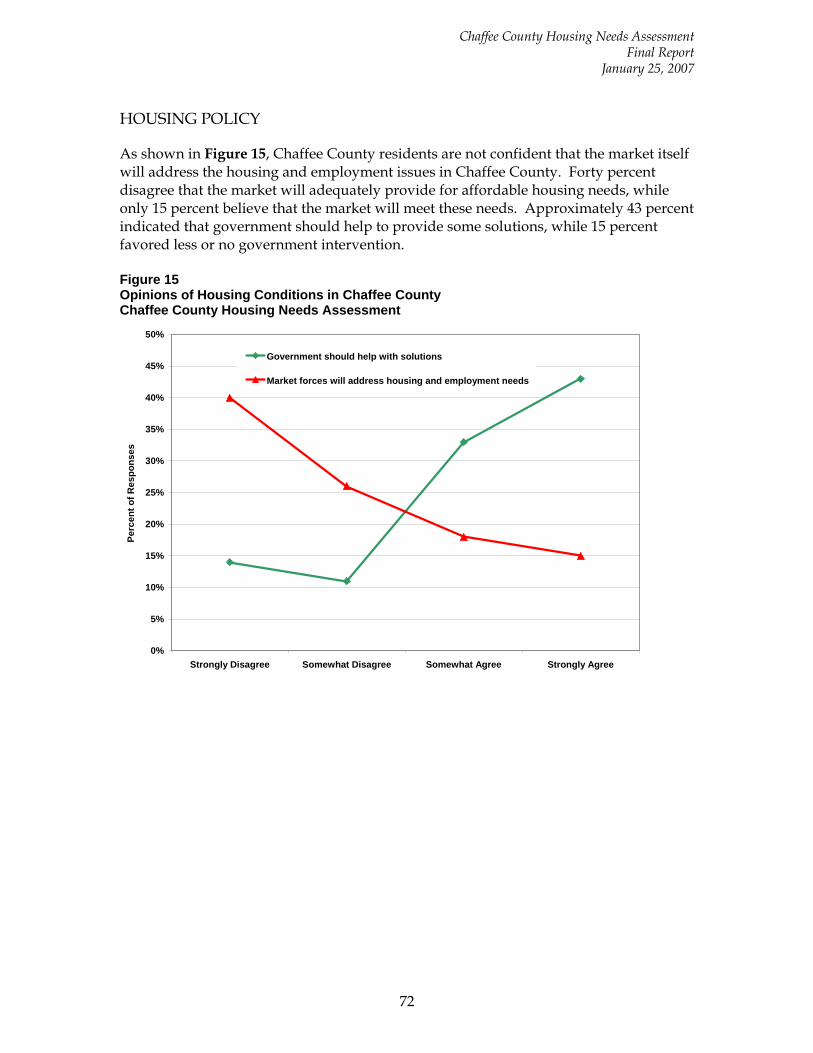
Chaffee County Housing Needs Assessment Final Report
January 25, 2007
72
HOUSING POLICY
As shown in Figure 15, Chaffee County residents are not confident that the market itself will address the housing and employment issues in Chaffee County. Forty percent disagree that the market will adequately provide for affordable housing needs, while only 15 percent believe that the market will meet these needs. Approximately 43 percent indicated that government should help to provide some solutions, while 15 percent favored less or no government intervention. Figure 15 Opinions of Housing Conditions in Chaffee County Chaffee County Housing Needs Assessment
0%
5%
10%
15%
20%
25%
30%
35%
40%
45%
50%
Strongly Disagree Somewhat Disagree Somewhat Agree Strongly Agree
Perc
ent o
f Res
pons
es
Government should help with solutions
Market forces will address housing and employment needs
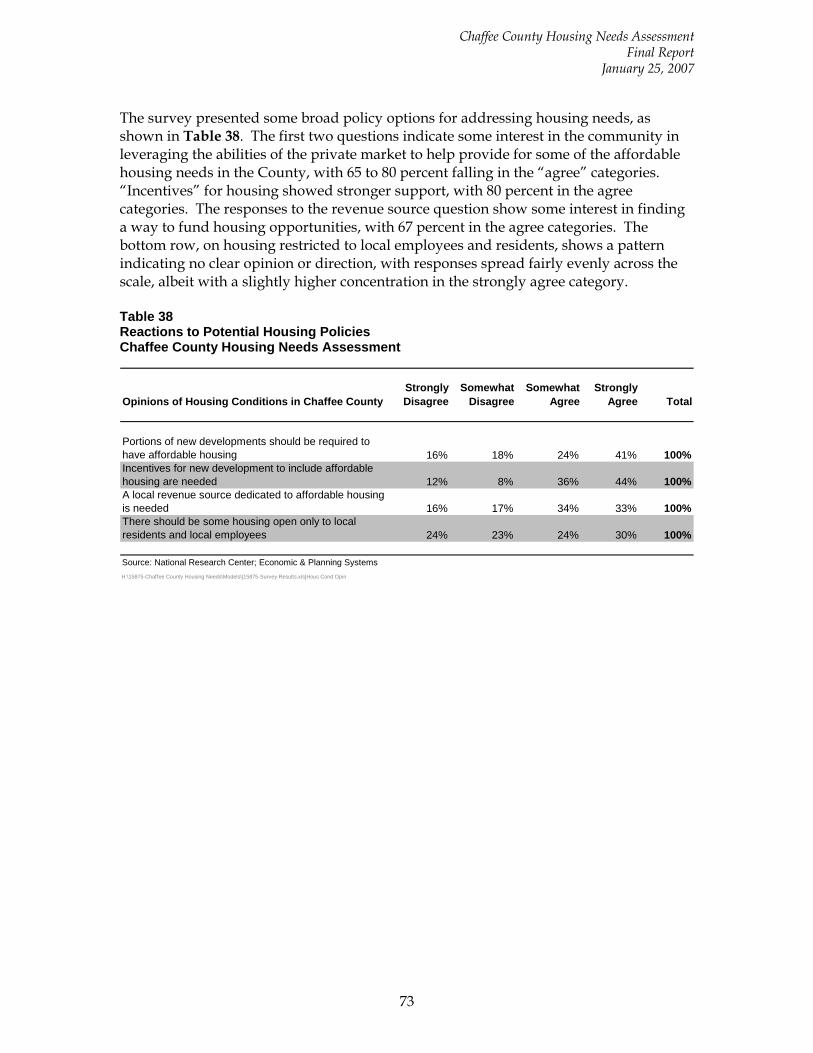
Chaffee County Housing Needs Assessment Final Report
January 25, 2007
73
The survey presented some broad policy options for addressing housing needs, as shown in Table 38. The first two questions indicate some interest in the community in leveraging the abilities of the private market to help provide for some of the affordable housing needs in the County, with 65 to 80 percent falling in the “agree” categories. “Incentives” for housing showed stronger support, with 80 percent in the agree categories. The responses to the revenue source question show some interest in finding a way to fund housing opportunities, with 67 percent in the agree categories. The bottom row, on housing restricted to local employees and residents, shows a pattern indicating no clear opinion or direction, with responses spread fairly evenly across the scale, albeit with a slightly higher concentration in the strongly agree category. Table 38 Reactions to Potential Housing Policies Chaffee County Housing Needs Assessment
Opinions of Housing Conditions in Chaffee CountyStrongly Disagree
Somewhat Disagree
Somewhat Agree
Strongly Agree Total
Portions of new developments should be required to have affordable housing 16% 18% 24% 41% 100%Incentives for new development to include affordable housing are needed 12% 8% 36% 44% 100%A local revenue source dedicated to affordable housing is needed 16% 17% 34% 33% 100%There should be some housing open only to local residents and local employees 24% 23% 24% 30% 100%
Source: National Research Center; Economic & Planning SystemsH:\15875-Chaffee County Housing Needs\Models\[15875-Survey Results.xls]Hous Cond Opin
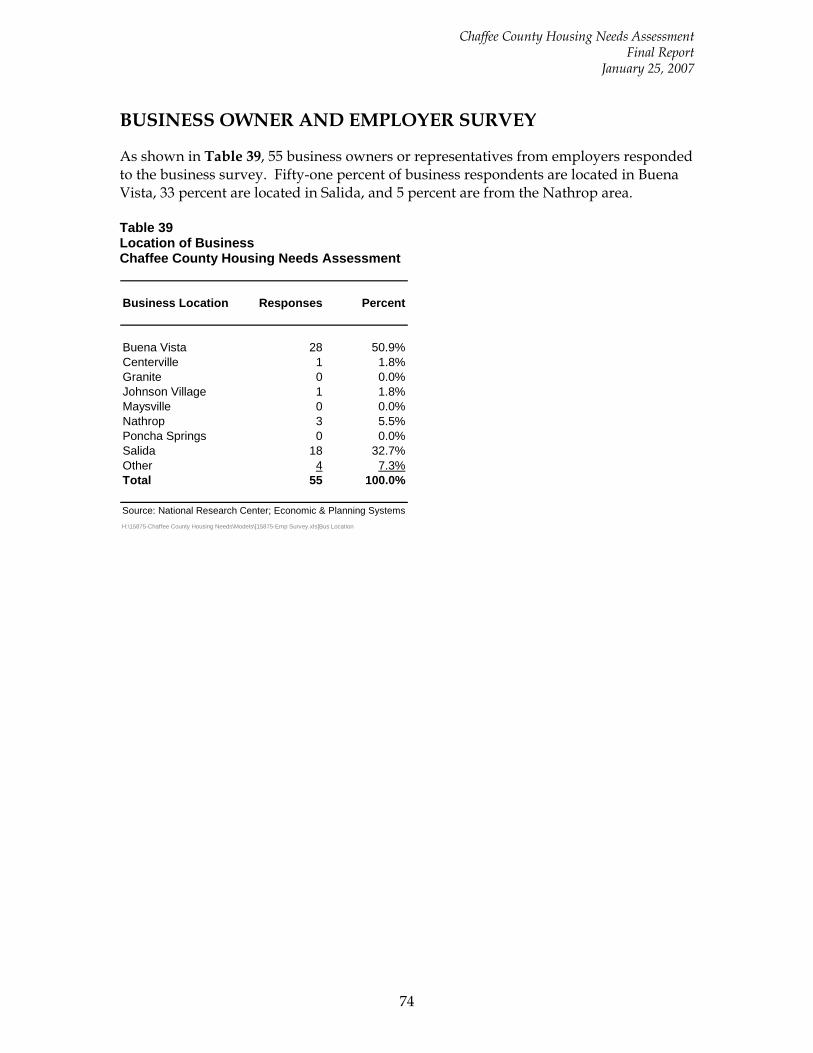
Chaffee County Housing Needs Assessment Final Report
January 25, 2007
74
BUSINESS OWNER AND EMPLOYER SURVEY
As shown in Table 39, 55 business owners or representatives from employers responded to the business survey. Fifty-one percent of business respondents are located in Buena Vista, 33 percent are located in Salida, and 5 percent are from the Nathrop area. Table 39 Location of Business Chaffee County Housing Needs Assessment
Business Location Responses Percent
Buena Vista 28 50.9%Centerville 1 1.8%Granite 0 0.0%Johnson Village 1 1.8%Maysville 0 0.0%Nathrop 3 5.5%Poncha Springs 0 0.0%Salida 18 32.7%Other 4 7.3%Total 55 100.0%
Source: National Research Center; Economic & Planning SystemsH:\15875-Chaffee County Housing Needs\Models\[15875-Emp Survey.xls]Bus Location
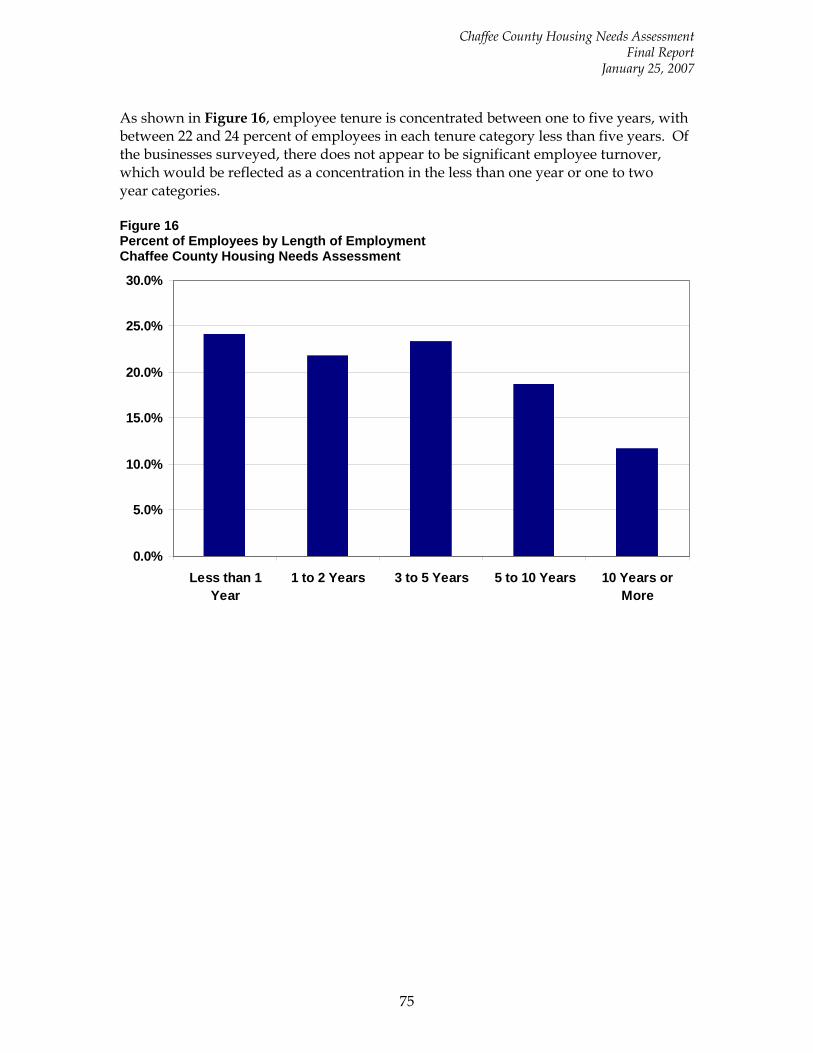
Chaffee County Housing Needs Assessment Final Report
January 25, 2007
75
As shown in Figure 16, employee tenure is concentrated between one to five years, with between 22 and 24 percent of employees in each tenure category less than five years. Of the businesses surveyed, there does not appear to be significant employee turnover, which would be reflected as a concentration in the less than one year or one to two year categories. Figure 16 Percent of Employees by Length of Employment Chaffee County Housing Needs Assessment
0.0%
5.0%
10.0%
15.0%
20.0%
25.0%
30.0%
Less than 1Year
1 to 2 Years 3 to 5 Years 5 to 10 Years 10 Years orMore
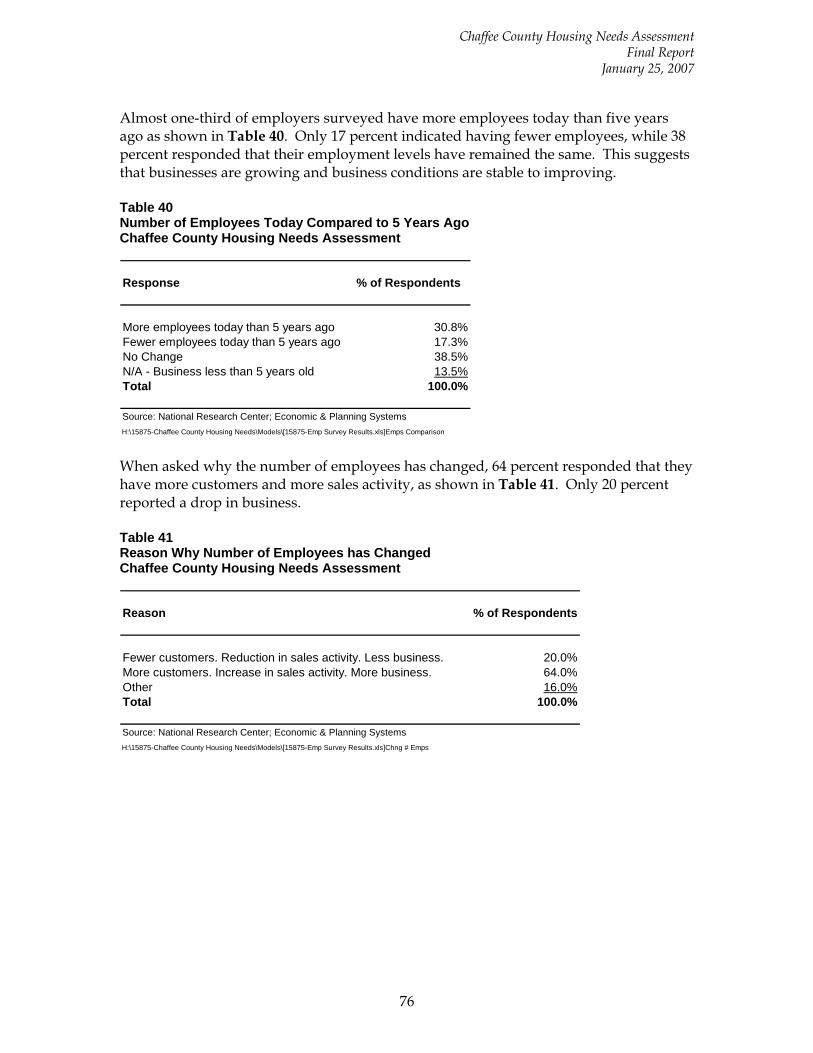
Chaffee County Housing Needs Assessment Final Report
January 25, 2007
76
Almost one-third of employers surveyed have more employees today than five years ago as shown in Table 40. Only 17 percent indicated having fewer employees, while 38 percent responded that their employment levels have remained the same. This suggests that businesses are growing and business conditions are stable to improving. Table 40 Number of Employees Today Compared to 5 Years Ago Chaffee County Housing Needs Assessment
Response % of Respondents
More employees today than 5 years ago 30.8%Fewer employees today than 5 years ago 17.3%No Change 38.5%N/A - Business less than 5 years old 13.5%Total 100.0%
Source: National Research Center; Economic & Planning SystemsH:\15875-Chaffee County Housing Needs\Models\[15875-Emp Survey Results.xls]Emps Comparison When asked why the number of employees has changed, 64 percent responded that they have more customers and more sales activity, as shown in Table 41. Only 20 percent reported a drop in business. Table 41 Reason Why Number of Employees has Changed Chaffee County Housing Needs Assessment
Reason % of Respondents
Fewer customers. Reduction in sales activity. Less business. 20.0%More customers. Increase in sales activity. More business. 64.0%Other 16.0%Total 100.0%
Source: National Research Center; Economic & Planning SystemsH:\15875-Chaffee County Housing Needs\Models\[15875-Emp Survey Results.xls]Chng # Emps
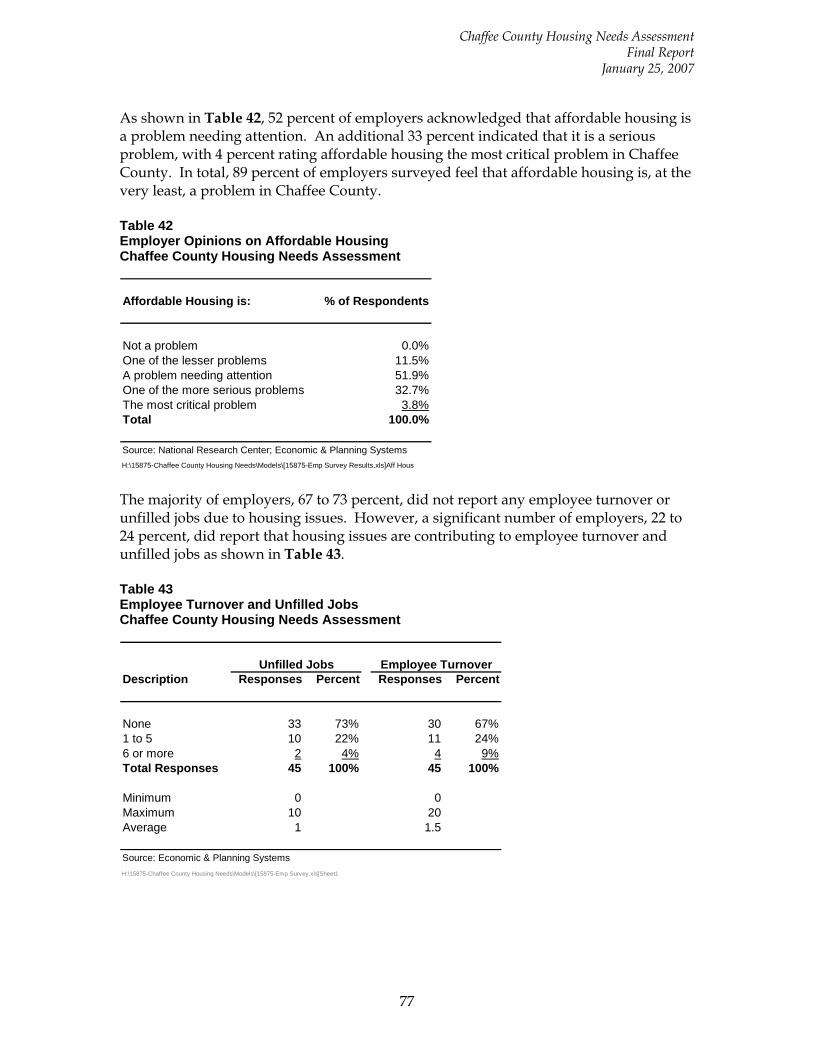
Chaffee County Housing Needs Assessment Final Report
January 25, 2007
77
As shown in Table 42, 52 percent of employers acknowledged that affordable housing is a problem needing attention. An additional 33 percent indicated that it is a serious problem, with 4 percent rating affordable housing the most critical problem in Chaffee County. In total, 89 percent of employers surveyed feel that affordable housing is, at the very least, a problem in Chaffee County. Table 42 Employer Opinions on Affordable Housing Chaffee County Housing Needs Assessment
Affordable Housing is: % of Respondents
Not a problem 0.0%One of the lesser problems 11.5%A problem needing attention 51.9%One of the more serious problems 32.7%The most critical problem 3.8%Total 100.0%
Source: National Research Center; Economic & Planning SystemsH:\15875-Chaffee County Housing Needs\Models\[15875-Emp Survey Results.xls]Aff Hous The majority of employers, 67 to 73 percent, did not report any employee turnover or unfilled jobs due to housing issues. However, a significant number of employers, 22 to 24 percent, did report that housing issues are contributing to employee turnover and unfilled jobs as shown in Table 43. Table 43 Employee Turnover and Unfilled Jobs Chaffee County Housing Needs Assessment
Description Responses Percent Responses Percent
None 33 73% 30 67%1 to 5 10 22% 11 24%6 or more 2 4% 4 9%Total Responses 45 100% 45 100%
Minimum 0 0Maximum 10 20Average 1 1.5
Source: Economic & Planning SystemsH:\15875-Chaffee County Housing Needs\Models\[15875-Emp Survey.xls]Sheet1
Unfilled Jobs Employee Turnover
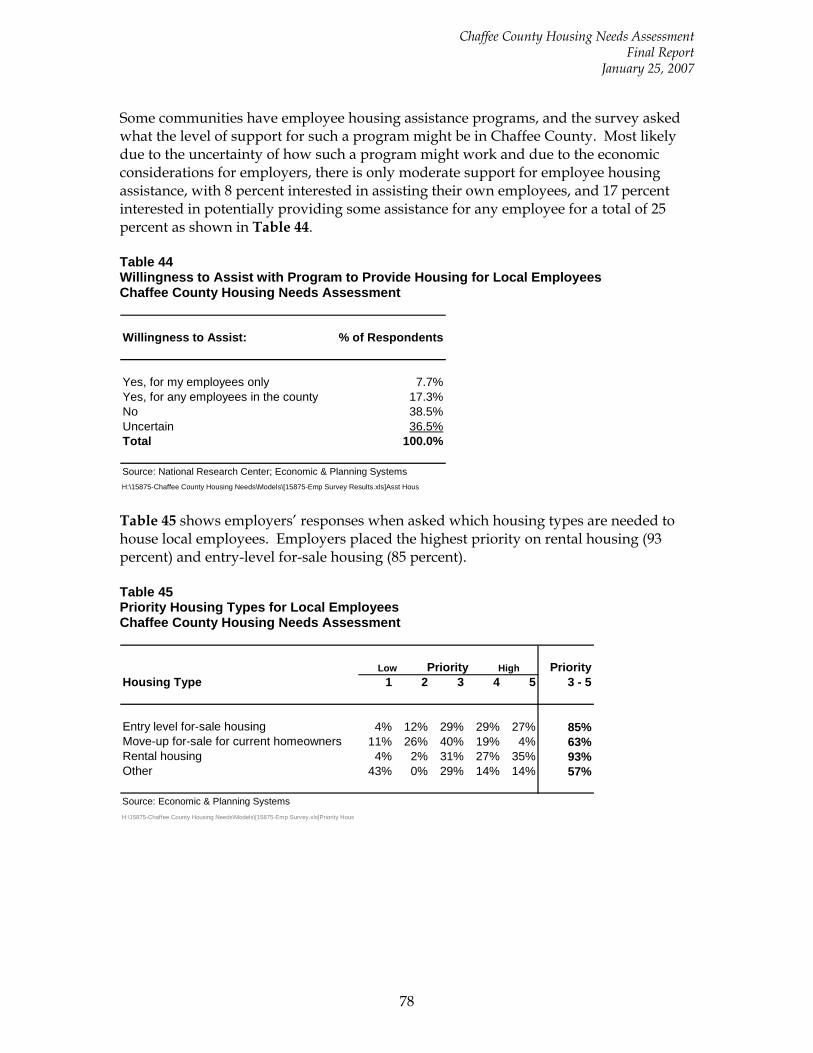
Chaffee County Housing Needs Assessment Final Report
January 25, 2007
78
Some communities have employee housing assistance programs, and the survey asked what the level of support for such a program might be in Chaffee County. Most likely due to the uncertainty of how such a program might work and due to the economic considerations for employers, there is only moderate support for employee housing assistance, with 8 percent interested in assisting their own employees, and 17 percent interested in potentially providing some assistance for any employee for a total of 25 percent as shown in Table 44. Table 44 Willingness to Assist with Program to Provide Housing for Local Employees Chaffee County Housing Needs Assessment
Willingness to Assist: % of Respondents
Yes, for my employees only 7.7%Yes, for any employees in the county 17.3%No 38.5%Uncertain 36.5%Total 100.0%
Source: National Research Center; Economic & Planning SystemsH:\15875-Chaffee County Housing Needs\Models\[15875-Emp Survey Results.xls]Asst Hous Table 45 shows employers’ responses when asked which housing types are needed to house local employees. Employers placed the highest priority on rental housing (93 percent) and entry-level for-sale housing (85 percent). Table 45 Priority Housing Types for Local Employees Chaffee County Housing Needs Assessment
PriorityHousing Type 1 2 3 4 5 3 - 5
Entry level for-sale housing 4% 12% 29% 29% 27% 85%Move-up for-sale for current homeowners 11% 26% 40% 19% 4% 63%Rental housing 4% 2% 31% 27% 35% 93%Other 43% 0% 29% 14% 14% 57%
Source: Economic & Planning SystemsH:\15875-Chaffee County Housing Needs\Models\[15875-Emp Survey.xls]Priority Hous
Low Priority High
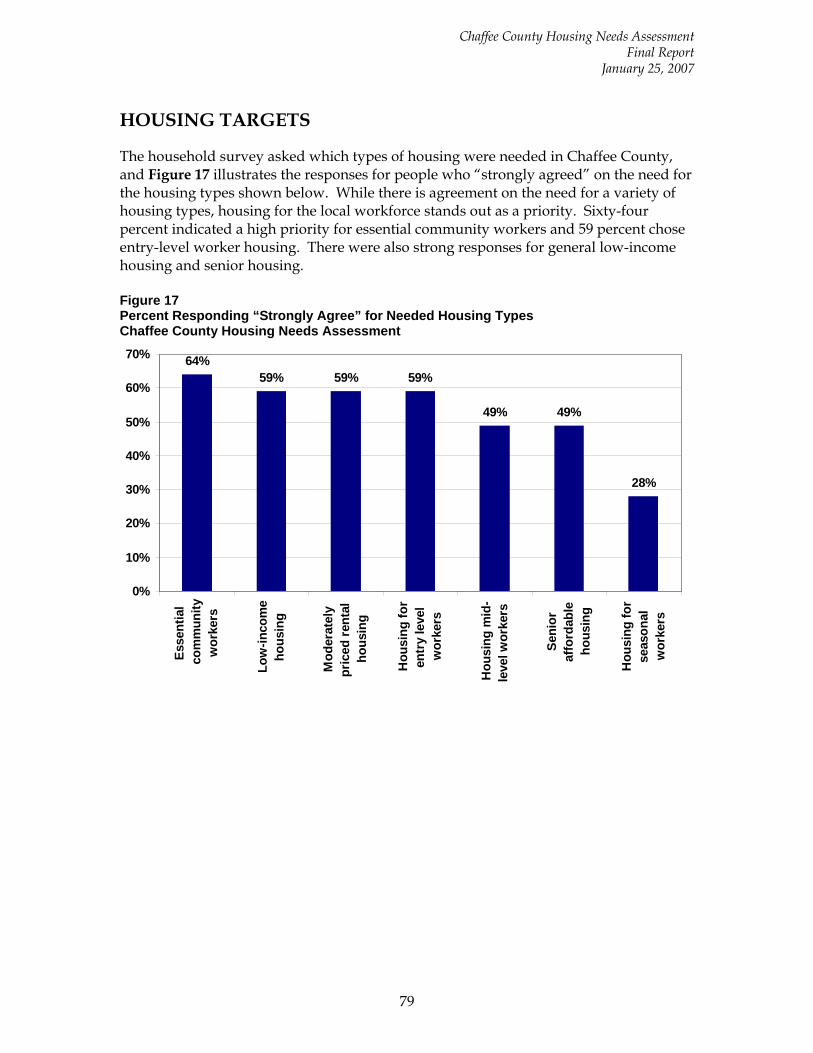
Chaffee County Housing Needs Assessment Final Report
January 25, 2007
79
HOUSING TARGETS
The household survey asked which types of housing were needed in Chaffee County, and Figure 17 illustrates the responses for people who “strongly agreed” on the need for the housing types shown below. While there is agreement on the need for a variety of housing types, housing for the local workforce stands out as a priority. Sixty-four percent indicated a high priority for essential community workers and 59 percent chose entry-level worker housing. There were also strong responses for general low-income housing and senior housing. Figure 17 Percent Responding “Strongly Agree” for Needed Housing Types Chaffee County Housing Needs Assessment
64%59% 59% 59%
49% 49%
28%
0%
10%
20%
30%
40%
50%
60%
70%
Esse
ntia
lco
mm
unity
wor
kers
Low
-inco
me
hous
ing
Mod
erat
ely
pric
ed re
ntal
hous
ing
Hou
sing
for
entr
y le
vel
wor
kers
Hou
sing
mid
-le
vel w
orke
rs
Seni
oraf
ford
able
hous
ing
Hou
sing
for
seas
onal
wor
kers
Chaffee County Housing Needs Assessment Final Report
January 25, 2007
80
Comparing the interest in rental or for-sale housing indicates slightly stronger interest in for-sale housing, as shown in Table 46. Approximately 27 percent of renters and owners chose ownership (for-sale) housing, compared to the lower responses for rental housing. Six percent of owners indicated a need for more rental housing, while predictably 15 percent of renters expressed a need for more rental housing. The high responses for the “both” choice shows the communities view that there are broad housing needs and issues. Table 46 Rental vs. Ownership Housing Policy Chaffee County Housing Needs Assessment
Home Owners Renters
Rental units 6.1% 15.2%Ownership housing 27.6% 26.8%Both 61.1% 56.5%None of the above 5.3% 1.4%Total 100.0% 100.0%
Source: National Research Center; Economic & Planning SystemsH:\15875-Chaffee County Housing Needs\Models\[15875-Survey Results.xls]Hous Res. x Tenure
ResponsesIf additional resources are made available for housing, how should they be allocated?
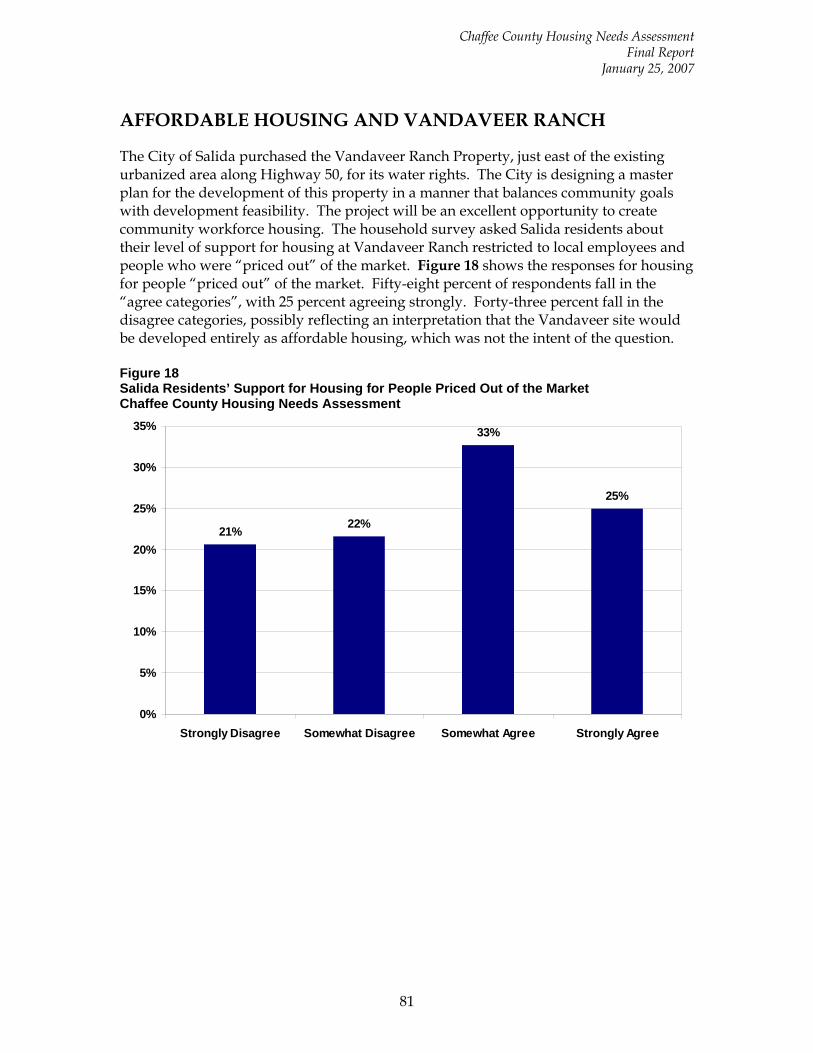
Chaffee County Housing Needs Assessment Final Report
January 25, 2007
81
AFFORDABLE HOUSING AND VANDAVEER RANCH
The City of Salida purchased the Vandaveer Ranch Property, just east of the existing urbanized area along Highway 50, for its water rights. The City is designing a master plan for the development of this property in a manner that balances community goals with development feasibility. The project will be an excellent opportunity to create community workforce housing. The household survey asked Salida residents about their level of support for housing at Vandaveer Ranch restricted to local employees and people who were “priced out” of the market. Figure 18 shows the responses for housing for people “priced out” of the market. Fifty-eight percent of respondents fall in the “agree categories”, with 25 percent agreeing strongly. Forty-three percent fall in the disagree categories, possibly reflecting an interpretation that the Vandaveer site would be developed entirely as affordable housing, which was not the intent of the question. Figure 18 Salida Residents’ Support for Housing for People Priced Out of the Market Chaffee County Housing Needs Assessment
21% 22%
33%
25%
0%
5%
10%
15%
20%
25%
30%
35%
Strongly Disagree Somewhat Disagree Somewhat Agree Strongly Agree
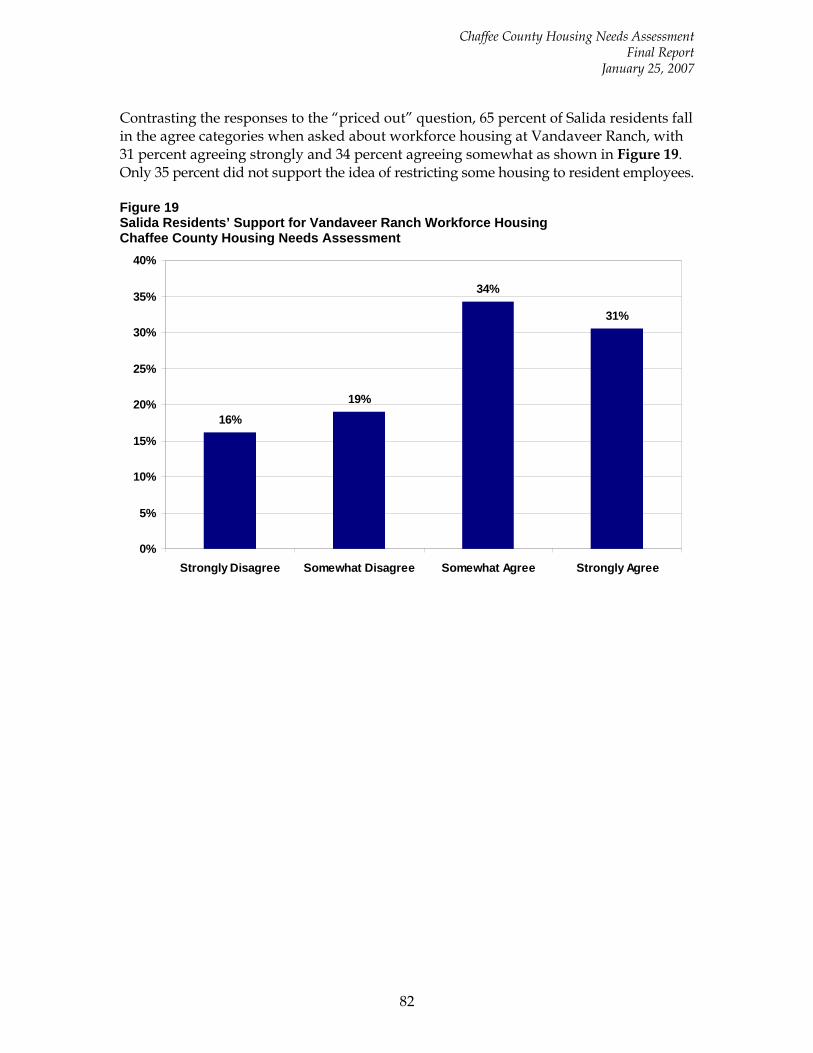
Chaffee County Housing Needs Assessment Final Report
January 25, 2007
82
Contrasting the responses to the “priced out” question, 65 percent of Salida residents fall in the agree categories when asked about workforce housing at Vandaveer Ranch, with 31 percent agreeing strongly and 34 percent agreeing somewhat as shown in Figure 19. Only 35 percent did not support the idea of restricting some housing to resident employees. Figure 19 Salida Residents’ Support for Vandaveer Ranch Workforce Housing Chaffee County Housing Needs Assessment
16%19%
34%
31%
0%
5%
10%
15%
20%
25%
30%
35%
40%
Strongly Disagree Somewhat Disagree Somewhat Agree Strongly Agree
83
VI. HOUSING NEEDS
This final chapter estimates the housing needs for Chaffee County by income level and by housing type (rental vs. for-sale). This chapter, along with the economic conditions in the County, and information in the Community Themes chapter, form the basis for policy recommendations found in the Action Plan in Chapter I. The chapter is divided into three sections: Housing Indicators – Compares the growth in home prices to wage growth.
Cost Burden – Provides estimates of the percent of households in Chaffee County paying more than 30 percent of income towards housing.
Household Composition and Income – Provides additional data on household composition by Area Median Income (AMI) level.
Housing Gap Analysis – Estimates housing needs and gaps by AMI level for rental and for-sale housing.
HOUSING INDICATORS
A key indicator of housing affordability is the relationship between home prices and wages. Wages are the largest component of household income for most people, and household income determines what one can afford to pay for a home. In an ideal market, wages and housing costs would be correlated. In 1998, the average wage was 15.5 percent of the average home price as shown in Table 47. One person earning the average wage in 1998 could afford a mortgage of approximately $74,000 per year, and two people earning the average wage could afford approximately $150,000. With an average home price of $127,000 in 1998, 1.6 average jobs per household were required to afford a typical home. Based on the average price of $232,000 in 2005, 2.3 jobs paying the average wage would be required to afford a typical home in Chaffee County. As discussed previously, home prices have been increasing at approximately 10 percent per year since 1998. However, wages have increased at only 3.6 percent per year, and the average wage is now 11 percent of the average home price. If this trend continues, there could be a large affordability gap for local resident wage earners. It should be noted that there is currently a reasonable inventory of new homes priced at or below $200,000. However, given the trend of increasing prices, this segment of affordability is likely to diminish.
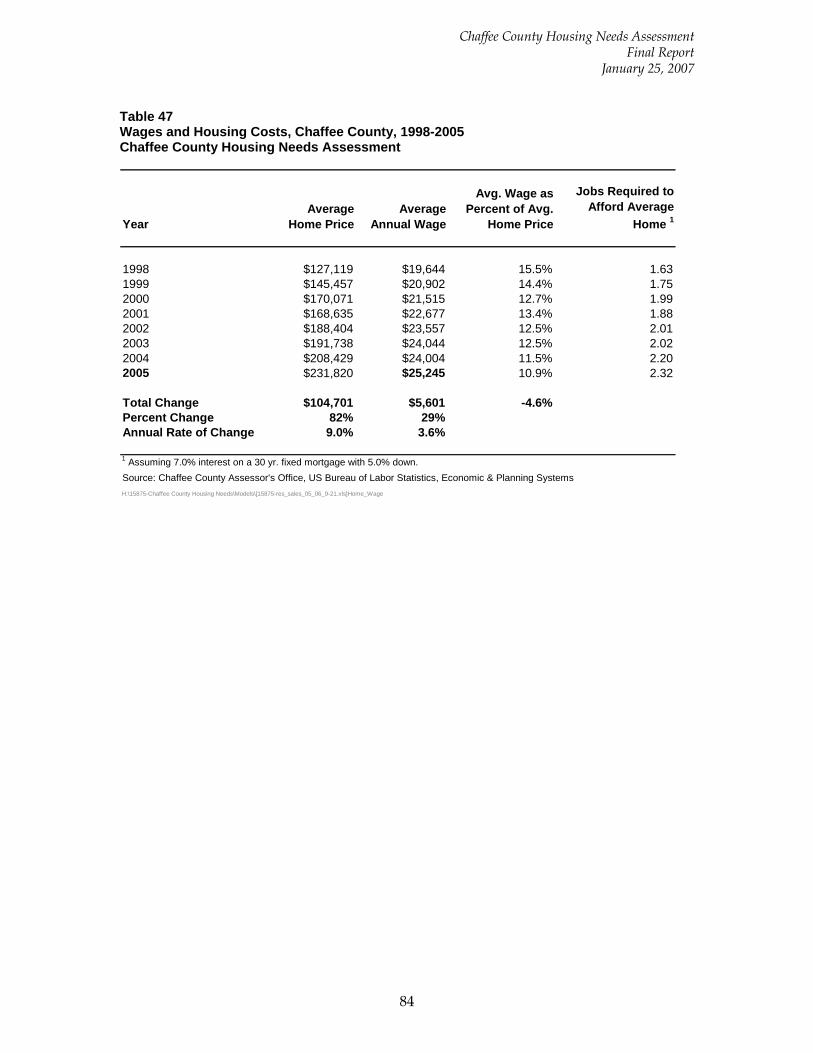
Chaffee County Housing Needs Assessment Final Report
January 25, 2007
84
Table 47 Wages and Housing Costs, Chaffee County, 1998-2005 Chaffee County Housing Needs Assessment
YearAverage
Home PriceAverage
Annual Wage
Avg. Wage as Percent of Avg.
Home Price
Jobs Required to Afford Average
Home 1
1998 $127,119 $19,644 15.5% 1.631999 $145,457 $20,902 14.4% 1.752000 $170,071 $21,515 12.7% 1.992001 $168,635 $22,677 13.4% 1.882002 $188,404 $23,557 12.5% 2.012003 $191,738 $24,044 12.5% 2.022004 $208,429 $24,004 11.5% 2.202005 $231,820 $25,245 10.9% 2.32
Total Change $104,701 $5,601 -4.6%Percent Change 82% 29%Annual Rate of Change 9.0% 3.6%
1 Assuming 7.0% interest on a 30 yr. fixed mortgage with 5.0% down.Source: Chaffee County Assessor's Office, US Bureau of Labor Statistics, Economic & Planning SystemsH:\15875-Chaffee County Housing Needs\Models\[15875-res_sales_05_06_9-21.xls]Home_Wage
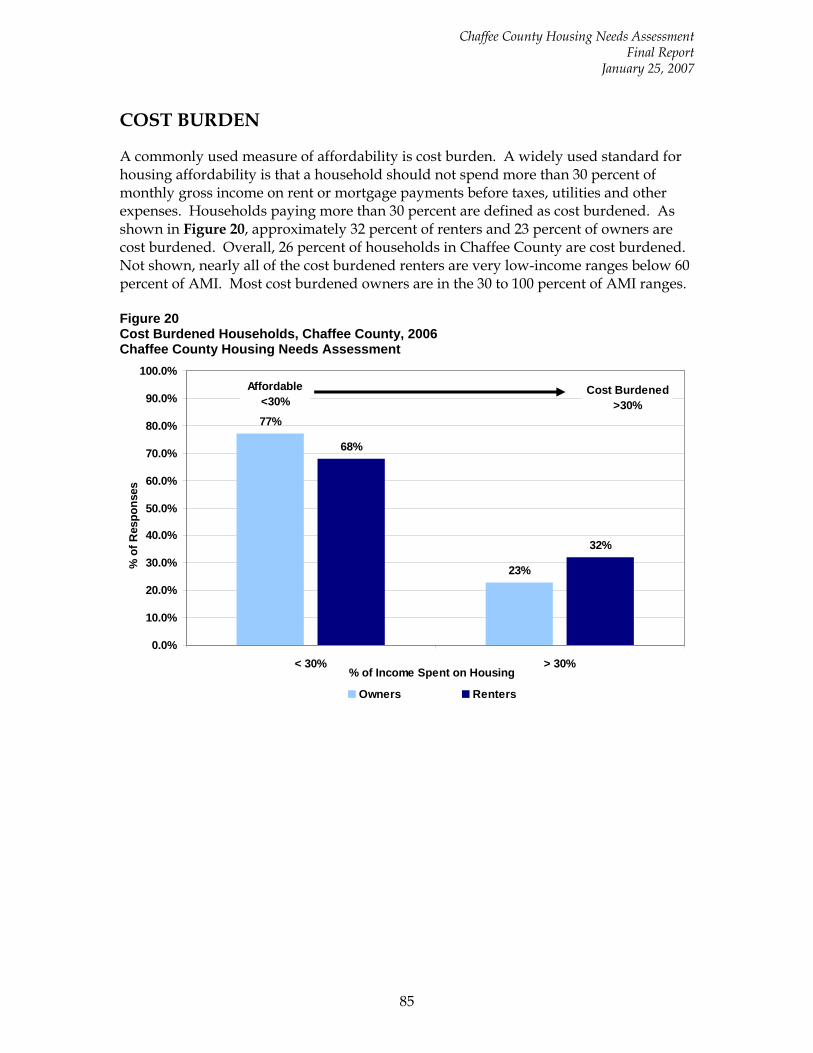
Chaffee County Housing Needs Assessment Final Report
January 25, 2007
85
COST BURDEN
A commonly used measure of affordability is cost burden. A widely used standard for housing affordability is that a household should not spend more than 30 percent of monthly gross income on rent or mortgage payments before taxes, utilities and other expenses. Households paying more than 30 percent are defined as cost burdened. As shown in Figure 20, approximately 32 percent of renters and 23 percent of owners are cost burdened. Overall, 26 percent of households in Chaffee County are cost burdened. Not shown, nearly all of the cost burdened renters are very low-income ranges below 60 percent of AMI. Most cost burdened owners are in the 30 to 100 percent of AMI ranges. Figure 20 Cost Burdened Households, Chaffee County, 2006 Chaffee County Housing Needs Assessment
77%
23%
68%
32%
0.0%
10.0%
20.0%
30.0%
40.0%
50.0%
60.0%
70.0%
80.0%
90.0%
100.0%
< 30% > 30%% of Income Spent on Housing
% o
f Res
pons
es
Owners Renters
Affordable<30%
Cost Burdened>30%
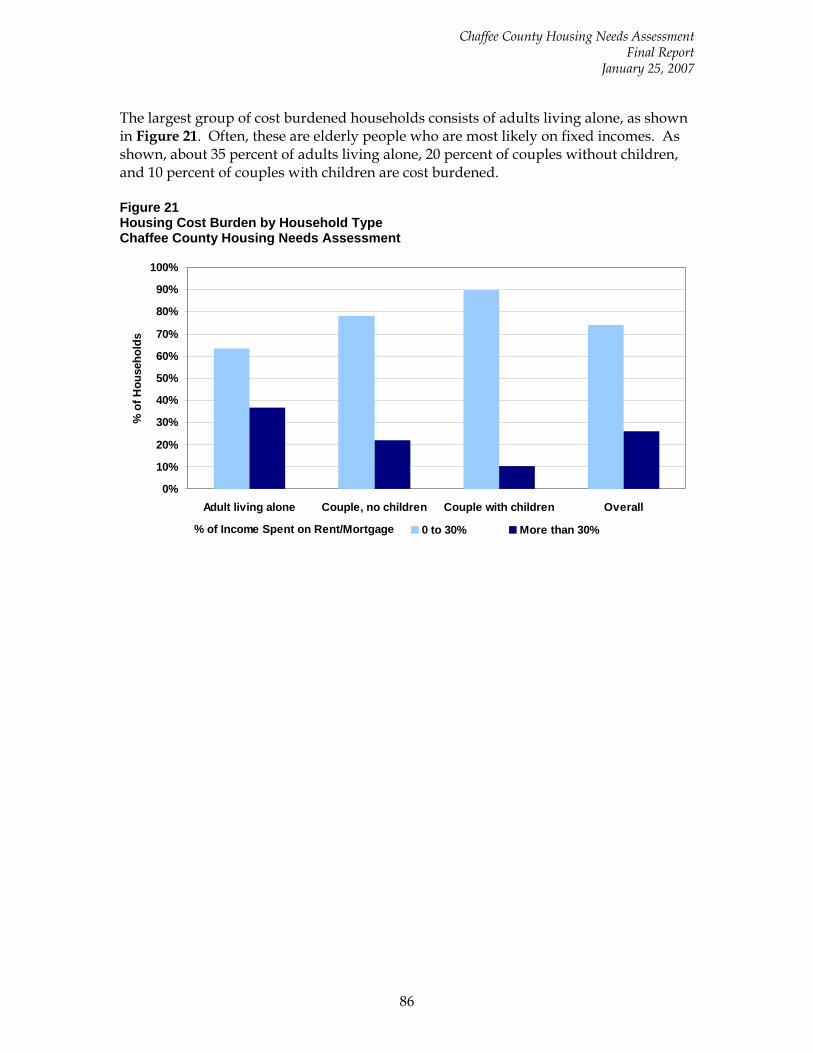
Chaffee County Housing Needs Assessment Final Report
January 25, 2007
86
The largest group of cost burdened households consists of adults living alone, as shown in Figure 21. Often, these are elderly people who are most likely on fixed incomes. As shown, about 35 percent of adults living alone, 20 percent of couples without children, and 10 percent of couples with children are cost burdened. Figure 21 Housing Cost Burden by Household Type Chaffee County Housing Needs Assessment
0%
10%
20%
30%
40%
50%
60%
70%
80%
90%
100%
Adult living alone Couple, no children Couple with children Overall
% o
f Hou
seho
lds
0 to 30% More than 30%% of Income Spent on Rent/Mortgage
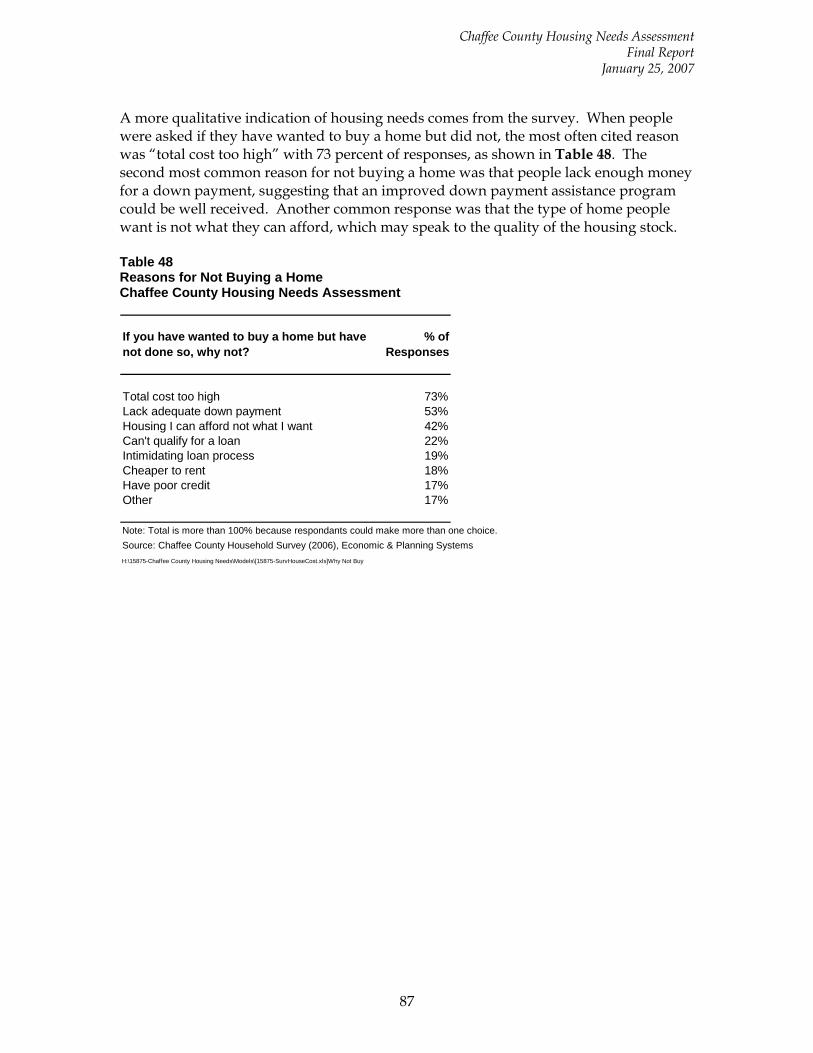
Chaffee County Housing Needs Assessment Final Report
January 25, 2007
87
A more qualitative indication of housing needs comes from the survey. When people were asked if they have wanted to buy a home but did not, the most often cited reason was “total cost too high” with 73 percent of responses, as shown in Table 48. The second most common reason for not buying a home was that people lack enough money for a down payment, suggesting that an improved down payment assistance program could be well received. Another common response was that the type of home people want is not what they can afford, which may speak to the quality of the housing stock. Table 48 Reasons for Not Buying a Home Chaffee County Housing Needs Assessment
If you have wanted to buy a home but have not done so, why not?
% of Responses
Total cost too high 73%Lack adequate down payment 53%Housing I can afford not what I want 42%Can't qualify for a loan 22%Intimidating loan process 19%Cheaper to rent 18%Have poor credit 17%Other 17%
Note: Total is more than 100% because respondants could make more than one choice.Source: Chaffee County Household Survey (2006), Economic & Planning SystemsH:\15875-Chaffee County Housing Needs\Models\[15875-SurvHouseCost.xls]Why Not Buy
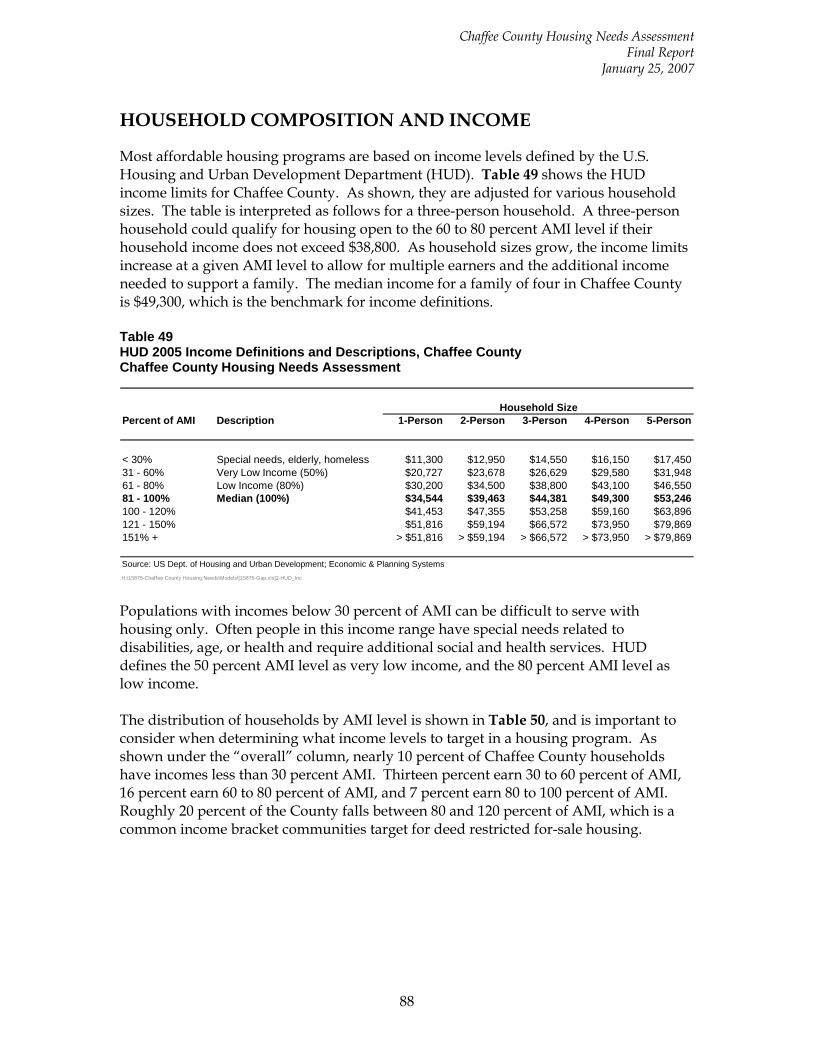
Chaffee County Housing Needs Assessment Final Report
January 25, 2007
88
HOUSEHOLD COMPOSITION AND INCOME
Most affordable housing programs are based on income levels defined by the U.S. Housing and Urban Development Department (HUD). Table 49 shows the HUD income limits for Chaffee County. As shown, they are adjusted for various household sizes. The table is interpreted as follows for a three-person household. A three-person household could qualify for housing open to the 60 to 80 percent AMI level if their household income does not exceed $38,800. As household sizes grow, the income limits increase at a given AMI level to allow for multiple earners and the additional income needed to support a family. The median income for a family of four in Chaffee County is $49,300, which is the benchmark for income definitions. Table 49 HUD 2005 Income Definitions and Descriptions, Chaffee County Chaffee County Housing Needs Assessment
Percent of AMI Description 1-Person 2-Person 3-Person 4-Person 5-Person
< 30% Special needs, elderly, homeless $11,300 $12,950 $14,550 $16,150 $17,45031 - 60% Very Low Income (50%) $20,727 $23,678 $26,629 $29,580 $31,94861 - 80% Low Income (80%) $30,200 $34,500 $38,800 $43,100 $46,55081 - 100% Median (100%) $34,544 $39,463 $44,381 $49,300 $53,246100 - 120% $41,453 $47,355 $53,258 $59,160 $63,896121 - 150% $51,816 $59,194 $66,572 $73,950 $79,869151% + > $51,816 > $59,194 > $66,572 > $73,950 > $79,869
Source: US Dept. of Housing and Urban Development; Economic & Planning SystemsH:\15875-Chaffee County Housing Needs\Models\[15875-Gap.xls]2-HUD_Inc
Household Size
Populations with incomes below 30 percent of AMI can be difficult to serve with housing only. Often people in this income range have special needs related to disabilities, age, or health and require additional social and health services. HUD defines the 50 percent AMI level as very low income, and the 80 percent AMI level as low income. The distribution of households by AMI level is shown in Table 50, and is important to consider when determining what income levels to target in a housing program. As shown under the “overall” column, nearly 10 percent of Chaffee County households have incomes less than 30 percent AMI. Thirteen percent earn 30 to 60 percent of AMI, 16 percent earn 60 to 80 percent of AMI, and 7 percent earn 80 to 100 percent of AMI. Roughly 20 percent of the County falls between 80 and 120 percent of AMI, which is a common income bracket communities target for deed restricted for-sale housing.
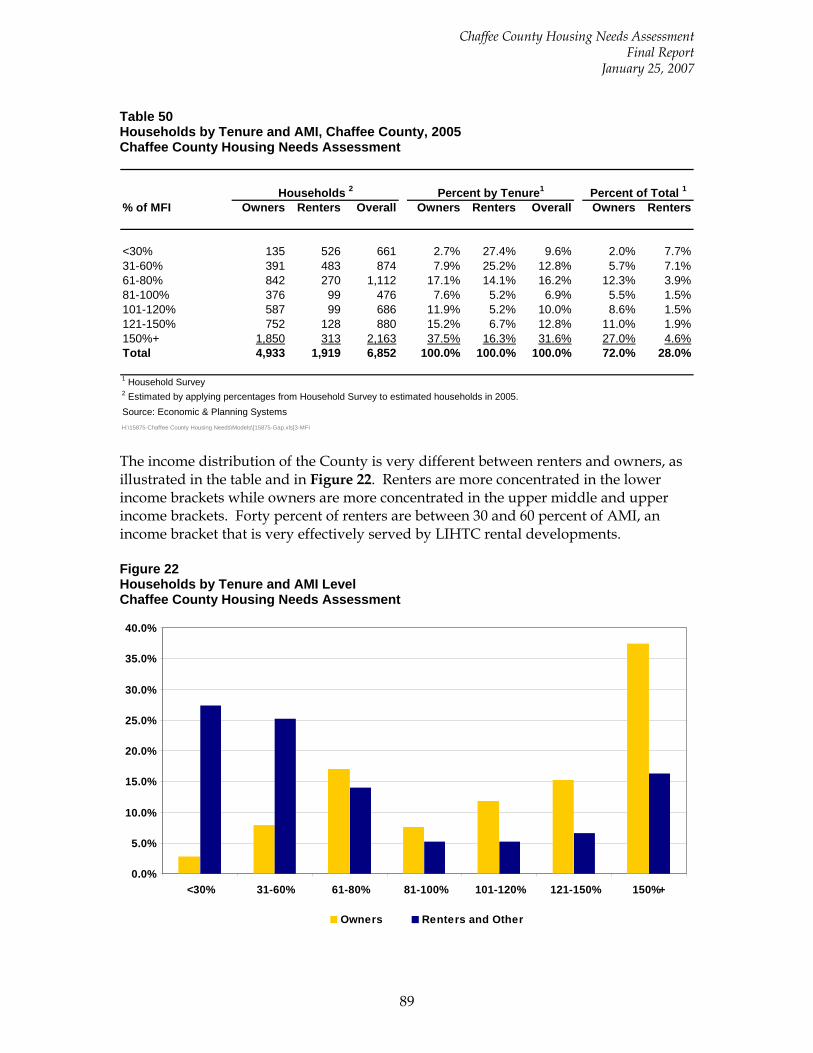
Chaffee County Housing Needs Assessment Final Report
January 25, 2007
89
Table 50 Households by Tenure and AMI, Chaffee County, 2005 Chaffee County Housing Needs Assessment
% of MFI Owners Renters Overall Owners Renters Overall Owners Renters
<30% 135 526 661 2.7% 27.4% 9.6% 2.0% 7.7%31-60% 391 483 874 7.9% 25.2% 12.8% 5.7% 7.1%61-80% 842 270 1,112 17.1% 14.1% 16.2% 12.3% 3.9%81-100% 376 99 476 7.6% 5.2% 6.9% 5.5% 1.5%101-120% 587 99 686 11.9% 5.2% 10.0% 8.6% 1.5%121-150% 752 128 880 15.2% 6.7% 12.8% 11.0% 1.9%150%+ 1,850 313 2,163 37.5% 16.3% 31.6% 27.0% 4.6%Total 4,933 1,919 6,852 100.0% 100.0% 100.0% 72.0% 28.0%
1 Household Survey2 Estimated by applying percentages from Household Survey to estimated households in 2005.Source: Economic & Planning SystemsH:\15875-Chaffee County Housing Needs\Models\[15875-Gap.xls]3-MFI
Percent by Tenure1Households 2 Percent of Total 1
The income distribution of the County is very different between renters and owners, as illustrated in the table and in Figure 22. Renters are more concentrated in the lower income brackets while owners are more concentrated in the upper middle and upper income brackets. Forty percent of renters are between 30 and 60 percent of AMI, an income bracket that is very effectively served by LIHTC rental developments. Figure 22 Households by Tenure and AMI Level Chaffee County Housing Needs Assessment
0.0%
5.0%
10.0%
15.0%
20.0%
25.0%
30.0%
35.0%
40.0%
<30% 31-60% 61-80% 81-100% 101-120% 121-150% 150%+
Owners Renters and Other
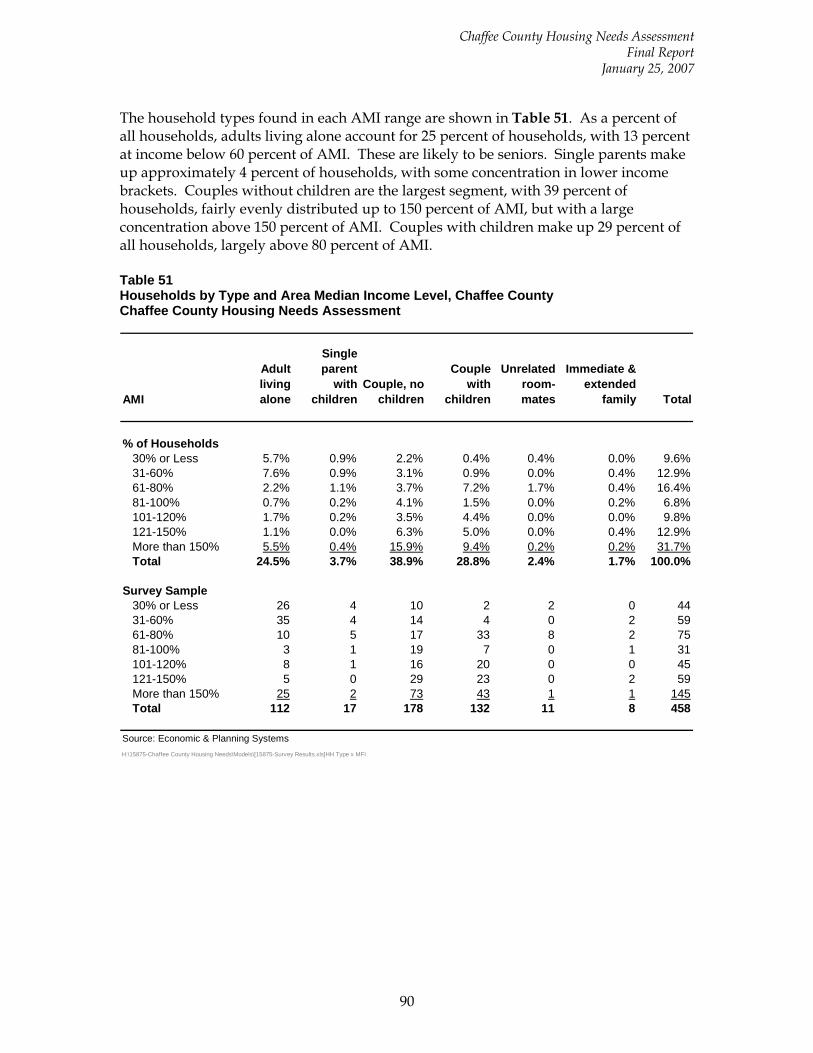
Chaffee County Housing Needs Assessment Final Report
January 25, 2007
90
The household types found in each AMI range are shown in Table 51. As a percent of all households, adults living alone account for 25 percent of households, with 13 percent at income below 60 percent of AMI. These are likely to be seniors. Single parents make up approximately 4 percent of households, with some concentration in lower income brackets. Couples without children are the largest segment, with 39 percent of households, fairly evenly distributed up to 150 percent of AMI, but with a large concentration above 150 percent of AMI. Couples with children make up 29 percent of all households, largely above 80 percent of AMI. Table 51 Households by Type and Area Median Income Level, Chaffee County Chaffee County Housing Needs Assessment
AMI
Adult living alone
Single parent
with children
Couple, no children
Couple with
children
Unrelated room- mates
Immediate & extended
family Total
% of Households30% or Less 5.7% 0.9% 2.2% 0.4% 0.4% 0.0% 9.6%31-60% 7.6% 0.9% 3.1% 0.9% 0.0% 0.4% 12.9%61-80% 2.2% 1.1% 3.7% 7.2% 1.7% 0.4% 16.4%81-100% 0.7% 0.2% 4.1% 1.5% 0.0% 0.2% 6.8%101-120% 1.7% 0.2% 3.5% 4.4% 0.0% 0.0% 9.8%121-150% 1.1% 0.0% 6.3% 5.0% 0.0% 0.4% 12.9%More than 150% 5.5% 0.4% 15.9% 9.4% 0.2% 0.2% 31.7%Total 24.5% 3.7% 38.9% 28.8% 2.4% 1.7% 100.0%
Survey Sample30% or Less 26 4 10 2 2 0 4431-60% 35 4 14 4 0 2 5961-80% 10 5 17 33 8 2 7581-100% 3 1 19 7 0 1 31101-120% 8 1 16 20 0 0 45121-150% 5 0 29 23 0 2 59More than 150% 25 2 73 43 1 1 145Total 112 17 178 132 11 8 458
Source: Economic & Planning SystemsH:\15875-Chaffee County Housing Needs\Models\[15875-Survey Results.xls]HH Type x MFI
Chaffee County Housing Needs Assessment Final Report
January 25, 2007
91
HOUSING GAP ANALYSIS
The housing gap analysis is a way of evaluating how well housing prices and rents match the distribution of households in different income ranges. The first step in a gap analysis is to estimate how much a household in a given income range can afford in a housing payment. The second step is to estimate the percentages of housing units that fall within the target price ranges, and compare it to the percentages of households within the corresponding income ranges. If there are a higher percentage of units compared to households, the housing stock is generally affordable to that income range. If the percentages of housing units are lower compared to households (more households than units at that price), it indicates an affordability gap. While the gap analysis is useful, it must be interpreted carefully and should not generally be used to estimate a number of units needed, but rather as an overall gauge of how well the housing stock is matched to local household incomes.
OWNERSHIP HOUSING GAP ANALYSIS
The HUD income definitions by AMI level for Chaffee County (Appendix Table A-1) are interpolated for an average household size of 2.5 and listed in Table 52. Experience has shown that deed restricted for-sale housing is the most feasible in the 80 to 120 percent AMI ranges, therefore the lowest income ranges below 60 to 80 percent of AMI are not shown. Some high priced mountain communities have for-sale housing programs with targets as high as 150 to 175 percent of AMI. Using a 30 percent affordability standard including insurance and taxes, the net available for debt service is the estimated monthly mortgage payment potential at each income level. Using a 7.0 percent interest rate, a 30 year fixed rate loan, and a five percent down payment, the target purchase price by AMI is shown in the bottom row. At 80 percent of AMI, the target purchase price is $135,500, up to $237,700 at 150 percent of AMI.
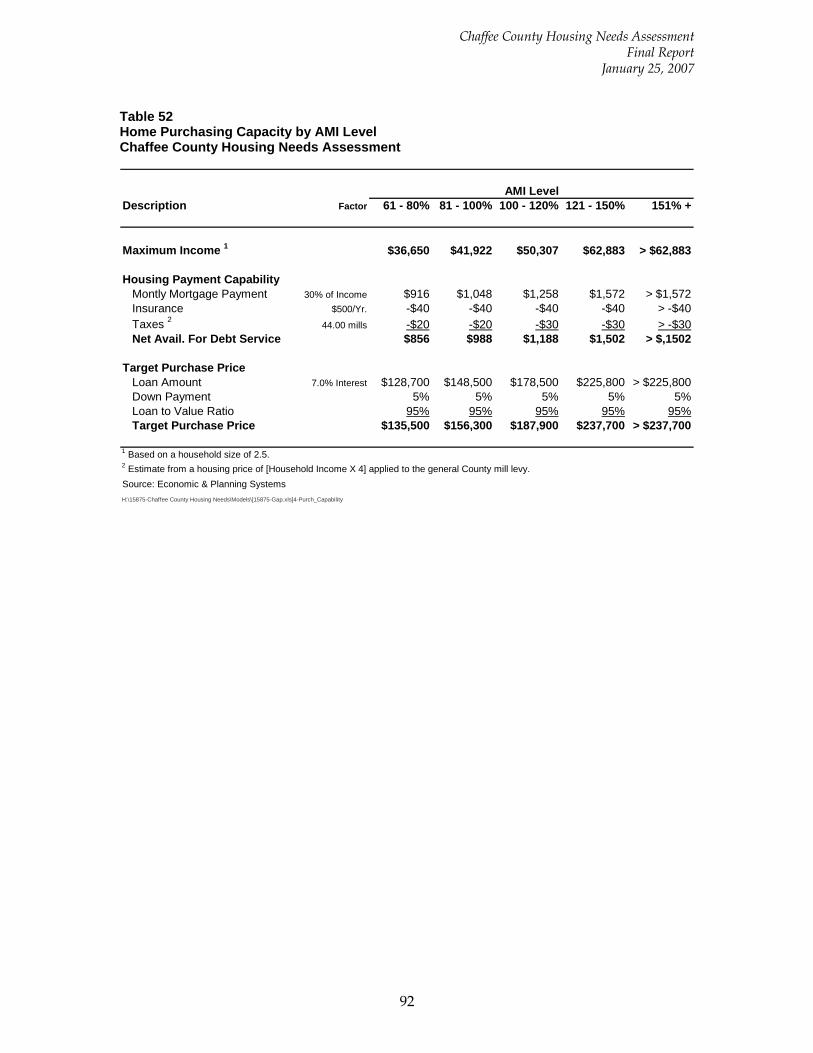
Chaffee County Housing Needs Assessment Final Report
January 25, 2007
92
Table 52 Home Purchasing Capacity by AMI Level Chaffee County Housing Needs Assessment
Description Factor 61 - 80% 81 - 100% 100 - 120% 121 - 150% 151% +
Maximum Income 1 $36,650 $41,922 $50,307 $62,883 > $62,883
Housing Payment CapabilityMontly Mortgage Payment 30% of Income $916 $1,048 $1,258 $1,572 > $1,572Insurance $500/Yr. -$40 -$40 -$40 -$40 > -$40Taxes 2 44.00 mills -$20 -$20 -$30 -$30 > -$30Net Avail. For Debt Service $856 $988 $1,188 $1,502 > $,1502
Target Purchase PriceLoan Amount 7.0% Interest $128,700 $148,500 $178,500 $225,800 > $225,800Down Payment 5% 5% 5% 5% 5%Loan to Value Ratio 95% 95% 95% 95% 95%Target Purchase Price $135,500 $156,300 $187,900 $237,700 > $237,700
1 Based on a household size of 2.5.2 Estimate from a housing price of [Household Income X 4] applied to the general County mill levy.Source: Economic & Planning SystemsH:\15875-Chaffee County Housing Needs\Models\[15875-Gap.xls]4-Purch_Capability
AMI Level
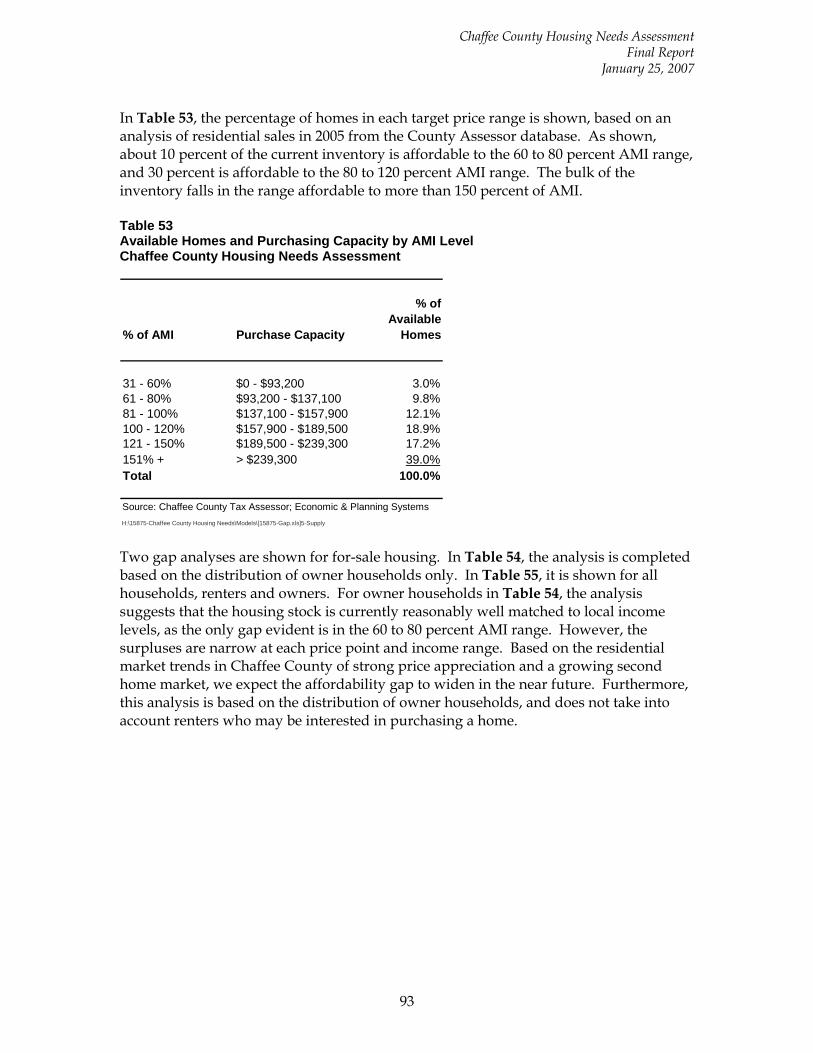
Chaffee County Housing Needs Assessment Final Report
January 25, 2007
93
In Table 53, the percentage of homes in each target price range is shown, based on an analysis of residential sales in 2005 from the County Assessor database. As shown, about 10 percent of the current inventory is affordable to the 60 to 80 percent AMI range, and 30 percent is affordable to the 80 to 120 percent AMI range. The bulk of the inventory falls in the range affordable to more than 150 percent of AMI. Table 53 Available Homes and Purchasing Capacity by AMI Level Chaffee County Housing Needs Assessment
% of AMI Purchase Capacity
% of Available
Homes
31 - 60% $0 - $93,200 3.0%61 - 80% $93,200 - $137,100 9.8%81 - 100% $137,100 - $157,900 12.1%100 - 120% $157,900 - $189,500 18.9%121 - 150% $189,500 - $239,300 17.2%151% + > $239,300 39.0%Total 100.0%
Source: Chaffee County Tax Assessor; Economic & Planning SystemsH:\15875-Chaffee County Housing Needs\Models\[15875-Gap.xls]5-Supply Two gap analyses are shown for for-sale housing. In Table 54, the analysis is completed based on the distribution of owner households only. In Table 55, it is shown for all households, renters and owners. For owner households in Table 54, the analysis suggests that the housing stock is currently reasonably well matched to local income levels, as the only gap evident is in the 60 to 80 percent AMI range. However, the surpluses are narrow at each price point and income range. Based on the residential market trends in Chaffee County of strong price appreciation and a growing second home market, we expect the affordability gap to widen in the near future. Furthermore, this analysis is based on the distribution of owner households, and does not take into account renters who may be interested in purchasing a home.
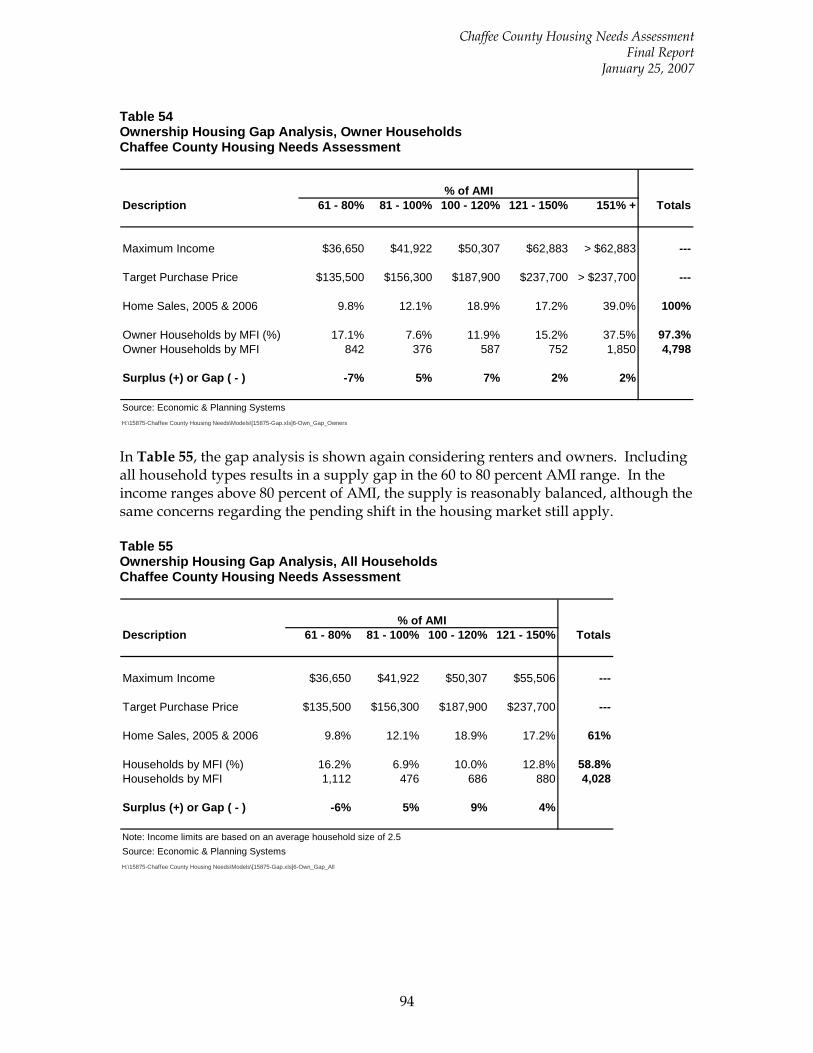
Chaffee County Housing Needs Assessment Final Report
January 25, 2007
94
Table 54 Ownership Housing Gap Analysis, Owner Households Chaffee County Housing Needs Assessment
Description 61 - 80% 81 - 100% 100 - 120% 121 - 150% 151% + Totals
Maximum Income $36,650 $41,922 $50,307 $62,883 > $62,883 ---
Target Purchase Price $135,500 $156,300 $187,900 $237,700 > $237,700 ---
Home Sales, 2005 & 2006 9.8% 12.1% 18.9% 17.2% 39.0% 100%
Owner Households by MFI (%) 17.1% 7.6% 11.9% 15.2% 37.5% 97.3%Owner Households by MFI 842 376 587 752 1,850 4,798
Surplus (+) or Gap ( - ) -7% 5% 7% 2% 2%
Source: Economic & Planning SystemsH:\15875-Chaffee County Housing Needs\Models\[15875-Gap.xls]6-Own_Gap_Owners
% of AMI
In Table 55, the gap analysis is shown again considering renters and owners. Including all household types results in a supply gap in the 60 to 80 percent AMI range. In the income ranges above 80 percent of AMI, the supply is reasonably balanced, although the same concerns regarding the pending shift in the housing market still apply. Table 55 Ownership Housing Gap Analysis, All Households Chaffee County Housing Needs Assessment
Description 61 - 80% 81 - 100% 100 - 120% 121 - 150% Totals
Maximum Income $36,650 $41,922 $50,307 $55,506 ---
Target Purchase Price $135,500 $156,300 $187,900 $237,700 ---
Home Sales, 2005 & 2006 9.8% 12.1% 18.9% 17.2% 61%
Households by MFI (%) 16.2% 6.9% 10.0% 12.8% 58.8%Households by MFI 1,112 476 686 880 4,028
Surplus (+) or Gap ( - ) -6% 5% 9% 4%
Note: Income limits are based on an average household size of 2.5Source: Economic & Planning SystemsH:\15875-Chaffee County Housing Needs\Models\[15875-Gap.xls]6-Own_Gap_All
% of AMI
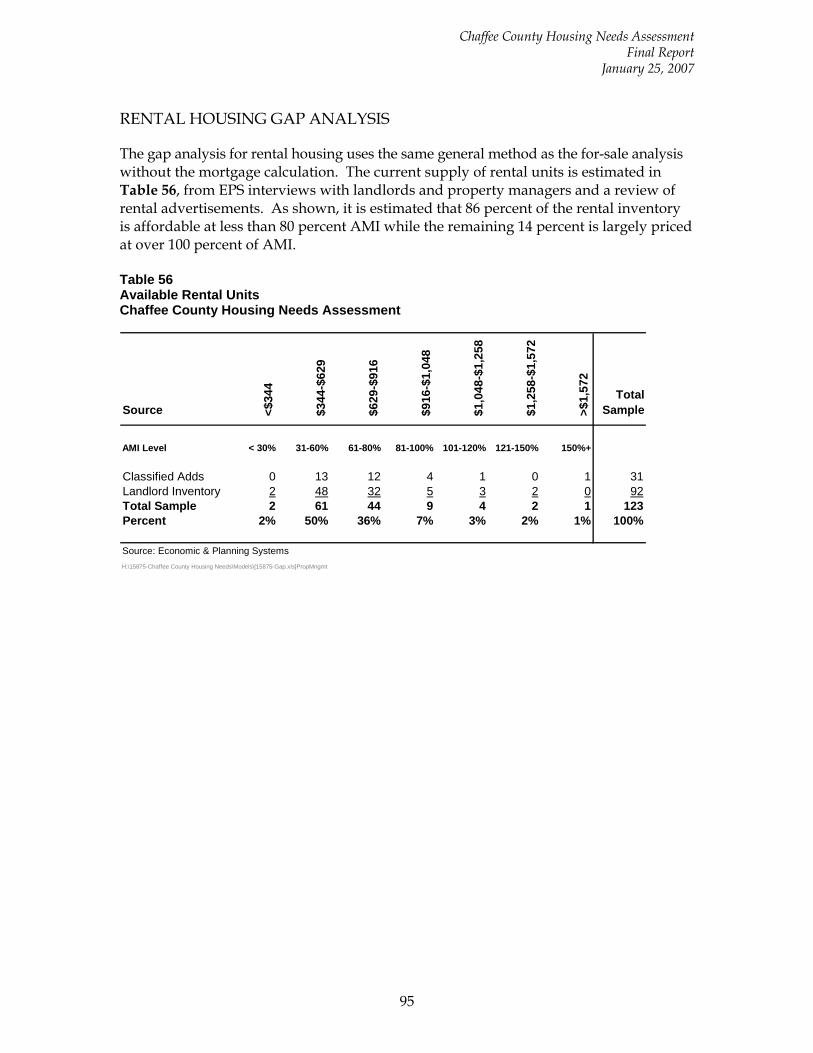
Chaffee County Housing Needs Assessment Final Report
January 25, 2007
95
RENTAL HOUSING GAP ANALYSIS
The gap analysis for rental housing uses the same general method as the for-sale analysis without the mortgage calculation. The current supply of rental units is estimated in Table 56, from EPS interviews with landlords and property managers and a review of rental advertisements. As shown, it is estimated that 86 percent of the rental inventory is affordable at less than 80 percent AMI while the remaining 14 percent is largely priced at over 100 percent of AMI. Table 56 Available Rental Units Chaffee County Housing Needs Assessment
Source <$34
4
$344
-$62
9
$629
-$91
6
$916
-$1,
048
$1,0
48-$
1,25
8
$1,2
58-$
1,57
2
>$1,
572
Total Sample
AMI Level < 30% 31-60% 61-80% 81-100% 101-120% 121-150% 150%+
Classified Adds 0 13 12 4 1 0 1 31Landlord Inventory 2 48 32 5 3 2 0 92Total Sample 2 61 44 9 4 2 1 123Percent 2% 50% 36% 7% 3% 2% 1% 100%
Source: Economic & Planning SystemsH:\15875-Chaffee County Housing Needs\Models\[15875-Gap.xls]PropMngmt
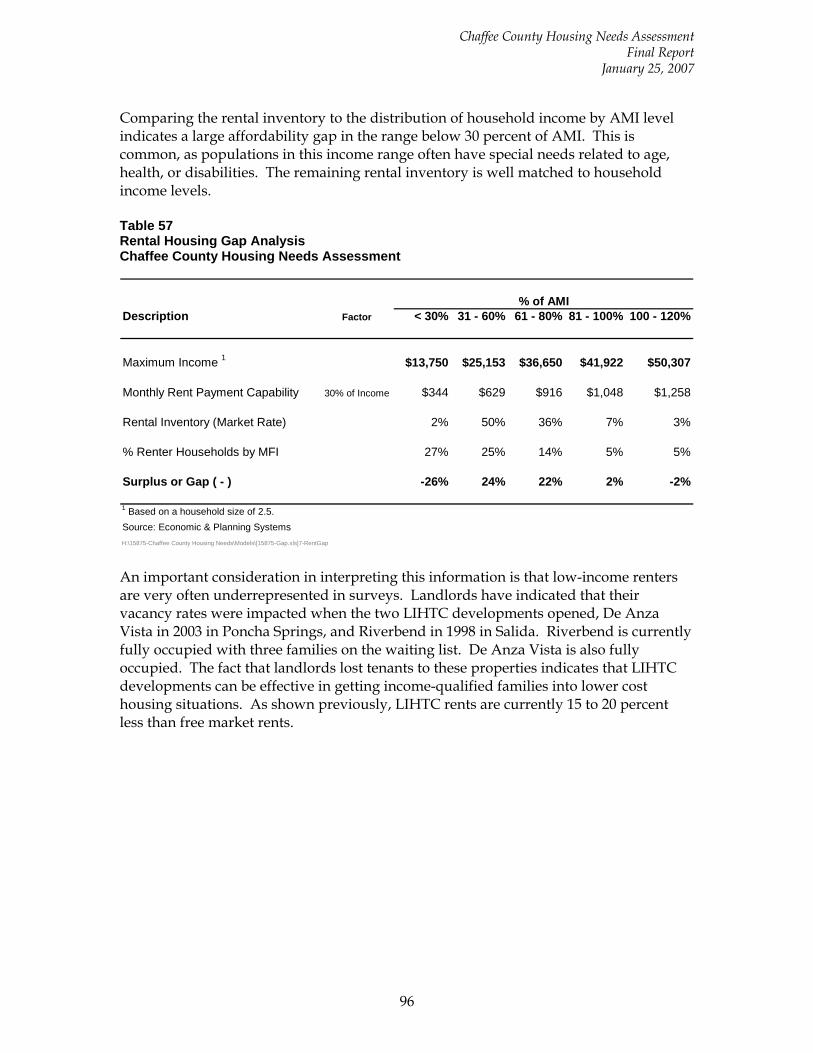
Chaffee County Housing Needs Assessment Final Report
January 25, 2007
96
Comparing the rental inventory to the distribution of household income by AMI level indicates a large affordability gap in the range below 30 percent of AMI. This is common, as populations in this income range often have special needs related to age, health, or disabilities. The remaining rental inventory is well matched to household income levels. Table 57 Rental Housing Gap Analysis Chaffee County Housing Needs Assessment
Description Factor < 30% 31 - 60% 61 - 80% 81 - 100% 100 - 120%
Maximum Income 1 $13,750 $25,153 $36,650 $41,922 $50,307
Monthly Rent Payment Capability 30% of Income $344 $629 $916 $1,048 $1,258
Rental Inventory (Market Rate) 2% 50% 36% 7% 3%
% Renter Households by MFI 27% 25% 14% 5% 5%
Surplus or Gap ( - ) -26% 24% 22% 2% -2%
1 Based on a household size of 2.5.Source: Economic & Planning SystemsH:\15875-Chaffee County Housing Needs\Models\[15875-Gap.xls]7-RentGap
% of AMI
An important consideration in interpreting this information is that low-income renters are very often underrepresented in surveys. Landlords have indicated that their vacancy rates were impacted when the two LIHTC developments opened, De Anza Vista in 2003 in Poncha Springs, and Riverbend in 1998 in Salida. Riverbend is currently fully occupied with three families on the waiting list. De Anza Vista is also fully occupied. The fact that landlords lost tenants to these properties indicates that LIHTC developments can be effective in getting income-qualified families into lower cost housing situations. As shown previously, LIHTC rents are currently 15 to 20 percent less than free market rents.

Economic &
Planning Systems Real Estate Economics Regional Economics Public Finance Land Use Policy
APPENDIX
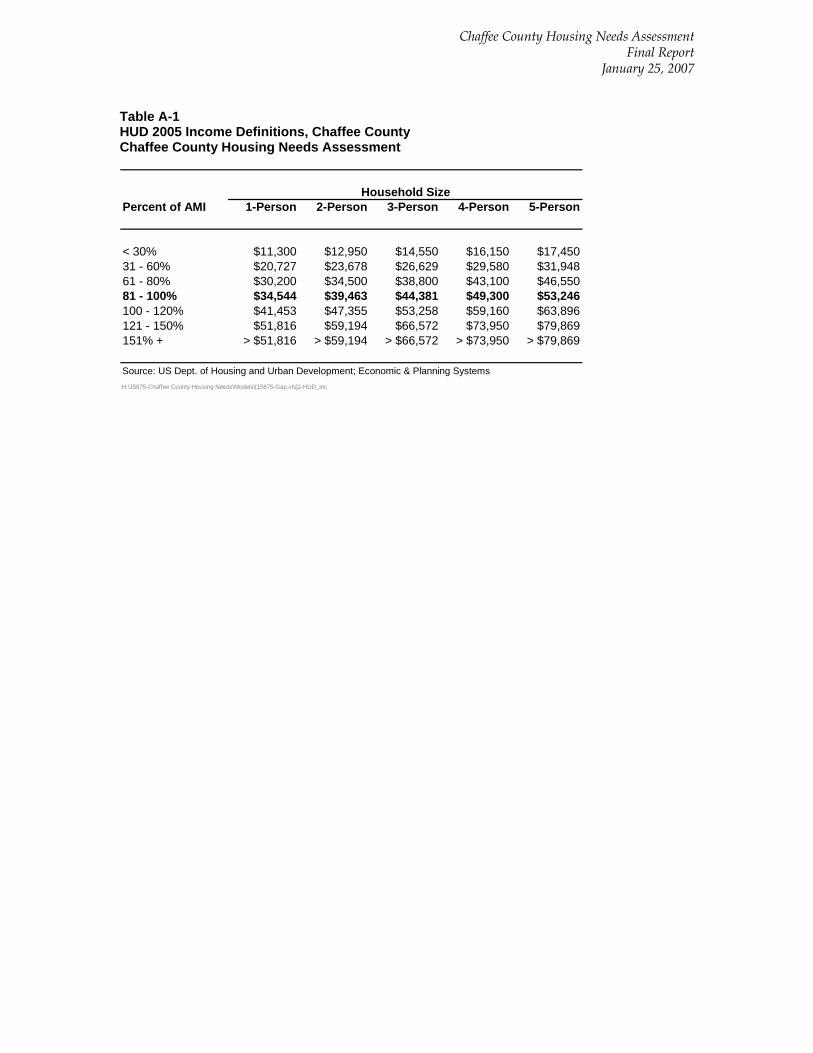
Chaffee County Housing Needs Assessment Final Report
January 25, 2007
Table A-1 HUD 2005 Income Definitions, Chaffee County Chaffee County Housing Needs Assessment
Percent of AMI 1-Person 2-Person 3-Person 4-Person 5-Person
< 30% $11,300 $12,950 $14,550 $16,150 $17,45031 - 60% $20,727 $23,678 $26,629 $29,580 $31,94861 - 80% $30,200 $34,500 $38,800 $43,100 $46,55081 - 100% $34,544 $39,463 $44,381 $49,300 $53,246100 - 120% $41,453 $47,355 $53,258 $59,160 $63,896121 - 150% $51,816 $59,194 $66,572 $73,950 $79,869151% + > $51,816 > $59,194 > $66,572 > $73,950 > $79,869
Source: US Dept. of Housing and Urban Development; Economic & Planning SystemsH:\15875-Chaffee County Housing Needs\Models\[15875-Gap.xls]2-HUD_Inc
Household Size
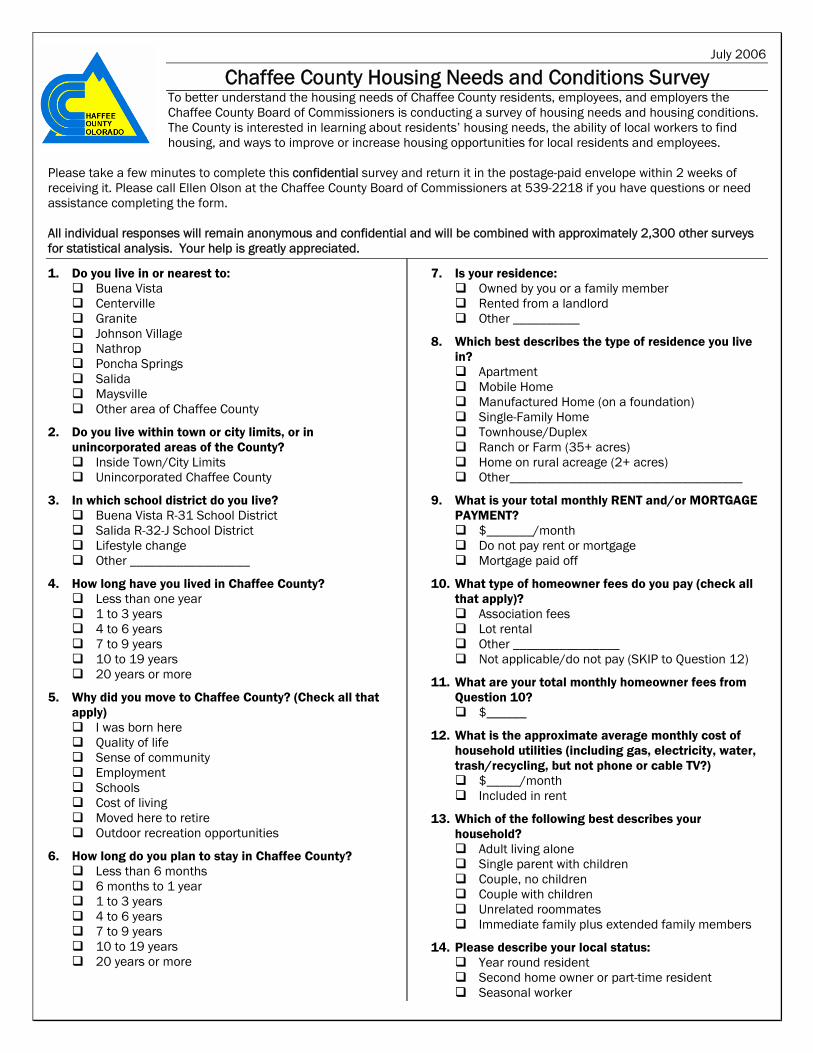
July 2006
Chaffee County Housing Needs and Conditions Survey To better understand the housing needs of Chaffee County residents, employees, and employers the Chaffee County Board of Commissioners is conducting a survey of housing needs and housing conditions. The County is interested in learning about residents’ housing needs, the ability of local workers to find housing, and ways to improve or increase housing opportunities for local residents and employees.
Please take a few minutes to complete this confidential survey and return it in the postage-paid envelope within 2 weeks of receiving it. Please call Ellen Olson at the Chaffee County Board of Commissioners at 539-2218 if you have questions or need assistance completing the form. All individual responses will remain anonymous and confidential and will be combined with approximately 2,300 other surveys for statistical analysis. Your help is greatly appreciated.
1. Do you live in or nearest to: Buena Vista Centerville Granite Johnson Village Nathrop Poncha Springs Salida Maysville Other area of Chaffee County
2. Do you live within town or city limits, or in unincorporated areas of the County?
Inside Town/City Limits Unincorporated Chaffee County
3. In which school district do you live? Buena Vista R-31 School District Salida R-32-J School District Lifestyle change Other __________________
4. How long have you lived in Chaffee County? Less than one year 1 to 3 years 4 to 6 years 7 to 9 years 10 to 19 years 20 years or more
5. Why did you move to Chaffee County? (Check all that apply)
I was born here Quality of life Sense of community Employment Schools Cost of living Moved here to retire Outdoor recreation opportunities
6. How long do you plan to stay in Chaffee County? Less than 6 months 6 months to 1 year 1 to 3 years 4 to 6 years 7 to 9 years 10 to 19 years 20 years or more
7. Is your residence: Owned by you or a family member Rented from a landlord Other __________
8. Which best describes the type of residence you live in?
Apartment Mobile Home Manufactured Home (on a foundation) Single-Family Home Townhouse/Duplex Ranch or Farm (35+ acres) Home on rural acreage (2+ acres) Other___________________________________
9. What is your total monthly RENT and/or MORTGAGE PAYMENT?
$_______/month Do not pay rent or mortgage Mortgage paid off
10. What type of homeowner fees do you pay (check all that apply)?
Association fees Lot rental Other ________________ Not applicable/do not pay (SKIP to Question 12)
11. What are your total monthly homeowner fees from Question 10?
$______
12. What is the approximate average monthly cost of household utilities (including gas, electricity, water, trash/recycling, but not phone or cable TV?)
$_____/month Included in rent
13. Which of the following best describes your household?
Adult living alone Single parent with children Couple, no children Couple with children Unrelated roommates Immediate family plus extended family members
14. Please describe your local status: Year round resident Second home owner or part-time resident Seasonal worker
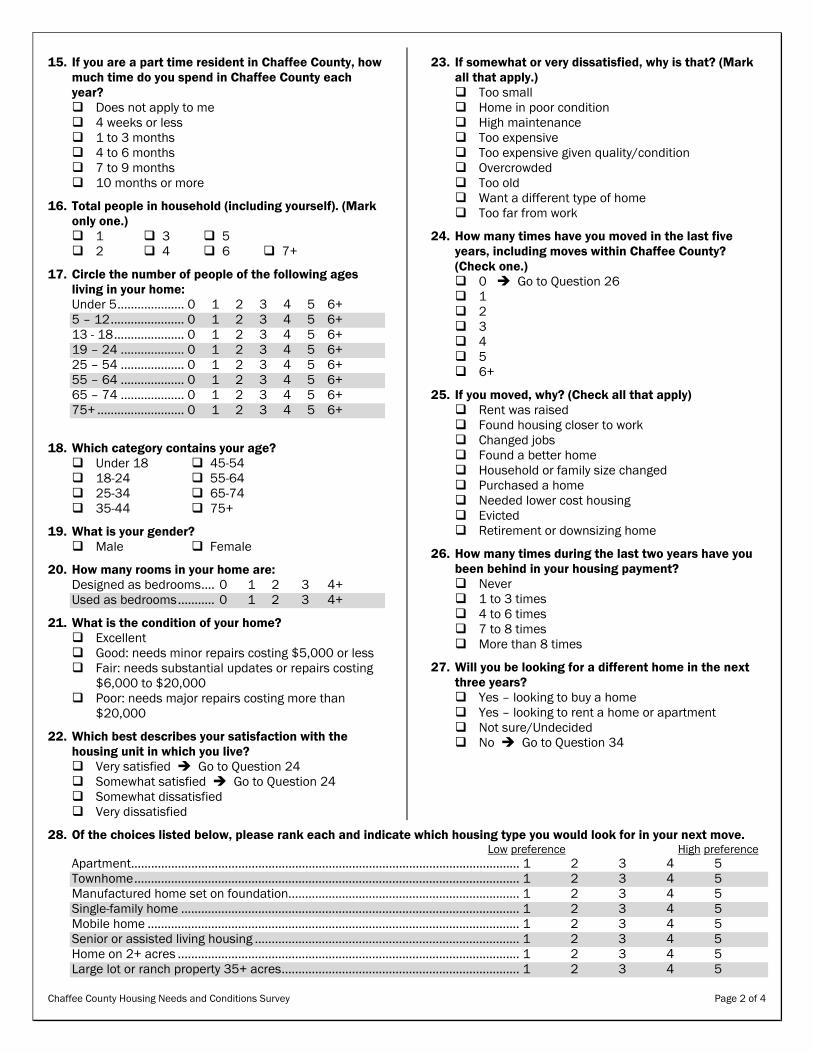
Chaffee County Housing Needs and Conditions Survey Page 2 of 4
15. If you are a part time resident in Chaffee County, how much time do you spend in Chaffee County each year?
Does not apply to me 4 weeks or less 1 to 3 months 4 to 6 months 7 to 9 months 10 months or more
16. Total people in household (including yourself). (Mark only one.)
1 3 5 2 4 6 7+
17. Circle the number of people of the following ages living in your home: Under 5.................... 0 1 2 3 4 5 6+ 5 – 12...................... 0 1 2 3 4 5 6+ 13 - 18..................... 0 1 2 3 4 5 6+ 19 – 24 ................... 0 1 2 3 4 5 6+ 25 – 54 ................... 0 1 2 3 4 5 6+ 55 – 64 ................... 0 1 2 3 4 5 6+ 65 – 74 ................... 0 1 2 3 4 5 6+ 75+ .......................... 0 1 2 3 4 5 6+
18. Which category contains your age? Under 18 45-54 18-24 55-64 25-34 65-74 35-44 75+
19. What is your gender? Male Female
20. How many rooms in your home are: Designed as bedrooms.... 0 1 2 3 4+ Used as bedrooms........... 0 1 2 3 4+
21. What is the condition of your home? Excellent Good: needs minor repairs costing $5,000 or less Fair: needs substantial updates or repairs costing
$6,000 to $20,000 Poor: needs major repairs costing more than
$20,000
22. Which best describes your satisfaction with the housing unit in which you live?
Very satisfied Go to Question 24 Somewhat satisfied Go to Question 24 Somewhat dissatisfied Very dissatisfied
23. If somewhat or very dissatisfied, why is that? (Mark all that apply.)
Too small Home in poor condition High maintenance Too expensive Too expensive given quality/condition Overcrowded Too old Want a different type of home Too far from work
24. How many times have you moved in the last five years, including moves within Chaffee County? (Check one.)
0 Go to Question 26 1 2 3 4 5 6+
25. If you moved, why? (Check all that apply) Rent was raised Found housing closer to work Changed jobs Found a better home Household or family size changed Purchased a home Needed lower cost housing Evicted Retirement or downsizing home
26. How many times during the last two years have you been behind in your housing payment?
Never 1 to 3 times 4 to 6 times 7 to 8 times More than 8 times
27. Will you be looking for a different home in the next three years?
Yes – looking to buy a home Yes – looking to rent a home or apartment Not sure/Undecided No Go to Question 34
28. Of the choices listed below, please rank each and indicate which housing type you would look for in your next move. Low preference High preference
Apartment.................................................................................................................... 1 2 3 4 5 Townhome................................................................................................................... 1 2 3 4 5 Manufactured home set on foundation..................................................................... 1 2 3 4 5 Single-family home ..................................................................................................... 1 2 3 4 5 Mobile home ............................................................................................................... 1 2 3 4 5 Senior or assisted living housing ............................................................................... 1 2 3 4 5 Home on 2+ acres ...................................................................................................... 1 2 3 4 5 Large lot or ranch property 35+ acres....................................................................... 1 2 3 4 5
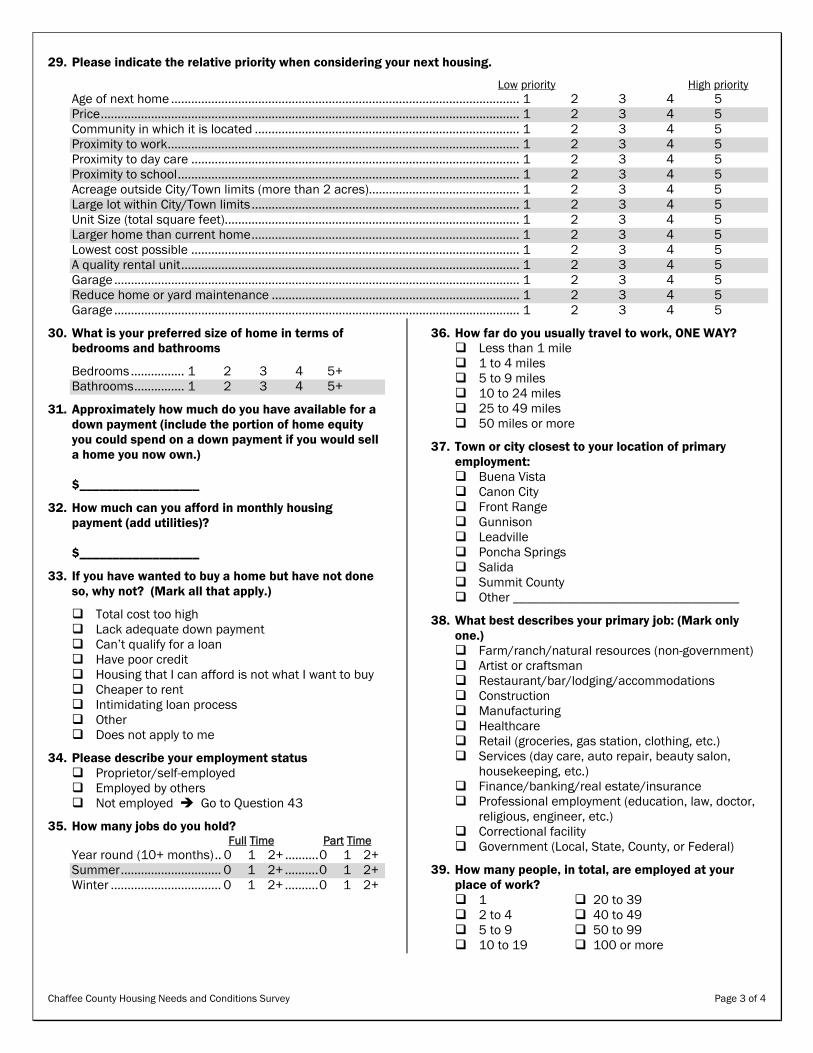
Chaffee County Housing Needs and Conditions Survey Page 3 of 4
29. Please indicate the relative priority when considering your next housing.
Low priority High priority Age of next home ........................................................................................................ 1 2 3 4 5 Price............................................................................................................................. 1 2 3 4 5 Community in which it is located ............................................................................... 1 2 3 4 5 Proximity to work......................................................................................................... 1 2 3 4 5 Proximity to day care .................................................................................................. 1 2 3 4 5 Proximity to school...................................................................................................... 1 2 3 4 5 Acreage outside City/Town limits (more than 2 acres)............................................. 1 2 3 4 5 Large lot within City/Town limits ................................................................................ 1 2 3 4 5 Unit Size (total square feet)........................................................................................ 1 2 3 4 5 Larger home than current home................................................................................ 1 2 3 4 5 Lowest cost possible .................................................................................................. 1 2 3 4 5 A quality rental unit..................................................................................................... 1 2 3 4 5 Garage ......................................................................................................................... 1 2 3 4 5 Reduce home or yard maintenance .......................................................................... 1 2 3 4 5 Garage ......................................................................................................................... 1 2 3 4 5
30. What is your preferred size of home in terms of bedrooms and bathrooms
Bedrooms................ 1 2 3 4 5+ Bathrooms............... 1 2 3 4 5+
31. Approximately how much do you have available for a down payment (include the portion of home equity you could spend on a down payment if you would sell a home you now own.) $__________________
32. How much can you afford in monthly housing payment (add utilities)? $__________________
33. If you have wanted to buy a home but have not done so, why not? (Mark all that apply.)
Total cost too high Lack adequate down payment Can’t qualify for a loan Have poor credit Housing that I can afford is not what I want to buy Cheaper to rent Intimidating loan process Other Does not apply to me
34. Please describe your employment status Proprietor/self-employed Employed by others Not employed Go to Question 43
35. How many jobs do you hold? Full Time Part Time
Year round (10+ months).. 0 1 2+ ..........0 1 2+ Summer.............................. 0 1 2+ ..........0 1 2+ Winter ................................. 0 1 2+ ..........0 1 2+
36. How far do you usually travel to work, ONE WAY? Less than 1 mile 1 to 4 miles 5 to 9 miles 10 to 24 miles 25 to 49 miles 50 miles or more
37. Town or city closest to your location of primary employment:
Buena Vista Canon City Front Range Gunnison Leadville Poncha Springs Salida Summit County Other __________________________________
38. What best describes your primary job: (Mark only one.)
Farm/ranch/natural resources (non-government) Artist or craftsman Restaurant/bar/lodging/accommodations Construction Manufacturing Healthcare Retail (groceries, gas station, clothing, etc.) Services (day care, auto repair, beauty salon,
housekeeping, etc.) Finance/banking/real estate/insurance Professional employment (education, law, doctor,
religious, engineer, etc.) Correctional facility Government (Local, State, County, or Federal)
39. How many people, in total, are employed at your place of work?
1 20 to 39 2 to 4 40 to 49 5 to 9 50 to 99 10 to 19 100 or more
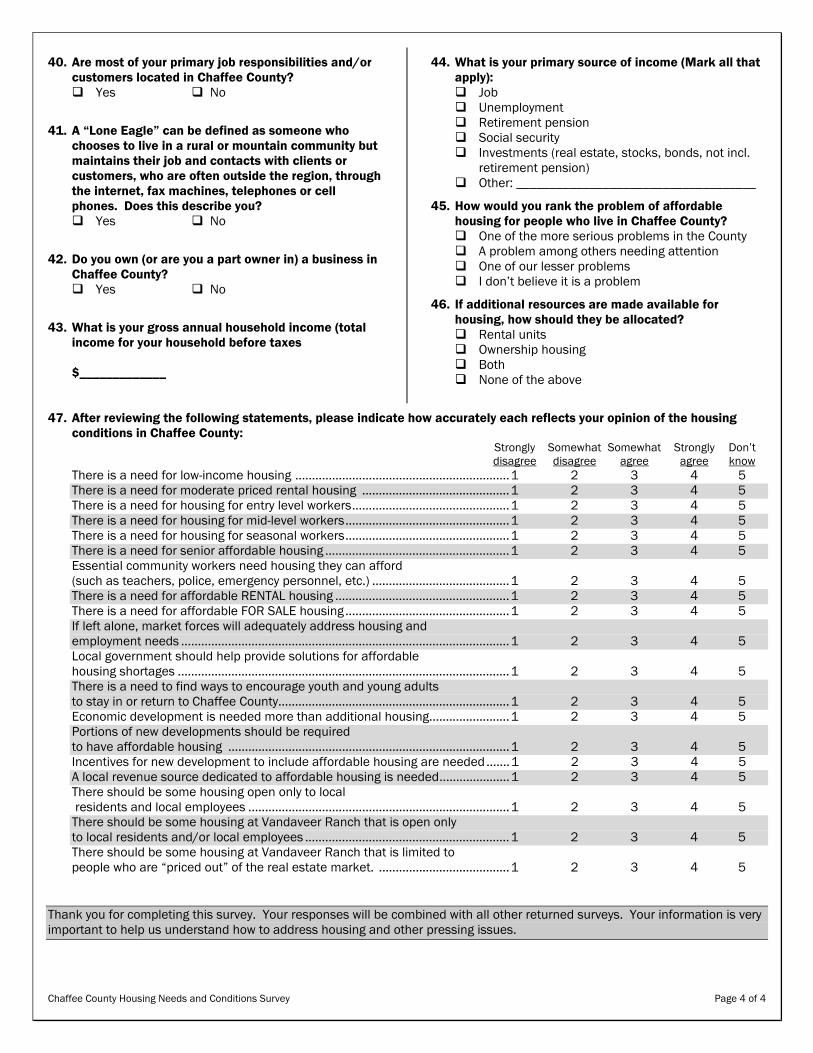
Chaffee County Housing Needs and Conditions Survey Page 4 of 4
40. Are most of your primary job responsibilities and/or customers located in Chaffee County?
Yes No
41. A “Lone Eagle” can be defined as someone who chooses to live in a rural or mountain community but maintains their job and contacts with clients or customers, who are often outside the region, through the internet, fax machines, telephones or cell phones. Does this describe you?
Yes No
42. Do you own (or are you a part owner in) a business in Chaffee County?
Yes No
43. What is your gross annual household income (total income for your household before taxes $_____________
44. What is your primary source of income (Mark all that apply):
Job Unemployment Retirement pension Social security Investments (real estate, stocks, bonds, not incl.
retirement pension) Other: ____________________________________
45. How would you rank the problem of affordable housing for people who live in Chaffee County?
One of the more serious problems in the County A problem among others needing attention One of our lesser problems I don’t believe it is a problem
46. If additional resources are made available for housing, how should they be allocated?
Rental units Ownership housing Both None of the above
47. After reviewing the following statements, please indicate how accurately each reflects your opinion of the housing conditions in Chaffee County:
Strongly Somewhat Somewhat Strongly Don’t disagree disagree agree agree know
There is a need for low-income housing ................................................................1 2 3 4 5 There is a need for moderate priced rental housing ............................................1 2 3 4 5 There is a need for housing for entry level workers...............................................1 2 3 4 5 There is a need for housing for mid-level workers.................................................1 2 3 4 5 There is a need for housing for seasonal workers.................................................1 2 3 4 5 There is a need for senior affordable housing .......................................................1 2 3 4 5 Essential community workers need housing they can afford (such as teachers, police, emergency personnel, etc.) .........................................1 2 3 4 5 There is a need for affordable RENTAL housing ....................................................1 2 3 4 5 There is a need for affordable FOR SALE housing.................................................1 2 3 4 5 If left alone, market forces will adequately address housing and employment needs ..................................................................................................1 2 3 4 5 Local government should help provide solutions for affordable housing shortages ...................................................................................................1 2 3 4 5 There is a need to find ways to encourage youth and young adults to stay in or return to Chaffee County.....................................................................1 2 3 4 5 Economic development is needed more than additional housing........................1 2 3 4 5 Portions of new developments should be required to have affordable housing ....................................................................................1 2 3 4 5 Incentives for new development to include affordable housing are needed.......1 2 3 4 5 A local revenue source dedicated to affordable housing is needed.....................1 2 3 4 5 There should be some housing open only to local residents and local employees ..............................................................................1 2 3 4 5 There should be some housing at Vandaveer Ranch that is open only to local residents and/or local employees .............................................................1 2 3 4 5 There should be some housing at Vandaveer Ranch that is limited to people who are “priced out” of the real estate market. .......................................1 2 3 4 5
Thank you for completing this survey. Your responses will be combined with all other returned surveys. Your information is very important to help us understand how to address housing and other pressing issues.
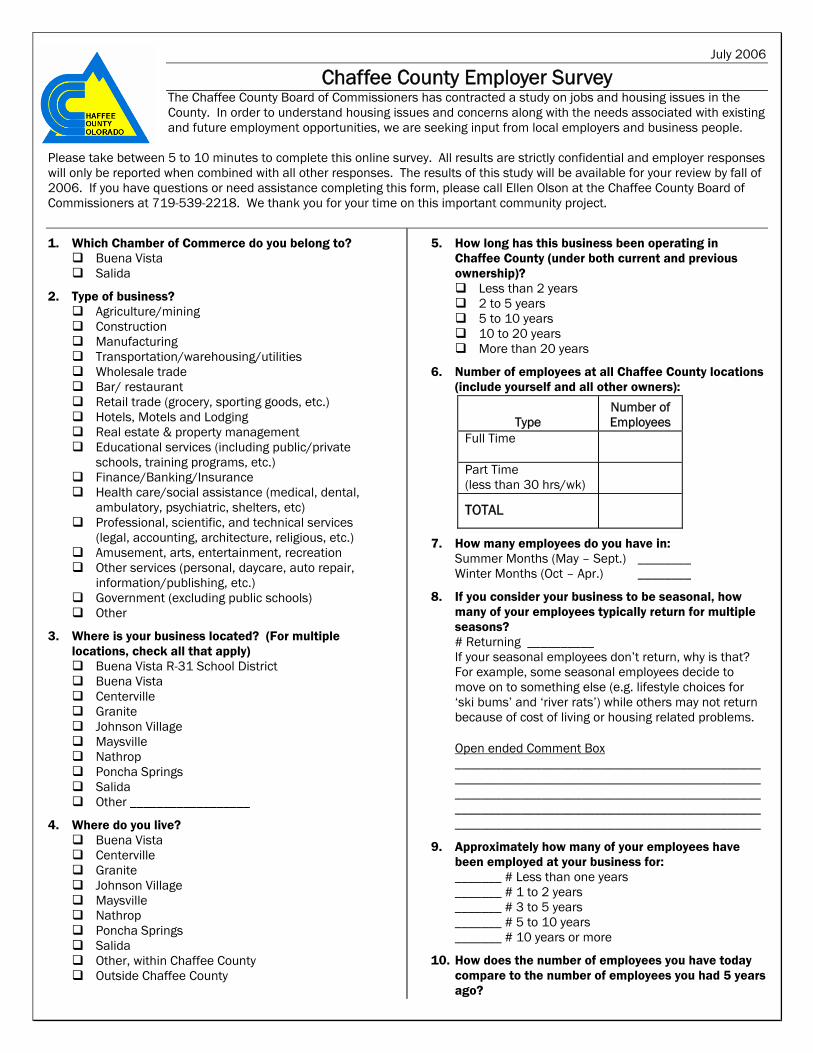
July 2006
Chaffee County Employer Survey The Chaffee County Board of Commissioners has contracted a study on jobs and housing issues in the County. In order to understand housing issues and concerns along with the needs associated with existing and future employment opportunities, we are seeking input from local employers and business people.
Please take between 5 to 10 minutes to complete this online survey. All results are strictly confidential and employer responses will only be reported when combined with all other responses. The results of this study will be available for your review by fall of 2006. If you have questions or need assistance completing this form, please call Ellen Olson at the Chaffee County Board of Commissioners at 719-539-2218. We thank you for your time on this important community project.
1. Which Chamber of Commerce do you belong to? Buena Vista Salida
2. Type of business? Agriculture/mining Construction Manufacturing Transportation/warehousing/utilities Wholesale trade Bar/ restaurant Retail trade (grocery, sporting goods, etc.) Hotels, Motels and Lodging Real estate & property management Educational services (including public/private
schools, training programs, etc.) Finance/Banking/Insurance Health care/social assistance (medical, dental,
ambulatory, psychiatric, shelters, etc) Professional, scientific, and technical services
(legal, accounting, architecture, religious, etc.) Amusement, arts, entertainment, recreation Other services (personal, daycare, auto repair,
information/publishing, etc.) Government (excluding public schools) Other
3. Where is your business located? (For multiple locations, check all that apply)
Buena Vista R-31 School District Buena Vista Centerville Granite Johnson Village Maysville Nathrop Poncha Springs Salida Other __________________
4. Where do you live? Buena Vista Centerville Granite Johnson Village Maysville Nathrop Poncha Springs Salida Other, within Chaffee County Outside Chaffee County
5. How long has this business been operating in Chaffee County (under both current and previous ownership)?
Less than 2 years 2 to 5 years 5 to 10 years 10 to 20 years More than 20 years
6. Number of employees at all Chaffee County locations (include yourself and all other owners):
Type Number of Employees
Full Time
Part Time (less than 30 hrs/wk)
TOTAL
7. How many employees do you have in: Summer Months (May – Sept.) ________ Winter Months (Oct – Apr.) ________
8. If you consider your business to be seasonal, how many of your employees typically return for multiple seasons? # Returning __________ If your seasonal employees don’t return, why is that? For example, some seasonal employees decide to move on to something else (e.g. lifestyle choices for ‘ski bums’ and ‘river rats’) while others may not return because of cost of living or housing related problems.
Open ended Comment Box ______________________________________________________________________________________________________________________________________________________________________________________________________________________________________
9. Approximately how many of your employees have been employed at your business for: _______ # Less than one years _______ # 1 to 2 years _______ # 3 to 5 years _______ # 5 to 10 years _______ # 10 years or more
10. How does the number of employees you have today compare to the number of employees you had 5 years ago?
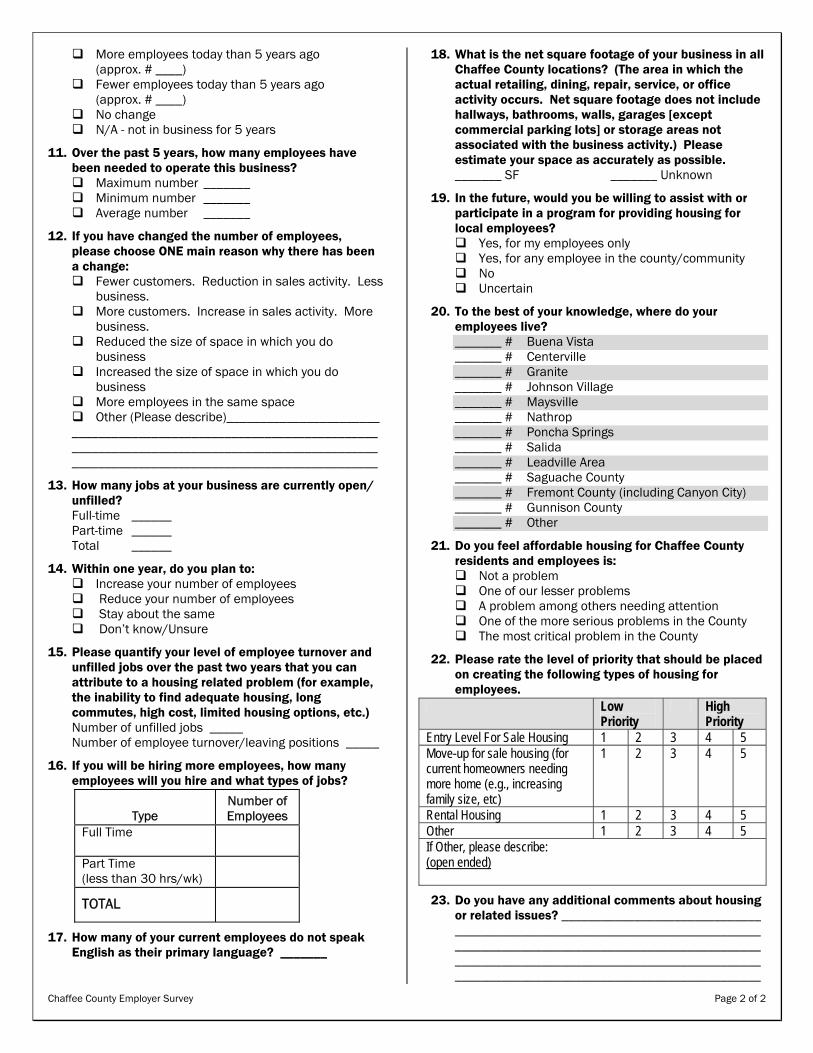
Chaffee County Employer Survey Page 2 of 2
More employees today than 5 years ago (approx. # ____)
Fewer employees today than 5 years ago (approx. # ____)
No change N/A - not in business for 5 years
11. Over the past 5 years, how many employees have been needed to operate this business?
Maximum number _______ Minimum number _______ Average number _______
12. If you have changed the number of employees, please choose ONE main reason why there has been a change:
Fewer customers. Reduction in sales activity. Less business.
More customers. Increase in sales activity. More business.
Reduced the size of space in which you do business
Increased the size of space in which you do business
More employees in the same space Other (Please describe)_______________________
______________________________________________ ______________________________________________ ______________________________________________
13. How many jobs at your business are currently open/ unfilled? Full-time ______ Part-time ______ Total ______
14. Within one year, do you plan to: Increase your number of employees Reduce your number of employees Stay about the same Don’t know/Unsure
15. Please quantify your level of employee turnover and unfilled jobs over the past two years that you can attribute to a housing related problem (for example, the inability to find adequate housing, long commutes, high cost, limited housing options, etc.) Number of unfilled jobs _____ Number of employee turnover/leaving positions _____
16. If you will be hiring more employees, how many employees will you hire and what types of jobs?
Type Number of Employees
Full Time
Part Time (less than 30 hrs/wk)
TOTAL
17. How many of your current employees do not speak English as their primary language? _______
18. What is the net square footage of your business in all Chaffee County locations? (The area in which the actual retailing, dining, repair, service, or office activity occurs. Net square footage does not include hallways, bathrooms, walls, garages [except commercial parking lots] or storage areas not associated with the business activity.) Please estimate your space as accurately as possible. _______ SF _______ Unknown
19. In the future, would you be willing to assist with or participate in a program for providing housing for local employees?
Yes, for my employees only Yes, for any employee in the county/community No Uncertain
20. To the best of your knowledge, where do your employees live? _______ # Buena Vista _______ # Centerville _______ # Granite _______ # Johnson Village _______ # Maysville _______ # Nathrop _______ # Poncha Springs _______ # Salida _______ # Leadville Area _______ # Saguache County _______ # Fremont County (including Canyon City) _______ # Gunnison County _______ # Other
21. Do you feel affordable housing for Chaffee County residents and employees is:
Not a problem One of our lesser problems A problem among others needing attention One of the more serious problems in the County The most critical problem in the County
22. Please rate the level of priority that should be placed on creating the following types of housing for employees.
Low Priority
High Priority
Entry Level For Sale Housing 1 2 3 4 5 Move-up for sale housing (for current homeowners needing more home (e.g., increasing family size, etc)
1 2 3 4 5
Rental Housing 1 2 3 4 5 Other 1 2 3 4 5 If Other, please describe: (open ended) 23. Do you have any additional comments about housing
or related issues? ______________________________ ________________________________________________________________________________________________________________________________________________________________________________________