chaire european towards the separation of ownership and ... · towards the separation of ownership...
TRANSCRIPT
Towards the Separation of Ownership and Operations: Risks Allocation for the New Scenario and the Emergence of the Integrated Energy Service Companies
Paris, November 24th, 2014
Chaire European
Electricity Markets
(CEEM) et Chaire Energie
& Finance d’HEC
Haya Energy Solutions
1. HES at a glance
2. What is changing in EU Power Sector
1. Concentration and later disposal
2. Network Disposal
3. Outsiders taking over distressed assets
3. Risk map for a new arrangement
1. Natural responsibilities allocation for Power generation
2. Limits to this new arrangement
4. What will change in EU Power? Moving towards an investment crisis
Index
2
1. HES consultancy based on a deep knowledge of business, market and operational management
3
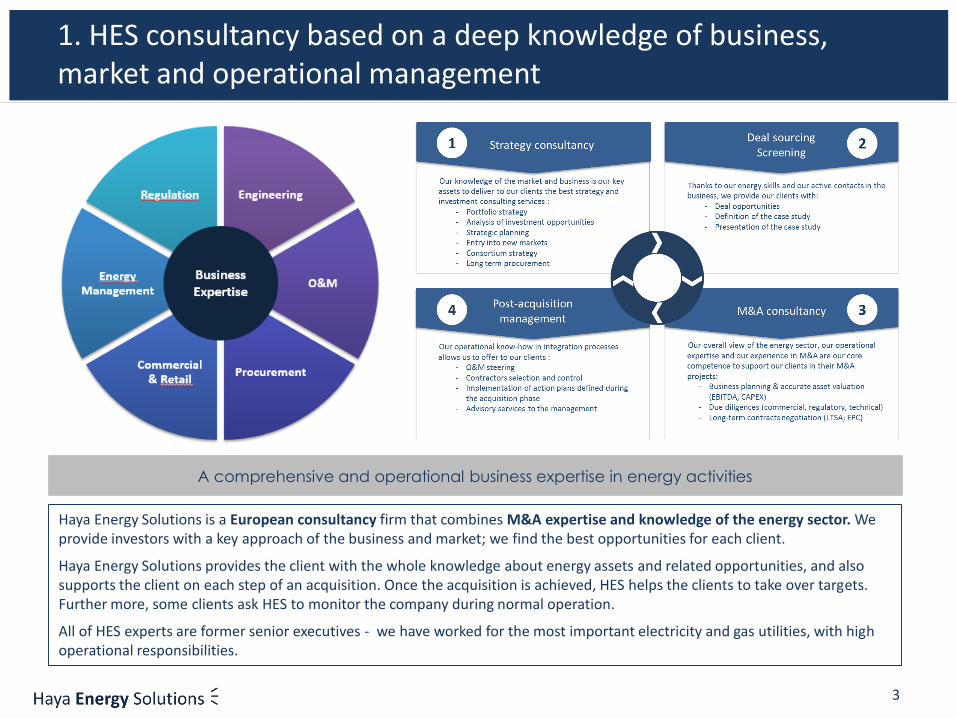
Haya Energy Solutions is a European consultancy firm that combines M&A expertise and knowledge of the energy sector. We provide investors with a key approach of the business and market; we find the best opportunities for each client.
Haya Energy Solutions provides the client with the whole knowledge about energy assets and related opportunities, and also supports the client on each step of an acquisition. Once the acquisition is achieved, HES helps the clients to take over targets. Further more, some clients ask HES to monitor the company during normal operation.
All of HES experts are former senior executives - we have worked for the most important electricity and gas utilities, with high operational responsibilities.
A comprehensive and operational business expertise in energy activities
2. What is changing in EU Power Sector
4
200090’s 2008 2012 2014
Only local utilities
verticallyintegrated
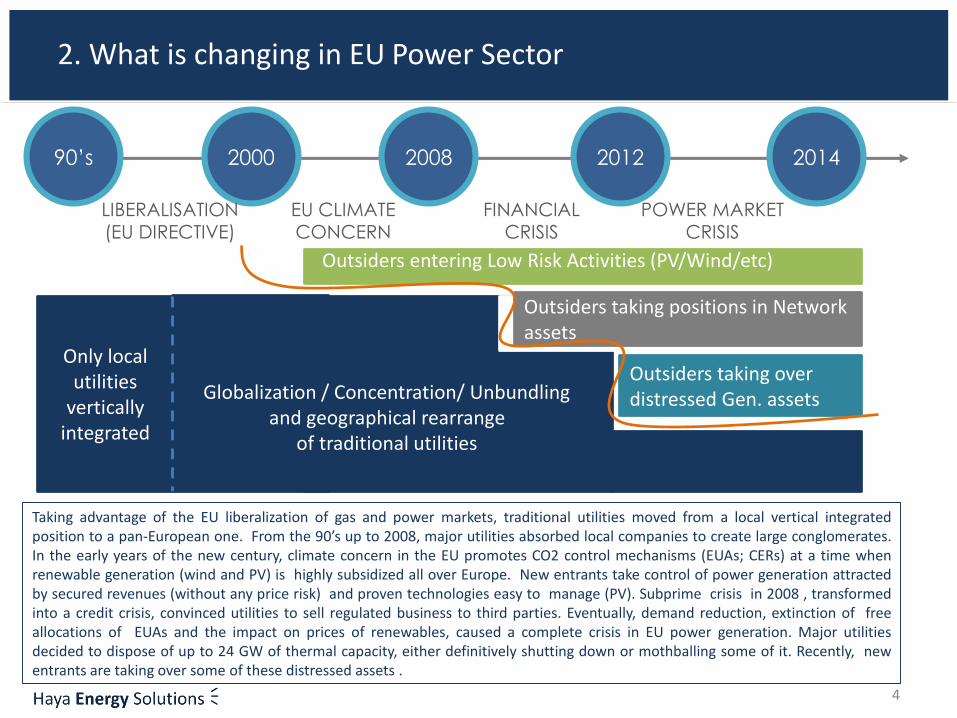
Outsiders entering Low Risk Activities (PV/Wind/etc)
Outsiders taking positions in Network assets
Outsiders taking over distressed Gen. assetsGlobalization / Concentration/ Unbundling
and geographical rearrangeof traditional utilities
Taking advantage of the EU liberalization of gas and power markets, traditional utilities moved from a local vertical integratedposition to a pan-European one. From the 90’s up to 2008, major utilities absorbed local companies to create large conglomerates.In the early years of the new century, climate concern in the EU promotes CO2 control mechanisms (EUAs; CERs) at a time whenrenewable generation (wind and PV) is highly subsidized all over Europe. New entrants take control of power generation attractedby secured revenues (without any price risk) and proven technologies easy to manage (PV). Subprime crisis in 2008 , transformedinto a credit crisis, convinced utilities to sell regulated business to third parties. Eventually, demand reduction, extinction of freeallocations of EUAs and the impact on prices of renewables, caused a complete crisis in EU power generation. Major utilitiesdecided to dispose of up to 24 GW of thermal capacity, either definitively shutting down or mothballing some of it. Recently, newentrants are taking over some of these distressed assets .
LIBERALISATION(EU DIRECTIVE)
EU CLIMATECONCERN
FINANCIALCRISIS
POWER MARKETCRISIS
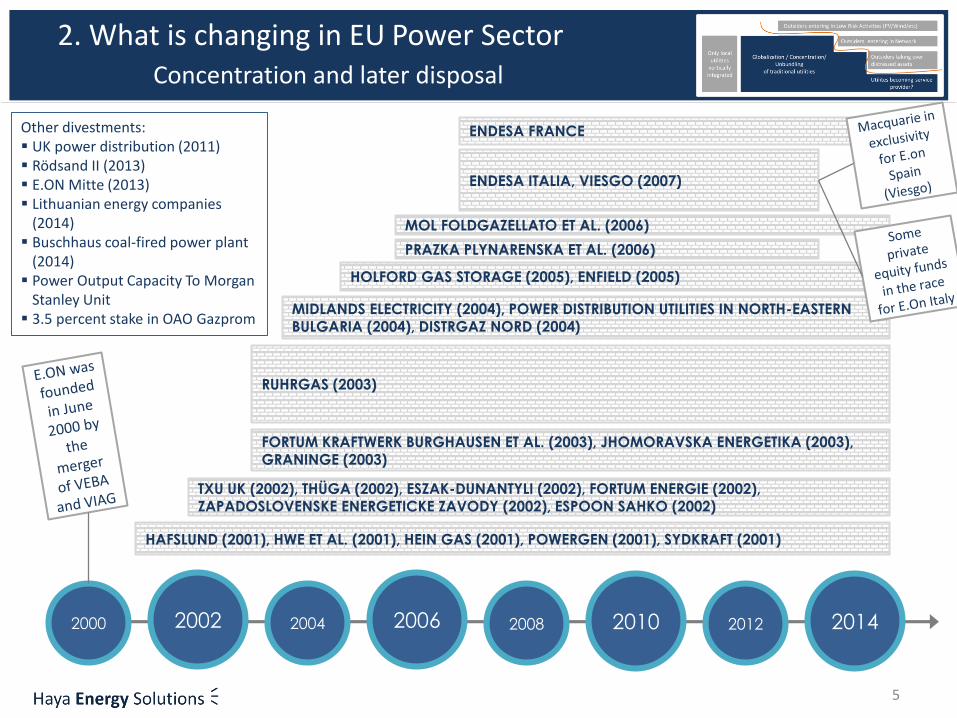
2. What is changing in EU Power SectorConcentration and later disposal
5
2000 20042002 2006 2008 2010 2012 2014
HAFSLUND (2001), HWE ET AL. (2001), HEIN GAS (2001), POWERGEN (2001), SYDKRAFT (2001)
TXU UK (2002), THÜGA (2002), ESZAK-DUNANTYLI (2002), FORTUM ENERGIE (2002), ZAPADOSLOVENSKE ENERGETICKE ZAVODY (2002), ESPOON SAHKO (2002)
FORTUM KRAFTWERK BURGHAUSEN ET AL. (2003), JHOMORAVSKA ENERGETIKA (2003), GRANINGE (2003)
RUHRGAS (2003)
MIDLANDS ELECTRICITY (2004), POWER DISTRIBUTION UTILITIES IN NORTH-EASTERN BULGARIA (2004), DISTRGAZ NORD (2004)
HOLFORD GAS STORAGE (2005), ENFIELD (2005)
PRAZKA PLYNARENSKA ET AL. (2006)
MOL FOLDGAZELLATO ET AL. (2006)
ENDESA ITALIA, VIESGO (2007)
ENDESA FRANCEOther divestments: UK power distribution (2011) Rödsand II (2013) E.ON Mitte (2013) Lithuanian energy companies
(2014) Buschhaus coal-fired power plant
(2014) Power Output Capacity To Morgan
Stanley Unit 3.5 percent stake in OAO Gazprom
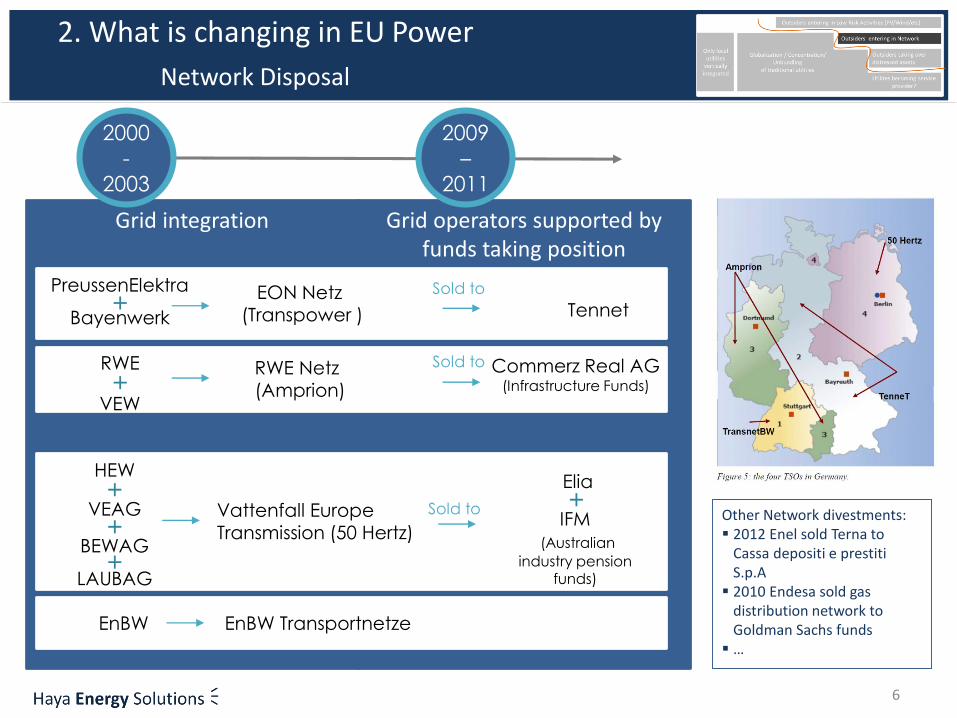
Grid operators supported by funds taking position
Grid integration
PreussenElektra
Bayenwerk+
EON Netz(Transpower )
RWE
VEW+
RWE Netz(Amprion)
HEW
VEAG+
Vattenfall EuropeTransmission (50 Hertz)
BEWAG+
LAUBAG+
Tennet
Elia
2. What is changing in EU Power
Network Disposal
6
2000
-
2003
2009
–
2011
Sold to
Sold to
Sold to
EnBW TransportnetzeEnBW
Other Network divestments: 2012 Enel sold Terna to
Cassa depositi e prestiti S.p.A
2010 Endesa sold gasdistribution network to Goldman Sachs funds
…
IFM(Australian
industry pension funds)
+
Commerz Real AG(Infrastructure Funds)
-20 000
-15 000
-10 000
-5 000
0
5 000
10 000
15 000
20 000
25 000
30 000
-10,00 -5,00 0,00 5,00 10,00 15,00 20,00
EBITDAk€
CLean Spark Spread Base(PEG Nord 55%)
€/MWh
EBITDA
EBITDA 2 (400 MW)
EBITDA 1 (400 MW)
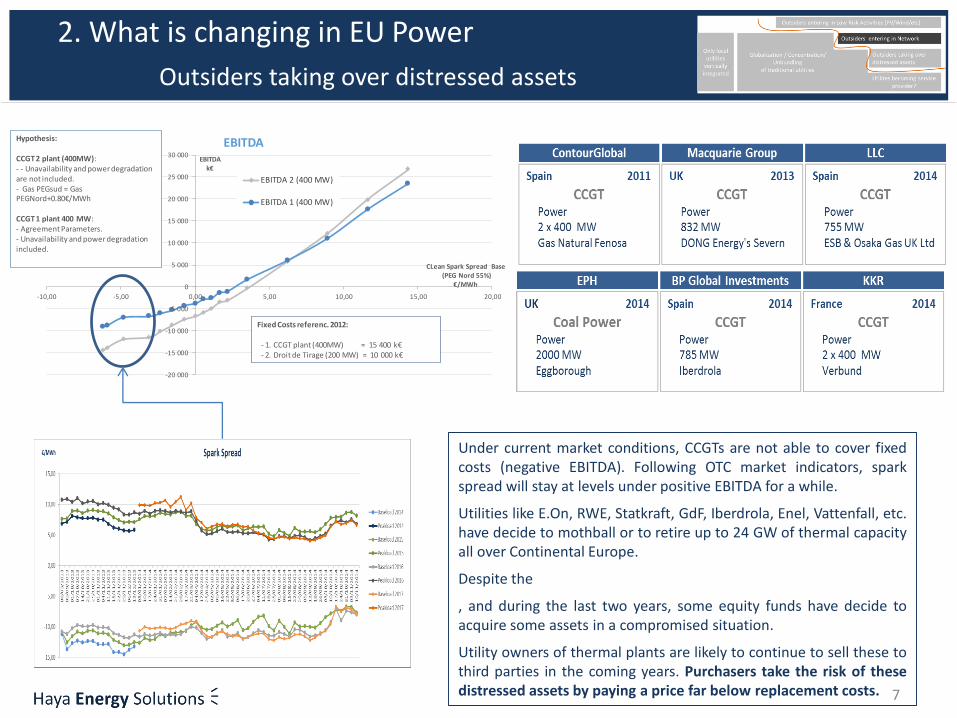
Fixed Costs referenc. 2012:
- 1. CCGT plant (400MW) = 15 400 k€- 2. Droit de Tirage (200 MW) = 10 000 k€
Hypothesis:
CCGT 2 plant (400MW):- - Unavailability and power degradation are not included.- Gas PEGsud = Gas PEGNord+0.80€/MWh
CCGT 1 plant 400 MW:- Agreement Parameters.- Unavailability and power degradation included.
2. What is changing in EU Power
Outsiders taking over distressed assets
7
Under current market conditions, CCGTs are not able to cover fixedcosts (negative EBITDA). Following OTC market indicators, sparkspread will stay at levels under positive EBITDA for a while.
Utilities like E.On, RWE, Statkraft, GdF, Iberdrola, Enel, Vattenfall, etc.have decide to mothball or to retire up to 24 GW of thermal capacityall over Continental Europe.
Despite the
, and during the last two years, some equity funds have decide toacquire some assets in a compromised situation.
Utility owners of thermal plants are likely to continue to sell these tothird parties in the coming years. Purchasers take the risk of thesedistressed assets by paying a price far below replacement costs.
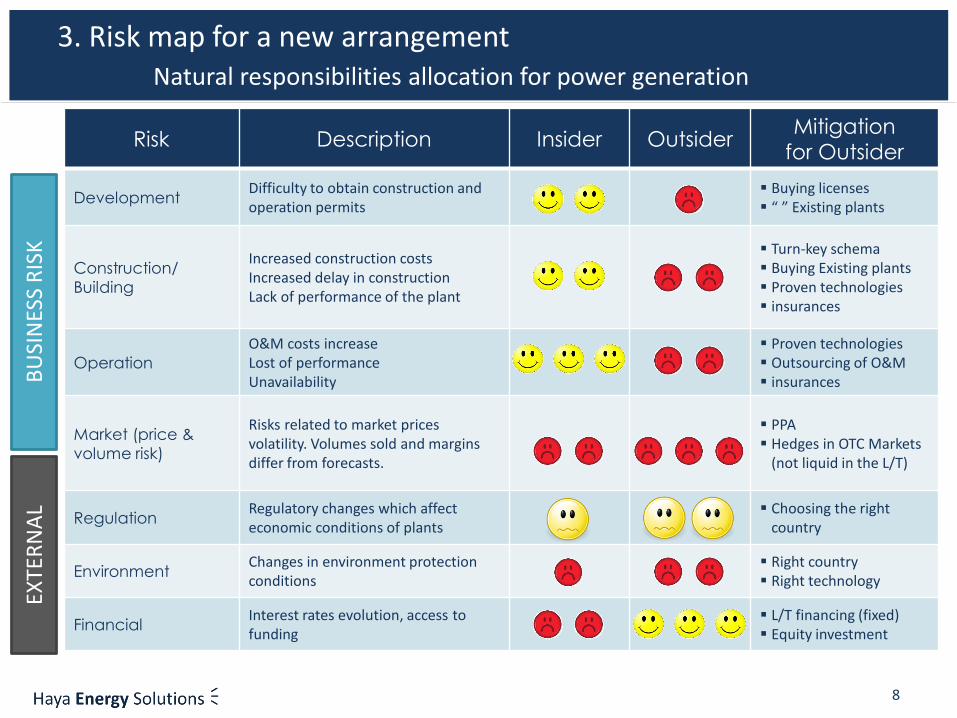
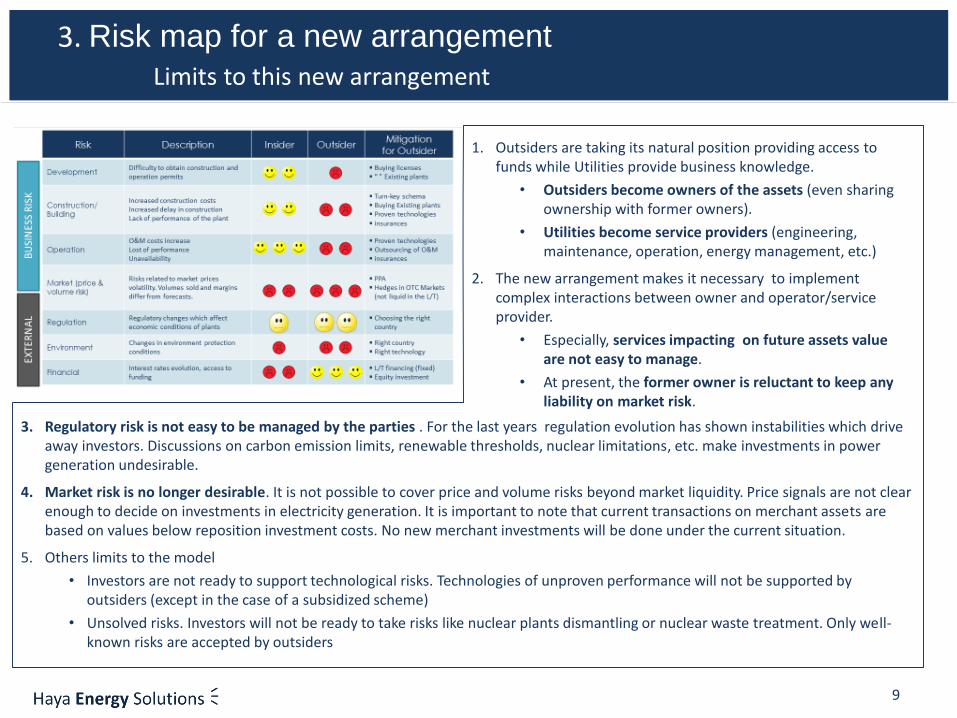
Risk Description Insider OutsiderMitigation
for Outsider
DevelopmentDifficulty to obtain construction and operation permits
Buying licenses “ ” Existing plants
Construction/
Building
Increased construction costsIncreased delay in constructionLack of performance of the plant
Turn-key schema Buying Existing plants Proven technologies insurances
Operation
O&M costs increaseLost of performanceUnavailability
Proven technologies Outsourcing of O&M insurances
Market (price &
volume risk)
Risks related to market prices volatility. Volumes sold and margins differ from forecasts.
PPA Hedges in OTC Markets
(not liquid in the L/T)
RegulationRegulatory changes which affect economic conditions of plants
Choosing the right country
EnvironmentChanges in environment protection conditions
Right country Right technology
FinancialInterest rates evolution, access to funding
L/T financing (fixed) Equity investment
8
3. Risk map for a new arrangementNatural responsibilities allocation for power generation
BU
SIN
ESS
RIS
KEX
TER
NA
L
9
3. Risk map for a new arrangement
Limits to this new arrangement
1. Outsiders are taking its natural position providing access to funds while Utilities provide business knowledge.
• Outsiders become owners of the assets (even sharing ownership with former owners).
• Utilities become service providers (engineering, maintenance, operation, energy management, etc.)
2. The new arrangement makes it necessary to implement complex interactions between owner and operator/service provider.
• Especially, services impacting on future assets value are not easy to manage.
• At present, the former owner is reluctant to keep any liability on market risk.
3. Regulatory risk is not easy to be managed by the parties . For the last years regulation evolution has shown instabilities which drive away investors. Discussions on carbon emission limits, renewable thresholds, nuclear limitations, etc. make investments in power generation undesirable.
4. Market risk is no longer desirable. It is not possible to cover price and volume risks beyond market liquidity. Price signals are not clear enough to decide on investments in electricity generation. It is important to note that current transactions on merchant assets are based on values below reposition investment costs. No new merchant investments will be done under the current situation.
5. Others limits to the model
• Investors are not ready to support technological risks. Technologies of unproven performance will not be supported by outsiders (except in the case of a subsidized scheme)
• Unsolved risks. Investors will not be ready to take risks like nuclear plants dismantling or nuclear waste treatment. Only well-known risks are accepted by outsiders
4. What will change in EU Power generation? Moving towards an investment crisis
10
1. Investment crisis
During the last years we have watched the degradation of the financial situation of traditional utilities due to the various reasons mentionedearlier: impact of subsidized renewables on market prices; demand reduction due to the crisis and better energy efficiency; reduction ofcarbon prices; etc. Current discussions being held in most EU countries on the development of renewable sources make us believe thatmarket price signals will be even more erratic in the coming years.
For the time being, the System requires no additional capacity (except in some countries, such as France). But, as Entso-e explains in its‘Outlook Scenario and Adequacy Forecast 2014-2030’ ‘under a conservative scenario, 47GW of Reliable Available Capacity are required toreach today’s level of adequacy, while this figure will exceed 100GW by 2025’.
Let´s not be mistaken – the divestments in power generation which we have described show that there are some outsiders willing to takesome risk. However, these outsiders would never take the risk of building any new capacity under current market conditions.
From our point of view, we will be watching an investment crisis as soon as the need to add new capacity to the system arises.
2. New measures
CRM (Capacity Remuneration Mechanism). Signals provided by these retribution schemes could be enough to maintain operations ofavailable plants or to reactivate plants in a mothballing situation. Based on this signal, we do not believe investors would risk making newinvestments.
Auctions for new capacity. If private investors or utilities do not cover capacity needs, the auction system will incentivize new investments. Ifthose mechanism are implemented, we can guess existing capacity owners will claim for similar conditions to those obtained by auctionedcapacity ones.
CfD (Contract for Differences). This is just a camouflaged feed- in tariff.
3. Back to the future (or forwards to the past)
The new measures (CRM; Auctions; CfD; etc.) are just a temporary arrangement for a market which does not work. The more externalmeasures are introduced in the market, the worse it will work.
From our point of view, we are heading towards a new re-regulation of power generation, where investment decisions are taken by StatesEnergy Planning bodies and where operators will execute these decisions. Business risks (development, building, operation) will be allocatedto operators who will not bear market risks. Under this environment, outsiders (funds) will be ready to invest and the System would reach thenecessary reliable capacity (with a suitable mix in generation). Bets are welcome!!
11
HES contact
Contact:
Lourdes [email protected]
Tel. +33 1 30 15 78 83 5, Rue du Chant des Oiseaux78360 Montesson (France)
www.hayaenergy.com
12
Back-up
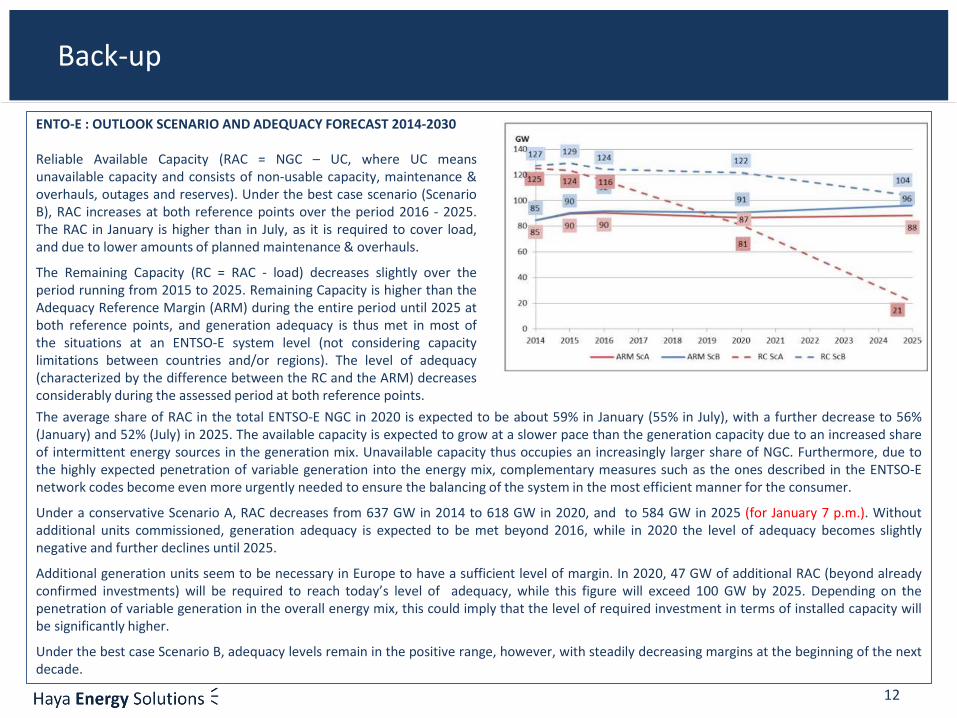
ENTO-E : OUTLOOK SCENARIO AND ADEQUACY FORECAST 2014-2030
Reliable Available Capacity (RAC = NGC – UC, where UC meansunavailable capacity and consists of non-usable capacity, maintenance &overhauls, outages and reserves). Under the best case scenario (ScenarioB), RAC increases at both reference points over the period 2016 - 2025.The RAC in January is higher than in July, as it is required to cover load,and due to lower amounts of planned maintenance & overhauls.
The Remaining Capacity (RC = RAC - load) decreases slightly over theperiod running from 2015 to 2025. Remaining Capacity is higher than theAdequacy Reference Margin (ARM) during the entire period until 2025 atboth reference points, and generation adequacy is thus met in most ofthe situations at an ENTSO-E system level (not considering capacitylimitations between countries and/or regions). The level of adequacy(characterized by the difference between the RC and the ARM) decreasesconsiderably during the assessed period at both reference points.
The average share of RAC in the total ENTSO-E NGC in 2020 is expected to be about 59% in January (55% in July), with a further decrease to 56%(January) and 52% (July) in 2025. The available capacity is expected to grow at a slower pace than the generation capacity due to an increased shareof intermittent energy sources in the generation mix. Unavailable capacity thus occupies an increasingly larger share of NGC. Furthermore, due tothe highly expected penetration of variable generation into the energy mix, complementary measures such as the ones described in the ENTSO-Enetwork codes become even more urgently needed to ensure the balancing of the system in the most efficient manner for the consumer.
Under a conservative Scenario A, RAC decreases from 637 GW in 2014 to 618 GW in 2020, and to 584 GW in 2025 (for January 7 p.m.). Withoutadditional units commissioned, generation adequacy is expected to be met beyond 2016, while in 2020 the level of adequacy becomes slightlynegative and further declines until 2025.
Additional generation units seem to be necessary in Europe to have a sufficient level of margin. In 2020, 47 GW of additional RAC (beyond alreadyconfirmed investments) will be required to reach today’s level of adequacy, while this figure will exceed 100 GW by 2025. Depending on thepenetration of variable generation in the overall energy mix, this could imply that the level of required investment in terms of installed capacity willbe significantly higher.
Under the best case Scenario B, adequacy levels remain in the positive range, however, with steadily decreasing margins at the beginning of the nextdecade.