chairman garrett, ranking member waters, and members … · problematic scenarios do not jeopardize...
TRANSCRIPT

Testimony of the Securities Industry and Financial Markets Association
submitted for the record to a joint hearing of the House Financial Services Committee
Subcommittee on Capital Markets and Government Sponsored Enterprises and the
Subcommittee on Financial Institutions and Consumer Credit
January 18, 2012
the land. Indeed, many of our
SIFMA1 welcomes the opportunity to submit testimony in connection with the
joint hearing of the Subcommittees on Capital Markets and Government Sponsored
Enterprises and Financial Institutions and Consumer Credit on the impact of the
Volcker Rule on markets, businesses, investors and job creation. SIFMA represents
hundreds of firms engaged in the financial services industry. Our members have
sought to provide constructive input throughout the policy debate over the Volcker
Rule. While clearly SIFMA did not support the Volcker Rule during the legislative
process, our members recognize that it was enacted by Congress and is now the law of
members have already begun the process of complying Washington | New York
1101 New York Avenue, 8th Floor | Washington, DC 20005-4269 | P: 202.962.7300 | F: 202.962.7305 www.sifma.org | www.investedinamerica.org
1 SIFMA brings together the shared interests of hundreds of securities firms, banks and asset managers. SIFMA’s mission is to support a strong financial industry, investor opportunity, capital formation, job creation and economic growth, while building trust and confidence in the financial markets. SIFMA, with offices in New York and Washington, D.C., is the U.S. regional member of the Global Financial Markets Association. For more information, visit www.sifma.org.

2
with the Volcker Rule by terminating their walled-off proprietary trading operations in
anticipation of the Rule’s effective date.
On November 7, 2011, four out of the five Agencies tasked with promulgating
regulations to implement the Volcker Rule published a proposal that seeks public
comment on 1,400 questions of increasing detail and complexity. The fifth Agency
released its proposal just last week. We are deeply concerned that the proposed
regulations issued by the Agencies take an overly prescriptive and granular approach,
extending beyond congressional intent and endangering the liquidity of U.S. markets,
the safety and soundness of its financial institutions, and the ability of U.S.
corporations to raise capital, all of which are necessary for economic growth and job
creation.
The statutory text explicitly preserves economic and socially useful trading and market activities which the Agencies should carefully implement.
In drafting the statutory Volcker Rule, Congress identified a number of
important and socially useful trading functions that are traditional to banking entities,
and explicitly preserved these functions as “permitted activities” in the statutory text.
These permitted activities include market making-related activities, risk-mitigating
hedging, underwriting, and trading on behalf of customers, among others. These are
not “loopholes” as some would argue, but deliberate choices made by Congress to
preserve liquidity in U.S. financial markets. Congress appreciated the impact that
freezing up markets in many asset classes would have on the real economy. These

3
important trading activities are crucial to U.S. corporations, asset managers and their
Main Street investors, capital formation, and employment and job creation.
Unfortunately, in drafting the proposed regulations the Agencies have proposed a
compliance and enforcement regime that would ultimately restrict these permitted
activities in a manner that exceeds their statutory authority and conflicts with
congressional intent. By adopting an overly rigid, prescriptive and burdensome
construct, the proposed regulations will have a severe chilling effect on these
traditional and economically beneficial trading activities that Congress explicitly
identified as necessary to the proper functioning of U.S. markets. The proposed
regulations will severely impair U.S. markets in many asset classes, up to now the
deepest and most liquid capital markets in the world. As a result of the unnecessarily
rigid restrictions on trading activity in these markets, U.S. issuers and investors would
suffer from less liquid markets resulting in greater costs of issuance and transaction
costs, and ultimately cost of capital, creating dislocation at a sensitive time for the
economy.
For instance, the proposed rules are unclear regarding whether the entire
municipal securities market is subject to the provisions for permitted trading in state
and local government obligations. Subjecting portions of the municipal market to the
proposed Rule’s restrictions will lead to immense confusion, result in less liquidity,

4
and less access for municipal issuers to low cost financing for essential government
projects.
[The proposed regulations request comments on whether permitted trading activities in
obligations of any State or political subdivision thereof should be extended to State or
municipal agency obligations. The municipal market is made up of over 50,000
different issuing entities and one million CUSIPS outstanding. Depending on the law
of a particular state, an affordable housing or transportation bond in one state may be
issued by a state or county, whereas in a different state a bond for the same purpose
might be issued by a state or county agency or authority. Unless all municipal
securities (as defined by Section 3(a)(29) of the Securities Exchange Act of 1934) are
subject to the provision for permitted trading in state and local government obligations,
there will be no consistency as to the types of municipal securities that are exempt
from the Volcker Rule. This disparate result will lead to immense confusion in the
municipal securities market and affect the safety and soundness of the municipal
market – by some estimates at least 30% of municipal bond issuances may fall outside
the permitted trading in government obligations.]
Another fundamental problem with the proposed regulations is their strong bias
toward agency, as opposed to principal, markets. Market makers provide liquidity by
acting as a principal, not an agent, in most asset classes. In serving as a market maker
for a customer in the U.S. corporate bond market, for example, a banking entity buys a

5
bond from or sells a bond to a customer with the knowledge that there may be little
chance of rapidly reselling the bond and a high likelihood they will have to hold onto
that bond for a significant period of time. The market maker thus becomes exposed, as
principal, to the risk of the market value of the bond in a way that a market maker in
liquid equity securities, who may be able to buy and sell nearly contemporaneously
and generate revenue off of the spread, is not. This model of taking principal positions
as part of market making operates in most other markets as well. Most markets have
low liquidity, few participants and no centralized exchanges. The markets for
commodities, derivatives, municipal securities, securitized products and emerging
market securities, among many others, are characterized by even less liquidity and less
frequent trading than U.S. corporate bonds. As just one of many possible examples,
the Agencies’ proposal so restricts market making activities as to seriously impair the
ability of market makers to make markets in illiquid products by effectively removing
the discretion of market makers to enter into transactions to build inventory, which is
one of the most important elements of market making. An overly restrictive market
making-related permitted activity will significantly decrease liquidity and increase
price volatility in these markets, making it more difficult for market participants to use
the financial markets to invest or hedge commercial exposures. In addition, a narrow
market making-related permitted activity will impair capital formation, which is
dependent upon the liquidity of secondary markets. A study that explains potential
6
impacts on that liquidity was released last month by SIFMA in conjunction with Oliver
Wyman.2
The statutory text also contains an explicit provision permitting risk-mitigating
hedging activity, which is crucial to the safety and soundness of financial institutions.
Unfortunately, the proposed regulations impinge upon legitimate hedging activities,
which must be protected for the health of banking institutions and the financial
markets. As just one of many possible examples, the requirement that each hedge be
“reasonably correlated” to a particular underlying position is particularly problematic
for scenario hedges, where trading units enter into hedges to mitigate the risk of
unlikely “tail” events that might otherwise have a devastating impact on the trading
unit. Scenario hedging, due to the significant but infrequent risk it is trying to mitigate,
requires knowledgeable traders to consider how major yet infrequent events might
affect various markets. The instruments used for scenario hedges may not have high
correlation with movements in the price of assets in normal times, and as a result may
appear to be weakly correlated with the risk and not appropriate for purposes of the
permitted activity. Such hedges, however, are critical to ensuring that particularly
problematic scenarios do not jeopardize the stability of the financial institution.
Indeed, given that the Federal Reserve requires banking entities to perform stress tests
2 Oliver Wyman – SIFMA, The Volcker Rule Restrictions on Proprietary Trading: Implications for the U.S. Corporate Bond Market (December 2011).

7
based upon scenarios, it is puzzling that the proposed regulations do not expressly
permit such activity.
SIFMA understands the difficult task the Agencies have been given. However,
by crafting a compliance regime targeted at the individual trade and trader level, the
Agencies have established compliance and enforcement liability for otherwise
explicitly permitted activities and thus restricted the ability of banking entities to
engage in permitted and economically useful market making and hedging activity.
Perhaps one of the most glaring indications of this quest to eradicate each and every
potential proprietary trade is the requirement for banking institutions to create and
maintain vast amounts of data at the granular trading unit level using seventeen
different metrics for market making activity to be captured on a daily basis and
reported monthly to the Agencies.
The original purpose for limiting investments in hedge funds and private equity funds has been lost in the Agencies’ proposal.
The funds restrictions were intended to serve as a backstop to the proprietary
trading prohibition. As Senator Merkley stated, “if a financial firm were able to
structure its proprietary positions simply as an investment in a hedge fund or private
equity fund, the prohibition on proprietary trading would be easily avoided.”
Unfortunately, however, these restrictions have taken on a life of their own well
beyond the intent of Congress. The statutory text and proposed regulations have swept
within the purview of the Volcker Rule any number of entities that no one would

8
consider to be “hedge funds” or “private equity funds” – a risk that Representative
Frank, Senator Dodd and others noted on the record at the time of enactment and urged
the Agencies to address. For example, Representative Himes noted that “[b]ecause the
bill uses the very broad Investment Company Act approach to define private equity and
hedge funds, it could technically apply to lots of corporate structures, and not just the
hedge funds and private equity funds, [but] I want to confirm that when firms own or
control subsidiaries or joint ventures that are used to hold other investments, that the
Volcker Rule won’t deem those things to be private equity or hedge funds and disrupt
the way the firms structure their normal investment holdings.” The proposed
regulations, however, defined “covered funds” in a manner that appears to make the
prohibitions of the Volcker Rule applicable to virtually every affiliate in a banking
group, including FDIC-insured depository institutions, SEC-registered broker-dealers,
parent holding companies, wholly owned subsidiaries, joint ventures, acquisition
vehicles, minority investments in regulated market utilities such as securities
exchanges and clearing houses, and various other non-fund subsidiaries and affiliates.
This is an absurd result that Congress could not possibly have intended, and is not
required by the language of the statute. It is difficult to overstate the time, effort and
expense banks will have to commit to identifying, monitoring and conforming
thousands of entities in their ownership structures that in no way resemble hedge funds
or private equity funds. If the Agencies define the term “covered fund” in a manner

9
that sweeps in a substantial number of non-fund entities or creates a serious risk of
doing so, it would have a devastating effect on the ability of banking entities to fund,
guarantee or enter into derivatives with non-fund subsidiaries and affiliates, preventing
parent banking entities from acting as a source of strength to thousands of nonbank
subsidiaries by prohibiting ordinary course internal financing, liquidity and risk
management transactions. Further, because asset-backed securities issuers and
insurance-linked securities issues are not hedge funds or private equity funds, the
Agencies should, as intended by the Securitization Exclusion in the legislation, exclude
such issuers from the Proposed Rules’ definition of “covered funds.” Another example
of a financing structure that has been caught up in the definition of “covered funds” is
the repackaging of municipal securities into a structure known as tender obligation
bonds (TOBs) which would be restricted under the proposed Volcker Rule, yet these
products in no way take the form of hedge funds.
The proposed regulations are more like a concept release than a concrete proposal.
The Agencies’ proposal contains 1,347 questions, runs 298 pages, and includes
a rule text and 3 appendices. It appears to be the result of committee drafting, contains
inconsistencies and doesn’t even use the same defined terms throughout. How the
different parts of the proposed regulations interrelate, both to each other and to existing
law, is unclear.

10
The proposal published by the Agencies is not sufficiently complete to be a
proper notice of proposed rulemaking. The proposal acknowledges that the Agencies
are implementing a complex statute, and the number of questions makes clear that
there is much more work to be done before the proposal is complete. Depending on
how the questions are addressed, there are likely to be changes so fundamental to the
nature and characteristics of the rule that a reproposal will be necessary.
The conformance period should be given real meaning, as Congress intended.
The Volcker Rule will become effective on July 21, 2012, whether or not
implementing regulations are in place. On its own, the Volcker Rule will bring about
meaningful behavioral changes in market structures. Combined with other changes
made by the Dodd-Frank Act, it is a paradigm shift.
The Agencies have the power and flexibility to create a workable phase-in to
ensure that the implementation of the Volcker Rule will not unduly disrupt financial
markets. The statutory Volcker Rule explicitly allows for a two-year transition period
after the effective date, ensuring that banks would have sufficient time to prepare for
the new restrictions on their activities. The transition period was intended, as Senator
Merkley put it, to “minimize market disruption while still steadily moving firms away
from the risks of the restricted activities.” Underscoring the importance of a smooth
transition, the statute permits the Federal Reserve to extend the conformance period,
11
but does not contemplate any mechanism for shortening or restricting the conformance
period.
By contrast, the proposed regulations would require that metrics and
compliance systems be in place by July 21, 2012. Moreover, while Congress gave
banking entities two years to “bring [their] activities and investments into compliance,”
the Federal Reserve’s conformance rules impermissibly restrict this conformance
period, providing that the 2-year transition period applies only to “activities,
investments, and relationships . . . that were commenced, acquired, or entered into
before the Volcker Rule’s effective date.” Implementation by banks in the time frame
provided by the Agencies will be extremely difficult for an institution of any size,
particularly in light of the level of granularity at which the compliance program must
be implemented. This herculean feat is not only impossible but is not required by the
statute. Congress contemplated that final regulations would be in place nine months
ahead of effectiveness and provided a two-year transition period; it was not the intent
of Congress that banks would be left scrambling to erect massive compliance
structures within the span of a few short weeks.
In addition, Congress included in the Volcker Rule an extended transition for
investments in illiquid funds, which permits the Federal Reserve to extend the period
during which a banking entity may take or retain its interest in an illiquid fund to the
extent necessary to fulfill a pre-existing contractual obligation. As the Federal

12
Reserve has acknowledged, the purpose of this extended transition period is “to
minimize disruption of existing investments in illiquid funds and permit banking
entities to fulfill existing obligations to illiquid funds.” Congress provided the longest
potential conformance period for investments in illiquid funds because it understood
that the difficulty of divesting or conforming those investments pose the greatest risk
of harm to banking entities and other stakeholders. In implementing this transition
period, however, the Federal Reserve again placed unnecessary restrictions on the
transition period that were not contemplated by Congress, and in fact would largely
read the extension out of the statute. The problems arise primarily from the
conformance rules’ definitions of various terms that are not defined in the statute,
including “illiquid fund,” “illiquid assets,” “principally invested,” “invested,”
“contractually committed,” “contractual obligations” and “necessary to fulfill a
contractual obligation.” SIFMA believes that the current definitions of these terms are
inconsistent with congressional intent and would result in the exclusion of many
genuinely illiquid funds from the transition periods.
As banks attempt to become fully compliant by July 21, 2012 – a mere six
months from now – the result will be extreme dislocations in many markets for
financial assets at a sensitive economic time. This problem is exacerbated by the fact
that the proposal itself leaves so many open questions. Even if the Agencies were to
adopt final regulations immediately after the close of the comment period, without

13
giving any consideration to the comments received, banks would have only five
months to develop significant compliance and reporting structures, new policies and
procedures, including individual trader mandates, and ensure that all new trades were
fully in compliance with the stringent new regulations. In reality, of course, the
Agencies will have received a number of comments addressing hundreds of questions
from the release, which will require their careful review. The Agencies will not be
able to adopt the final rule for some time, leaving banking entities even less time to
prepare for a July 21 effective date. The delay in finalizing regulations makes it even
more critical for the Agencies to respect the Congressionally mandated conformance
period.
It is not clear who should be regulating and enforcing the Volcker Rule.
The statutory Volcker Rule sets forth the rulemaking responsibilities of each
Agency, but is silent as to the division of responsibility for supervision, examination
and enforcement of the implementing regulations. Given the structure of the proposed
regulations, which contemplate the extensive use of principles, metrics and analysis of
explanatory facts and circumstances, the question of which Agency will take the lead
on supervision and enforcement across banking entities and trading units is a critical
one, but is left unanswered in the proposed regulations.
The proposed regulations specify that each Agency will have supervisory,
examination and enforcement authority for the legal entities for which it has

14
rulemaking authority. It is unclear how the Agencies will coordinate the exercise of
their authorities with respect to entities that are subject to supervision by multiple
Agencies, particularly at the trading unit level, where a trading unit and its reportable
quantitative metrics will almost certainly cut across legal entities. SIFMA is deeply
concerned that the Agencies may exercise overlapping jurisdiction, providing
inconsistent or contradictory views on the interpretive questions that will inevitably
arise. As a result, banking entities could be left with the impossible task of complying
with the disparate interpretations of multiple Agencies.
SIFMA believes that one primary regulator should take the lead for any
particular banking entity and its subsidiaries. As the Federal Reserve is the Agency
responsible for enforcement of the Bank Holding Company Act, in which the Volcker
Rule is codified, the Federal Reserve should take primary responsibility for
enforcement of the Volcker Rule. Designating the Federal Reserve as primary
regulator for all banking entities will eliminate the concern of inconsistent or
contradictory enforcement within banking entities as well as the potential for disparate
treatment of different types of banking entities. In addition, the designation of one
primary regulator for all banking entities would avoid duplicative costs between the
Agencies.

15
The benefits of the Volcker Rule as implemented in the proposed regulations will be dwarfed by the costs.
The U.S. economy will be forced to bear both short-term and long-term costs
associated with the reduction in market liquidity that will result from a sudden and
overly restrictive interpretation of the Volcker Rule. The negative impact will
reverberate on Main Street as well as Wall Street. SIFMA, in conjunction with Oliver
Wyman, conducted a study that outlines the potential effect of such regulations on the
corporate bond market. We have attached the study as a supplement to our testimony.
With nearly $1 trillion raised in each of the last several years, the corporate credit
market is a critical source of funding for American businesses. It is also an essential
element of a diversified investment strategy for U.S. household investors who hold
approximately $3 trillion, or almost half of the overall outstanding corporate debt
issuance across direct holdings, pensions, and mutual funds. As proposed, the Volcker
Rule regulations could result in the reduction of liquidity across a wide spectrum of
asset classes and could ultimately cost investors as much as $90 billion to $315 billion
in mark-to-market losses on their existing holdings due to these assets becoming less
liquid and therefore less valuable. Corporate issuers could incur $12 billion to $43
billion in additional annual borrowing costs while investors could experience $1 billion
to $4 billion in incremental annual transaction costs as the level and depth of liquidity
in asset classes are reduced. These costs reflect the far-reaching consequences the

16
Volcker Rule will have not only on financial firms but average American investors if
not appropriately implemented.
Thank you for the opportunity to submit our views. SIFMA appreciates the
attention of the Subcommittees to the vitally important issues for the markets,
businesses, investors and job creation that the Volcker Rule regulations raise.

© 2011 OLIVER WYMANFINANCIAL SERVICES
The Volcker Rule restrictions on proprietary trading Implications for the US corporate bond marketDecember 2011

1© 2011 OLIVER WYMAN
The Volcker Rule restrictions on proprietary trading Implications for the US corporate bond market
Contents
• Impact of the Volcker Rule on liquidity in the US markets
• Impact on investors’ asset valuations
• Impact on issuers’ borrowing costs
• Impact on transaction costs
Appendix: Liquidity impact calculation methodology

2© 2011 OLIVER WYMAN
Executive summary
• Oliver Wyman has estimated the impact of an overly restrictive implementation of the Volcker rule statute on the US corporate credit market – specifically US corporate bonds
• The corporate credit market is a critical source of funding for American businesses (with nearly $1 TN raised each year) and an essential element of a diversified investment strategy for US investors, who hold approximately $3 TN in corporate debt across direct holdings, pensions, and mutual funds1
• An overly restrictive implementation of the Volcker rule (as proposed) would artificially limit banking entities’ability to facilitate trading, hold inventory at levels sufficient to meet investor demand, and actively participate in the market to price assets efficiently – reducing liquidity across a wide spectrum of asset classes
• In the US corporate bond market, any meaningful reduction in liquidity could have significant effects: – Cost investors ~ $90 to 315 BN in mark-to-market loss of value on their existing holdings, as these assets
become less liquid and therefore less valuable– Cost corporate issuers ~ $12 to 43 BN per annum in borrowing costs over time, as investors demand
higher interest payments on the less liquid securities they hold– Cost investors an additional ~ $1 to 4 BN in annual transaction costs, as the level and depth of liquidity in
the asset class is reduced
• Our analysis focuses on the US corporate bond market as an example – the Volcker rule obviously covers other asset classes where liquidity provision by banks also has significant value to the economy as a whole
1. Based on SIFMA and Federal Reserve Flow of Funds data
The Volcker Rule – Implications for the US corporate bond market

3© 2011 OLIVER WYMAN
Summary results of analysis
One-time costs Recurring costs
Asset valuationsIlliquidity discount
Transaction costs N/A Section 4
Section 2 Section 3
Borne by issuers: Issuers will have to pay higher yields on new debt raised to compensate investors for holding less liquid assets
Borne by investors: Asset holders will be directly affected by the market value depreciation
Borne by investors: Investors will have to pay more to trade bonds that are now systematically less liquid
Potential annual costs to investorsof $1 to 4 BN
Potential annual costs to issuers of $2 to 6 BN in year one, and $12 to 43 BN at steady state 1
Potential mark-to-market valuation loss for investors of $90 to 315 BN
1. Steady state implies that all outstanding debt has been refinanced at the higher borrowing costSource: Oliver Wyman analysis
The Volcker Rule – Implications for the US corporate bond market

4© 2011 OLIVER WYMAN
Purpose and scope of analysis
• Quantifying potential economic effects of major policy innovations is inherently difficult, especially when the changes concern the full complexity and range of today’s capital markets
• Our aim in this analysis is to provide a robust view of the magnitude of potential effects of an overly restrictive implementation of the proposed Volcker rule on a single asset class – US corporate bonds
• Our analysis is limited to clear first-order impacts, including– Mark-to-market decrease in value on existing bonds due to loss of liquidity– Higher interest rates paid by corporate bond issuers, due to investors demanding greater liquidity premia– Increases in transactions costs paid by investors, directly due to trading lower liquidity instruments
• Many of these first-order effects would be realized as transfers from one economic group to another (e.g. higher interest rates paid by issuers would be received by investors), but for brevity we refer to each by the most negatively affected group
• We do not directly analyze a wide range of potential knock-on effects, including– Effects due to the Volcker rule that are not directly attributable to loss of liquidity in the US corporate bond
market (e.g. changes in transaction costs caused by shifting economics for Volcker-affected dealers)– The potential replacement of some proportion of intermediation currently provided by Volcker-affected
dealers by dealers not so affected
The Volcker Rule – Implications for the US corporate bond market

5© 2011 OLIVER WYMAN December 23, 2011
Section 1
Liquidity in the US markets

6© 2011 OLIVER WYMAN
A rigid implementation of the Volcker rule (as proposed) will almost certainly reduce market liquidity across several asset classes in the United States
Analytical approach Provisions of the Volcker rule that riskconstraining market liquidity
• The vast majority of asset classes are not agency markets – dealers consistently provide liquidity to these markets as principals
• Even highly liquid asset classes like US Treasuries require significant dealer intermediation and inter-dealer activity
• The main providers of liquidity to these markets are institutions covered by the Volcker that will face at least some restrictions on trading activity
• The Volcker rule therefore risks constraining market liquidity across a number of dimensions (as summarized to the right)
• We frame our analyses of the potential effects of a rigid interpretation of Volcker using three scenarios of overall loss of corporate bond market liquidity
• Artificial limits on size of inventory and retained risk
• Artificial limits on duration of inventory and retained risk
• Restrictions on inter-dealer trading
• Restrictions on active trading to price assets
• Requirement to show consistent revenue and risk dynamics
• Fragmented regulatory oversight and enforcement
1
2
3
4
5
6
The Volcker Rule – Implications for the US corporate bond market

7© 2011 OLIVER WYMAN
Liquidity varies considerably across markets
0x
5x
10x
15x
20x
25x
30x
Treasury Agency MBS Agency Debt Municipal Corporate Equities$0 TN
$5 TN
$10 TN
$15 TN
$20 TN
$25 TN20072008200920102010 value outstanding
1. Annual trading volume defined = average daily volume * 2522. Based on publicly traded securities only. Agency MBS trading largely done in more liquid TBA market.Sources: SIFMA, Treasury, Federal Reserve Bank of New York, TRACE, MSRB, NYSE, NASDAQ, Oliver Wyman analysis
2010Number of securities 2 ~300 >50,000 ~12,000 ~15,000 ~25,000 ~5,000
Total outstanding $9.4 TN $6.9 TN $2.7 TN $2.9 TN $7.5 TN $23.3 TN
Average daily volume $528 BN $321 BN $72 BN $13 BN $16 BN $114 BN
Annual turnover ratio 14.2x 11.8x 6.6x 1.1x 0.5x 1.2x
Annual turnover and value outstandingTurnover, 2006-2010; Value outstanding (in $TN), 2010
Annu
al tr
adin
g vo
lum
e ÷
aver
age
valu
e ou
tsta
ndin
g (a
nnua
l)
The Volcker Rule – Implications for the US corporate bond market

8© 2011 OLIVER WYMAN
Few asset classes are agency markets; even highly liquid products require significant dealer intermediation (as principals) and inter-dealer activity to support liquidity
22% 17%10%
19%
39%
75%77%
83%73%
57%
3% 6% 7% 8% 3%
CorporateDebt
CMO ABS Agency MBS Agency Debt
Principal vs. agency par value tradedPercent share of Average Daily Volume in US markets, Q3 2011
Securitized Products
Inter-dealer
Customer-dealer
1. “An Analysis of CDS Transactions: Implications for Public Reporting” (Staff Report 517, Federal Reserve Bank of New York, September 2011) 2. The Federal Reserve Bank of New York reports Primary Dealer transaction volume for US Treasury securities with (1) Inter-Dealer Brokers and (2) All Other counterparties; trades with Inter-Dealer Brokers (which represent a subset of Inter-Dealer activity) have contributed 40% of volume in 2011 year to dateSources: TRACE, Federal Reserve Bank of New York, Oliver Wyman analysis
Principal
Agency
• Debt markets rely heavily on intermediation by dealers on a ‘principal basis’– Majority of trading volume is directly driven by
customer demand– However, inter-dealer trading is critical to
facilitating these transactions
• Agency trading is naturally limited in scope in these markets– Relatively low levels of overall market liquidity– Enormous variety of individual bond issues
• Market observers (including the FRB) have noted the “importance of market makers, who are willing to take on a position in a rarely traded asset and hold the risk for some time” when these market features are present1
• This concept extends even to liquid markets like Agency Debt and US Treasuries, which were explicitly exempted from the Volcker rule2
“Permitted activities”
The Volcker Rule – Implications for the US corporate bond market

9© 2011 OLIVER WYMAN
And to serve customers in less liquid asset classes, dealers must hold inventory well in excess of trading volume
$0
$20
$40
$60
$80
$100
$120
$140
US corporate securitiesDealer inventory and daily trading volume (in $BN), 09-11 YTD1,2
2009
1. Inventory net of long and short positions; volume represents average daily transaction value2. US corporate securities includes corporate bonds, non-agency MBS, etc. with maturities >1 yearSources: Federal Reserve Bank of New York, Markit
$0
$20
$40
$60
$80
$100
$120
$140
Federal agency securitiesDealer inventory and daily trading volume (in $BN), 09-11 YTD1,2
Ratio of trading inventory to ADV = 4.6x
Ratio of trading inventory to ADV= 1.4x
Trading inventoryADV
2010 2011 2009 2010 2011
The Volcker Rule – Implications for the US corporate bond market

10© 2011 OLIVER WYMAN
The proposed Volcker rule risks reducing market-making activity by affected institutions, and thereby lowering overall market liquidity
1 Artificial limits on size of inventory and retained risk
• Implicit or explicit limits on the size of dealer inventories could lead market makers to ration their support of customer needs not on the basis of economic and risk considerations
• Less liquid instruments or markets would likely be disproportionately affected
2 Artificial limits on duration of inventory and retained risk
• General restrictions on how long market makers can remain in a position are likely to be an overly blunt tool, given how widely liquidity varies by asset class, instrument, and market conditions
• Dealers may be less willing to facilitate large transactions (“block trades”) if they have a limited window of time in which to work down the position without unduly affecting the market price
3 Restrictions on inter-dealer trading
• Virtually all markets rely on some degree of inter-dealer trading, which serves to more efficiently match natural investor order flows, spread concentrated risk positions, and hedge individual and portfolio risks that market makers incur
• Explicit or implicit limits on inter-dealer trading could have negative knock-on consequences on the willingness of market-makers to facilitate customer trades (e.g. due to inability to efficiently hedge risk)
4 Restrictions on active trading to price assets
• In many asset classes, market makers are able and willing to economically offer hedging and trade facilitation services to customers because they are active participants in the markets for related instruments
• Active participation allows market makers to understand and maintain current views on market risk and pricing dynamics, which in turn support customer facilitation
• Restrictions on the degree and manner in which covered dealers can participate in trading could reduce their capacity to assume risk on behalf of customers
5 Requirement to show consistent revenue and risk dynamics
• Many elements of the compliance regime in the proposed rule seem to be based on an assumption that market making functions should show consistent revenue, risk taking, and trading patterns, both over short time periods (day to day) and across different periods of market conditions
• In both more and less liquid markets, customer flows are often “lumpy” (e.g. via facilitating block trades), and volatile risk-taking and revenue are natural consequences for market makers
• In addition, market conditions – and the way market makers both serve customer needs and manage their own risks –can shift substantially over time
6 Fragmented regulatory oversight and enforcement
• The proposed rule leaves supervision and enforcement at one institution as an activity potentially shared by several regulatory agencies
• This will needlessly complicate the regulatory oversight process, and could lead to inconsistent or unpredictable application of restrictions among different legal entities within one institution
The Volcker Rule – Implications for the US corporate bond market

11© 2011 OLIVER WYMAN
Primary dealer Covered by VolckerBank of Nova Scotia
Barclays Capital
BMO Capital Markets
BNP Paribas Securities
Cantor Fitzgerald & Co.Citigroup Global Capital Markets
Credit Suisse Securities (USA)
Daiwa Capital Markets AmericasDeutsche Bank Securities
Goldman, Sachs & Co.
HSBC Securities (USA)
J.P. Morgan Securities
Jefferies & CompanyMerrill Lynch, Pierce, Fenner & Smith
Mizuho Securities USA
Morgan Stanley & Co.
Nomura Securities InternationalRBC Capital Markets
RBS Securities
SG Americas Securities
UBS Securities
The main providers of liquidity across asset classes are the institutions that will be most affected by the Volcker rule
Source: Federal Reserve Bank of New York
The Volcker Rule – Implications for the US corporate bond market

12© 2011 OLIVER WYMAN
50th
percentile (median)
We frame our analyses of the potential effects of a rigid interpretation of the Volcker rule on US corporate bonds using three scenarios of the decline in market liquidity
• We use robust, empirically tested measures of liquidity to understand the distribution of liquidity among the universe of US corporate bonds
• Liquidity measures are based on– Movements of a bond’s market price in response to trades of different sizes (price impact)– Transaction costs (effectively) paid to market makers for trades in that bond– The volatility of price impact and transaction costs over time
• Each liquidity scenario is defined in terms of a market-wide shift equivalent to the differences between the median liquidity bond and a less liquid bond
Distribution of observed liquidity across US corporate bondsIllustrative - observed liquidity is not normally distributed
Least liquid bonds Most liquid bondsSmall scenario: 5% change
Medium scenario: 10% change
Large scenario: 15% change
The Volcker Rule – Implications for the US corporate bond market

13© 2011 OLIVER WYMAN December 23, 2011
Section 2
Impact on investors’ asset valuations
14© 2011 OLIVER WYMAN
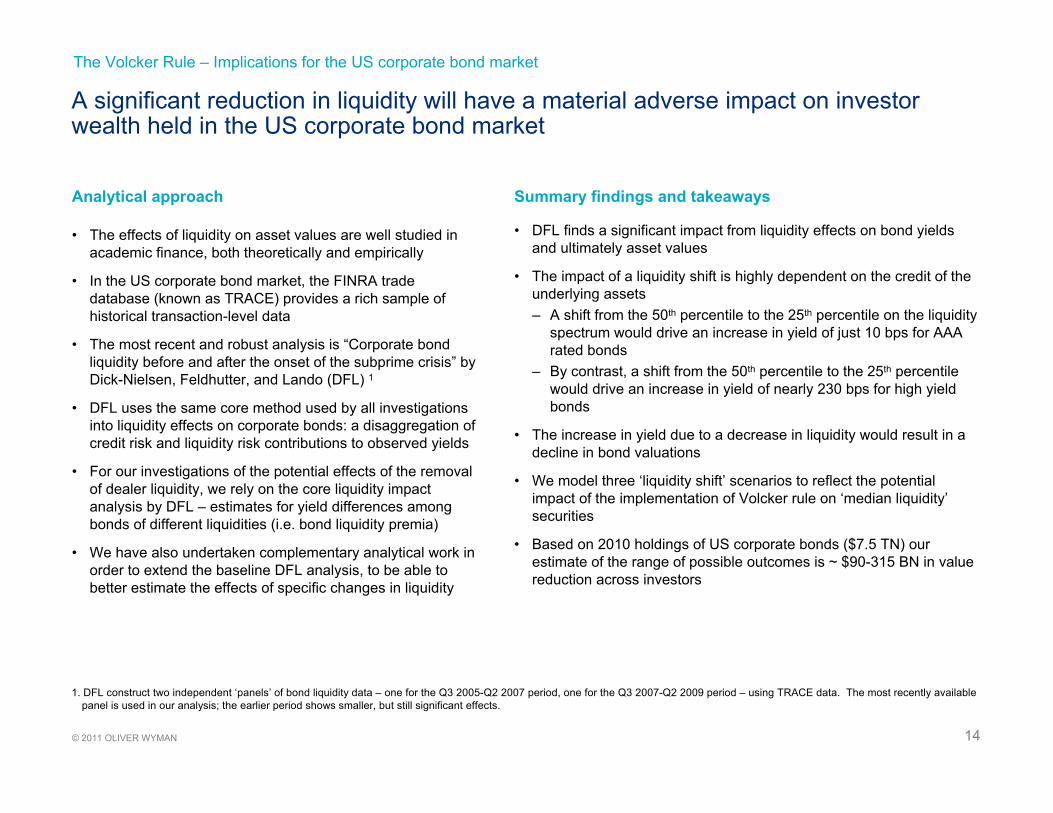
A significant reduction in liquidity will have a material adverse impact on investor wealth held in the US corporate bond market
• The effects of liquidity on asset values are well studied in academic finance, both theoretically and empirically
• In the US corporate bond market, the FINRA trade database (known as TRACE) provides a rich sample of historical transaction-level data
• The most recent and robust analysis is “Corporate bond liquidity before and after the onset of the subprime crisis” by Dick-Nielsen, Feldhutter, and Lando (DFL) 1
• DFL uses the same core method used by all investigations into liquidity effects on corporate bonds: a disaggregation of credit risk and liquidity risk contributions to observed yields
• For our investigations of the potential effects of the removal of dealer liquidity, we rely on the core liquidity impact analysis by DFL – estimates for yield differences among bonds of different liquidities (i.e. bond liquidity premia)
• We have also undertaken complementary analytical work in order to extend the baseline DFL analysis, to be able to better estimate the effects of specific changes in liquidity
• DFL finds a significant impact from liquidity effects on bond yields and ultimately asset values
• The impact of a liquidity shift is highly dependent on the credit of the underlying assets– A shift from the 50th percentile to the 25th percentile on the liquidity
spectrum would drive an increase in yield of just 10 bps for AAArated bonds
– By contrast, a shift from the 50th percentile to the 25th percentile would drive an increase in yield of nearly 230 bps for high yield bonds
• The increase in yield due to a decrease in liquidity would result in a decline in bond valuations
• We model three ‘liquidity shift’ scenarios to reflect the potential impact of the implementation of Volcker rule on ‘median liquidity’securities
• Based on 2010 holdings of US corporate bonds ($7.5 TN) our estimate of the range of possible outcomes is ~ $90-315 BN in value reduction across investors
Analytical approach Summary findings and takeaways
1. DFL construct two independent ‘panels’ of bond liquidity data – one for the Q3 2005-Q2 2007 period, one for the Q3 2007-Q2 2009 period – using TRACE data. The most recently available panel is used in our analysis; the earlier period shows smaller, but still significant effects.
The Volcker Rule – Implications for the US corporate bond market
15© 2011 OLIVER WYMAN
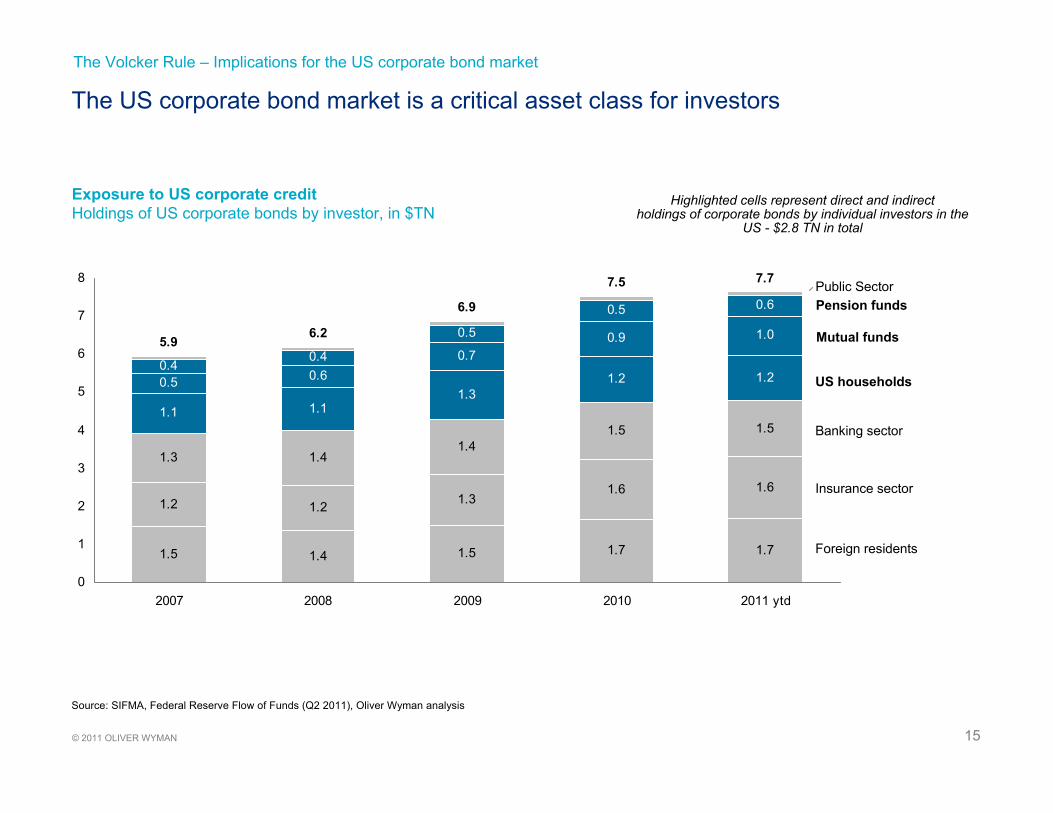
The US corporate bond market is a critical asset class for investors
Banking sector
Insurance sector
Foreign residents
US households
Exposure to US corporate creditHoldings of US corporate bonds by investor, in $TN
Mutual funds
Pension fundsPublic Sector
1.5 1.4 1.5 1.7 1.7
1.2 1.2 1.31.6 1.6
1.3 1.41.4
1.5 1.51.1 1.1
1.31.2 1.20.5 0.6
0.70.9 1.0
0.40.4
0.5
0.5 0.6
5.9 6.2
6.9
7.5 7.7
0
1
2
3
4
5
6
7
8
2007 2008 2009 2010 2011 ytd
Source: SIFMA, Federal Reserve Flow of Funds (Q2 2011), Oliver Wyman analysis
Highlighted cells represent direct and indirectholdings of corporate bonds by individual investors in the
US - $2.8 TN in total
The Volcker Rule – Implications for the US corporate bond market

16© 2011 OLIVER WYMAN
Liquidity is a significant driver of yield on US corporate bonds – particularly at the lower end of the credit spectrum
Percentile liquidity
Rating bucket
AAA AA A BBB HY
99 -6 bps -57 bps -57 bps -77 bps -155 bps
95 -6 bps -55 bps -55 bps -74 bps -149 bps
75 -4 bps -39 bps -40 bps -53 bps -107 bps
60 -2 bps -19 bps -20 bps -26 bps -53 bps
50 0 bps 0 bps 0 bps 0 bps 0 bps
40 3 bps 26 bps 27 bps 35 bps 72 bps
25 10 bps 85 bps 85 bps 114 bps 230 bps
5 25 bps 219 bps 220 bps 293 bps 593 bps
1 29 bps 258 bps 258 bps 344 bps 696 bps
Liquidity premium relative to a bond with median liquidity 1in bps
1. DFL construct two independent ‘panels’ of bond liquidity data – one for the Q3 2005-Q2 2007 period, one for the Q3 2007-Q2 2009 period – using TRACE data. The most recently available panel is used in our analysis; the earlier period shows smaller, but still significant effects.
Sources: TRACE, "Corporate bond liquidity before and after the onset of the subprime crisis" (Dick-Nielsen, Feldhutter, Lando 2011), Oliver Wyman analysis
For example: The liquidity premium of a HY bond with 40th
percentile liquidity is 72 bps higher than that of a bond with median liquidity
The Volcker Rule – Implications for the US corporate bond market

17© 2011 OLIVER WYMAN
Reduced market liquidity is likely to drive substantial mark-to-market loss of value for investors, ranging from $90-315 BN under a range of modeled scenarios
Level of the potential effect
% liquidity decrease from median
Average effect on yield premium 1
Estimated mark-to-market loss of value 2
Share lost on outstanding debt
5% 16bps $90 BN 1.2%Small =
10% 34bps $200 BN 2.5%=Medium
15% 55bps $315 BN 4.1%=Large
“A 15 percentile decrease in liquidity from the median results in an average increase in liquidity premium of 55bps. Given this increase in yield, the market overall would lose an estimated
$315 BN of mark-to-market value, which corresponds to 4.1% of outstanding debt.”
1. DFL construct two independent ‘panels’ of bond liquidity data – one for the Q3 2005-Q2 2007 period, one for the Q3 2007-Q2 2009 period – using TRACE data. The most recently available panel is used in our analysis; the earlier period shows smaller, but still significant effects.
2. Mark-to-market loss calculated as the percent reduction in price of outstanding bonds from face value as a result of yield premium increase (where price is calculated for each rating classification using average coupon and average maturity from Dealogic data) multiplied by the total debt outstanding
Sources: Dealogic, TRACE, "Corporate bond liquidity before and after the onset of the subprime crisis" (Dick-Nielsen, Feldhutter, Lando 2011), Oliver Wyman analysis
The Volcker Rule – Implications for the US corporate bond market

18© 2011 OLIVER WYMAN
The impact of reduced liquidity will have a disproportionate impact on the value of bonds backed by (generally smaller) firms at the lower end of the credit spectrum
Rating bucket
Liquidity change
small(50th to 45th)
medium(50th to 40th)
large(50th to 35th)
AAA 1 bps 3 bps 5 bps
AA 12 bps 26 bps 43 bps
A 12 bps 27 bps 43 bps
BBB 16 bps 35 bps 58 bps
HY 33 bps 72 bps 116 bps
Total 16 bps 34 bps 55 bps
Estimated increase in liquidity premium as a result of liquidity change 1in bps
1. DFL construct two independent ‘panels’ of bond liquidity data – one for the Q3 2005-Q2 2007 period, one for the Q3 2007-Q2 2009 period – using TRACE data. The most recently available panel is used in our analysis; the earlier period shows smaller, but still significant effects.
2. Mark-to-market loss calculated as the percent reduction in price of outstanding bonds from face value as a result of yield premium increase (where price is calculated for each rating classification using average coupon and average maturity from Dealogic data) multiplied by the total debt outstanding
Sources: Dealogic, TRACE, "Corporate bond liquidity before and after the onset of the subprime crisis" (Dick-Nielsen, Feldhutter, Lando 2011), Oliver Wyman analysis
Rating bucket
Liquidity change
small(50th to 45th)
medium(50th to 40th)
large(50th to 35th)
AAA $1 BN $1 BN $2 BN
AA $14 BN $31 BN $50 BN
A $24 BN $51 BN $82 BN
BBB $27 BN $58 BN $93 BN
HY $25 BN $54 BN $86 BN
Total $91 BN $195 BN $313 BN
Estimated mark-to-market loss of value from reduction in bond prices 2
in $BN
Change in premium Mark-to-market loss of value
The Volcker Rule – Implications for the US corporate bond market

19© 2011 OLIVER WYMAN December 23, 2011
Section 3
Impact on issuers’ borrowing costs

20© 2011 OLIVER WYMAN
Increased liquidity premia on corporate bonds will also get passed on to issuers over time in the form of higher coupon rates
• We apply the same methodology for estimating overall changes in liquidity premia for corporate bonds as a baseline for assessing additional costs to issuers– Use DFL analysis of liquidity premia differences
across bonds– Refine DFL results to assess effects of specific
liquidity differences
• We assume that new issuance would pay coupons incorporating any increased liquidity premia, gradually increasing the annual net new cost to corporate debt issuers over time
• Again, DFL finds a significant impact from liquidity effects on bond yields and asset values
• Investors will demand higher interest payments to compensate for the increased liquidity risk associated with holding corporate bonds
• Taking the DFL estimate of changes in liquidity premia, we can estimate total incremental borrowing costs for corporate bond issuers
• Based on total issuance in 2010 (approximately $1 TN across investment grade and high yield bonds) – The outer bound for the first year impact on newly
issued bonds is approximately $6 BN, assuming full effect
– Over time, the steady state level will rise closer to $43 BN as a greater proportion of outstanding bonds absorb the liquidity premium
Analytical approach Summary findings and takeaways
The Volcker Rule – Implications for the US corporate bond market

21© 2011 OLIVER WYMAN
US corporate bond issuance averages approximately $1 TN across the investment grade and high yield markets
High Yield
Investment Grade 1
US corporate issuance Investment grade and high yield issuance, in $BN
992
664754 799 809
136
43
148
264 236
1,128
707
902
1,063 1,045
0
200
400
600
800
1,000
1,200
2007 2008 2009 2010 2011 E
1. Investment grade includes all non-convertible corporate debt, medium-term notes, and Yankee bonds, but excludes all issues with maturities of one year or less and CDs2. 2011 estimated based on 10 months of dataSources: SIFMA, Oliver Wyman analysis
2
The Volcker Rule – Implications for the US corporate bond market

22© 2011 OLIVER WYMAN
Investors will demand higher interest payments on newly issued bonds to compensate for the increased liquidity risk
Rating bucket
Liquidity change
small(50th to 45th)
medium(50th to 40th)
large(50th to 35th)
AAA 1 bps 3 bps 5 bps
AA 12 bps 26 bps 43 bps
A 12 bps 27 bps 43 bps
BBB 16 bps 35 bps 58 bps
HY 33 bps 72 bps 116 bps
Total 16 bps 34 bps 55 bps
1. DFL construct two independent ‘panels’ of bond liquidity data – one for the Q3 2005-Q2 2007 period, one for the Q3 2007-Q2 2009 period – using TRACE data. The most recently available panel is used in our analysis; the earlier period shows smaller, but still significant effects.
Sources: Dealogic, TRACE, "Corporate bond liquidity before and after the onset of the subprime crisis" (Dick-Nielsen, Feldhutter, Lando 2011), Oliver Wyman analysis
Rating bucket
Liquidity change
small(50th to 45th)
medium(50th to 40th)
large(50th to 35th)
AAA $15 MM $30 MM $50 MM
AA $235 MM $510 MM $830 MM
A $350 MM $760 MM $1,240 MM
BBB $400 MM $870 MM $1,410 MM
HY $570 MM $1,235 MM $2,010 MM
Total $1,570 MM $3,405 MM $5,540 MM
Estimated annual incremental issuance cost due to reduction in bond pricesIn $MM
Change in premium Change in issuer cost
Estimated increase in liquidity premium as a result of liquidity change 1in bps
The Volcker Rule – Implications for the US corporate bond market

23© 2011 OLIVER WYMAN
The impact on issuers will grow as outstanding debt is retired and new issues are priced at higher yields
439 439 439 439 439 439 439 439 439 439
2 3 5 6 8 9 11 12 122 4 6 7 9 11 13 14 14
24
69
1113
15 16 16
439445
451456
462467
473478 482 482
350
370
390
410
430
450
470
490
0 1 2 3 4 5 6 7 8 …
Years post rule implementation
Simulated cumulative increase in corporate issuance cost 1In $BN
Cost of ‘Year Zero’ interest
Small liquidity shift $12 BN total
New steady state cost of borrowing
1. DFL construct two independent ‘panels’ of bond liquidity data – one for the Q3 2005-Q2 2007 period, one for the Q3 2007-Q2 2009 period – using TRACE data. The most recently available panel is used in our analysis; the earlier period shows smaller, but still significant effects.
Sources: Dealogic, TRACE, "Corporate bond liquidity before and after the onset of the subprime crisis" (Dick-Nielsen, Feldhutter, Lando 2011), Oliver Wyman analysis
0
Medium liquidity shift $26 BN total
Large liquidity shift $43 BN total
The Volcker Rule – Implications for the US corporate bond market

24© 2011 OLIVER WYMAN
The impact of higher issuer costs is most visible in the potential earnings drag for individual firms
Steady state earnings drag by issuer across liquidity scenarios 1Dollar increase in issuer cost ÷ net income, in %
1. Steady state implies that all outstanding debt has been refinanced at the higher (post liquidity premium) borrowing cost2. Average annual issuance based on 2005 - H1 20113. Similarly rated corporates are those with ratings in the same rating bucket: A+/A/A-, BBB+/BBB/BBB-, High YieldSources: Dealogic, TRACE, Oliver Wyman analysis
-0.9%
-4.0%-5.6%
-1.9%
-8.7%
-12.1%
-3.0%
-14.1%
-19.6%
Caterpillar Harley-Davidson Delta Air Lines
Small liquidity shiftMedium liquidity shiftLarge liquidity shift
Rating bucket A BBB High Yield
Average annual issuance 2 $6.4 BN $0.4 BN $1.4 BN
Debt outstanding $19.4 BN $4.5 BN $14.4 BN
2010 earnings $2,782 MM $147 MM $593 MM
Similarly rated corporates 3(large liquidity shift % drag)
Walt Disney (-1.4%)Coca-Cola (-0.5%)
Kraft Foods (-3.8%)Clorox (-2.4%)
Sears (-20.0%)Del Monte Foods (-6.2%)
The impact of a liquidity shock will fall disproportionately on lower rated,
generally smaller corporates with higher relative debt burdens
The Volcker Rule – Implications for the US corporate bond market

25© 2011 OLIVER WYMAN December 23, 2011
Section 4
Impact on transaction costs

26© 2011 OLIVER WYMAN
Liquidity is a significant driver of transaction costs in the corporate bond market, and a reduction in liquidity would lead to a material increase in costs paid by investors
• There is a clear relationship between liquidity and transaction costs in the corporate bond market
• Using historical data on corporate bond trading from TRACE, we observe– Significant dispersion (40 bps) in average imputed
transaction costs1 driven by liquidity– Average imputed transaction costs for the most liquid
securities ($500 MM+ in daily volume) of 7 bps– Average imputed transaction costs for the least liquid
securities (less than $1 MM in daily volume) of 48 bps
• The average imputed transaction costs for all securities is approximately 20.5 bps, which translates into approximately $6.7 BN in imputed annual transaction costs paid by investors
• A 10% change in liquidity (equivalent to the change in transaction costs between the median bond and the 40th
percentile bond) would mean an average increase of 8bps, adding $2.4 BN in costs for investors
1 Transaction costs proxied using 50% of average purchase and sale price range
Summary findings and takeawaysAnalytical approach
• Our analysis of realized purchase and sales prices was designed to understand the impact of changes in liquidity on transaction costs for investors
• Transaction costs could also be significantly affected in other ways by the Volcker rule that our analysis does not address directly
• Bid-offer spreads are not directly observable in the corporate bond market, and no central repository of bid-offer data exists in the US market today – so transaction costs must be estimated
• We use the FINRA database of corporate bond transactions (known as TRACE) to impute transaction costs from realized purchase and sale prices reported
• Investors’ realized transaction costs are imputed by matching buy and sell transactions for the same security on the same day and averaging dealers’realized purchase and sale price
• For 2009, this yields a rich database of > 250 k observations covering ~ $2.5 TN in transaction value
The Volcker Rule – Implications for the US corporate bond market

27© 2011 OLIVER WYMAN
There is a clear relationship between decreasing liquidity and increasing transaction costs
47.7
32.5
26.222.3
19.716.6
12.5
7.4
20.5
< $1MM $1-5 MM $5-10MM $10-25 MM $25-50 MM $50-100 MM $100-500 MM $500MM + Overall
Trading volume for individual bonds and days
Imputed transaction costs by liquidity bucket 1Transaction costs in bps, liquidity buckets in $ MM of trading volume for each security and day
1 Transaction costs proxied using 50% of average purchase and sale price rangeSources: TRACE, Oliver Wyman analysis
The Volcker Rule – Implications for the US corporate bond market

28© 2011 OLIVER WYMAN
Reduced liquidity in the corporate bond market could increase transaction costs to investors from $7 BN to $11 BN
Imputed transaction costs for investors 1Current and simulated, in $BN
Estimated impact
Percentile increase in transaction costs 5% 10% 15%
Additional Transaction costs 4 bps 8 bps 12 bps
6.7 6.7 6.7
1.32.4
3.98.0
9.1
10.6
Small liquidity shift Medium liquidity shift Large liquidity shift
Current cost
Additional cost
$3.3 TN in annual volume for customer-to-dealer trades
X
20.5 bps on average transactionacross corporate bonds
1 Transaction costs proxied using 50% of average purchase and sale price rangeSources: TRACE, Oliver Wyman analysis
6.7
Scenario 1Estimated transaction costs (current)
The Volcker Rule – Implications for the US corporate bond market

29© 2011 OLIVER WYMAN December 23, 2011
Appendix
Liquidity impact calculation methodology

30© 2011 OLIVER WYMAN
Dick-Nielsen, Feldhutter and Lando conducted the most recent and robust analysis of the effect of reduced liquidity on bond prices, which we use as our starting point
• Dick-Nielsen, Feldhutter and Lando (DFL) clean available data, test different liquidity factors, and analyze liquidity effects across two periods: pre-subprime (Q1 2005 – Q1 2007) and post-subprime (Q2 2007 – Q2 2009)
Clean data Test factors Analyze effects• Dataset of 5,376 bonds with
8.2 MM trades obtained after cross-referencing data from TRACE, Bloomberg, Datastream, and IBES and removing retail-sized and erroneous trades
• Treasury yields and LIBOR rates obtained from the British Bankers’Association
• Using yield spread to swap rate as the dependent variable, eight liquidity measures are regressed to determine which correlated more highly with yield spread
• Credit risk contribution to the yield spread is controlled with 12 additional factors
• DFL create a composite liquidity measure using a normalized average of 4 liquidity measures: Amihud, Imputed Roundtrip Cost, and their standard deviations
• Running the regression using the liquidity measure reveals that the liquidity component of bond yields strongly increased from higher credit rating to lower
• Liquidity component increases at the onset of subprime crisis for all but AAA-rated bonds, which is explained by the flight-to-quality phenomenon
DFL develop a composite measure of liquidity and find its yield spread regression coefficient for each rating bucket
Sources: "Corporate bond liquidity before and after the onset of the subprime crisis" (Dick-Nielsen, Feldhutter, Lando 2011)
• Bond age• Amount issued• Coupon size• Time-to-Maturity• Equity volatility• Ratio of operating
income to sales
• Leverage ratio• Ratio of long term
debt to assets• Interest rate coverage• 10y swap rate• 10y - 1y swap rate• Earnings forecast
dispersion
The Volcker Rule – Implications for the US corporate bond market

31© 2011 OLIVER WYMAN
The DFL composite liquidity measure and its regression coefficients are used to assess the impact of liquidity on our dataset
• After running regressions with eight measures of liquidity, Dick-Nielsen, Feldhutter, and Lando develop a composite liquidity measure, λ, calculated as an equally weighted sum of Amihud’s measure of price impact, a measure of roundtrip cost of trading, and the standard deviations of both, all normalized
• DFL provides certain percentile values of λ and coefficients of λ in regressions on the yield spread for each rating
• We perform an exponential regression on the percentile values of λ to interpolate values at other percentiles
• We use the coefficients from the most recently available period (Q3 2007-Q2 2009) for our analysis of the present
Sources: "Corporate bond liquidity before and after the onset of the subprime crisis" (Dick-Nielsen, Feldhutter, Lando 2011)
The Volcker Rule – Implications for the US corporate bond market

32© 2011 OLIVER WYMAN
We use Dealogic data to supplement the results of the DFL paper and calculate estimates of the effect of a decrease in liquidity on asset values in various scenarios
Sources: Dealogic, "Corporate bond liquidity before and after the onset of the subprime crisis" (Dick-Nielsen, Feldhutter, Lando 2011)
Find liquidity component
Estimate outstanding debt
Determine current yield
• Use Dealogic data to calculate current yield of outstanding debt using average maturity and average coupon for each rating bucket
• Find the difference in liquidity premia between a median liquidity bond and a bond with lower liquidity as per each scenario by multiplying the difference in the liquidity measure by the corresponding regression coefficient for each rating bucket
• Estimate corporate debt outstanding for each rating bucket by assuming same proportions as across 2005 through H1 2011 issuance, for which we have data
• Calculate the percent mark-to-market loss of value as a result of increasing the bond yield by the liquidity component change
• Estimate the mark-to-market loss of value in absolute terms by multiplying by outstanding corporate debt in each rating bucket
• Find the share of total outstanding debt lost by dividing absolute mark-to-market loss of value by the total outstanding debt
1 2 3 Estimate percentile shift costs4
The Volcker Rule – Implications for the US corporate bond market

33© 2011 OLIVER WYMAN
A similar process is used to obtain estimates of costs of credit for future issuance
Sources: Dealogic, "Corporate bond liquidity before and after the onset of the subprime crisis" (Dick-Nielsen, Feldhutter, Lando 2011)
Estimate percentile shift costsFind liquidity componentApproximate annual issuance
• Approximate annual issuance for each rating bucket as that across 2005 through H1 2011
• Calculate the estimated additional annual cost in absolute terms by multiplying annual issuance by the increase in liquidity premium
• Project annual issuance cost by assuming that each year bonds mature and are replaced with more costly bonds as dictated by the maturity rate, so that annual cost increases at the rate of the additional annual cost each year for the amount of time of average maturity, at which point it plateaus to steady state
• Find the difference in liquidity premia between a median liquidity bond and a bond with lower liquidity as per each scenario by multiplying the difference in the liquidity measure by the corresponding regression coefficient for each rating bucket
1 2 3
The Volcker Rule – Implications for the US corporate bond market

34© 2011 OLIVER WYMAN
We use TRACE data to impute transaction costs from realized buy and sell prices reported and calculate the effect of different shift scenarios
Estimate percentile shift costsImpute transaction costsClean TRACE data
• Clean data to remove
– Corrected, cancelled, or removed trades
– Equity linked and agency trades
– Trades with trading volume <$100,000
• Calculate the increase in transaction costs under different scenarios of shift in transaction cost percentiles
• Translate into dollar costs by applying premium to outstanding debt for each rating bucket for each scenario
• Aggregate data by security and day
• Calculate average buy and sell prices weighted by trading volume for each security and day
• Compute transaction costs in absolute terms as half of the difference between the average sell and buy prices, multiplied by the total trading volume for each security and day
• Translate into transaction costs per traded dollar for each security and day by dividing absolute transaction cost by the total price
1 2 3
Sources: TRACE
The Volcker Rule – Implications for the US corporate bond market

35© 2011 OLIVER WYMAN December 23, 2011
Disclaimers

36© 2011 OLIVER WYMAN
This report sets forth the information required by the terms of Oliver Wyman’s engagement by SIFMA and is prepared in the form expressly required thereby. This report is intended to be read and used as a whole and not in parts. Separation or alteration of any section or page from the main body of this report is expressly forbidden and invalidates this report.
This report is not intended for general circulation or publication, nor is it to be used, reproduced, quoted or distributed for any purpose other than those that may be set forth herein without the prior written permission of Oliver Wyman. Neither all nor any part of the contents of this report, any opinions expressed herein, or the firm with which this report is connected, shall be disseminated to the public through advertising media, public relations, news media, sales media, mail, direct transmittal, or any other public means of communications, without the prior written consent of Oliver Wyman.
Information furnished by others, upon which all or portions of this report are based, is believed to be reliable but has not been verified. No warranty is given as to the accuracy of such information. Public information and industry and statistical data are from sources we deem to be reliable; however, we make no representation as to the accuracy or completeness of such information and have accepted the information without further verification.
The findings contained in this report may contain predictions based on current data and historical trends. Any such predictions are subject to inherent risks and uncertainties. In particular, actual results could be impacted by future events which cannot be predicted or controlled, including, without limitation, changes in business strategies, the development of future products and services, changes in market and industry conditions, the outcome of contingencies, changes in management, changes in law or regulations. Oliver Wyman accepts no responsibility for actual results or future events.
The opinions expressed in this report are valid only for the purpose stated herein and as of the date of this report. No obligation is assumed to revise this report to reflect changes, events or conditions, which occur subsequent to the date hereof.
All decisions in connection with the implementation or use of advice or recommendations contained in this report are the sole responsibility of SIFMA. This report does not represent investment advice nor does it provide an opinion regarding the fairness of any transaction to any and all parties.
This report is for the exclusive use of SIFMA. There are no third party beneficiaries with respect to this report, and Oliver Wyman does not accept any liability to any third party. In particular, Oliver Wyman shall not have any liability to any third party in respect of the contents of this report or any actions taken or decisions made as a consequence of the results, advice or recommendations set forth herein.
Report qualifications/assumptions and limiting conditions