chairman’s statement - vtech.com · chairman’s statement 2 vtech holdings limited 2018/2019...
TRANSCRIPT
HKSE 303
VTech Holdings Limited 2018/2019 Interim Report 1
Chairman’s Statement
In the first six months of the financial year 2019 the Group’s revenue and profit decreased. The lower-than-expected results were due to the overall weak performance of the Group’s telecommunication (TEL) products and the logistics issues in continental Europe for electronic learning products (ELPs). There was, however, good progress in Asia Pacific, where VTech continues to expand its presence. The Group also maintained market leadership in its core product areas.
Results and Dividend
Group revenue for the six months ended 30 September 2018 decreased by 3.5% to US$1,003.5 million, owing to lower sales in North America, Europe and Other Regions, which offset growth in Asia Pacific.
Profit attributable to shareholders of the Company declined by 13.0% to US$90.1 million, attributable to lower revenue and higher costs.
Basic earnings per share were 13.1% lower at US35.8 cents, compared to US41.2 cents in the first six months of the previous financial year.
The Board of Directors has declared an interim dividend of US17.0 cents per ordinary share, unchanged from the interim dividend declared in the corresponding period last year.
Costs
The Group’s gross profit margin in the first six months of the financial year 2019 decreased to 29.5%, from 32.3% in the corresponding period last year. The decline was mainly due to product mix, higher materials prices, as well as an increase in direct labour costs and manufacturing overheads, which offset the positive impact of further productivity gains.
US-China Trade Tensions
During the first half of the financial year 2019, the US Government imposed three rounds of tariffs on Chinese imports amounting to US$250 billion of goods. Neither VTech’s ELPs nor its TEL products are included in the list of items targeted. However, the tariffs affect some of the Group’s contract manufacturing services (CMS) customers in cases where they export products manufactured in VTech’s facilities in mainland China to the US. As a contingency, the Group is offering such customers the alternative use of its recently acquired production facilities in Malaysia, should they wish to take advantage of the different location.
Segment Results
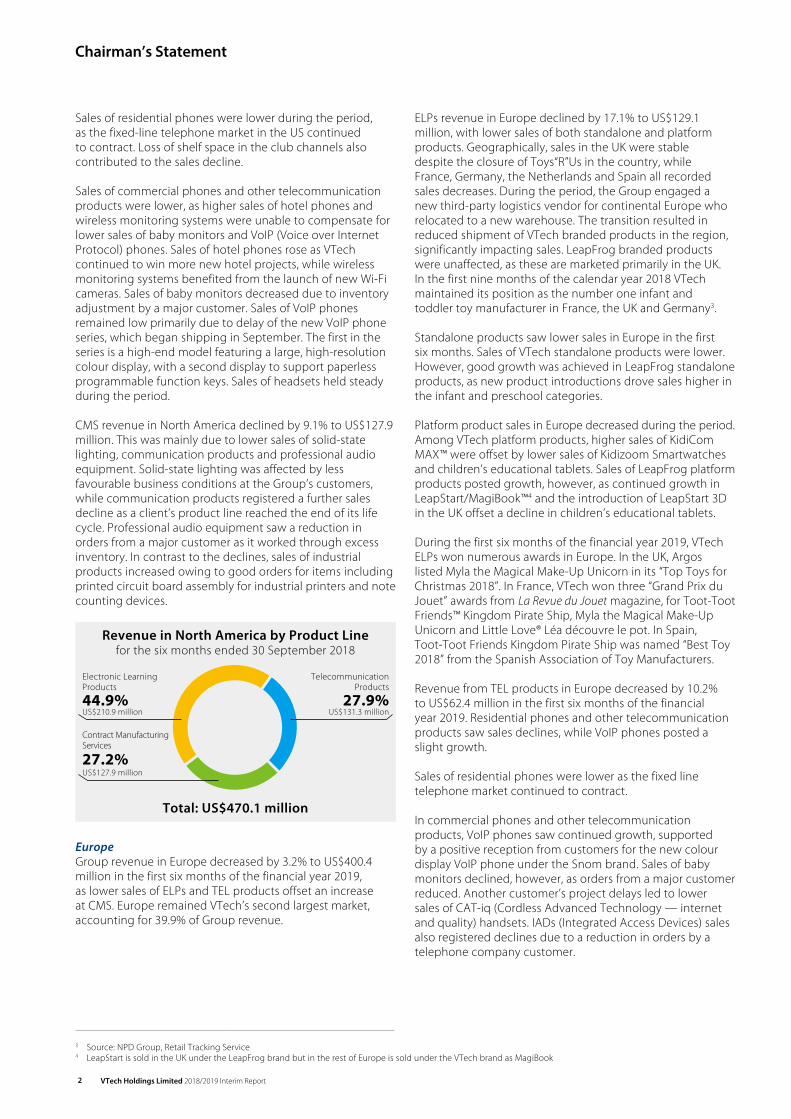
North AmericaGroup revenue in North America fell by 5.9% to US$470.1 million in the first six months of the financial year 2019. Lower sales of TEL products and CMS offset higher sales of ELPs during the period. North America remained VTech’s largest market, accounting for 46.8% of Group revenue.
ELPs revenue in North America rose by 9.6% to US$210.9 million, with growth in both standalone and platform products. The increase resulted from strong sales in Canada and good growth in the US. This was achieved despite the closure of Toys“R”Us in the US, as the Group’s existing customers expanded their shelf space and assortment of toys to capture the business previously conducted by the retailer. Furthermore, the positive reception of new VTech and LeapFrog® branded products allowed the Group to consolidate its market leadership. During the first nine months of the calendar year 2018, the Group maintained its position as the number one manufacturer of electronic learning toys from infancy through toddler and preschool in the US and Canada1.
Growth in standalone products was led by sales increases of both VTech and LeapFrog branded products. For the VTech lines, higher sales of infant and preschool products, the Kidi line and Kidizoom® Camera offset lower sales of the Go! Go! Smart family of products. Among the new standalone products launched, Chase Me Casey™ and Stroll & Discover Activity Walker™ sold particularly well. Strong growth of LeapFrog products also reflected higher sales of infant and preschool products. This follows efforts by the Group to support the LeapFrog brand through the launch of new learning toys such as Learning Friends 100 Words Book™ and Go-with-Me ABC Backpack™.
Platform products also registered higher sales during the period, with growth across both brands. VTech saw higher sales of Kidizoom Smartwatch DX2 and KidiBuzz™, while in August 2018, the new Explore and Write Activity Desk™ hit the market, an update of the popular Touch and Learn Activity Desk™. Growth in the LeapFrog brand was driven by higher sales of both reading systems, including the newly launched LeapStart® 3D, and children’s educational tablets. There was also a sales contribution from LeapFrog Academy™, which was introduced to the major English-speaking countries in August 2017.
During the six months, the Group’s ELPs received more than 70 awards from toy and parenting industry experts, key retailers and toy advisory boards in the US. Among the major awards, Kidi Star Karaoke Machine™ was included in Amazon.com’s “Top 100 Holiday Toys 2018”, while Explore and Write Activity Desk made Walmart’s “Top Rated Toys by Kids” list. In another important award, Learning Friends 100 Words Book and LeapStart 3D were both winners of National Parenting Product Awards (NAPPA). They were also named to the “TTPM Most Wanted List” of hot holiday toys.
TEL products revenue in North America decreased by 21.2% to US$131.3 million. Residential phones, commercial phones and other telecommunication products registered lower sales. During the period, VTech continued to maintain its leadership position in the US residential phones market2.
1 Source: NPD Group, Retail Tracking Service. Ranking based on total retail sales of VTech and LeapFrog products in the combined toy categories of early electronic learning, toddler figure and playset, walker, electronic entertainment (excluding tablets) and preschool electronic learning for the calendar year ending September 2018
2 Source: MarketWise Consumer Insights, LLC
Chairman’s Statement
VTech Holdings Limited 2018/2019 Interim Report2
Sales of residential phones were lower during the period, as the fixed-line telephone market in the US continued to contract. Loss of shelf space in the club channels also contributed to the sales decline.
Sales of commercial phones and other telecommunication products were lower, as higher sales of hotel phones and wireless monitoring systems were unable to compensate for lower sales of baby monitors and VoIP (Voice over Internet Protocol) phones. Sales of hotel phones rose as VTech continued to win more new hotel projects, while wireless monitoring systems benefited from the launch of new Wi-Fi cameras. Sales of baby monitors decreased due to inventory adjustment by a major customer. Sales of VoIP phones remained low primarily due to delay of the new VoIP phone series, which began shipping in September. The first in the series is a high-end model featuring a large, high-resolution colour display, with a second display to support paperless programmable function keys. Sales of headsets held steady during the period.
CMS revenue in North America declined by 9.1% to US$127.9 million. This was mainly due to lower sales of solid-state lighting, communication products and professional audio equipment. Solid-state lighting was affected by less favourable business conditions at the Group’s customers, while communication products registered a further sales decline as a client’s product line reached the end of its life cycle. Professional audio equipment saw a reduction in orders from a major customer as it worked through excess inventory. In contrast to the declines, sales of industrial products increased owing to good orders for items including printed circuit board assembly for industrial printers and note counting devices.
Telecommunication Products
27.9%US$131.3 million
Electronic Learning Products
44.9%US$210.9 million
Contract Manufacturing Services
27.2%US$127.9 million
Revenue in North America by Product Linefor the six months ended 30 September 2018
Total: US$470.1 million
EuropeGroup revenue in Europe decreased by 3.2% to US$400.4 million in the first six months of the financial year 2019, as lower sales of ELPs and TEL products offset an increase at CMS. Europe remained VTech’s second largest market, accounting for 39.9% of Group revenue.
ELPs revenue in Europe declined by 17.1% to US$129.1 million, with lower sales of both standalone and platform products. Geographically, sales in the UK were stable despite the closure of Toys“R”Us in the country, while France, Germany, the Netherlands and Spain all recorded sales decreases. During the period, the Group engaged a new third-party logistics vendor for continental Europe who relocated to a new warehouse. The transition resulted in reduced shipment of VTech branded products in the region, significantly impacting sales. LeapFrog branded products were unaffected, as these are marketed primarily in the UK. In the first nine months of the calendar year 2018 VTech maintained its position as the number one infant and toddler toy manufacturer in France, the UK and Germany3.
Standalone products saw lower sales in Europe in the first six months. Sales of VTech standalone products were lower. However, good growth was achieved in LeapFrog standalone products, as new product introductions drove sales higher in the infant and preschool categories.
Platform product sales in Europe decreased during the period. Among VTech platform products, higher sales of KidiCom MAX™ were offset by lower sales of Kidizoom Smartwatches and children’s educational tablets. Sales of LeapFrog platform products posted growth, however, as continued growth in LeapStart/MagiBook™4 and the introduction of LeapStart 3D in the UK offset a decline in children’s educational tablets.
During the first six months of the financial year 2019, VTech ELPs won numerous awards in Europe. In the UK, Argos listed Myla the Magical Make-Up Unicorn in its “Top Toys for Christmas 2018”. In France, VTech won three “Grand Prix du Jouet” awards from La Revue du Jouet magazine, for Toot-Toot Friends™ Kingdom Pirate Ship, Myla the Magical Make-Up Unicorn and Little Love® Léa découvre le pot. In Spain, Toot-Toot Friends Kingdom Pirate Ship was named “Best Toy 2018” from the Spanish Association of Toy Manufacturers.
Revenue from TEL products in Europe decreased by 10.2% to US$62.4 million in the first six months of the financial year 2019. Residential phones and other telecommunication products saw sales declines, while VoIP phones posted a slight growth.
Sales of residential phones were lower as the fixed line telephone market continued to contract.
In commercial phones and other telecommunication products, VoIP phones saw continued growth, supported by a positive reception from customers for the new colour display VoIP phone under the Snom brand. Sales of baby monitors declined, however, as orders from a major customer reduced. Another customer’s project delays led to lower sales of CAT-iq (Cordless Advanced Technology — internet and quality) handsets. IADs (Integrated Access Devices) sales also registered declines due to a reduction in orders by a telephone company customer.
3 Source: NPD Group, Retail Tracking Service4 LeapStart is sold in the UK under the LeapFrog brand but in the rest of Europe is sold under the VTech brand as MagiBook
VTech Holdings Limited 2018/2019 Interim Report 3
Chairman’s Statement
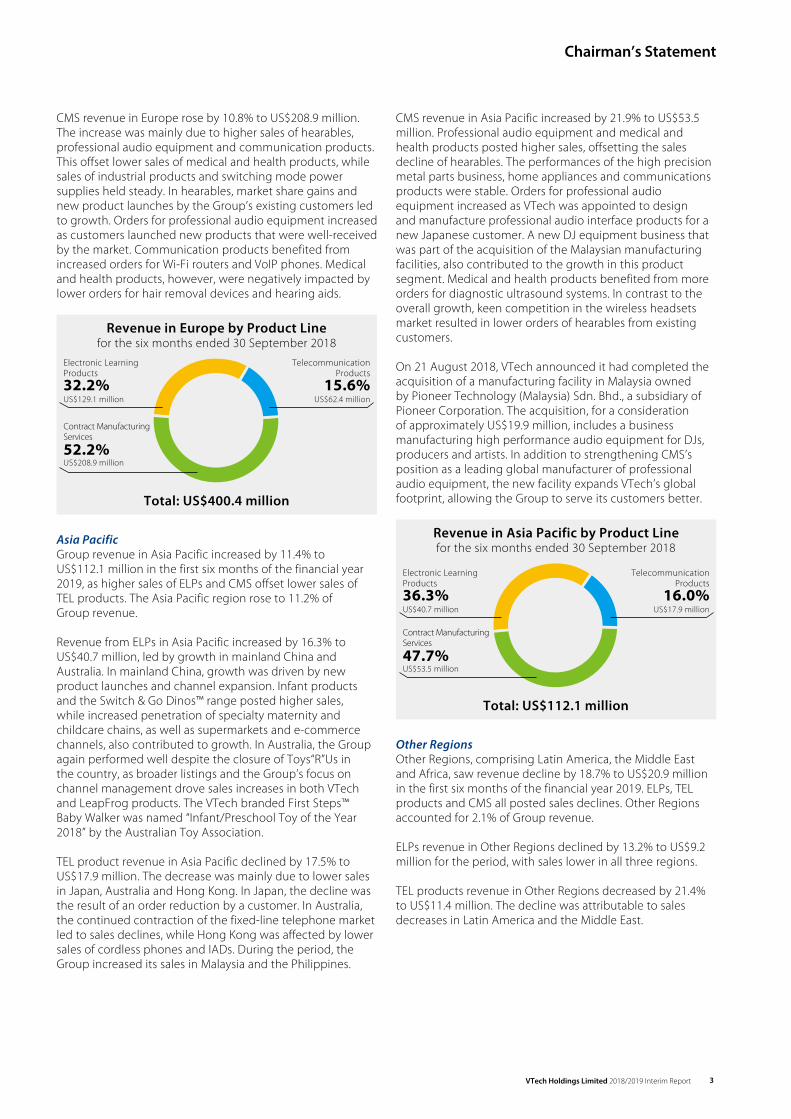
CMS revenue in Europe rose by 10.8% to US$208.9 million. The increase was mainly due to higher sales of hearables, professional audio equipment and communication products. This offset lower sales of medical and health products, while sales of industrial products and switching mode power supplies held steady. In hearables, market share gains and new product launches by the Group’s existing customers led to growth. Orders for professional audio equipment increased as customers launched new products that were well-received by the market. Communication products benefited from increased orders for Wi-Fi routers and VoIP phones. Medical and health products, however, were negatively impacted by lower orders for hair removal devices and hearing aids.
Telecommunication Products
15.6%US$62.4 million
Electronic Learning Products
32.2%US$129.1 million
Contract Manufacturing Services
52.2%US$208.9 million
Revenue in Europe by Product Linefor the six months ended 30 September 2018
Total: US$400.4 million
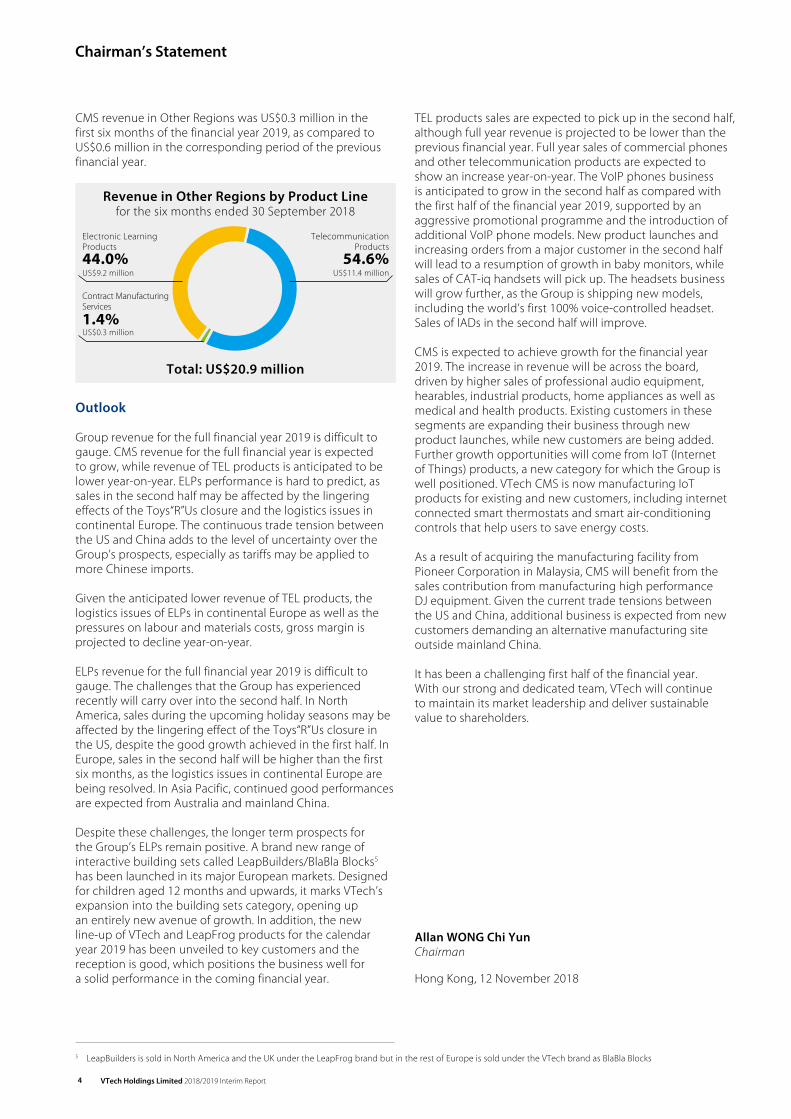
Asia PacificGroup revenue in Asia Pacific increased by 11.4% to US$112.1 million in the first six months of the financial year 2019, as higher sales of ELPs and CMS offset lower sales of TEL products. The Asia Pacific region rose to 11.2% of Group revenue.
Revenue from ELPs in Asia Pacific increased by 16.3% to US$40.7 million, led by growth in mainland China and Australia. In mainland China, growth was driven by new product launches and channel expansion. Infant products and the Switch & Go Dinos™ range posted higher sales, while increased penetration of specialty maternity and childcare chains, as well as supermarkets and e-commerce channels, also contributed to growth. In Australia, the Group again performed well despite the closure of Toys“R”Us in the country, as broader listings and the Group’s focus on channel management drove sales increases in both VTech and LeapFrog products. The VTech branded First Steps™ Baby Walker was named “Infant/Preschool Toy of the Year 2018” by the Australian Toy Association.
TEL product revenue in Asia Pacific declined by 17.5% to US$17.9 million. The decrease was mainly due to lower sales in Japan, Australia and Hong Kong. In Japan, the decline was the result of an order reduction by a customer. In Australia, the continued contraction of the fixed-line telephone market led to sales declines, while Hong Kong was affected by lower sales of cordless phones and IADs. During the period, the Group increased its sales in Malaysia and the Philippines.
CMS revenue in Asia Pacific increased by 21.9% to US$53.5 million. Professional audio equipment and medical and health products posted higher sales, offsetting the sales decline of hearables. The performances of the high precision metal parts business, home appliances and communications products were stable. Orders for professional audio equipment increased as VTech was appointed to design and manufacture professional audio interface products for a new Japanese customer. A new DJ equipment business that was part of the acquisition of the Malaysian manufacturing facilities, also contributed to the growth in this product segment. Medical and health products benefited from more orders for diagnostic ultrasound systems. In contrast to the overall growth, keen competition in the wireless headsets market resulted in lower orders of hearables from existing customers.
On 21 August 2018, VTech announced it had completed the acquisition of a manufacturing facility in Malaysia owned by Pioneer Technology (Malaysia) Sdn. Bhd., a subsidiary of Pioneer Corporation. The acquisition, for a consideration of approximately US$19.9 million, includes a business manufacturing high performance audio equipment for DJs, producers and artists. In addition to strengthening CMS’s position as a leading global manufacturer of professional audio equipment, the new facility expands VTech’s global footprint, allowing the Group to serve its customers better.
Telecommunication Products
16.0%US$17.9 million
Electronic Learning Products
36.3%US$40.7 million
Contract Manufacturing Services
47.7%US$53.5 million
Revenue in Asia Pacific by Product Linefor the six months ended 30 September 2018
Total: US$112.1 million
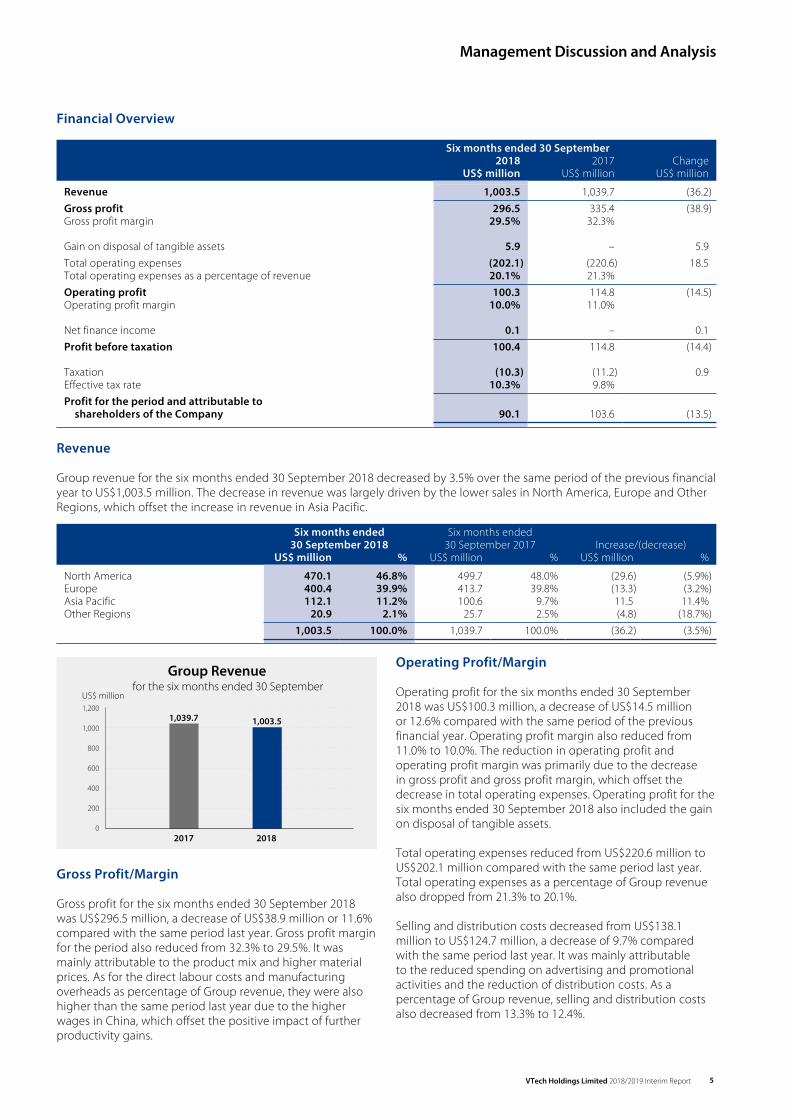
Other RegionsOther Regions, comprising Latin America, the Middle East and Africa, saw revenue decline by 18.7% to US$20.9 million in the first six months of the financial year 2019. ELPs, TEL products and CMS all posted sales declines. Other Regions accounted for 2.1% of Group revenue.
ELPs revenue in Other Regions declined by 13.2% to US$9.2 million for the period, with sales lower in all three regions.
TEL products revenue in Other Regions decreased by 21.4% to US$11.4 million. The decline was attributable to sales decreases in Latin America and the Middle East.
Chairman’s Statement
VTech Holdings Limited 2018/2019 Interim Report4
CMS revenue in Other Regions was US$0.3 million in the first six months of the financial year 2019, as compared to US$0.6 million in the corresponding period of the previous financial year.
Telecommunication Products
54.6%US$11.4 million
Electronic Learning Products
44.0%US$9.2 million
Contract Manufacturing Services
1.4%US$0.3 million
Revenue in Other Regions by Product Linefor the six months ended 30 September 2018
Total: US$20.9 million
Outlook
Group revenue for the full financial year 2019 is difficult to gauge. CMS revenue for the full financial year is expected to grow, while revenue of TEL products is anticipated to be lower year-on-year. ELPs performance is hard to predict, as sales in the second half may be affected by the lingering effects of the Toys“R”Us closure and the logistics issues in continental Europe. The continuous trade tension between the US and China adds to the level of uncertainty over the Group’s prospects, especially as tariffs may be applied to more Chinese imports.
Given the anticipated lower revenue of TEL products, the logistics issues of ELPs in continental Europe as well as the pressures on labour and materials costs, gross margin is projected to decline year-on-year.
ELPs revenue for the full financial year 2019 is difficult to gauge. The challenges that the Group has experienced recently will carry over into the second half. In North America, sales during the upcoming holiday seasons may be affected by the lingering effect of the Toys“R”Us closure in the US, despite the good growth achieved in the first half. In Europe, sales in the second half will be higher than the first six months, as the logistics issues in continental Europe are being resolved. In Asia Pacific, continued good performances are expected from Australia and mainland China.
Despite these challenges, the longer term prospects for the Group’s ELPs remain positive. A brand new range of interactive building sets called LeapBuilders/BlaBla Blocks5 has been launched in its major European markets. Designed for children aged 12 months and upwards, it marks VTech’s expansion into the building sets category, opening up an entirely new avenue of growth. In addition, the new line-up of VTech and LeapFrog products for the calendar year 2019 has been unveiled to key customers and the reception is good, which positions the business well for a solid performance in the coming financial year.
TEL products sales are expected to pick up in the second half, although full year revenue is projected to be lower than the previous financial year. Full year sales of commercial phones and other telecommunication products are expected to show an increase year-on-year. The VoIP phones business is anticipated to grow in the second half as compared with the first half of the financial year 2019, supported by an aggressive promotional programme and the introduction of additional VoIP phone models. New product launches and increasing orders from a major customer in the second half will lead to a resumption of growth in baby monitors, while sales of CAT-iq handsets will pick up. The headsets business will grow further, as the Group is shipping new models, including the world’s first 100% voice-controlled headset. Sales of IADs in the second half will improve.
CMS is expected to achieve growth for the financial year 2019. The increase in revenue will be across the board, driven by higher sales of professional audio equipment, hearables, industrial products, home appliances as well as medical and health products. Existing customers in these segments are expanding their business through new product launches, while new customers are being added. Further growth opportunities will come from IoT (Internet of Things) products, a new category for which the Group is well positioned. VTech CMS is now manufacturing IoT products for existing and new customers, including internet connected smart thermostats and smart air-conditioning controls that help users to save energy costs.
As a result of acquiring the manufacturing facility from Pioneer Corporation in Malaysia, CMS will benefit from the sales contribution from manufacturing high performance DJ equipment. Given the current trade tensions between the US and China, additional business is expected from new customers demanding an alternative manufacturing site outside mainland China.
It has been a challenging first half of the financial year. With our strong and dedicated team, VTech will continue to maintain its market leadership and deliver sustainable value to shareholders.
Allan WONG Chi YunChairman
Hong Kong, 12 November 2018
5 LeapBuilders is sold in North America and the UK under the LeapFrog brand but in the rest of Europe is sold under the VTech brand as BlaBla Blocks
VTech Holdings Limited 2018/2019 Interim Report 5
Management Discussion and Analysis
Financial Overview
Six months ended 30 September2018 2017 Change
US$ million US$ million US$ million
Revenue 1,003.5 1,039.7 (36.2) Gross profit 296.5 335.4 (38.9)Gross profit margin 29.5% 32.3%
Gain on disposal of tangible assets 5.9 – 5.9Total operating expenses (202.1) (220.6) 18.5Total operating expenses as a percentage of revenue 20.1% 21.3% Operating profit 100.3 114.8 (14.5)Operating profit margin 10.0% 11.0%
Net finance income 0.1 – 0.1 Profit before taxation 100.4 114.8 (14.4)
Taxation (10.3) (11.2) 0.9Effective tax rate 10.3% 9.8% Profit for the period and attributable to
shareholders of the Company 90.1 103.6 (13.5)
Revenue
Group revenue for the six months ended 30 September 2018 decreased by 3.5% over the same period of the previous financial year to US$1,003.5 million. The decrease in revenue was largely driven by the lower sales in North America, Europe and Other Regions, which offset the increase in revenue in Asia Pacific.
Six months ended 30 September 2018
Six months ended 30 September 2017 Increase/(decrease)
US$ million % US$ million % US$ million %
North America 470.1 46.8% 499.7 48.0% (29.6) (5.9%)Europe 400.4 39.9% 413.7 39.8% (13.3) (3.2%)Asia Pacific 112.1 11.2% 100.6 9.7% 11.5 11.4%Other Regions 20.9 2.1% 25.7 2.5% (4.8) (18.7%)
1,003.5 100.0% 1,039.7 100.0% (36.2) (3.5%)
Group Revenuefor the six months ended 30 September
2017 2018
1,200
1,000
600
800
200
400
0
1,039.7 1,003.5
US$ million
Gross Profit/Margin
Gross profit for the six months ended 30 September 2018 was US$296.5 million, a decrease of US$38.9 million or 11.6% compared with the same period last year. Gross profit margin for the period also reduced from 32.3% to 29.5%. It was mainly attributable to the product mix and higher material prices. As for the direct labour costs and manufacturing overheads as percentage of Group revenue, they were also higher than the same period last year due to the higher wages in China, which offset the positive impact of further productivity gains.
Operating Profit/Margin
Operating profit for the six months ended 30 September 2018 was US$100.3 million, a decrease of US$14.5 million or 12.6% compared with the same period of the previous financial year. Operating profit margin also reduced from 11.0% to 10.0%. The reduction in operating profit and operating profit margin was primarily due to the decrease in gross profit and gross profit margin, which offset the decrease in total operating expenses. Operating profit for the six months ended 30 September 2018 also included the gain on disposal of tangible assets.
Total operating expenses reduced from US$220.6 million to US$202.1 million compared with the same period last year. Total operating expenses as a percentage of Group revenue also dropped from 21.3% to 20.1%.
Selling and distribution costs decreased from US$138.1 million to US$124.7 million, a decrease of 9.7% compared with the same period last year. It was mainly attributable to the reduced spending on advertising and promotional activities and the reduction of distribution costs. As a percentage of Group revenue, selling and distribution costs also decreased from 13.3% to 12.4%.
Management Discussion and Analysis
VTech Holdings Limited 2018/2019 Interim Report6
Administrative and other operating expenses decreased from US$43.3 million to US$39.1 million compared with the same period last year. It was mainly due to the decrease in employee related costs and lower legal and professional fees. The net exchange gain arising from the Group’s global operations in the ordinary course of business was US$0.2 million, as compared with an exchange loss of US$0.2 million in the corresponding period of last year. Administrative and other operating expenses as a percentage of Group revenue also decreased from 4.2% to 3.9%.
During the first half of the financial year 2019, the research and development expenses were US$38.3 million, a decrease of 2.3% compared with the same period last year. Research and development expenses as a percentage of Group revenue was 3.8%, same as the corresponding period last year.
Profit Attributable to Shareholders and Earnings per Share
Profit attributable to shareholders of the Company for the six months ended 30 September 2018 was US$90.1 million, a decrease of US$13.5 million or 13.0% compared with the same period last year. Net profit margin also decreased from 10.0% to 9.0%.
Basic earnings per share for the six months ended 30 September 2018 were US35.8 cents as compared to US41.2 cents in the first half of the previous financial year.
Prof it Attributable to Shareholders of the Companyfor the six months ended 30 September
US$ million
2017 2018
120
100
60
80
20
40
0
103.690.1
Dividends
Since the end of the relevant financial period, the directors of the Company (the “Directors”) have declared an interim dividend of US17.0 cents per share, which is estimated to be US$42.8 million.
Liquidity and Financial Resources
The Group’s financial resources remain strong. As of 30 September 2018, the Group had deposits and cash of US$74.3 million and was debt-free. The Group also has adequate liquidity to meet its current and future working capital requirements.
Working Capital
Stocks as of 30 September 2018 were US$492.6 million, increased from US$349.9 million as of 31 March 2018 with turnover days of 102 days. The higher stock level was primarily due to the higher demand of the Group’s products in the second half of the financial year and the seasonality of most of the Group’s businesses. Furthermore, we had arranged early production of the Group’s products in order to better utilise the Group’s production capacities. As compared to the corresponding period of last financial year, stocks increased by US$35.7 million or 7.8%, and turnover days also increased from 128 days to 138 days. The higher stock level compared with the same period last year was mainly due to the increased demand for the Group’s products in the second half of the financial year 2019 and the increase in in-house production of Snom products.
Trade debtors as of 30 September 2018 were US$471.1 million, increased from US$264.9 million as of 31 March 2018 with turnover days of 65 days. This was mainly due to the seasonal nature of most of the Group’s businesses. As compared to the corresponding period of last financial year, trade debtors increased by US$8.2 million or 1.8%, while turnover days decreased from 64 days to 63 days.
Trade creditors as of 30 September 2018 were US$402.9 million, increased from US$209.4 million as of 31 March 2018 with turnover days of 91 days. As compared to the corresponding period of last financial year, trade creditors increased by US$46.3 million or 13.0%, and turnover days also increased from 94 days to 103 days.
Treasury Policies
The Group’s treasury policies are designed to mitigate the impact of fluctuations in foreign currency exchange rates arising from the Group’s global operations. The Group principally use forward foreign exchange contracts as appropriate to hedge the foreign exchange risks in the ordinary course of business. It is the Group’s policy not to enter into derivative transactions for speculative purposes.
Capital Expenditure and Contingencies
For the six months ended 30 September 2018, the Group invested US$22.3 million in the purchase of tangible assets including machinery and equipment, leasehold improvements, office equipment, as well as the improvement of manufacturing working environment. All of these capital expenditures were financed from internal resources.
As of 30 September 2018, the Group had no material contingencies.
VTech Holdings Limited 2018/2019 Interim Report 7
Interim Financial Report
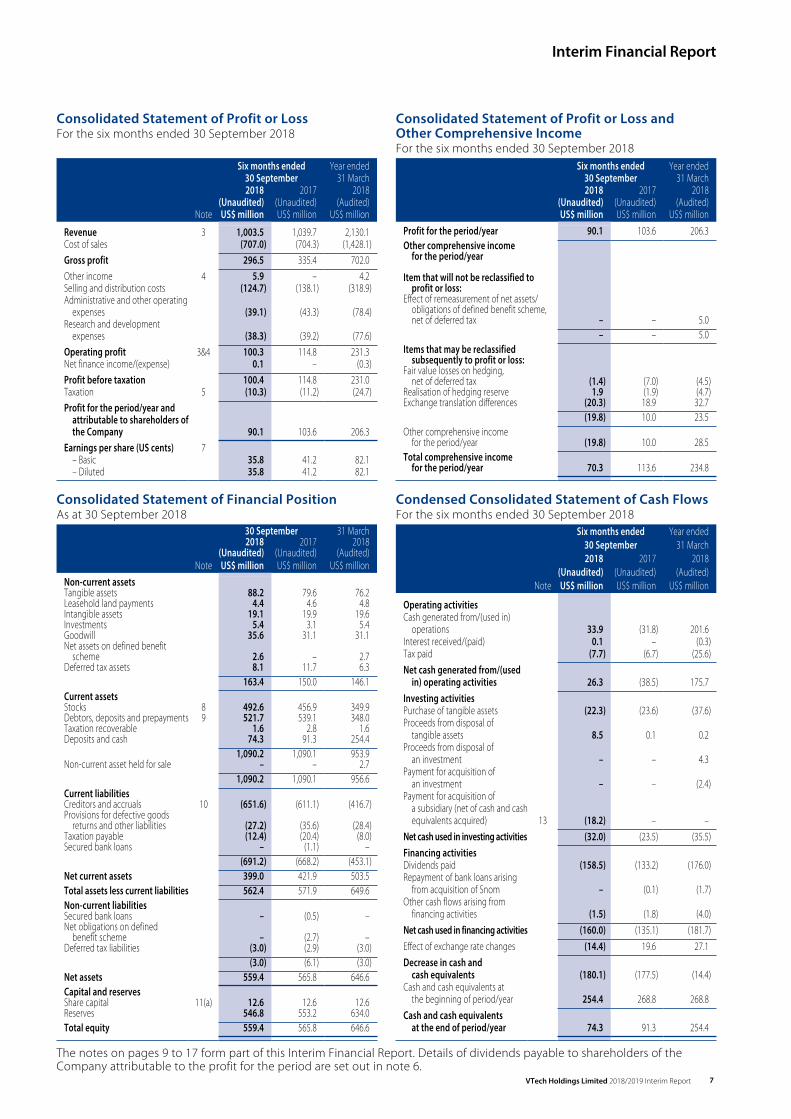
Consolidated Statement of Profit or LossFor the six months ended 30 September 2018
Six months ended 30 September
Year ended 31 March
2018 2017 2018(Unaudited) (Unaudited) (Audited)
Note US$ million US$ million US$ million
Revenue 3 1,003.5 1,039.7 2,130.1Cost of sales (707.0) (704.3) (1,428.1) Gross profit 296.5 335.4 702.0 Other income 4 5.9 – 4.2Selling and distribution costs (124.7) (138.1) (318.9)Administrative and other operating
expenses (39.1) (43.3) (78.4)Research and development
expenses (38.3) (39.2) (77.6) Operating profit 3&4 100.3 114.8 231.3Net finance income/(expense) 0.1 – (0.3) Profit before taxation 100.4 114.8 231.0Taxation 5 (10.3) (11.2) (24.7) Profit for the period/year and
attributable to shareholders of the Company 90.1 103.6 206.3
Earnings per share (US cents) 7– Basic 35.8 41.2 82.1– Diluted 35.8 41.2 82.1
Consolidated Statement of Profit or Loss and Other Comprehensive IncomeFor the six months ended 30 September 2018
Six months ended 30 September
Year ended 31 March
2018 2017 2018(Unaudited) (Unaudited) (Audited)US$ million US$ million US$ million
Profit for the period/year 90.1 103.6 206.3 Other comprehensive income
for the period/year
Item that will not be reclassified to profit or loss:
Effect of remeasurement of net assets/obligations of defined benefit scheme, net of deferred tax – – 5.0
– – 5.0 Items that may be reclassified
subsequently to profit or loss:Fair value losses on hedging,
net of deferred tax (1.4) (7.0) (4.5)Realisation of hedging reserve 1.9 (1.9) (4.7)Exchange translation differences (20.3) 18.9 32.7
(19.8) 10.0 23.5 Other comprehensive income
for the period/year (19.8) 10.0 28.5 Total comprehensive income
for the period/year 70.3 113.6 234.8
Consolidated Statement of Financial PositionAs at 30 September 2018
30 September 31 March2018 2017 2018
(Unaudited) (Unaudited) (Audited)Note US$ million US$ million US$ million
Non-current assetsTangible assets 88.2 79.6 76.2Leasehold land payments 4.4 4.6 4.8Intangible assets 19.1 19.9 19.6Investments 5.4 3.1 5.4Goodwill 35.6 31.1 31.1Net assets on defined benefit
scheme 2.6 – 2.7Deferred tax assets 8.1 11.7 6.3
163.4 150.0 146.1 Current assetsStocks 8 492.6 456.9 349.9Debtors, deposits and prepayments 9 521.7 539.1 348.0Taxation recoverable 1.6 2.8 1.6Deposits and cash 74.3 91.3 254.4
1,090.2 1,090.1 953.9Non-current asset held for sale – – 2.7
1,090.2 1,090.1 956.6 Current liabilitiesCreditors and accruals 10 (651.6) (611.1) (416.7)Provisions for defective goods
returns and other liabilities (27.2) (35.6) (28.4)Taxation payable (12.4) (20.4) (8.0)Secured bank loans – (1.1) –
(691.2) (668.2) (453.1) Net current assets 399.0 421.9 503.5 Total assets less current liabilities 562.4 571.9 649.6 Non-current liabilitiesSecured bank loans – (0.5) –Net obligations on defined
benefit scheme – (2.7) –Deferred tax liabilities (3.0) (2.9) (3.0)
(3.0) (6.1) (3.0) Net assets 559.4 565.8 646.6 Capital and reservesShare capital 11(a) 12.6 12.6 12.6Reserves 546.8 553.2 634.0 Total equity 559.4 565.8 646.6
Condensed Consolidated Statement of Cash FlowsFor the six months ended 30 September 2018
Six months ended 30 September
Year ended 31 March
2018 2017 2018(Unaudited) (Unaudited) (Audited)
Note US$ million US$ million US$ million
Operating activitiesCash generated from/(used in)
operations 33.9 (31.8) 201.6Interest received/(paid) 0.1 – (0.3)Tax paid (7.7) (6.7) (25.6) Net cash generated from/(used
in) operating activities 26.3 (38.5) 175.7 Investing activitiesPurchase of tangible assets (22.3) (23.6) (37.6)Proceeds from disposal of
tangible assets 8.5 0.1 0.2Proceeds from disposal of
an investment – – 4.3Payment for acquisition of
an investment – – (2.4)Payment for acquisition of
a subsidiary (net of cash and cash equivalents acquired) 13 (18.2) – –
Net cash used in investing activities (32.0) (23.5) (35.5) Financing activitiesDividends paid (158.5) (133.2) (176.0)Repayment of bank loans arising
from acquisition of Snom – (0.1) (1.7)Other cash flows arising from
financing activities (1.5) (1.8) (4.0) Net cash used in financing activities (160.0) (135.1) (181.7) Effect of exchange rate changes (14.4) 19.6 27.1 Decrease in cash and
cash equivalents (180.1) (177.5) (14.4)Cash and cash equivalents at
the beginning of period/year 254.4 268.8 268.8 Cash and cash equivalents
at the end of period/year 74.3 91.3 254.4
The notes on pages 9 to 17 form part of this Interim Financial Report. Details of dividends payable to shareholders of the Company attributable to the profit for the period are set out in note 6.
Interim Financial Report
VTech Holdings Limited 2018/2019 Interim Report8
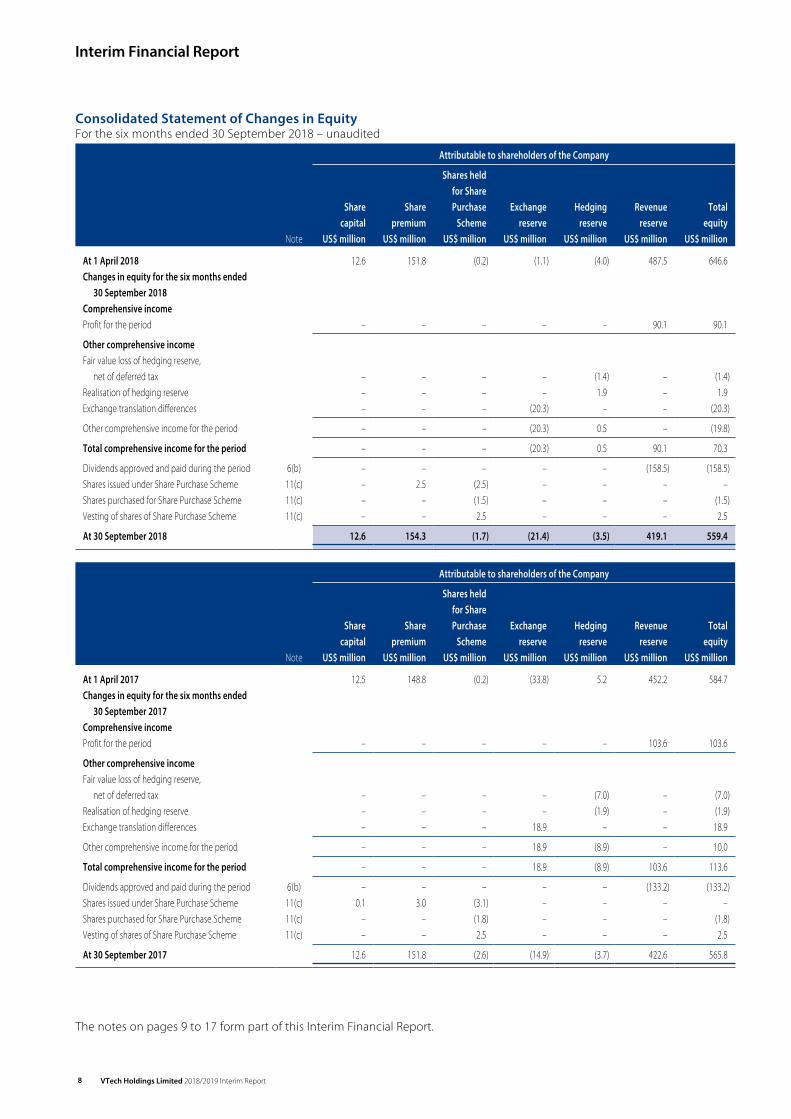
Consolidated Statement of Changes in EquityFor the six months ended 30 September 2018 – unaudited
Attributable to shareholders of the Company
Share capital
Share premium
Shares held for Share
Purchase Scheme
Exchange reserve
Hedging reserve
Revenue reserve
Total equity
Note US$ million US$ million US$ million US$ million US$ million US$ million US$ million
At 1 April 2018 12.6 151.8 (0.2) (1.1) (4.0) 487.5 646.6Changes in equity for the six months ended
30 September 2018Comprehensive incomeProfit for the period – – – – – 90.1 90.1 Other comprehensive income Fair value loss of hedging reserve,
net of deferred tax – – – – (1.4) – (1.4)Realisation of hedging reserve – – – – 1.9 – 1.9Exchange translation differences – – – (20.3) – – (20.3) Other comprehensive income for the period – – – (20.3) 0.5 – (19.8) Total comprehensive income for the period – – – (20.3) 0.5 90.1 70.3 Dividends approved and paid during the period 6(b) – – – – – (158.5) (158.5)Shares issued under Share Purchase Scheme 11(c) – 2.5 (2.5) – – – –Shares purchased for Share Purchase Scheme 11(c) – – (1.5) – – – (1.5)Vesting of shares of Share Purchase Scheme 11(c) – – 2.5 – – – 2.5 At 30 September 2018 12.6 154.3 (1.7) (21.4) (3.5) 419.1 559.4
Attributable to shareholders of the Company
Share capital
Share premium
Shares held for Share
Purchase Scheme
Exchange reserve
Hedging reserve
Revenue reserve
Total equity
Note US$ million US$ million US$ million US$ million US$ million US$ million US$ million
At 1 April 2017 12.5 148.8 (0.2) (33.8) 5.2 452.2 584.7Changes in equity for the six months ended
30 September 2017Comprehensive incomeProfit for the period – – – – – 103.6 103.6 Other comprehensive income Fair value loss of hedging reserve,
net of deferred tax – – – – (7.0) – (7.0)Realisation of hedging reserve – – – – (1.9) – (1.9)Exchange translation differences – – – 18.9 – – 18.9 Other comprehensive income for the period – – – 18.9 (8.9) – 10.0 Total comprehensive income for the period – – – 18.9 (8.9) 103.6 113.6 Dividends approved and paid during the period 6(b) – – – – – (133.2) (133.2)Shares issued under Share Purchase Scheme 11(c) 0.1 3.0 (3.1) – – – –Shares purchased for Share Purchase Scheme 11(c) – – (1.8) – – – (1.8)Vesting of shares of Share Purchase Scheme 11(c) – – 2.5 – – – 2.5 At 30 September 2017 12.6 151.8 (2.6) (14.9) (3.7) 422.6 565.8
The notes on pages 9 to 17 form part of this Interim Financial Report.
VTech Holdings Limited 2018/2019 Interim Report 9
Notes to the Unaudited Interim Financial Report
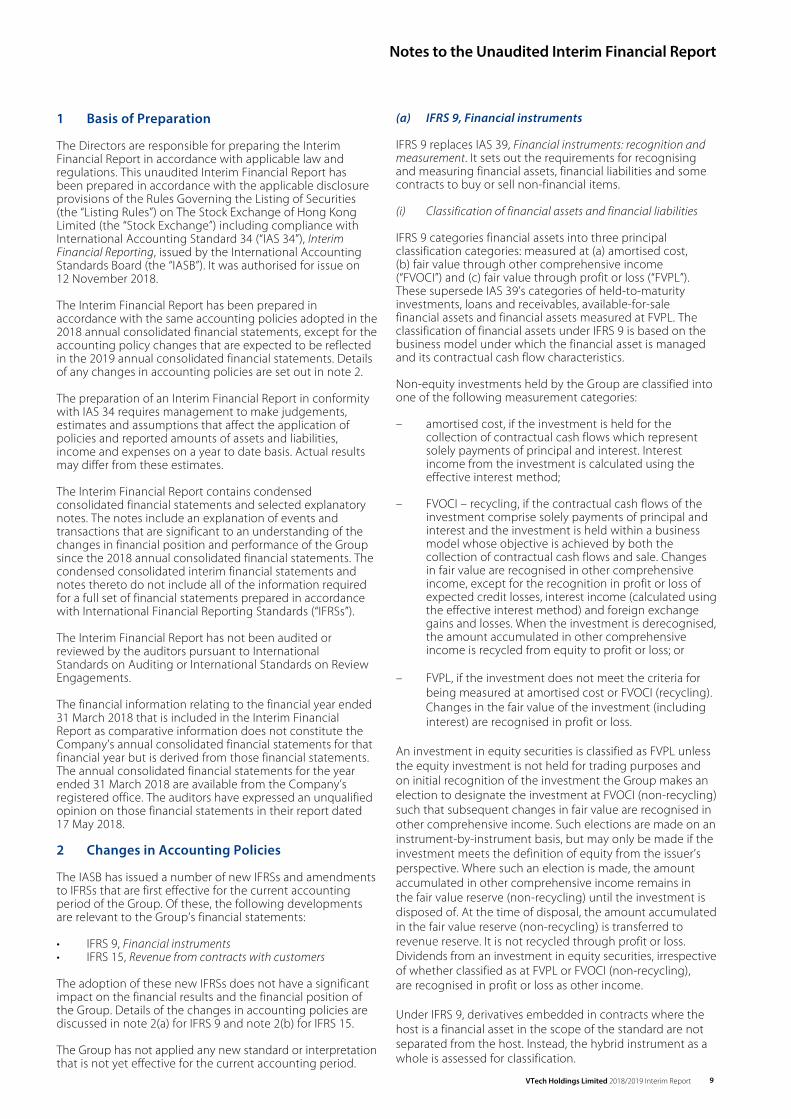
1 Basis of Preparation
The Directors are responsible for preparing the Interim Financial Report in accordance with applicable law and regulations. This unaudited Interim Financial Report has been prepared in accordance with the applicable disclosure provisions of the Rules Governing the Listing of Securities (the “Listing Rules”) on The Stock Exchange of Hong Kong Limited (the “Stock Exchange”) including compliance with International Accounting Standard 34 (“IAS 34”), Interim Financial Reporting, issued by the International Accounting Standards Board (the “IASB”). It was authorised for issue on 12 November 2018.
The Interim Financial Report has been prepared in accordance with the same accounting policies adopted in the 2018 annual consolidated financial statements, except for the accounting policy changes that are expected to be reflected in the 2019 annual consolidated financial statements. Details of any changes in accounting policies are set out in note 2.
The preparation of an Interim Financial Report in conformity with IAS 34 requires management to make judgements, estimates and assumptions that affect the application of policies and reported amounts of assets and liabilities, income and expenses on a year to date basis. Actual results may differ from these estimates.
The Interim Financial Report contains condensed consolidated financial statements and selected explanatory notes. The notes include an explanation of events and transactions that are significant to an understanding of the changes in financial position and performance of the Group since the 2018 annual consolidated financial statements. The condensed consolidated interim financial statements and notes thereto do not include all of the information required for a full set of financial statements prepared in accordance with International Financial Reporting Standards (“IFRSs”).
The Interim Financial Report has not been audited or reviewed by the auditors pursuant to International Standards on Auditing or International Standards on Review Engagements.
The financial information relating to the financial year ended 31 March 2018 that is included in the Interim Financial Report as comparative information does not constitute the Company’s annual consolidated financial statements for that financial year but is derived from those financial statements. The annual consolidated financial statements for the year ended 31 March 2018 are available from the Company’s registered office. The auditors have expressed an unqualified opinion on those financial statements in their report dated 17 May 2018.
2 Changes in Accounting Policies
The IASB has issued a number of new IFRSs and amendments to IFRSs that are first effective for the current accounting period of the Group. Of these, the following developments are relevant to the Group’s financial statements:
• IFRS 9, Financial instruments• IFRS 15, Revenue from contracts with customers
The adoption of these new IFRSs does not have a significant impact on the financial results and the financial position of the Group. Details of the changes in accounting policies are discussed in note 2(a) for IFRS 9 and note 2(b) for IFRS 15.
The Group has not applied any new standard or interpretation that is not yet effective for the current accounting period.
(a) IFRS 9, Financial instruments
IFRS 9 replaces IAS 39, Financial instruments: recognition and measurement. It sets out the requirements for recognising and measuring financial assets, financial liabilities and some contracts to buy or sell non-financial items.
(i) Classification of financial assets and financial liabilities
IFRS 9 categories financial assets into three principal classification categories: measured at (a) amortised cost, (b) fair value through other comprehensive income (“FVOCI”) and (c) fair value through profit or loss (“FVPL”). These supersede IAS 39’s categories of held-to-maturity investments, loans and receivables, available-for-sale financial assets and financial assets measured at FVPL. The classification of financial assets under IFRS 9 is based on the business model under which the financial asset is managed and its contractual cash flow characteristics.
Non-equity investments held by the Group are classified into one of the following measurement categories:
– amortised cost, if the investment is held for the collection of contractual cash flows which represent solely payments of principal and interest. Interest income from the investment is calculated using the effective interest method;
– FVOCI – recycling, if the contractual cash flows of the investment comprise solely payments of principal and interest and the investment is held within a business model whose objective is achieved by both the collection of contractual cash flows and sale. Changes in fair value are recognised in other comprehensive income, except for the recognition in profit or loss of expected credit losses, interest income (calculated using the effective interest method) and foreign exchange gains and losses. When the investment is derecognised, the amount accumulated in other comprehensive income is recycled from equity to profit or loss; or
– FVPL, if the investment does not meet the criteria for being measured at amortised cost or FVOCI (recycling). Changes in the fair value of the investment (including interest) are recognised in profit or loss.
An investment in equity securities is classified as FVPL unless the equity investment is not held for trading purposes and on initial recognition of the investment the Group makes an election to designate the investment at FVOCI (non-recycling) such that subsequent changes in fair value are recognised in other comprehensive income. Such elections are made on an instrument-by-instrument basis, but may only be made if the investment meets the definition of equity from the issuer’s perspective. Where such an election is made, the amount accumulated in other comprehensive income remains in the fair value reserve (non-recycling) until the investment is disposed of. At the time of disposal, the amount accumulated in the fair value reserve (non-recycling) is transferred to revenue reserve. It is not recycled through profit or loss. Dividends from an investment in equity securities, irrespective of whether classified as at FVPL or FVOCI (non-recycling), are recognised in profit or loss as other income.
Under IFRS 9, derivatives embedded in contracts where the host is a financial asset in the scope of the standard are not separated from the host. Instead, the hybrid instrument as a whole is assessed for classification.
Notes to the Unaudited Interim Financial Report
VTech Holdings Limited 2018/2019 Interim Report10
2 Changes in Accounting Policies (continued)
(a) IFRS 9, Financial instruments (continued)
The measurement categories for all financial liabilities remain the same.
The adoption of IFRS 9 does not affect the measurement basis, and hence the carrying amounts, of the Group’s financial assets and financial liabilities as at 1 April 2018.
(ii) Credit losses
IFRS 9 replaces the “incurred loss” model in IAS 39 with the Expected Credit Losses (ECLs) model. The ECL model requires an ongoing measurement of credit risk associated with a financial asset and therefore recognises ECLs earlier than under the “incurred loss” accounting model in IAS 39.
The Group applies the new ECL model to the financial assets measured at amortised cost (including deposits and cash, debtors and deposits).
Financial assets measured at fair value, including equity securities measured at FVPL and derivative financial assets, are not subject to the ECL assessment.
Measurement of ECLs
ECLs are a probability-weighted estimate of credit losses. Credit losses are measured as the present value of all expected cash shortfalls (i.e. the difference between the cash flows due to the Group in accordance with the contract and the cash flows that the Group expects to receive).
The expected cash shortfalls are discounted using the effective interest rate determined at initial recognition or an approximation thereof where the effect of discounting is material.
The maximum period considered when estimating ECLs is the maximum contractual period over which the Group is exposed to credit risk.
In measuring ECLs, the Group takes into account reasonable and supportable information that is available without undue cost or effort. This includes information about past events, current conditions and forecasts of future economic conditions.
ECLs are measured on either of the following bases:
– 12-month ECLs: these are losses that are expected to result from possible default events within the 12 months after the reporting date; and
– lifetime ECLs: these are losses that are expected to result from all possible default events over the expected lives of the items to which the ECL model applies.
Loss allowances for trade debtors are always measured at an amount equal to lifetime ECLs. ECLs on trade debtors are estimated using a provision matrix based on the Group’s historical credit loss experience, adjusted for factors that are specific to the debtors and an assessment of both the current and forecast general economic conditions at the reporting date.
For all other financial instruments, the Group recognises a loss allowance equal to 12-month ECLs unless there has been a significant increase in credit risk of the financial instrument since initial recognition, in which case the loss allowance is measured at an amount equal to lifetime ECLs.
Significant increases in credit risk
In assessing whether the credit risk of a financial instrument has increased significantly since initial recognition, the Group compares the risk of default occurring on the financial instrument assessed at the reporting date with that assessed at the date of initial recognition. In making this reassessment, the Group considers that a default event occurs when (i) the borrower is unlikely to pay its credit obligations to the Group in full, without recourse by the Group to actions such as realising security (if any is held); or (ii) the financial asset is 90 days past due. The Group considers both quantitative and qualitative information that is reasonable and supportable, including historical experience and forward-looking information that is available without undue cost or effort.
In particular, the following information is taken into account when assessing whether credit risk has increased significantly since initial recognition:
– failure to make payments of principal or interest on their contractually due dates;
– an actual or expected significant deterioration in a financial instrument’s external or internal credit rating (if available);
– an actual or expected significant deterioration in the operating results of the debtor; and
– existing or forecast changes in the technological, market, economic or legal environment that have a significant adverse effect on the debtor’s ability to meet its obligation to the Group.
Depending on the nature of the financial instruments, the assessment of a significant increase in credit risk is performed on either an individual basis or a collective basis. When the assessment is performed on a collective basis, the financial instruments are grouped based on shared credit risk characteristics, such as past due status and credit risk ratings.
ECLs are remeasured at each reporting date to reflect changes in the financial instrument’s credit risk since initial recognition. Any change in the ECL amount is recognised as an impairment gain or loss in profit or loss. The Group recognises an impairment gain or loss for all financial instruments with a corresponding adjustment to their carrying amount through a loss allowance account. The adoption of the ECLs model under IFRS 9 has no material impact to the Group.
Write-off policy
The gross carrying amount of a financial asset is written off (either partially or in full) to the extent that there is no realistic prospect of recovery. This is generally the case when the Group determines that the debtor does not have assets or sources of income that could generate sufficient cash flows to repay the amounts subject to the write-off.
Subsequent recoveries of an asset that was previously written off are recognised as a reversal of impairment in profit or loss in the period in which the recovery occurs.
VTech Holdings Limited 2018/2019 Interim Report 11
Notes to the Unaudited Interim Financial Report
2 Changes in Accounting Policies (continued)
(a) IFRS 9, Financial instruments (continued)
(iii) Hedge accounting
The Group has elected to adopt the new general hedge accounting model in IFRS 9. Depending on the complexity of the hedge, this new accounting model allows a more qualitative approach to assessing hedge effectiveness compared to IAS 39 to be applied, and the assessment is always forward-looking. The adoption of IFRS 9 has not had a significant impact on the Group’s financial statements in this regard.
(b) IFRS 15, Revenue from contracts with customers
IFRS 15 establishes a comprehensive framework for recognising revenue and some costs from contracts with customers. IFRS 15 replaces IAS 18, Revenue, which covered revenue arising from sale of goods and rendering of services, and IAS 11, Construction contracts, which specified the accounting for construction contracts.
Previously, revenue from provision of services was recognised over time, whereas revenue from sale of goods was generally recognised at a point in time when the risks and rewards of ownership of the goods had passed to the customers.
Under IFRS 15, revenue is recognised when the customer obtains control of the promised good or service in the contract. This may be at a single point in time or over time. IFRS 15 identifies the following three situations in which control of the promised good or service is regarded as being transferred over time:
A. When the customer simultaneously receives and consumes the benefits provided by the entity’s performance, as the entity performs;
B. When the entity’s performance creates or enhances an asset (for example work in progress) that the customer controls as the asset is created or enhanced;
C. When the entity’s performance does not create an asset with an alternative use to the entity and the entity has an enforceable right to payment for performance completed to date.
If the contract terms and the entity’s activities do not fall into any of these 3 situations, then under IFRS 15 the entity recognises revenue for the sale of that good or service at a single point in time, being when control has passed. Transfer of risks and rewards of ownership is only one of the indicators that is considered in determining when the transfer of control occurs.
The adoption of IFRS 15 does not have a significant impact on when the Group recognises revenue.
3 Segment Information
The Group manages its businesses by divisions, which are organised by geography. In accordance with IFRS 8, Operating segments and in a manner consistent with the way in which information is reported internally to the Group’s most senior executive management for the purposes of resource allocation and performance assessment, the Group has presented the following reportable segments.
• North America (including the United States and Canada)• Europe• Asia Pacific• Other Regions, which covers sales of electronic products
to the rest of the world
The Company is domiciled in Bermuda. The results of its revenue from external customers located in North America, Europe, Asia Pacific and elsewhere are set out in the table below.
Each of the above reportable segments primarily derives its revenue from the sale of telecommunication products, electronic learning products and products from contract manufacturing services to customers in the relevant geographical region.
All of these products are manufactured in the Group’s manufacturing facilities located primarily in the People’s Republic of China under the Asia Pacific segment.
For the purposes of assessing segment performance and allocating resources between segments, the Group’s senior executive management monitors the results and assets attributable to each reportable segment on the following bases:
(a) Segment revenues and results
Revenue is allocated to the reportable segments based on the location of external customers. Expenses are allocated to the reportable segments with reference to sales generated by those segments and the expenses incurred by those geographical locations or which otherwise arise from the depreciation or amortisation of assets attributable to those segments.
All revenue from contracts with customers are sales of electronic products and are recognised at a point in time.
The measure used for reporting segment profit is operating profit.
In addition to receiving segment information concerning operating profit, management is provided with segment information concerning revenue and depreciation and amortisation.
(b) Segment assets and liabilities
Segment assets include all non-current and current assets with the exception of deferred tax assets, taxation recoverable and other corporate assets including intangible assets, goodwill and investments.
Segment liabilities include creditors and accruals, provisions for defective goods returns and other liabilities, secured bank loans and net obligations on defined benefit scheme with the exception of taxation payable and deferred tax liabilities.
Notes to the Unaudited Interim Financial Report
VTech Holdings Limited 2018/2019 Interim Report12
3 Segment Information (continued)
(b) Segment assets and liabilities (continued)
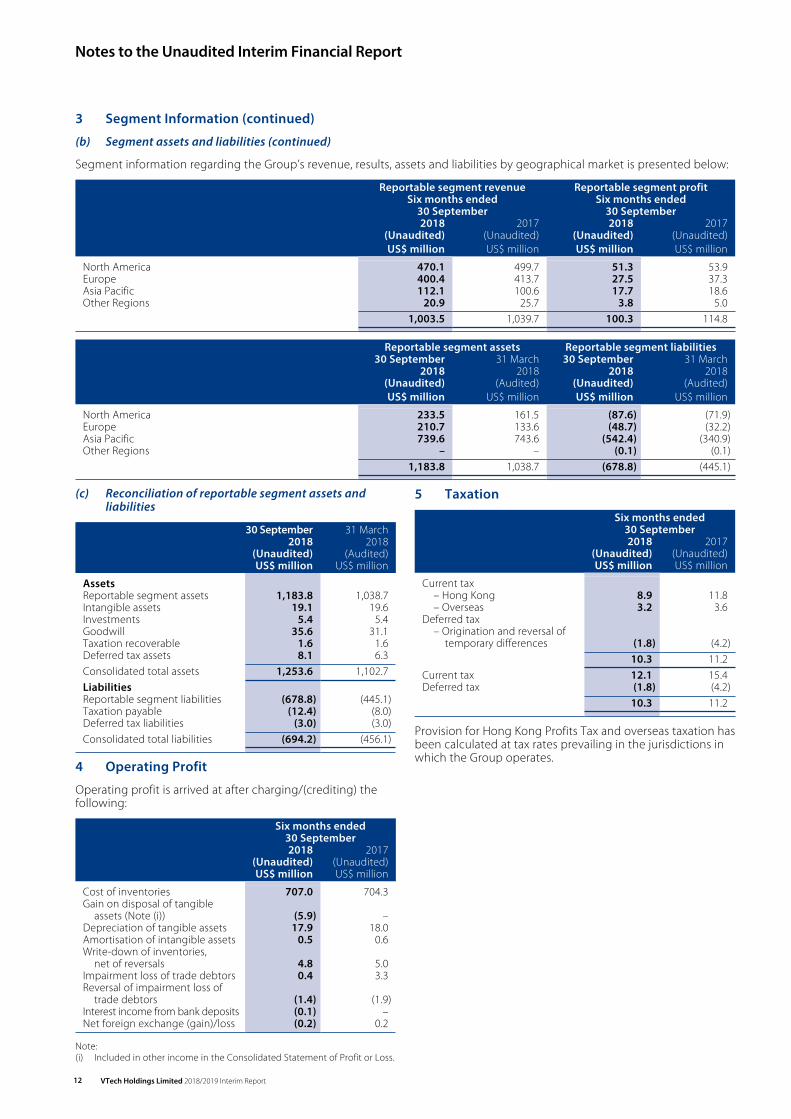
Segment information regarding the Group’s revenue, results, assets and liabilities by geographical market is presented below:
Reportable segment revenue Six months ended
30 September
Reportable segment profit Six months ended
30 September2018 2017 2018 2017
(Unaudited) (Unaudited) (Unaudited) (Unaudited)US$ million US$ million US$ million US$ million
North America 470.1 499.7 51.3 53.9Europe 400.4 413.7 27.5 37.3Asia Pacific 112.1 100.6 17.7 18.6Other Regions 20.9 25.7 3.8 5.0
1,003.5 1,039.7 100.3 114.8
Reportable segment assets Reportable segment liabilities30 September 31 March 30 September 31 March
2018 2018 2018 2018(Unaudited) (Audited) (Unaudited) (Audited)US$ million US$ million US$ million US$ million
North America 233.5 161.5 (87.6) (71.9)Europe 210.7 133.6 (48.7) (32.2)Asia Pacific 739.6 743.6 (542.4) (340.9)Other Regions – – (0.1) (0.1)
1,183.8 1,038.7 (678.8) (445.1)
(c) Reconciliation of reportable segment assets and liabilities
30 September 31 March2018 2018
(Unaudited) (Audited)US$ million US$ million
AssetsReportable segment assets 1,183.8 1,038.7Intangible assets 19.1 19.6Investments 5.4 5.4Goodwill 35.6 31.1Taxation recoverable 1.6 1.6Deferred tax assets 8.1 6.3 Consolidated total assets 1,253.6 1,102.7 LiabilitiesReportable segment liabilities (678.8) (445.1)Taxation payable (12.4) (8.0)Deferred tax liabilities (3.0) (3.0) Consolidated total liabilities (694.2) (456.1)
4 Operating Profit
Operating profit is arrived at after charging/(crediting) the following:
Six months ended30 September2018 2017
(Unaudited) (Unaudited)US$ million US$ million
Cost of inventories 707.0 704.3Gain on disposal of tangible
assets (Note (i)) (5.9) –Depreciation of tangible assets 17.9 18.0Amortisation of intangible assets 0.5 0.6Write-down of inventories,
net of reversals 4.8 5.0Impairment loss of trade debtors 0.4 3.3Reversal of impairment loss of
trade debtors (1.4) (1.9)Interest income from bank deposits (0.1) –Net foreign exchange (gain)/loss (0.2) 0.2
Note:(i) Included in other income in the Consolidated Statement of Profit or Loss.
5 Taxation
Six months ended 30 September2018 2017
(Unaudited) (Unaudited)US$ million US$ million
Current tax– Hong Kong 8.9 11.8– Overseas 3.2 3.6
Deferred tax– Origination and reversal of
temporary differences (1.8) (4.2) 10.3 11.2
Current tax 12.1 15.4Deferred tax (1.8) (4.2)
10.3 11.2
Provision for Hong Kong Profits Tax and overseas taxation has been calculated at tax rates prevailing in the jurisdictions in which the Group operates.
VTech Holdings Limited 2018/2019 Interim Report 13
Notes to the Unaudited Interim Financial Report
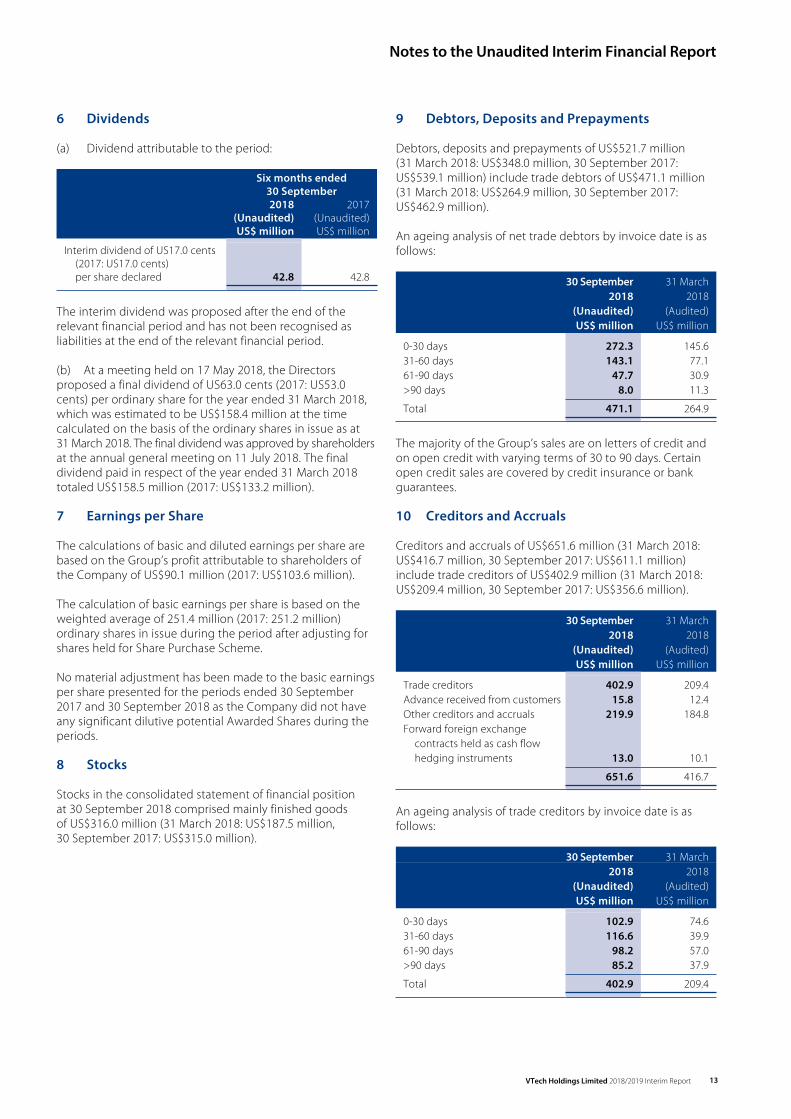
6 Dividends
(a) Dividend attributable to the period:
Six months ended 30 September2018 2017
(Unaudited) (Unaudited)US$ million US$ million
Interim dividend of US17.0 cents (2017: US17.0 cents) per share declared 42.8 42.8
The interim dividend was proposed after the end of the relevant financial period and has not been recognised as liabilities at the end of the relevant financial period.
(b) At a meeting held on 17 May 2018, the Directors proposed a final dividend of US63.0 cents (2017: US53.0 cents) per ordinary share for the year ended 31 March 2018, which was estimated to be US$158.4 million at the time calculated on the basis of the ordinary shares in issue as at 31 March 2018. The final dividend was approved by shareholders at the annual general meeting on 11 July 2018. The final dividend paid in respect of the year ended 31 March 2018 totaled US$158.5 million (2017: US$133.2 million).
7 Earnings per Share
The calculations of basic and diluted earnings per share are based on the Group’s profit attributable to shareholders of the Company of US$90.1 million (2017: US$103.6 million).
The calculation of basic earnings per share is based on the weighted average of 251.4 million (2017: 251.2 million) ordinary shares in issue during the period after adjusting for shares held for Share Purchase Scheme.
No material adjustment has been made to the basic earnings per share presented for the periods ended 30 September 2017 and 30 September 2018 as the Company did not have any significant dilutive potential Awarded Shares during the periods.
8 Stocks
Stocks in the consolidated statement of financial position at 30 September 2018 comprised mainly finished goods of US$316.0 million (31 March 2018: US$187.5 million, 30 September 2017: US$315.0 million).
9 Debtors, Deposits and Prepayments
Debtors, deposits and prepayments of US$521.7 million (31 March 2018: US$348.0 million, 30 September 2017: US$539.1 million) include trade debtors of US$471.1 million (31 March 2018: US$264.9 million, 30 September 2017: US$462.9 million).
An ageing analysis of net trade debtors by invoice date is as follows:
30 September 31 March2018 2018
(Unaudited) (Audited)US$ million US$ million
0-30 days 272.3 145.631-60 days 143.1 77.161-90 days 47.7 30.9>90 days 8.0 11.3 Total 471.1 264.9
The majority of the Group’s sales are on letters of credit and on open credit with varying terms of 30 to 90 days. Certain open credit sales are covered by credit insurance or bank guarantees.
10 Creditors and Accruals
Creditors and accruals of US$651.6 million (31 March 2018: US$416.7 million, 30 September 2017: US$611.1 million) include trade creditors of US$402.9 million (31 March 2018: US$209.4 million, 30 September 2017: US$356.6 million).
30 September 31 March2018 2018
(Unaudited) (Audited)US$ million US$ million
Trade creditors 402.9 209.4Advance received from customers 15.8 12.4Other creditors and accruals 219.9 184.8Forward foreign exchange
contracts held as cash flow hedging instruments 13.0 10.1
651.6 416.7
An ageing analysis of trade creditors by invoice date is as follows:
30 September 31 March2018 2018
(Unaudited) (Audited)US$ million US$ million
0-30 days 102.9 74.631-60 days 116.6 39.961-90 days 98.2 57.0>90 days 85.2 37.9 Total 402.9 209.4
Notes to the Unaudited Interim Financial Report
VTech Holdings Limited 2018/2019 Interim Report14
11 Share Capital, Share Options and Share Purchase Scheme
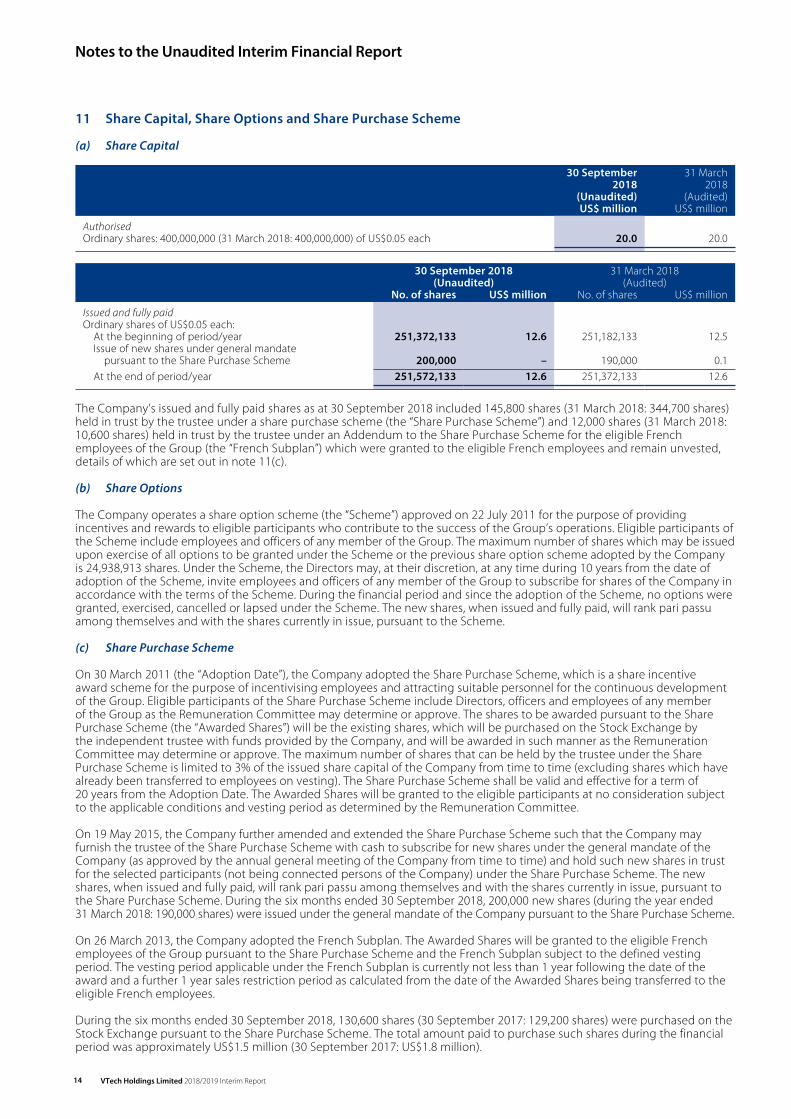
(a) Share Capital
30 September 31 March2018 2018
(Unaudited) (Audited)US$ million US$ million
AuthorisedOrdinary shares: 400,000,000 (31 March 2018: 400,000,000) of US$0.05 each 20.0 20.0
30 September 2018(Unaudited)
31 March 2018(Audited)
No. of shares US$ million No. of shares US$ million
Issued and fully paidOrdinary shares of US$0.05 each:
At the beginning of period/year 251,372,133 12.6 251,182,133 12.5Issue of new shares under general mandate
pursuant to the Share Purchase Scheme 200,000 – 190,000 0.1 At the end of period/year 251,572,133 12.6 251,372,133 12.6
The Company’s issued and fully paid shares as at 30 September 2018 included 145,800 shares (31 March 2018: 344,700 shares) held in trust by the trustee under a share purchase scheme (the “Share Purchase Scheme”) and 12,000 shares (31 March 2018: 10,600 shares) held in trust by the trustee under an Addendum to the Share Purchase Scheme for the eligible French employees of the Group (the “French Subplan”) which were granted to the eligible French employees and remain unvested, details of which are set out in note 11(c).
(b) Share Options
The Company operates a share option scheme (the “Scheme”) approved on 22 July 2011 for the purpose of providing incentives and rewards to eligible participants who contribute to the success of the Group’s operations. Eligible participants of the Scheme include employees and officers of any member of the Group. The maximum number of shares which may be issued upon exercise of all options to be granted under the Scheme or the previous share option scheme adopted by the Company is 24,938,913 shares. Under the Scheme, the Directors may, at their discretion, at any time during 10 years from the date of adoption of the Scheme, invite employees and officers of any member of the Group to subscribe for shares of the Company in accordance with the terms of the Scheme. During the financial period and since the adoption of the Scheme, no options were granted, exercised, cancelled or lapsed under the Scheme. The new shares, when issued and fully paid, will rank pari passu among themselves and with the shares currently in issue, pursuant to the Scheme.
(c) Share Purchase Scheme
On 30 March 2011 (the “Adoption Date”), the Company adopted the Share Purchase Scheme, which is a share incentive award scheme for the purpose of incentivising employees and attracting suitable personnel for the continuous development of the Group. Eligible participants of the Share Purchase Scheme include Directors, officers and employees of any member of the Group as the Remuneration Committee may determine or approve. The shares to be awarded pursuant to the Share Purchase Scheme (the “Awarded Shares”) will be the existing shares, which will be purchased on the Stock Exchange by the independent trustee with funds provided by the Company, and will be awarded in such manner as the Remuneration Committee may determine or approve. The maximum number of shares that can be held by the trustee under the Share Purchase Scheme is limited to 3% of the issued share capital of the Company from time to time (excluding shares which have already been transferred to employees on vesting). The Share Purchase Scheme shall be valid and effective for a term of 20 years from the Adoption Date. The Awarded Shares will be granted to the eligible participants at no consideration subject to the applicable conditions and vesting period as determined by the Remuneration Committee.
On 19 May 2015, the Company further amended and extended the Share Purchase Scheme such that the Company may furnish the trustee of the Share Purchase Scheme with cash to subscribe for new shares under the general mandate of the Company (as approved by the annual general meeting of the Company from time to time) and hold such new shares in trust for the selected participants (not being connected persons of the Company) under the Share Purchase Scheme. The new shares, when issued and fully paid, will rank pari passu among themselves and with the shares currently in issue, pursuant to the Share Purchase Scheme. During the six months ended 30 September 2018, 200,000 new shares (during the year ended 31 March 2018: 190,000 shares) were issued under the general mandate of the Company pursuant to the Share Purchase Scheme.
On 26 March 2013, the Company adopted the French Subplan. The Awarded Shares will be granted to the eligible French employees of the Group pursuant to the Share Purchase Scheme and the French Subplan subject to the defined vesting period. The vesting period applicable under the French Subplan is currently not less than 1 year following the date of the award and a further 1 year sales restriction period as calculated from the date of the Awarded Shares being transferred to the eligible French employees.
During the six months ended 30 September 2018, 130,600 shares (30 September 2017: 129,200 shares) were purchased on the Stock Exchange pursuant to the Share Purchase Scheme. The total amount paid to purchase such shares during the financial period was approximately US$1.5 million (30 September 2017: US$1.8 million).
VTech Holdings Limited 2018/2019 Interim Report 15
Notes to the Unaudited Interim Financial Report
11 Share Capital, Share Options and Share Purchase Scheme (continued)
(c) Share Purchase Scheme (continued)
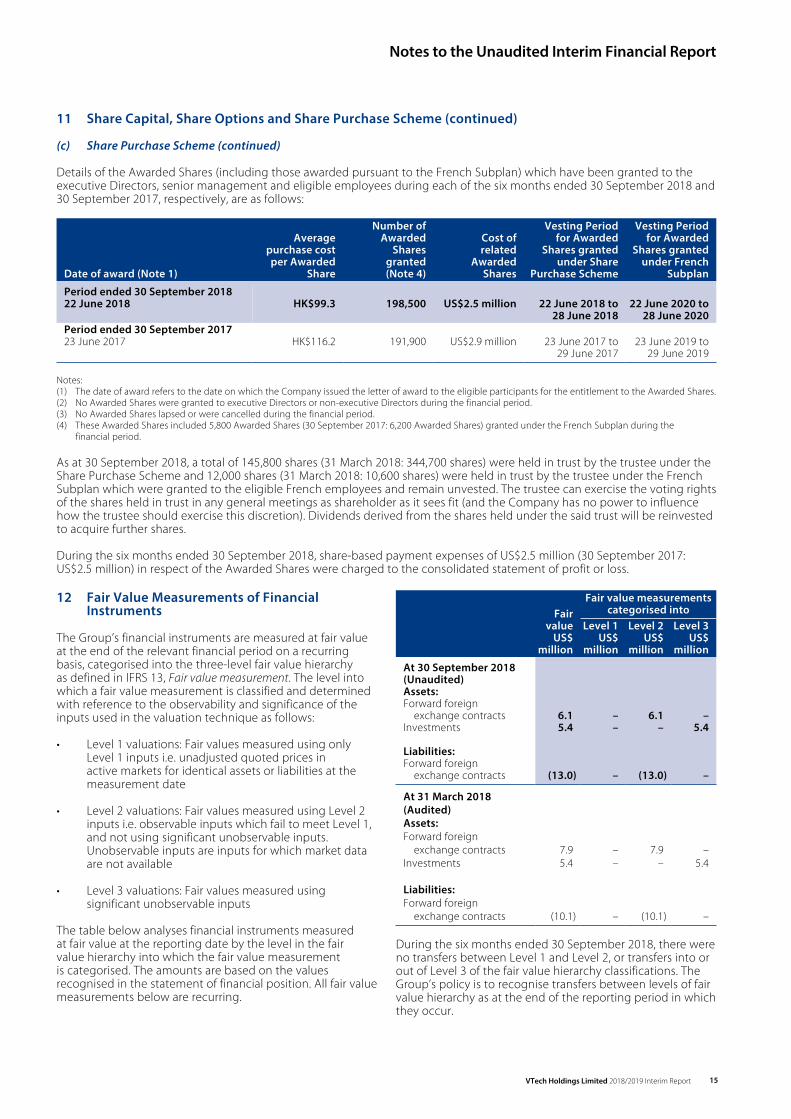
Details of the Awarded Shares (including those awarded pursuant to the French Subplan) which have been granted to the executive Directors, senior management and eligible employees during each of the six months ended 30 September 2018 and 30 September 2017, respectively, are as follows:
Date of award (Note 1)
Average purchase cost per Awarded
Share
Number of Awarded
Shares granted (Note 4)
Cost of related
Awarded Shares
Vesting Period for Awarded
Shares granted under Share
Purchase Scheme
Vesting Period for Awarded
Shares granted under French
Subplan
Period ended 30 September 201822 June 2018 HK$99.3 198,500 US$2.5 million 22 June 2018 to
28 June 201822 June 2020 to
28 June 2020Period ended 30 September 201723 June 2017 HK$116.2 191,900 US$2.9 million 23 June 2017 to
29 June 201723 June 2019 to
29 June 2019
Notes:(1) The date of award refers to the date on which the Company issued the letter of award to the eligible participants for the entitlement to the Awarded Shares.(2) No Awarded Shares were granted to executive Directors or non-executive Directors during the financial period.(3) No Awarded Shares lapsed or were cancelled during the financial period.(4) These Awarded Shares included 5,800 Awarded Shares (30 September 2017: 6,200 Awarded Shares) granted under the French Subplan during the
financial period.
As at 30 September 2018, a total of 145,800 shares (31 March 2018: 344,700 shares) were held in trust by the trustee under the Share Purchase Scheme and 12,000 shares (31 March 2018: 10,600 shares) were held in trust by the trustee under the French Subplan which were granted to the eligible French employees and remain unvested. The trustee can exercise the voting rights of the shares held in trust in any general meetings as shareholder as it sees fit (and the Company has no power to influence how the trustee should exercise this discretion). Dividends derived from the shares held under the said trust will be reinvested to acquire further shares.
During the six months ended 30 September 2018, share-based payment expenses of US$2.5 million (30 September 2017: US$2.5 million) in respect of the Awarded Shares were charged to the consolidated statement of profit or loss.
12 Fair Value Measurements of Financial Instruments
The Group’s financial instruments are measured at fair value at the end of the relevant financial period on a recurring basis, categorised into the three-level fair value hierarchy as defined in IFRS 13, Fair value measurement. The level into which a fair value measurement is classified and determined with reference to the observability and significance of the inputs used in the valuation technique as follows:
• Level 1 valuations: Fair values measured using only Level 1 inputs i.e. unadjusted quoted prices in active markets for identical assets or liabilities at the measurement date
• Level 2 valuations: Fair values measured using Level 2 inputs i.e. observable inputs which fail to meet Level 1, and not using significant unobservable inputs. Unobservable inputs are inputs for which market data are not available
• Level 3 valuations: Fair values measured using significant unobservable inputs
The table below analyses financial instruments measured at fair value at the reporting date by the level in the fair value hierarchy into which the fair value measurement is categorised. The amounts are based on the values recognised in the statement of financial position. All fair value measurements below are recurring.
Fair value
Fair value measurements categorised into
Level 1 Level 2 Level 3US$
millionUS$
millionUS$
millionUS$
million
At 30 September 2018(Unaudited)Assets:Forward foreign
exchange contracts 6.1 – 6.1 –Investments 5.4 – – 5.4
Liabilities:Forward foreign
exchange contracts (13.0) – (13.0) –
At 31 March 2018(Audited)Assets:Forward foreign
exchange contracts 7.9 – 7.9 –Investments 5.4 – – 5.4
Liabilities:Forward foreign
exchange contracts (10.1) – (10.1) –
During the six months ended 30 September 2018, there were no transfers between Level 1 and Level 2, or transfers into or out of Level 3 of the fair value hierarchy classifications. The Group’s policy is to recognise transfers between levels of fair value hierarchy as at the end of the reporting period in which they occur.
Notes to the Unaudited Interim Financial Report
VTech Holdings Limited 2018/2019 Interim Report16
12 Fair Value Measurements of Financial Instruments (continued)
Valuation techniques and inputs used in Level 2 fair value measurements
The fair value of forward foreign exchange contracts in Level 2 is determined by discounting the difference between the forward exchange rates at the end of the reporting period and the contractual forward exchange rates.
Information about Level 3 fair value measurements
Valuationtechniques
Significantunobservable
inputs
Sensitivity to changes in significant
unobservable inputs
Investments Market approach
Comparable transaction
price
The estimated fair value would increase if the
comparable transaction price is higher
The fair value of investments is determined using the comparable transaction price. The Group determines that the comparable transaction price is the fair value at the end of the reporting period. As at 30 September 2018, it is estimated that with other variables held constant, an increase/decrease in 5% (31 March 2018: 5%) of comparable transaction price would have increased/decreased the net assets by US$0.3 million (31 March 2018: US$0.3 million).
The movements during the period in the balance of these Level 3 fair value measurements are as follows:
30 September 31 March2018 2018
(Unaudited) (Audited)US$ million US$ million
Investments:At the beginning of period/year 5.4 3.0Additions – 2.4 At the end of period/year 5.4 5.4
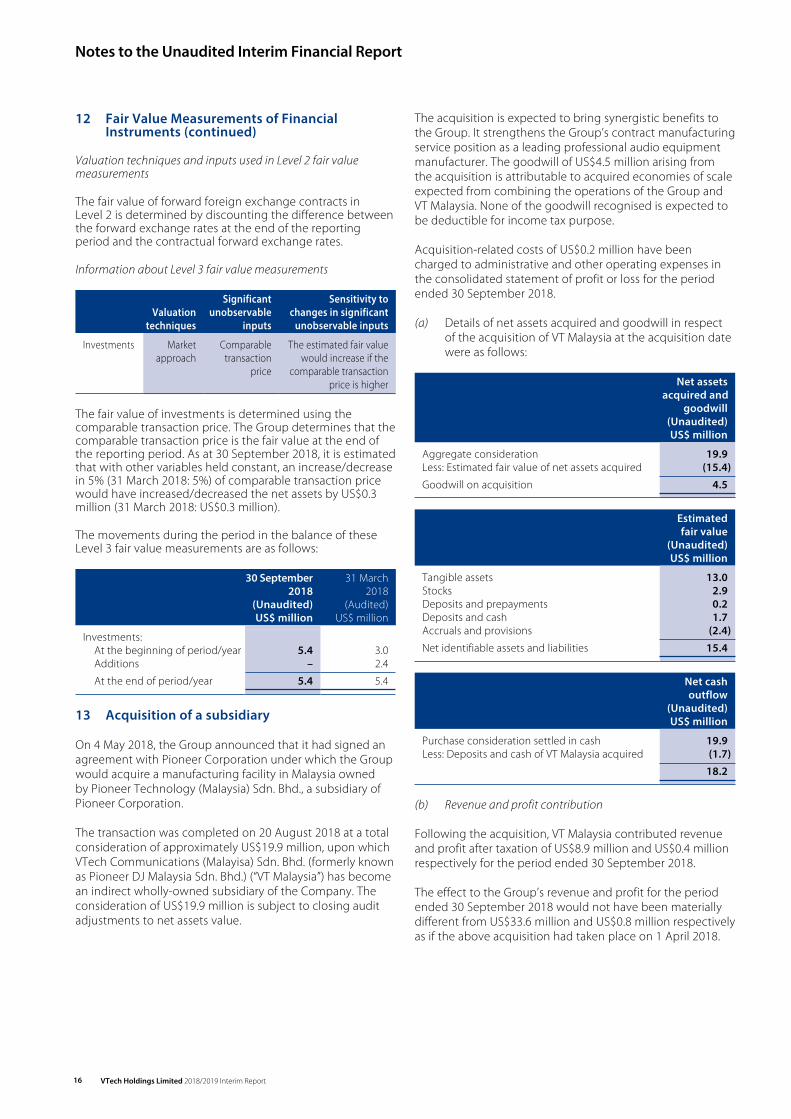
13 Acquisition of a subsidiary
On 4 May 2018, the Group announced that it had signed an agreement with Pioneer Corporation under which the Group would acquire a manufacturing facility in Malaysia owned by Pioneer Technology (Malaysia) Sdn. Bhd., a subsidiary of Pioneer Corporation.
The transaction was completed on 20 August 2018 at a total consideration of approximately US$19.9 million, upon which VTech Communications (Malayisa) Sdn. Bhd. (formerly known as Pioneer DJ Malaysia Sdn. Bhd.) (“VT Malaysia”) has become an indirect wholly-owned subsidiary of the Company. The consideration of US$19.9 million is subject to closing audit adjustments to net assets value.
The acquisition is expected to bring synergistic benefits to the Group. It strengthens the Group’s contract manufacturing service position as a leading professional audio equipment manufacturer. The goodwill of US$4.5 million arising from the acquisition is attributable to acquired economies of scale expected from combining the operations of the Group and VT Malaysia. None of the goodwill recognised is expected to be deductible for income tax purpose.
Acquisition-related costs of US$0.2 million have been charged to administrative and other operating expenses in the consolidated statement of profit or loss for the period ended 30 September 2018.
(a) Details of net assets acquired and goodwill in respect of the acquisition of VT Malaysia at the acquisition date were as follows:
Net assets acquired and
goodwill(Unaudited)US$ million
Aggregate consideration 19.9Less: Estimated fair value of net assets acquired (15.4) Goodwill on acquisition 4.5
Estimated fair value
(Unaudited)US$ million
Tangible assets 13.0Stocks 2.9Deposits and prepayments 0.2Deposits and cash 1.7Accruals and provisions (2.4) Net identifiable assets and liabilities 15.4
Net cash outflow
(Unaudited)US$ million
Purchase consideration settled in cash 19.9Less: Deposits and cash of VT Malaysia acquired (1.7)
18.2
(b) Revenue and profit contribution
Following the acquisition, VT Malaysia contributed revenue and profit after taxation of US$8.9 million and US$0.4 million respectively for the period ended 30 September 2018.
The effect to the Group’s revenue and profit for the period ended 30 September 2018 would not have been materially different from US$33.6 million and US$0.8 million respectively as if the above acquisition had taken place on 1 April 2018.
VTech Holdings Limited 2018/2019 Interim Report 17
Notes to the Unaudited Interim Financial Report
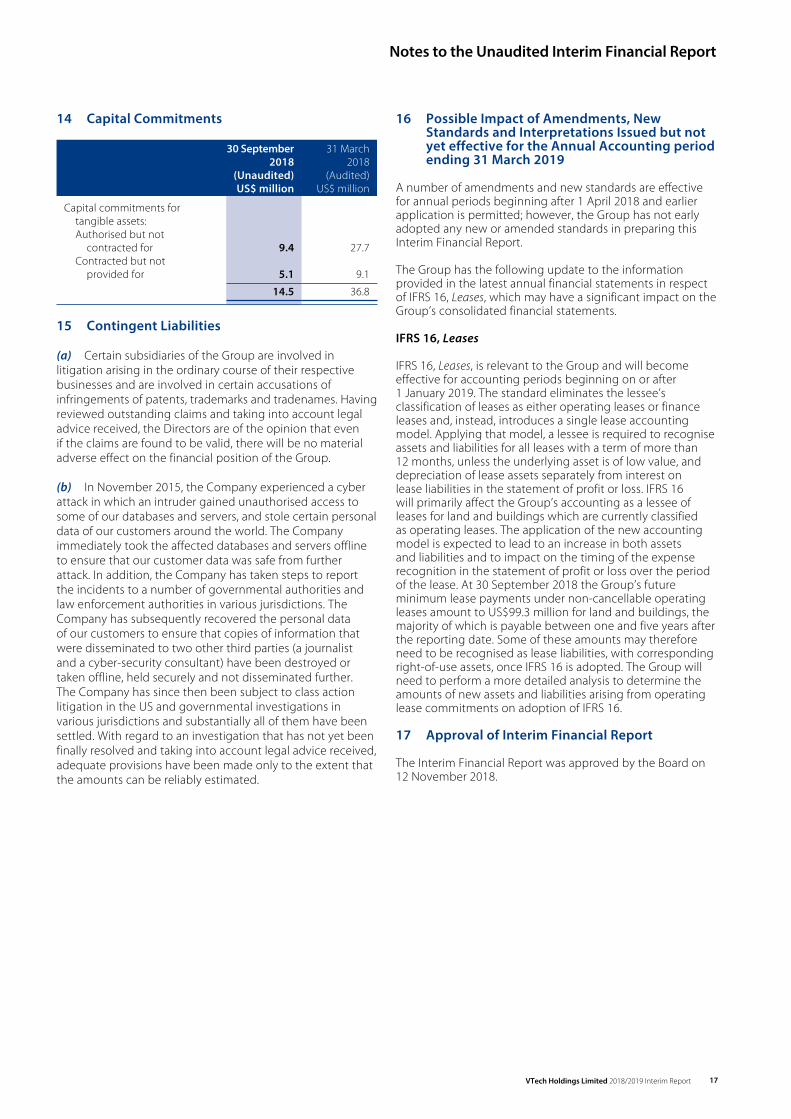
14 Capital Commitments
30 September 31 March2018 2018
(Unaudited) (Audited)US$ million US$ million
Capital commitments for tangible assets:Authorised but not
contracted for 9.4 27.7Contracted but not
provided for 5.1 9.1 14.5 36.8
15 Contingent Liabilities
(a) Certain subsidiaries of the Group are involved in litigation arising in the ordinary course of their respective businesses and are involved in certain accusations of infringements of patents, trademarks and tradenames. Having reviewed outstanding claims and taking into account legal advice received, the Directors are of the opinion that even if the claims are found to be valid, there will be no material adverse effect on the financial position of the Group.
(b) In November 2015, the Company experienced a cyber attack in which an intruder gained unauthorised access to some of our databases and servers, and stole certain personal data of our customers around the world. The Company immediately took the affected databases and servers offline to ensure that our customer data was safe from further attack. In addition, the Company has taken steps to report the incidents to a number of governmental authorities and law enforcement authorities in various jurisdictions. The Company has subsequently recovered the personal data of our customers to ensure that copies of information that were disseminated to two other third parties (a journalist and a cyber-security consultant) have been destroyed or taken offline, held securely and not disseminated further. The Company has since then been subject to class action litigation in the US and governmental investigations in various jurisdictions and substantially all of them have been settled. With regard to an investigation that has not yet been finally resolved and taking into account legal advice received, adequate provisions have been made only to the extent that the amounts can be reliably estimated.
16 Possible Impact of Amendments, New Standards and Interpretations Issued but not yet effective for the Annual Accounting period ending 31 March 2019
A number of amendments and new standards are effective for annual periods beginning after 1 April 2018 and earlier application is permitted; however, the Group has not early adopted any new or amended standards in preparing this Interim Financial Report.
The Group has the following update to the information provided in the latest annual financial statements in respect of IFRS 16, Leases, which may have a significant impact on the Group’s consolidated financial statements.
IFRS 16, Leases
IFRS 16, Leases, is relevant to the Group and will become effective for accounting periods beginning on or after 1 January 2019. The standard eliminates the lessee’s classification of leases as either operating leases or finance leases and, instead, introduces a single lease accounting model. Applying that model, a lessee is required to recognise assets and liabilities for all leases with a term of more than 12 months, unless the underlying asset is of low value, and depreciation of lease assets separately from interest on lease liabilities in the statement of profit or loss. IFRS 16 will primarily affect the Group’s accounting as a lessee of leases for land and buildings which are currently classified as operating leases. The application of the new accounting model is expected to lead to an increase in both assets and liabilities and to impact on the timing of the expense recognition in the statement of profit or loss over the period of the lease. At 30 September 2018 the Group’s future minimum lease payments under non-cancellable operating leases amount to US$99.3 million for land and buildings, the majority of which is payable between one and five years after the reporting date. Some of these amounts may therefore need to be recognised as lease liabilities, with corresponding right-of-use assets, once IFRS 16 is adopted. The Group will need to perform a more detailed analysis to determine the amounts of new assets and liabilities arising from operating lease commitments on adoption of IFRS 16.
17 Approval of Interim Financial Report
The Interim Financial Report was approved by the Board on 12 November 2018.
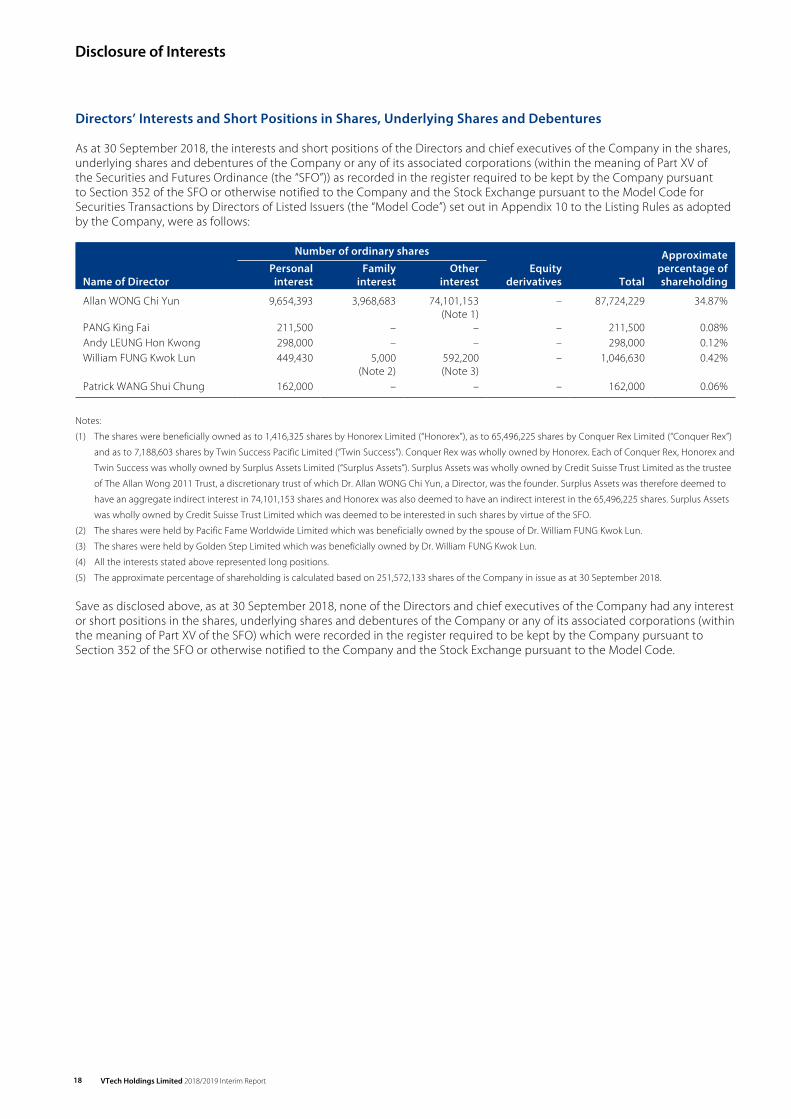
Disclosure of Interests
VTech Holdings Limited 2018/2019 Interim Report18
Directors’ Interests and Short Positions in Shares, Underlying Shares and Debentures
As at 30 September 2018, the interests and short positions of the Directors and chief executives of the Company in the shares, underlying shares and debentures of the Company or any of its associated corporations (within the meaning of Part XV of the Securities and Futures Ordinance (the “SFO”)) as recorded in the register required to be kept by the Company pursuant to Section 352 of the SFO or otherwise notified to the Company and the Stock Exchange pursuant to the Model Code for Securities Transactions by Directors of Listed Issuers (the “Model Code”) set out in Appendix 10 to the Listing Rules as adopted by the Company, were as follows:
Number of ordinary shares Approximate
Name of DirectorPersonal interest
Family interest
Other interest
Equity derivatives Total
percentage of shareholding
Allan WONG Chi Yun 9,654,393 3,968,683 74,101,153 (Note 1)
– 87,724,229 34.87%
PANG King Fai 211,500 – – – 211,500 0.08%Andy LEUNG Hon Kwong 298,000 – – – 298,000 0.12%William FUNG Kwok Lun 449,430 5,000
(Note 2)592,200 (Note 3)
– 1,046,630 0.42%
Patrick WANG Shui Chung 162,000 – – – 162,000 0.06%
Notes:
(1) The shares were beneficially owned as to 1,416,325 shares by Honorex Limited (“Honorex”), as to 65,496,225 shares by Conquer Rex Limited (“Conquer Rex”)
and as to 7,188,603 shares by Twin Success Pacific Limited (“Twin Success”). Conquer Rex was wholly owned by Honorex. Each of Conquer Rex, Honorex and
Twin Success was wholly owned by Surplus Assets Limited (“Surplus Assets”). Surplus Assets was wholly owned by Credit Suisse Trust Limited as the trustee
of The Allan Wong 2011 Trust, a discretionary trust of which Dr. Allan WONG Chi Yun, a Director, was the founder. Surplus Assets was therefore deemed to
have an aggregate indirect interest in 74,101,153 shares and Honorex was also deemed to have an indirect interest in the 65,496,225 shares. Surplus Assets
was wholly owned by Credit Suisse Trust Limited which was deemed to be interested in such shares by virtue of the SFO.
(2) The shares were held by Pacific Fame Worldwide Limited which was beneficially owned by the spouse of Dr. William FUNG Kwok Lun.
(3) The shares were held by Golden Step Limited which was beneficially owned by Dr. William FUNG Kwok Lun.
(4) All the interests stated above represented long positions.
(5) The approximate percentage of shareholding is calculated based on 251,572,133 shares of the Company in issue as at 30 September 2018.
Save as disclosed above, as at 30 September 2018, none of the Directors and chief executives of the Company had any interest or short positions in the shares, underlying shares and debentures of the Company or any of its associated corporations (within the meaning of Part XV of the SFO) which were recorded in the register required to be kept by the Company pursuant to Section 352 of the SFO or otherwise notified to the Company and the Stock Exchange pursuant to the Model Code.
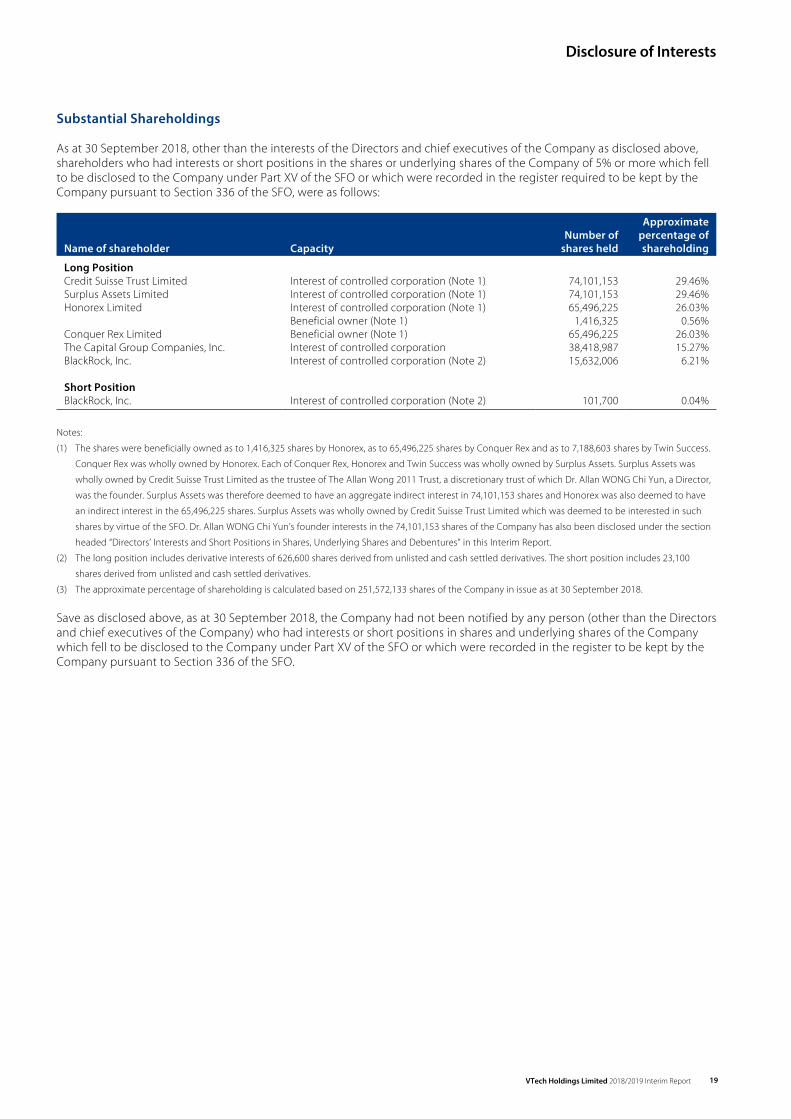
VTech Holdings Limited 2018/2019 Interim Report 19
Disclosure of Interests
Substantial Shareholdings
As at 30 September 2018, other than the interests of the Directors and chief executives of the Company as disclosed above, shareholders who had interests or short positions in the shares or underlying shares of the Company of 5% or more which fell to be disclosed to the Company under Part XV of the SFO or which were recorded in the register required to be kept by the Company pursuant to Section 336 of the SFO, were as follows:
Name of shareholder CapacityNumber of
shares held
Approximate percentage of
shareholding
Long PositionCredit Suisse Trust Limited Interest of controlled corporation (Note 1) 74,101,153 29.46%Surplus Assets Limited Interest of controlled corporation (Note 1) 74,101,153 29.46%Honorex Limited Interest of controlled corporation (Note 1) 65,496,225 26.03%
Beneficial owner (Note 1) 1,416,325 0.56%Conquer Rex Limited Beneficial owner (Note 1) 65,496,225 26.03%The Capital Group Companies, Inc. Interest of controlled corporation 38,418,987 15.27%BlackRock, Inc. Interest of controlled corporation (Note 2) 15,632,006 6.21%
Short PositionBlackRock, Inc. Interest of controlled corporation (Note 2) 101,700 0.04%
Notes:
(1) The shares were beneficially owned as to 1,416,325 shares by Honorex, as to 65,496,225 shares by Conquer Rex and as to 7,188,603 shares by Twin Success.
Conquer Rex was wholly owned by Honorex. Each of Conquer Rex, Honorex and Twin Success was wholly owned by Surplus Assets. Surplus Assets was
wholly owned by Credit Suisse Trust Limited as the trustee of The Allan Wong 2011 Trust, a discretionary trust of which Dr. Allan WONG Chi Yun, a Director,
was the founder. Surplus Assets was therefore deemed to have an aggregate indirect interest in 74,101,153 shares and Honorex was also deemed to have
an indirect interest in the 65,496,225 shares. Surplus Assets was wholly owned by Credit Suisse Trust Limited which was deemed to be interested in such
shares by virtue of the SFO. Dr. Allan WONG Chi Yun’s founder interests in the 74,101,153 shares of the Company has also been disclosed under the section
headed “Directors’ Interests and Short Positions in Shares, Underlying Shares and Debentures” in this Interim Report.
(2) The long position includes derivative interests of 626,600 shares derived from unlisted and cash settled derivatives. The short position includes 23,100
shares derived from unlisted and cash settled derivatives.
(3) The approximate percentage of shareholding is calculated based on 251,572,133 shares of the Company in issue as at 30 September 2018.
Save as disclosed above, as at 30 September 2018, the Company had not been notified by any person (other than the Directors and chief executives of the Company) who had interests or short positions in shares and underlying shares of the Company which fell to be disclosed to the Company under Part XV of the SFO or which were recorded in the register to be kept by the Company pursuant to Section 336 of the SFO.
Corporate Governance
VTech Holdings Limited 2018/2019 Interim Report20
Corporate Governance Practices
VTech Holdings Limited is incorporated in Bermuda and has its shares listed on the Stock Exchange. The corporate governance rules applicable to the Company are the Corporate Governance Code (the “Code”) set out in Appendix 14 to the Listing Rules. Throughout the six months ended 30 September 2018, the Company has complied with all the code provisions of the Code and to a large extent the recommended best practices in the Code, except for the deviation from code provision A.2.1 of the Code as described below.
Under code provision A.2.1 of the Code, the roles of chairman and chief executive should be separate and should not be performed by the same individual. Dr. Allan WONG Chi Yun has the combined role of Chairman and Group Chief Executive Officer. The Board of Directors (the “Board”) considers that this structure will not impair the balance of power and authority between the Board and the management of the Company and its subsidiaries (the“Group”) as the majority of the Board members are independent non-executive Directors. The Board believes the appointment of Dr. Allan WONG Chi Yun to the combined role of Chairman and Group Chief Executive Officer is beneficial to the Group as he has considerable industry experience.
The Board has established an Audit Committee, a Nomination Committee, a Remuneration Committee, and a Risk Management and Sustainability Committee, each with defined terms of reference which are no less exacting than those set out in the Code. Corporate governance practices adopted by the Company during the six months ended 30 September 2018 are in line and consistent with those practices set out in the Company’s 2018 Annual Report.
Model Code for Securities Transactions
The Company has adopted the Model Code set out in Appendix 10 to the Listing Rules regarding securities transactions by Directors and senior management. After having made specific enquiries, all Directors confirmed that they have complied with the required standard of dealings set out in the Model Code throughout the six months ended 30 September 2018.
Audit Committee
The Audit Committee is chaired by Mr. WONG Kai Man with Dr. William FUNG Kwok Lun, Professor KO Ping Keung and Dr. Patrick WANG Shui Chung as members. All of the members are independent non-executive Directors. It has been established to assist the Board in fulfilling its overseeing responsibilities for financial reporting, risk management, corporate governance functions and evaluation of internal control and auditing processes. It also ensures that the Group complies with all applicable laws and regulations.
Mr. WONG Kai Man, as the chairman of the Audit Committee, has the appropriate financial management expertise as required under the Listing Rules. The Audit Committee has held two meetings during the financial period and up to the date of this Interim Report. In addition to the Audit Committee members, the meetings were attended by the Group Chief Executive Officer, the Company Secretary and Group Chief Compliance Officer, the Group Chief Financial Officer and the external auditor. The work performed by the Audit Committee during the financial period and up to the date of this Interim Report included, but is not limited to, reviewing the following:
– audited Group’s consolidated financial statements and reports for the year ended 31 March 2018;
– report from the external auditor for the year ended 31 March 2018;
– corporate governance report in the 2018 Annual Report in compliance with the Code;
– unaudited Group Interim Financial Report for the six months ended 30 September 2018;
– report from the external auditor based on limited agreed-upon procedures on the unaudited Group Interim Financial Report for the six months ended 30 September 2018;
– corporate governance section in the 2018/2019 Interim Report in compliance with the Code;
– accounting principles and practices adopted by the Group;
– appointment of the external auditor and its remuneration;
– fee level and nature of non-audit work performed by the external auditor;
– significant findings by the Internal Audit Department and recommendations for corrective actions;
– reports made under the Whistleblowing Policy;– respective audit plans of the internal and external
auditors;– training and continuous professional development of
the Directors and senior management;– 2018 Sustainability Report; and– adequacy of resources, staff qualifications and
experience, training programmes and budget of the Group’s accounting, financial reporting and internal audit functions.
In addition to the above, the Audit Committee assisted the Board in meeting its responsibilities for maintaining an effective system of internal control during the financial period. It reviewed the process by which the Group evaluates its control environment and risk assessment procedures, and the way in which business and control risks are managed on a regular basis.
It should be noted that a system of internal control, no matter how well it is designed and operated, can only provide reasonable but not absolute assurance that the objectives of the system of internal control, such as safeguarding assets from inappropriate use or ensuring compliance with regulations, are met. As a result, it should not be expected that a system of internal control will prevent or detect all errors and frauds.
VTech Holdings Limited 2018/2019 Interim Report 21
Corporate Governance
Based on the information received from the management, the external auditor and the Internal Audit Department, the Audit Committee is satisfied that the overall financial and operational controls, and the internal audit function of the Group continued to be effective and adequate.
The Audit Committee has also been given the responsibility to oversee the effectiveness of formal procedures for employees to raise any matters of serious concerns and is required to review any reports made by the Internal Audit Department regarding this.
Risk Management and Sustainability Committee
The Risk Management and Sustainability Committee is chaired by Dr. Allan WONG Chi Yun with Dr. PANG King Fai, Mr. Andy LEUNG Hon Kwong, Mr. WONG Kai Man, Ms. Shereen TONG Ka Hung and Mr. CHANG Yu Wai as members. It comprises executive Directors, an independent non-executive Director, the Group Chief Financial Officer, and the Company Secretary and Group Chief Compliance Officer. It is responsible for monitoring and reviewing the risk management and sustainability strategies of the Group on a regular basis, and reports to the Audit Committee on a biannual basis of any significant findings.
The Risk Management and Sustainability Committee has held two meetings during the financial period and up to the date of this Interim Report to review the Group’s risk management and internal control system, and sustainability strategies, policies and improvement activities.
The Risk Management and Sustainability Committee has developed a framework for the management and control of risks in the Group. Risks are being formally identified and recorded in a risk register (the “Risk Register”) for key operations. This Risk Register is updated regularly and the major risks are being reviewed from time to time by the Risk Management and Sustainability Committee. The major risks in this Risk Register include:
– staff and supplier integrity;– product design, recall, quality and safety;– sales and receivable management, and marketing
and promotion;– procurement and supplier management;– compliance with patents and intellectual property
rights requirements;– cybersecurity and information technology risks;– physical security and risk of fire;– human resources, employee compensation and safety;– compliance with the relevant laws and regulations that
have a significant impact on the Group;– business interruption; and– US tariffs against China export.
In addition, the Risk Management and Sustainability Committee also reviewed the financial risks of the Group, the details of which are set out in note 22 to the financial statements for the year ended 31 March 2018.
The Risk Management and Sustainability Committee ensures that any new and emerging risks are promptly identified, evaluated and appropriate actions are taken by the management. This requires the active and frequent participation by the process owner of each function in identifying risks affecting its business and implementing measures to reduce such risks, as well as the active monitoring on the progress of the improvement in internal control procedures.
The Data Security Governance Board was established with defined terms of reference reporting to the Risk Management and Sustainability Committee. It is chaired by the Group Chief Executive Officer and comprises the Group President, the CMS Chief Executive Officer, the TEL President, the Group Chief Financial Officer, the Company Secretary and Group Chief Compliance Officer, and the Group Chief Information Officer. It is responsible for the decision-making, implementation, enforcement, oversight, compliance and periodic review of the Data Security Policy. During the financial period and up to the date of this Interim Report, the Risk Management and Sustainability Committee has reviewed the meeting minutes of the Data Security Governance Board.
The Risk Management and Sustainability Committee also provides vision and strategic direction for our sustainability activities, reviews our sustainability strategies and improvement activities, assesses how the policies are implemented in achieving the sustainability goals and targets, and monitors the performance progress on a biannual basis. During the financial period and up to the date of this Interim Report, it has determined the scope of the Company’s annual Sustainability Report and reviewed the Company’s 2018 Sustainability Report, which informs our stakeholders of our sustainability strategies and activities, and the performance progress against our sustainability targets.
Other Information
VTech Holdings Limited 2018/2019 Interim Report22
Interim Dividend
The Board has declared an interim dividend (the “Interim Dividend”) of US17.0 cents per ordinary share in respect of the six months ended 30 September 2018, payable on 17 December 2018 to shareholders whose names appear on the register of members of the Company as at the close of business on 6 December 2018.
The Interim Dividend will be payable in United States dollars save that those shareholders with a registered address in Hong Kong will receive an equivalent amount in Hong Kong dollars which will be calculated at the rate of exchange as quoted to the Company by The Hongkong and Shanghai Banking Corporation Limited at its middle rate of exchange prevailing on 6 December 2018.
Closure of Register of Members
The register of members of the Company will be closed on 6 December 2018, during which no transfer of shares will be effected.
In order to qualify for the Interim Dividend, all transfer documents, accompanied by the relevant share certificates, must be lodged with the share registrars of the Company for registration no later than 4:30 p.m. (the local time of the relevant share registrar) on Wednesday, 5 December 2018.
The principal registrar is MUFG Fund Services (Bermuda) Limited, The Belvedere Building, 69 Pitts Bay Road, Pembroke HM08, Bermuda and the branch registrar in Hong Kong is Computershare Hong Kong Investor Services Limited, Shops 1712-16, 17th Floor, Hopewell Centre, 183 Queen’s Road East, Wan Chai, Hong Kong.
Review of Interim Report
The Group’s Interim Financial Report for the six months ended 30 September 2018 has been reviewed by the Audit Committee.
Purchase, Sale or Redemption of Listed Shares
The Company and its subsidiaries have not redeemed any of its shares during the six months ended 30 September 2018. Neither the Company nor any of its subsidiaries has purchased or sold any of the Company’s shares during the financial period, except that the trustee of the Share Purchase Scheme, pursuant to the rules and trust deed of the Share Purchase Scheme, purchased on the Stock Exchange a total of 130,600 Company’s shares at a consideration of approximately US$1.5 million.
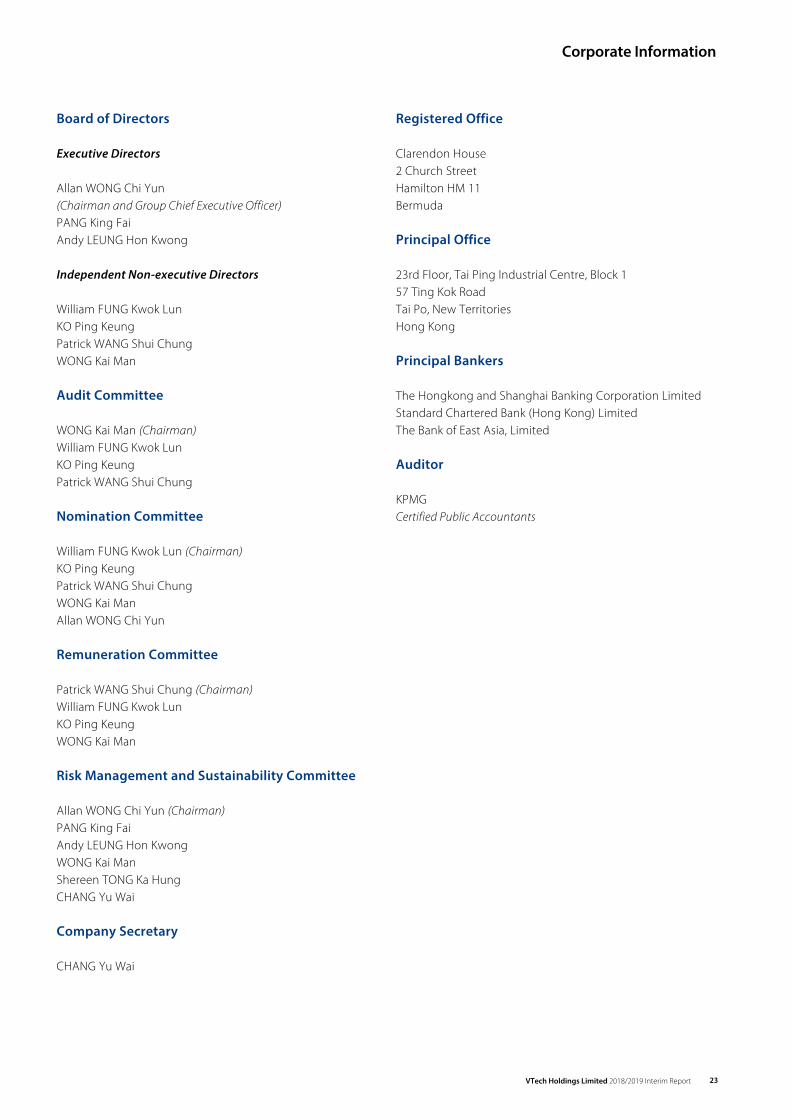
VTech Holdings Limited 2018/2019 Interim Report 23
Corporate Information
Board of Directors
Executive Directors
Allan WONG Chi Yun(Chairman and Group Chief Executive Officer)PANG King FaiAndy LEUNG Hon Kwong
Independent Non-executive Directors
William FUNG Kwok LunKO Ping KeungPatrick WANG Shui ChungWONG Kai Man
Audit Committee
WONG Kai Man (Chairman)William FUNG Kwok LunKO Ping KeungPatrick WANG Shui Chung
Nomination Committee
William FUNG Kwok Lun (Chairman)KO Ping KeungPatrick WANG Shui ChungWONG Kai ManAllan WONG Chi Yun
Remuneration Committee
Patrick WANG Shui Chung (Chairman)William FUNG Kwok LunKO Ping KeungWONG Kai Man
Risk Management and Sustainability Committee
Allan WONG Chi Yun (Chairman)PANG King FaiAndy LEUNG Hon KwongWONG Kai ManShereen TONG Ka HungCHANG Yu Wai
Company Secretary
CHANG Yu Wai
Registered Office
Clarendon House2 Church StreetHamilton HM 11Bermuda
Principal Office
23rd Floor, Tai Ping Industrial Centre, Block 157 Ting Kok RoadTai Po, New TerritoriesHong Kong
Principal Bankers
The Hongkong and Shanghai Banking Corporation LimitedStandard Chartered Bank (Hong Kong) LimitedThe Bank of East Asia, Limited
Auditor
KPMGCertified Public Accountants
Information for Shareholders
VTech Holdings Limited 2018/2019 Interim Report24
Listing and Stock Code
The Stock Exchange of Hong Kong Limited: 303
Financial Calendar
Closure of Register of Members: 6 December 2018
Payment of Interim Dividend: 17 December 2018
FY2019 Annual Results Announcement: May 2019
Share Information
Board lot: 100 shares
Issued shares as at 30 September 2018: 251,572,133 shares
Dividend
Dividend per ordinary share for the six months ended 30 September 2018: US17.0 cents per share
Share Registrars
PrincipalMUFG Fund Services (Bermuda) LimitedThe Belvedere Building69 Pitts Bay RoadPembroke HM08Bermuda
Hong Kong BranchComputershare Hong Kong Investor Services LimitedShops 1712-16, 17th Floor, Hopewell Centre183 Queen’s Road East, Wan ChaiHong KongTel: (852) 2862 8555Fax: (852) 2865 0990Email: [email protected]
Investor Relations Contact and Website
Corporate Marketing Department23rd Floor, Tai Ping Industrial Centre, Block 157 Ting Kok RoadTai Po, New TerritoriesHong KongTel: (852) 2680 1000Fax: (852) 2680 1788Email: [email protected]/en/investors