challenge in the new millenium the next great...
TRANSCRIPT
RISK MANAGEMENT OF CREDIT ASSETS: THE NEXT GREAT FINANCIAL
CHALLENGE IN THE NEW MILLENIUM
Dr. Edward I. AltmanMax L. Heine Professor of Finance
NYU Stern School of Business
2
Managing Credit Risk: The Challenge in the New Millenium
Edward I. Altman(Seminar Outline)
Subject Area
• Credit Risk: A Global Challenge in High and Low Risk Regions• The New BIS Guidelines on Capital Allocation• Credit Risk Management Issues - Credit Culture Importance
– Caveats, Importance and Recommendations• The Pricing of Credit Risk Assets• Credit Scoring and Rating Systems• Traditional and Non-Traditional Credit Scoring Systems
– Approaches and Tests for Implementation– Predicting Financial Distress (Z and ZETA Models)– Models based on Stock Price - KMV, etc.– Neural Networks and Rating Replication Models
3
(Seminar Outline Continued)
• A Model for Emerging Market Credits– Country Risk Issues
• CreditMetrics® and Other Portfolio Frameworks• Default Rates, Recoveries, Mortality Rates and Losses
– Capital Market Experience, 1971-2000– Default Recovery Rates on Bonds and Bank Loans– Correlation Between Default and Recovery Rates– Mortality Rate Concept and Results– Valuation of Fixed Income Securities– Credit Rating Migration Analysis
• Collateralized Bond/Loan Obligations - Structured Finance• Understanding and Using Credit Derivatives• Corporate Bond and Commercial Loan Portfolio Analysis
CREDIT RISK MANAGEMENT ISSUES
5
Credit Risk: A Global Challenge
In Low Credit Risk Regions (1998 - No Longer in 2001)• New Emphasis on Sophisticated Risk Management and the Changing
Regulatory Environment for Banks• Refinements of Credit Scoring Techniques• Large Credible Databases - Defaults, Migration• Loans as Securities• Portfolio Strategies• Offensive Credit Risk Products
– Derivatives, Credit Insurance, Securitizations
6
Credit Risk: A Global Challenge(Continued)
In High Credit Risk Regions• Lack of Credit Culture (e.g., Asia, Latin America), U.S. in 1996 -
1998?• Losses from Credit Assets Threaten Financial System• Many Banks and Investment Firms Have Become Insolvent• Austerity Programs Dampen Demand - Good?• Banks Lose the Will to Lend to “Good Firms” - Economy Stagnates
7
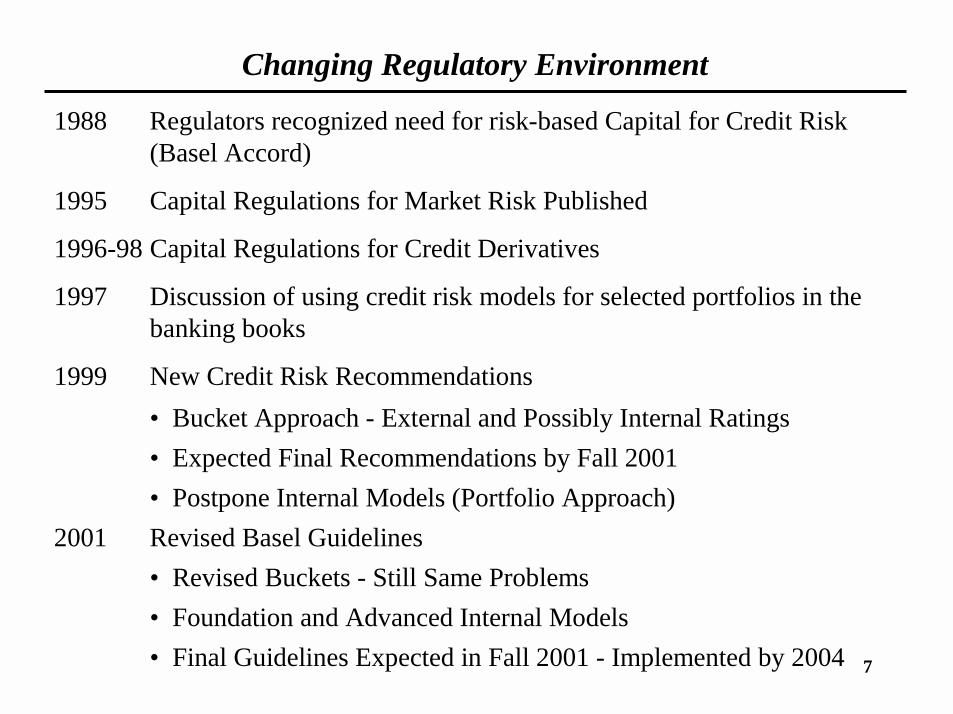
Changing Regulatory Environment
1988 Regulators recognized need for risk-based Capital for Credit Risk (Basel Accord)
1995 Capital Regulations for Market Risk Published
1996-98 Capital Regulations for Credit Derivatives
1997 Discussion of using credit risk models for selected portfolios in the banking books
1999 New Credit Risk Recommendations• Bucket Approach - External and Possibly Internal Ratings• Expected Final Recommendations by Fall 2001• Postpone Internal Models (Portfolio Approach)
2001 Revised Basel Guidelines• Revised Buckets - Still Same Problems• Foundation and Advanced Internal Models • Final Guidelines Expected in Fall 2001 - Implemented by 2004

8
THREE PILLARS OF BASEL II
9

10
11
12
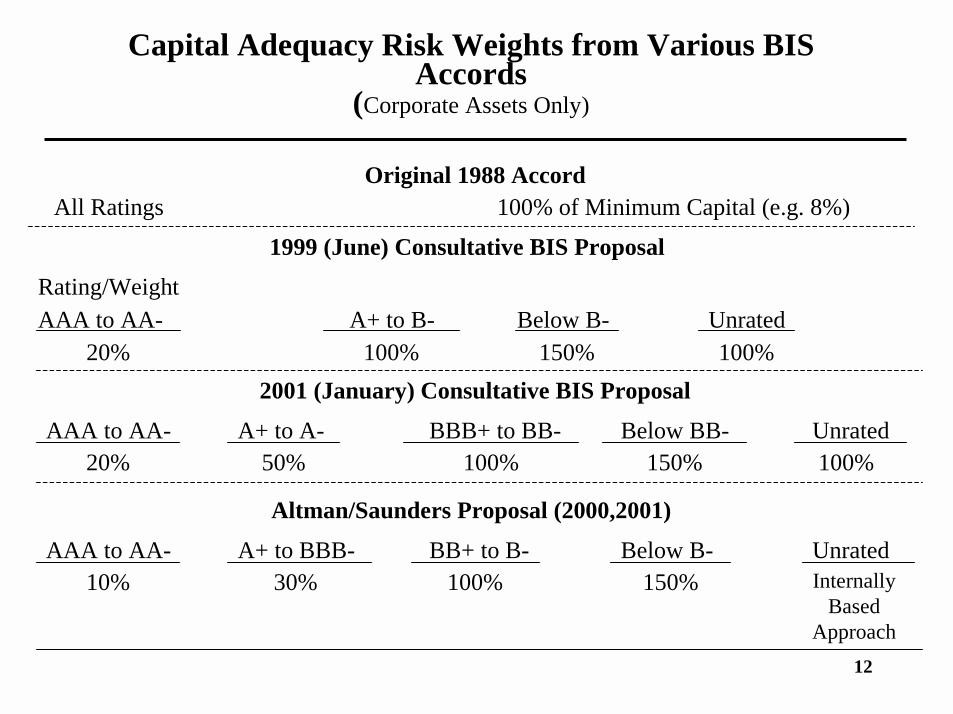
Capital Adequacy Risk Weights from Various BIS Accords
(Corporate Assets Only)
Original 1988 AccordAll Ratings 100% of Minimum Capital (e.g. 8%)
1999 (June) Consultative BIS ProposalRating/WeightAAA to AA- A+ to B- Below B- Unrated
20% 100% 150% 100%2001 (January) Consultative BIS Proposal
AAA to AA- A+ to A- BBB+ to BB- Below BB- Unrated20% 50% 100% 150% 100%
Altman/Saunders Proposal (2000,2001)
AAA to AA- A+ to BBB- BB+ to B- Below B- Unrated10% 30% 100% 150% Internally
Based Approach

13
Basic Architecture of an Internal Ratings-Based (IRB) Approach to Capital
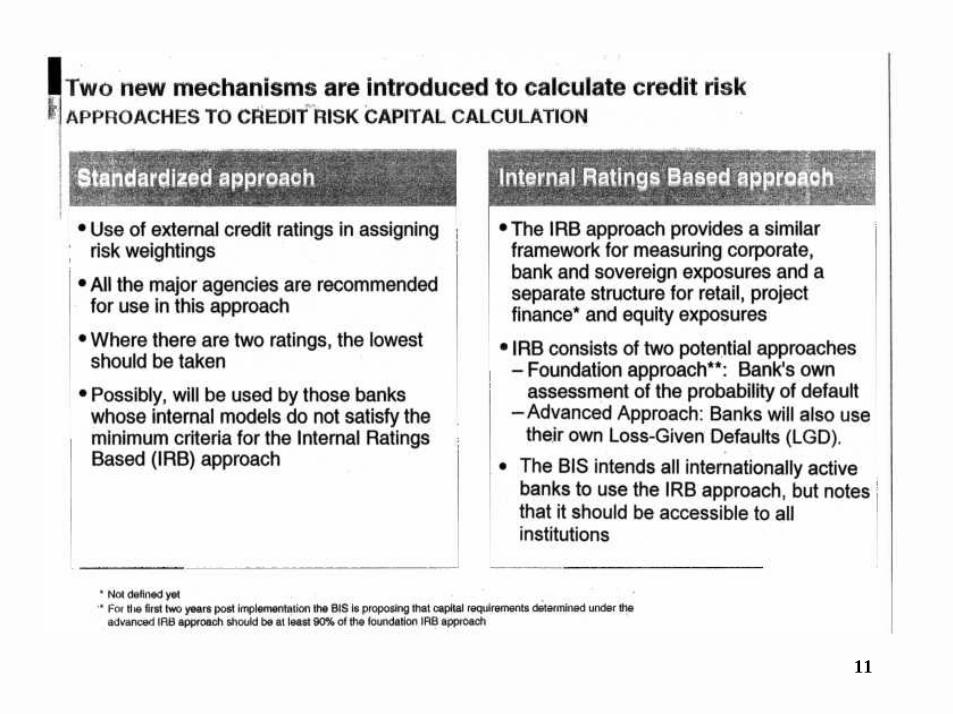
• In order to become eligible for the IRB approach, a bank would first need to demonstrate that its internal rating system and processes are in accordance with the minimum standards and sound practice guidelines which will be set forward by the Basel Committee.
• The bank would furthermore need to provide to supervisors exposure amounts and estimates of some or all of the key loss statistics associated with these exposures, such as Probability of Default (PD), by internal rating grade (Foundation Approach).
• Based on the bank’s estimate of the probability of default, as well as the estimates of the loss given default (LGD) and maturity of loan, a bank’s exposures would be assigned to capital “buckets” (Advanced Approach). Each bucket would have an associated risk weight that incorporates the expected (up to 1.25%) and unexpected loss associated with estimates of PD and LGD, and possibly other riskcharacteristics.
14
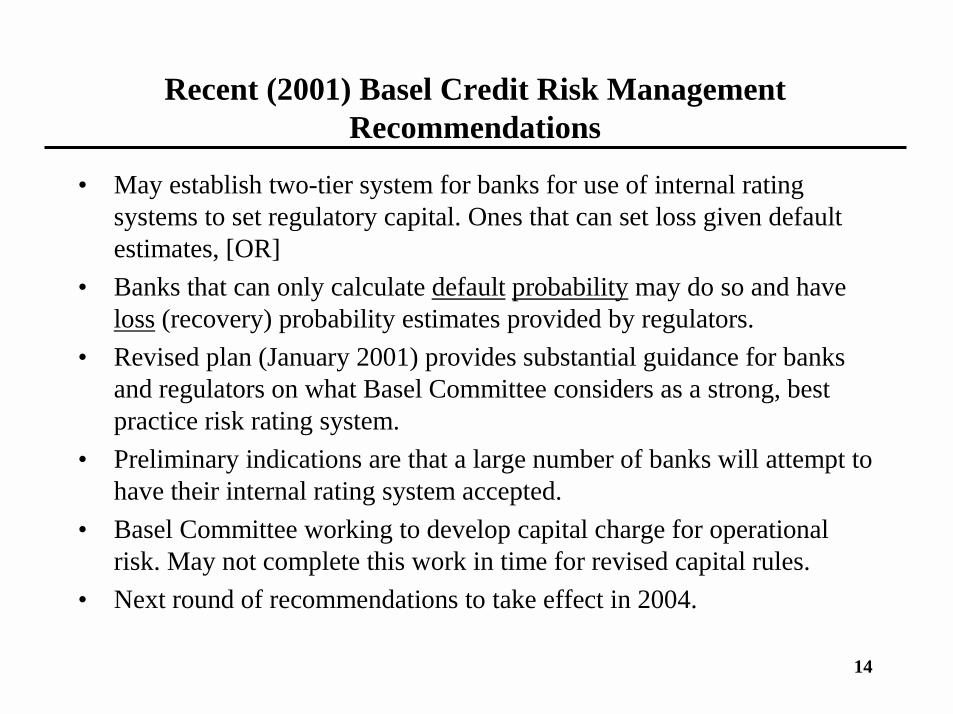
Recent (2001) Basel Credit Risk Management Recommendations
• May establish two-tier system for banks for use of internal rating systems to set regulatory capital. Ones that can set loss given default estimates, [OR]
• Banks that can only calculate default probability may do so and have loss (recovery) probability estimates provided by regulators.
• Revised plan (January 2001) provides substantial guidance for banks and regulators on what Basel Committee considers as a strong, best practice risk rating system.
• Preliminary indications are that a large number of banks will attempt to have their internal rating system accepted.
• Basel Committee working to develop capital charge for operational risk. May not complete this work in time for revised capital rules.
• Next round of recommendations to take effect in 2004.

15
Risk Weights for Sovereign and Banks(Based on January 2001 BIS Proposal)
Sovereigns
Credit Assessment AAA A+ BBB+ BB+ Below
of Sovereign to AA- to A- to BBB- to B- B- Unrated
Sovereign risk
weights 0% 20% 50% 100% 150% 100%
Risk weights
of banks 20% 50% 100% 100% 150% 100%
Suggestions (Altman): * Add a BB+ to BB- Category = 75%
* Eliminate Unrated Category and Use Internal Ratings

16
Risk Weights for Sovereign and Banks(Based on January 2001 BIS Proposal) (continued)
Banks
Credit Assessment AAA A+ BBB+ BB+ Below
of Banks to AA- to A- to BBB- to B- B- Unrated
Risk weights 20% 50% 50% 100% 150% 50%
Risk weights forshort-term claims 20% 20% 20% 50% 150% 20%

17
Minimum BIS Conditions for Collateral Transactions to be Eligible for Credit Mitigation
• Legal Certainty• Low Correlation with Exposure• Robust Risk Management Process• Focus on Underlying Credit• Continuous and Conservative
Valuation of Tranches• Policies and Procedures• Systems for Maintenance of
Criteria• Concentration Risk Consideration• Roll-off Risks• External Factors• Disclosure
18
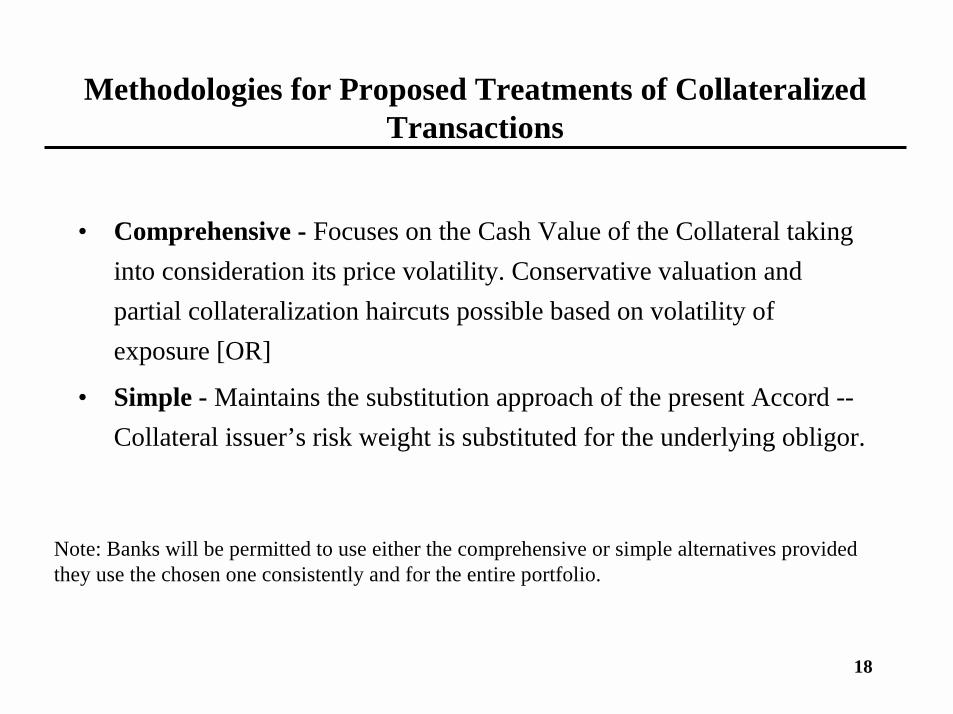
Methodologies for Proposed Treatments of Collateralized Transactions
• Comprehensive - Focuses on the Cash Value of the Collateral taking into consideration its price volatility. Conservative valuation and partial collateralization haircuts possible based on volatility of exposure [OR]
• Simple - Maintains the substitution approach of the present Accord --Collateral issuer’s risk weight is substituted for the underlying obligor.
Note: Banks will be permitted to use either the comprehensive or simple alternatives provided they use the chosen one consistently and for the entire portfolio.
19
Opportunities and Responsibilities for Regulators of Credit Risk
• Assumes Acceptance of Revised BIS Guidelines– Bucket Approach– 2004 Application
• Sanctioning of Internal Rating Systems of Banks– Comprehensiveness of Data– Integrity of Data– Statistical Validity of Scoring Systems– Linkage of Scoring System to Ratings (Mapping)
20
Opportunities and Responsibilities for Regulators of Credit Risk (continued)
• Linkage of Rating System to Probability of Default (PD) Estimation– Mapping of Internal Ratings with Local Companies’ External Ratings– Mapping of External Ratings of Local Company with International
Experience (e.g. S&P)
• Loss Given Default (LGD) Estimation– Need for a Centralized Data Base on Recoveries by Asset Type and
Collateral and Capital Structure– Crucial Role of Central Banks as Coordinator and Sanctioner– Similar Roles in Other Countries, i.e. Italy, U.S., Brazil, by Various
Organizations, e.g. Bank Consortium, Trade Association or Central Banks.
21
The Importance of Credit Ratings
• For Risk Management in General• Greater Understanding Between Borrowers and Lenders• Linkage Between Internal Credit Scoring Models and Bond Ratings• Databases - Defaults and Migration
– Statistics Based on Original (Altman-Mortality) and Cumulative (Static-Pool -S&P), Cohorts (Moody’s) Ratings
• BIS Standards on Capital Adequacy– 8% Rule Now Regardless of Risk - Until 2004 – Bucket Approach Based on External (Possibly Internal) Ratings– Model Approach - Linked to Ratings and Portfolio Risk (Postponed)
• Credit Derivatives– Price Linked to Current Rating, Default and Recovery Rates
• Bond Insurance Companies’– Rating (AAA) of these Firms– Rating of Pools that are Enhanced and Asset-Backed Securities (ABS)
22
Rating Systems
• Bond Rating Agency Systems– US (3) - Moody’s, S&P (20+ Notches), Fitch/IBCA
• Bank Rating Systems– 1 9, A F, Ratings since 1995 (Moody’s and S&P)
• Office of Controller of Currency System– Pass (0%), Substandard (20%), Doubtful (50%), Loss (100%)
• NAIC (Insurance Agency)– 1 6
• Local Rating Systems– Three (Japan)– SERASA (Brazil)– RAM (Malaysia)– New Zealand (NEW)– etc.
23
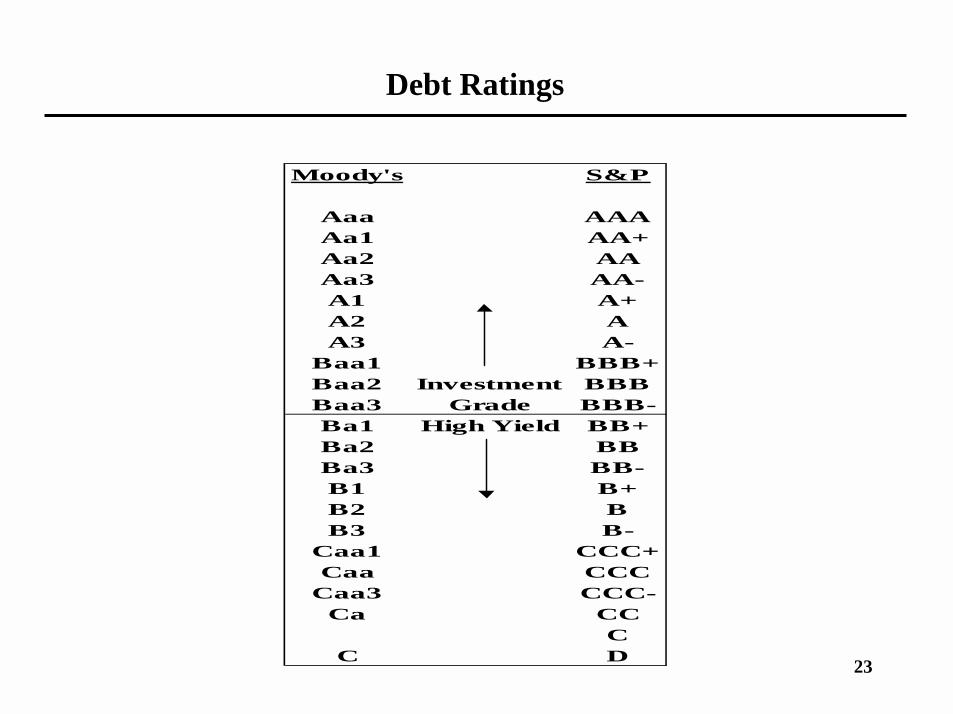
Debt Ratings
Moody's S&P
Aaa AAAAa1 AA+Aa2 AAAa3 AA-A1 A+A2 AA3 A-
Baa1 BBB+Baa2 Investment BBBBaa3 Grade BBB-Ba1 High Yield BB+Ba2 BBBa3 BB-B1 B+B2 BB3 B-
Caa1 CCC+Caa CCC
Caa3 CCC-Ca CC
CC D

24
Scoring Systems
• Qualitative (Subjective)
• Univariate (Accounting/Market Measures)
• Multivariate (Accounting/Market Measures)– Discriminant, Logit, Probit Models (Linear, Quadratic)– Non-Linear Models (e.g.., RPA, NN)
• Discriminant and Logit Models in Use– Consumer Models - Fair Isaacs– Z-Score (5) - Manufacturing– ZETA Score (7) - Industrials– Private Firm Models (eg. Risk Calc (Moody’s), Z” Score)– EM Score (4) - Emerging Markets, Industrial– Other - Bank Specialized Systems

25
Scoring Systems(continued)
• Artificial Intelligence Systems– Expert Systems– Neural Networks (eg. Credit Model (S&P), CBI (Italy))
• Option/Contingent Models– Risk of Ruin– KMV Credit Monitor Model
26
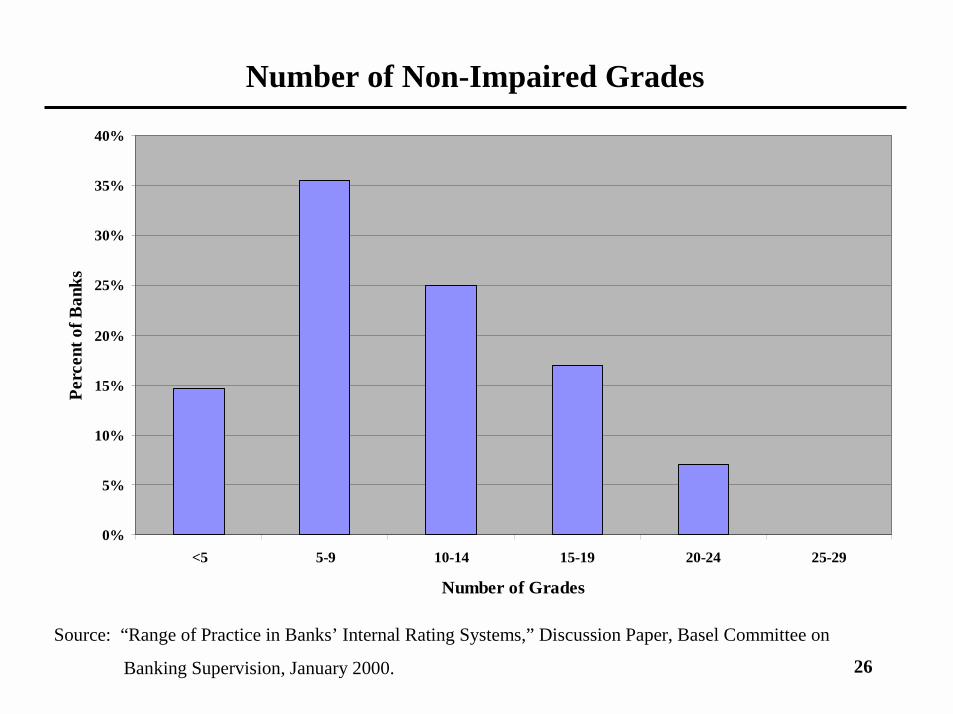
Source: “Range of Practice in Banks’ Internal Rating Systems,” Discussion Paper, Basel Committee on
Banking Supervision, January 2000.
Number of Non-Impaired Grades
0%
5%
10%
15%
20%
25%
30%
35%
40%
<5 5-9 10-14 15-19 20-24 25-29
Number of Grades
Perc
ent o
f Ban
ks
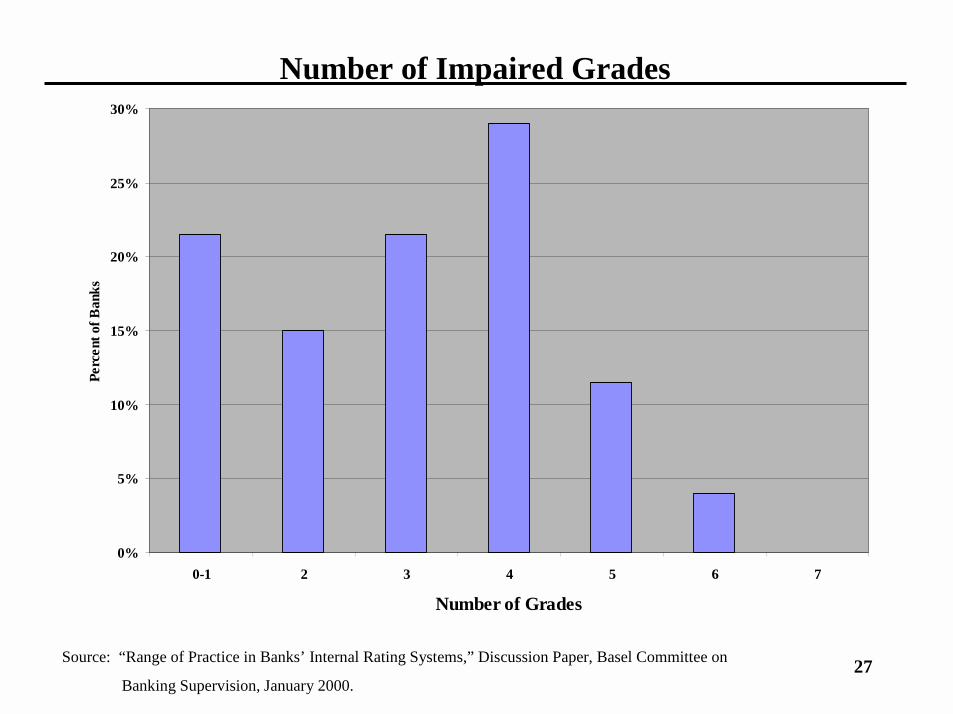
27Source: “Range of Practice in Banks’ Internal Rating Systems,” Discussion Paper, Basel Committee on
Banking Supervision, January 2000.
Number of Impaired Grades
0%
5%
10%
15%
20%
25%
30%
0-1 2 3 4 5 6 7
Number of Grades
Perc
ent o
f Ban
ks
28
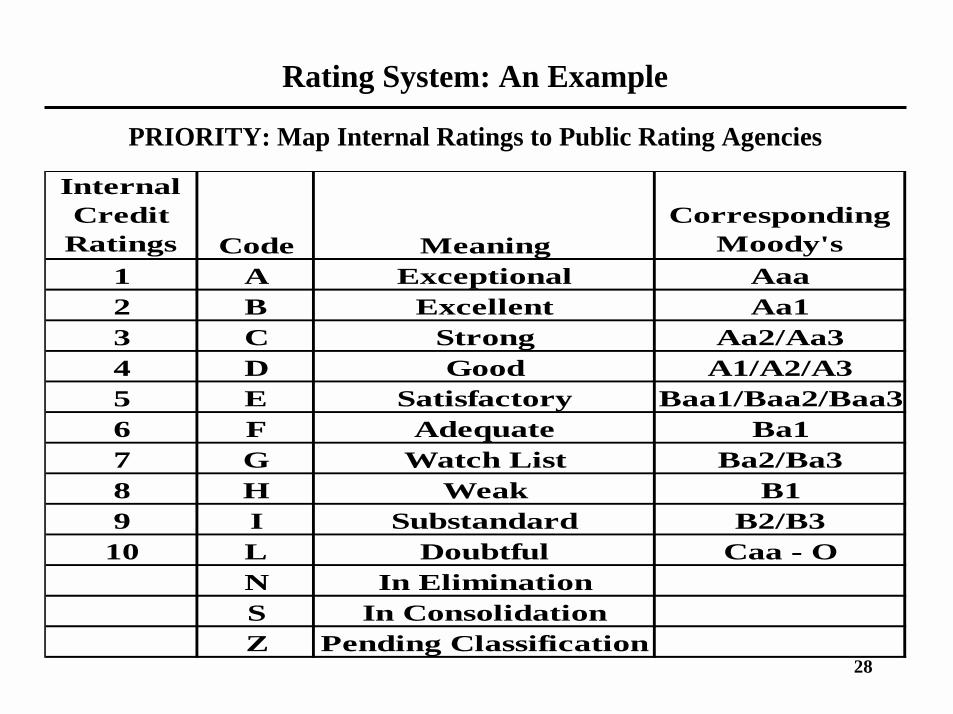
Rating System: An Example
Internal Credit Ratings Code Meaning
Corresponding Moody's
1 A Exceptional Aaa2 B Excellent Aa13 C Strong Aa2/Aa34 D Good A1/A2/A35 E Satisfactory Baa1/Baa2/Baa36 F Adequate Ba17 G Watch List Ba2/Ba38 H Weak B19 I Substandard B2/B310 L Doubtful Caa - O
N In EliminationS In ConsolidationZ Pending Classification
PRIORITY: Map Internal Ratings to Public Rating Agencies

29
Source: “Range of Practice in Banks’ Internal Rating Systems,” Discussion Paper, Basel Committee on
Banking Supervision, January 2000.
Rating Coverage
79%82%
96% 96%
71%
54%
0%
20%
40%
60%
80%
100%
120%
Sovereigns Banks Large Corporates Middle Market Small Corporates Retail Customers
Perc
ent o
f Ban
ks

30
Source: “Range of Practice in Banks’ Internal Rating Systems,” Discussion Paper, Basel Committee on
Banking Supervision, January 2000.
Rating Usage
96%
82%
29%
46% 46%
39%
57%
0%
20%
40%
60%
80%
100%
120%
Report Pricing Reserves EconomicCapital
Allocation
InternalAssessment of
CapitalAdequacy
Compensation Setting of creditLimits
Perc
ent o
f Ban
ks

31
Source: “Range of Practice in Banks’ Internal Rating Systems,” Discussion Paper, Basel Committee on
Banking Supervision, January 2000.
Calculation of Internal Capital Estimates
4%
46%
43%
4%
0%
10%
20%
30%
40%
50%
None Monthly Quarterly Yearly
Perc
ent o
f Ban
ks
32
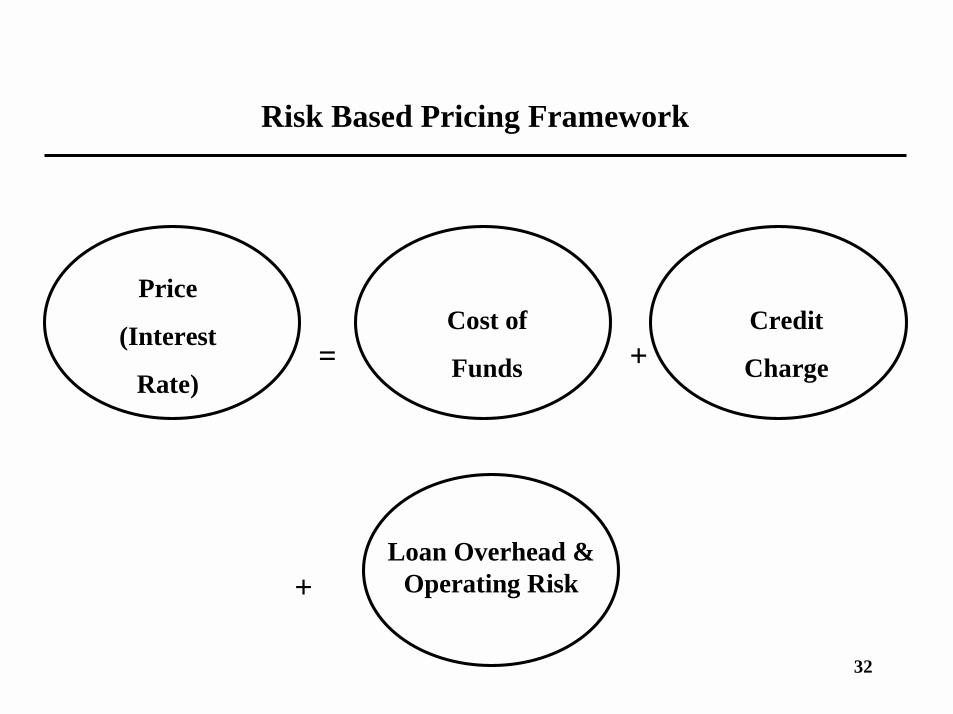
Risk Based Pricing Framework
= +
+
Price
(Interest
Rate)
Cost of
Funds
Credit
Charge
Loan Overhead & Operating Risk
33
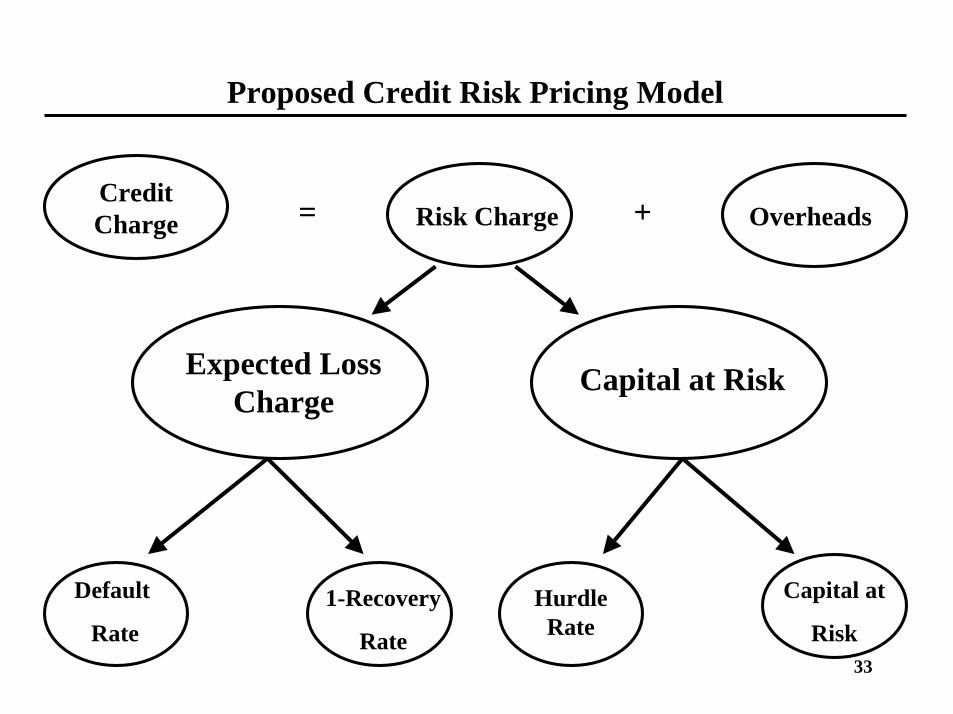
Proposed Credit Risk Pricing Model
Credit Charge Risk Charge Overheads
Expected Loss Charge
Capital at Risk
Default
Rate1-Recovery
Rate
Hurdle Rate
Capital at
Risk
= +
34
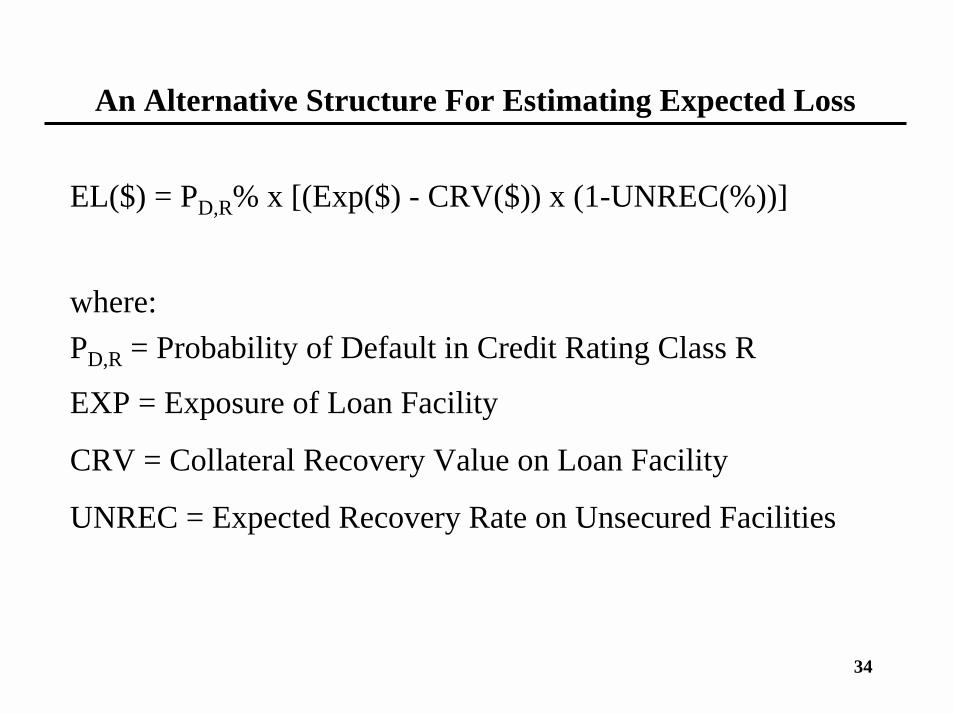
An Alternative Structure For Estimating Expected Loss
EL($) = PD,R% x [(Exp($) - CRV($)) x (1-UNREC(%))]
where:PD,R = Probability of Default in Credit Rating Class R
EXP = Exposure of Loan Facility
CRV = Collateral Recovery Value on Loan Facility
UNREC = Expected Recovery Rate on Unsecured Facilities
35
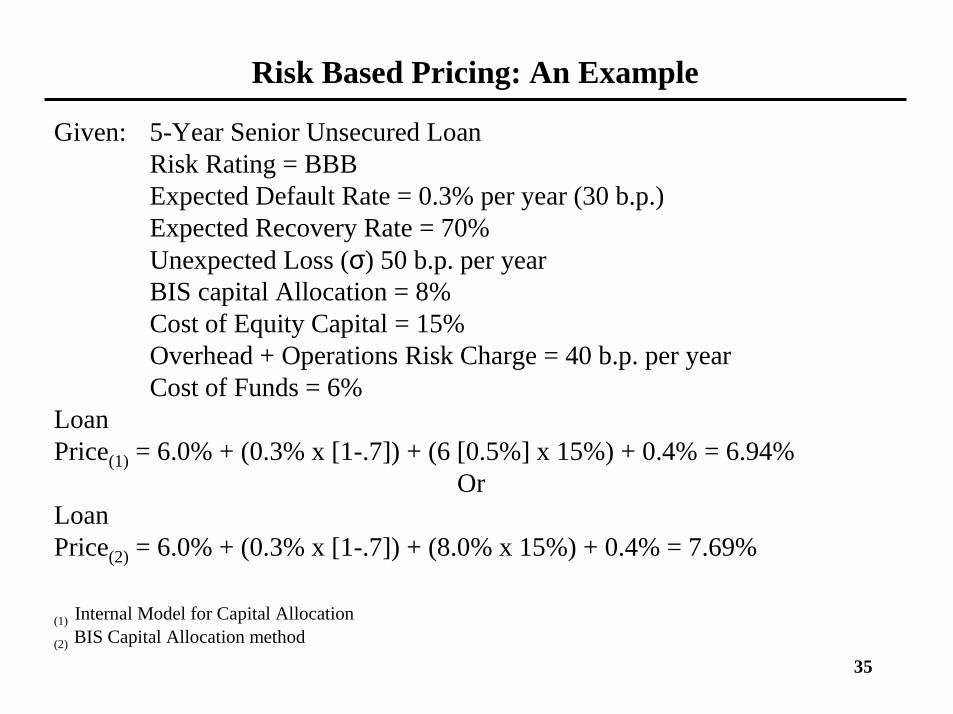
Risk Based Pricing: An Example
Given: 5-Year Senior Unsecured LoanRisk Rating = BBBExpected Default Rate = 0.3% per year (30 b.p.)Expected Recovery Rate = 70%Unexpected Loss (σ) 50 b.p. per yearBIS capital Allocation = 8%Cost of Equity Capital = 15%Overhead + Operations Risk Charge = 40 b.p. per yearCost of Funds = 6%
LoanPrice(1) = 6.0% + (0.3% x [1-.7]) + (6 [0.5%] x 15%) + 0.4% = 6.94%
OrLoanPrice(2) = 6.0% + (0.3% x [1-.7]) + (8.0% x 15%) + 0.4% = 7.69%
(1) Internal Model for Capital Allocation(2) BIS Capital Allocation method
36
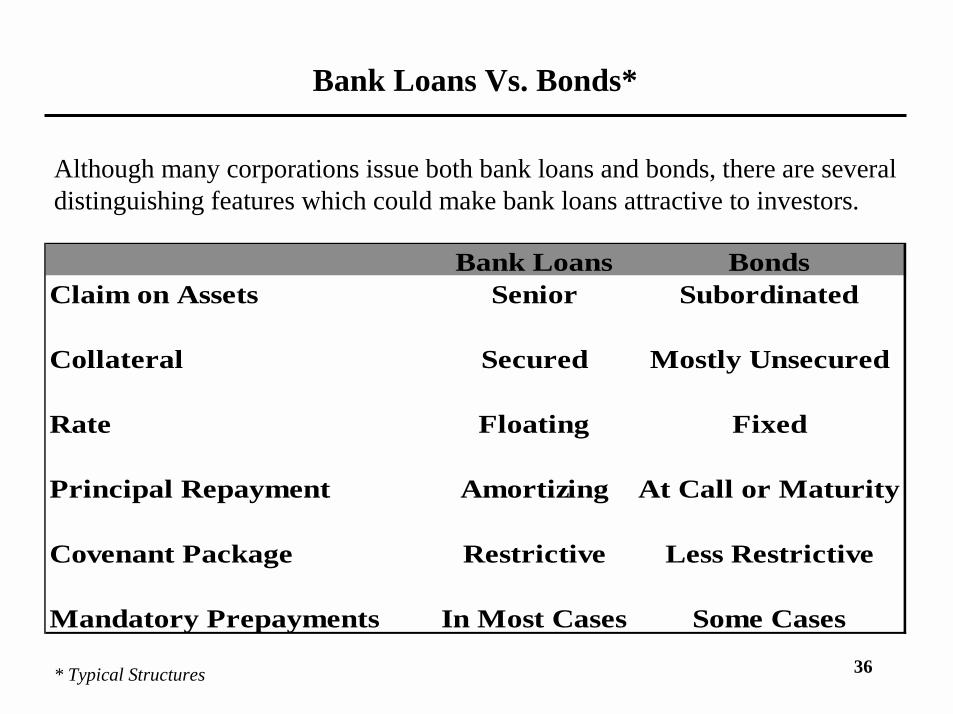
Bank Loans Vs. Bonds*
Although many corporations issue both bank loans and bonds, there are several distinguishing features which could make bank loans attractive to investors.
Bank Loans BondsClaim on Assets Senior Subordinated
Collateral Secured Mostly Unsecured
Rate Floating Fixed
Principal Repayment Amortizing At Call or Maturity
Covenant Package Restrictive Less Restrictive
Mandatory Prepayments In Most Cases Some Cases
* Typical Structures
37
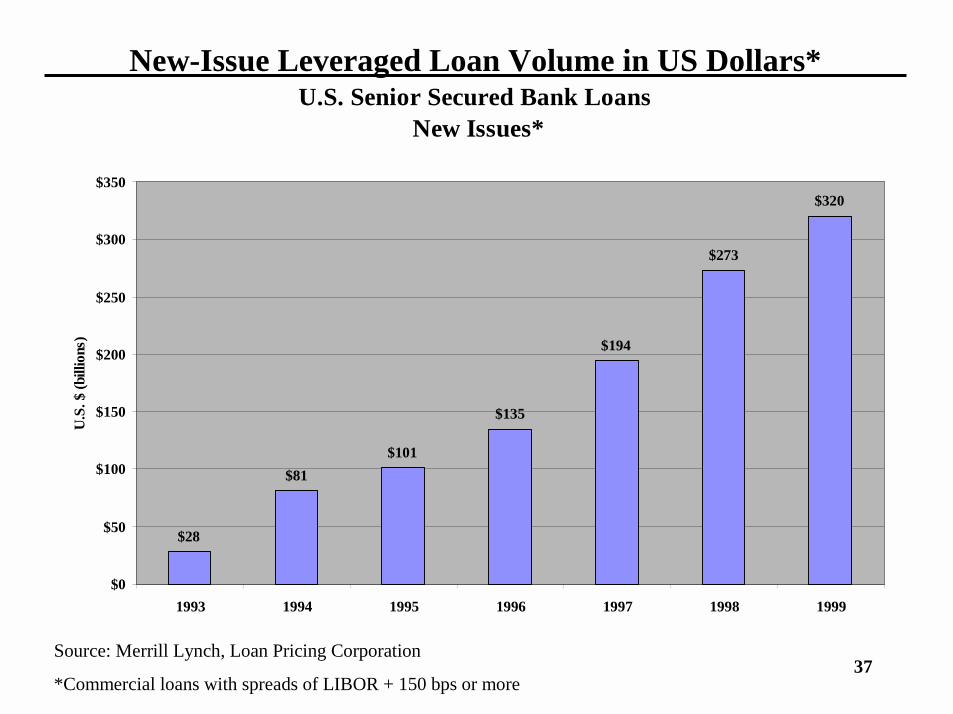
U.S. Senior Secured Bank Loans New Issues*
$28
$81$101
$135
$194
$273
$320
$0
$50
$100
$150
$200
$250
$300
$350
1993 1994 1995 1996 1997 1998 1999
U.S
. $ (b
illio
ns)
New-Issue Leveraged Loan Volume in US Dollars*
Source: Merrill Lynch, Loan Pricing Corporation
*Commercial loans with spreads of LIBOR + 150 bps or more
38
$28
$81$101
$135
$194
$273
$320
$0
$50
$100
$150
$200
$250
$300
$350
1993 1994 1995 1996 1997 1998 1999
U.S
. $
(b
illi
on
s)
$15.0
$20.8
$33.8
$41.1
$61.9$67.3 $65.8
$0
$10
$20
$30
$40
$50
$60
$70
$80
1993 1994 1995 1996 1997 1998 1999
U.S
. $
(b
illi
on
s)
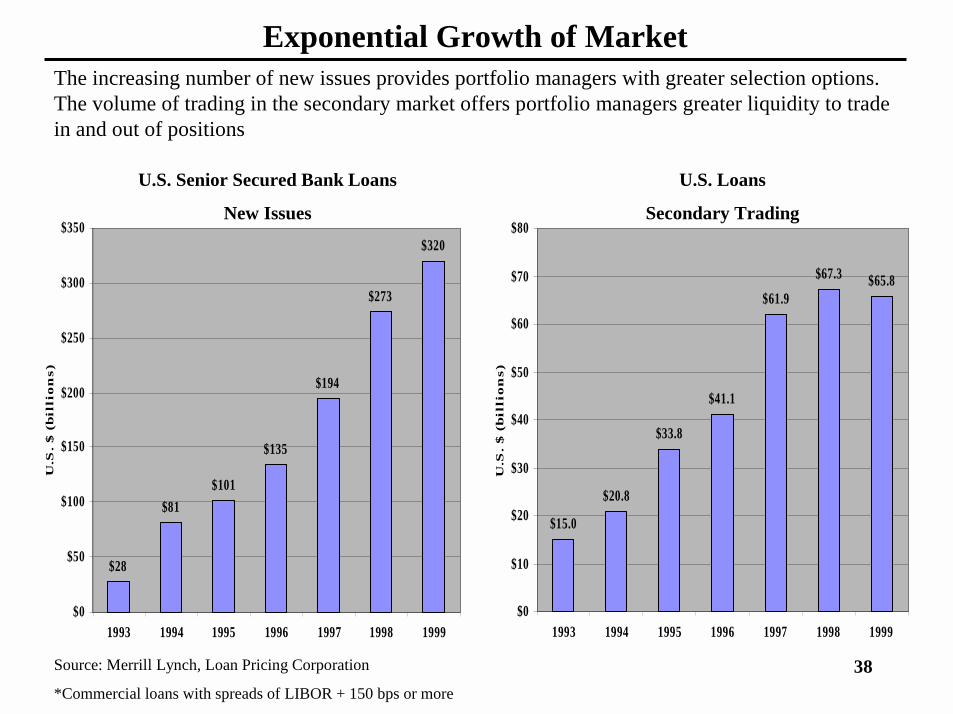
Exponential Growth of Market
Source: Merrill Lynch, Loan Pricing Corporation
*Commercial loans with spreads of LIBOR + 150 bps or more
U.S. Senior Secured Bank Loans
New Issues
U.S. Loans
Secondary Trading
The increasing number of new issues provides portfolio managers with greater selection options. The volume of trading in the secondary market offers portfolio managers greater liquidity to trade in and out of positions
39
$0
$10
$20
$30
$40
$50
$60
$70
1994 1995 1996 1997 1998 1999-1H
$ in
bill
ions
Par Distressed
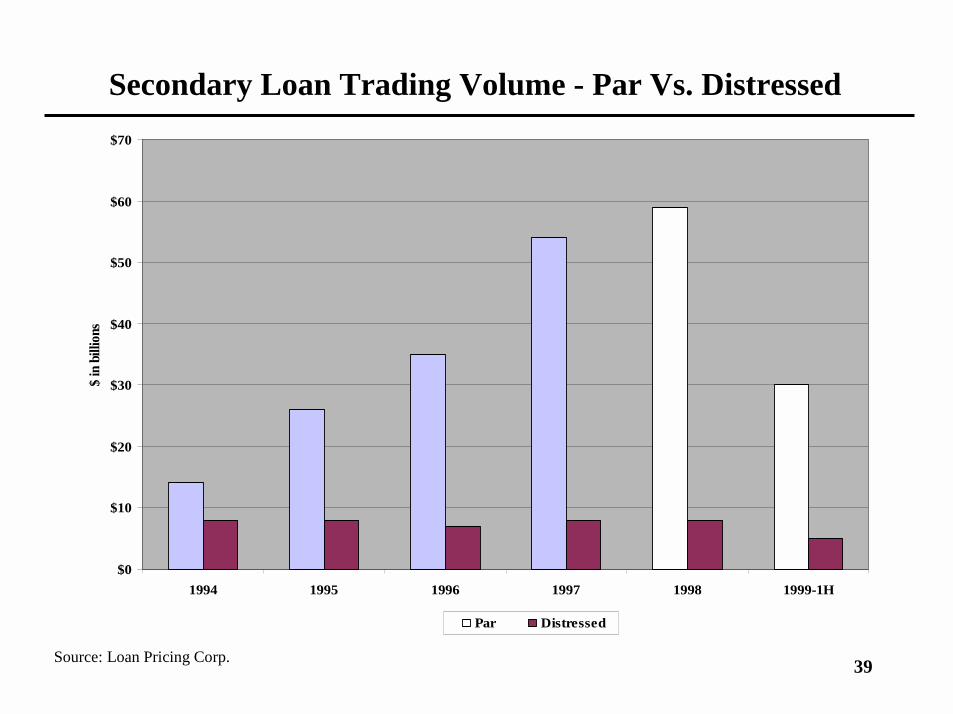
Secondary Loan Trading Volume - Par Vs. Distressed
Source: Loan Pricing Corp.
40
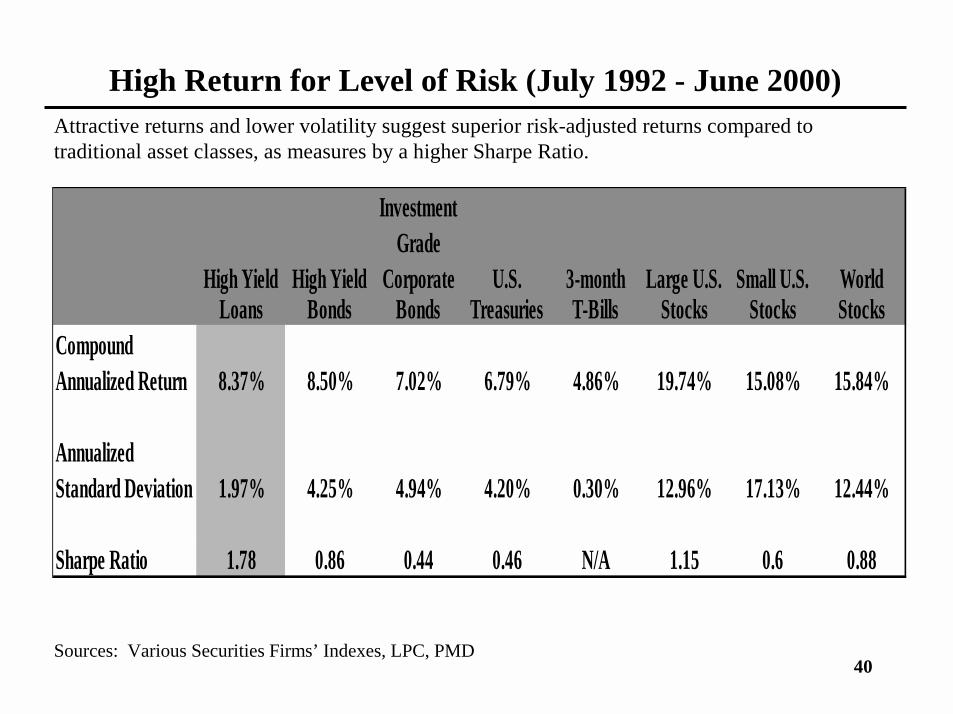
High Return for Level of Risk (July 1992 - June 2000)Attractive returns and lower volatility suggest superior risk-adjusted returns compared to traditional asset classes, as measures by a higher Sharpe Ratio.
Sources: Various Securities Firms’ Indexes, LPC, PMD
High Yield High Yield
Investment Grade
Corporate U.S. 3-month Large U.S. Small U.S. World Loans Bonds Bonds Treasuries T-Bills Stocks Stocks Stocks
CompoundAnnualized Return 8.37% 8.50% 7.02% 6.79% 4.86% 19.74% 15.08% 15.84%
AnnualizedStandard Deviation 1.97% 4.25% 4.94% 4.20% 0.30% 12.96% 17.13% 12.44%
Sharpe Ratio 1.78 0.86 0.44 0.46 N/A 1.15 0.6 0.88

41
43.6%
32.7%
12.9%
6.4%
1.4%3.0%
0%
10%
20%
30%
40%
50%
Acquisition Refinancing LBO Expansion Exit Financing Other
Perc
ent
New-Issue Loan Volume by Deal Purpose*
*As of June 30, 2000
42
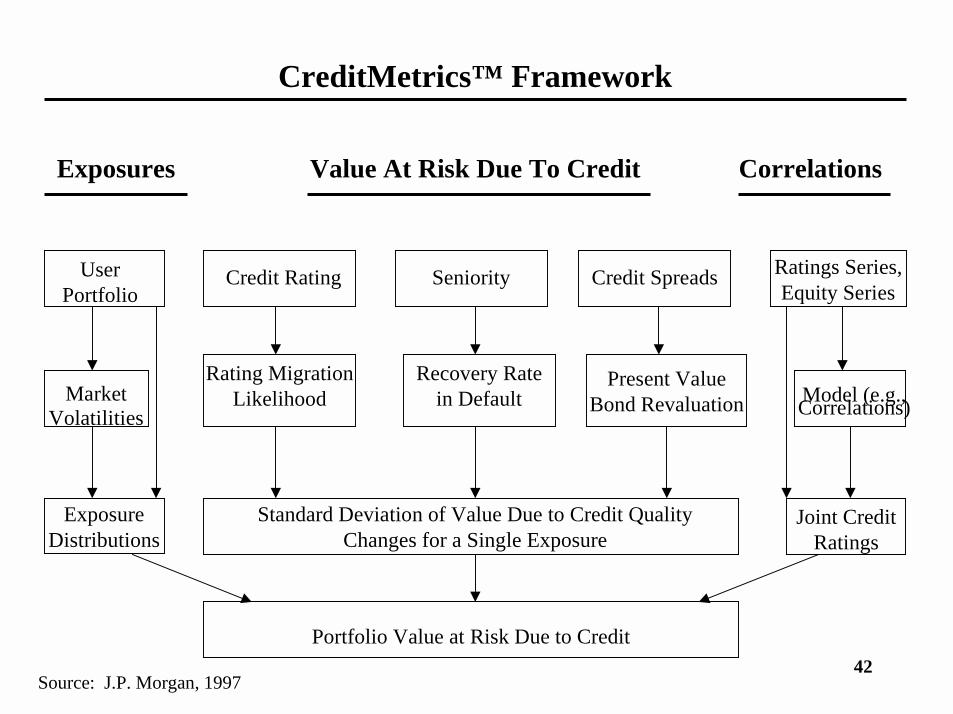
CreditMetrics™ Framework
Exposures Value At Risk Due To Credit Correlations
User Portfolio
MarketVolatilities
ExposureDistributions
Credit Rating Seniority Credit Spreads
Rating Migration Likelihood
Recovery Rate in Default
Present Value Bond Revaluation
Ratings Series,Equity Series
Model (e.g., Correlations)
Joint Credit Ratings
Standard Deviation of Value Due to Credit Quality Changes for a Single Exposure
Portfolio Value at Risk Due to Credit
Source: J.P. Morgan, 1997
43
Credit Risk Measurement Tools
• JP Morgan’s CreditMetrics™
• CSFP’s CreditRisk+™
• KMV’s Credit Monitor™
• McKinsey’s CreditPortfolio View™
• Others: Algorithmics, Kamakura, Consulting Companies
44
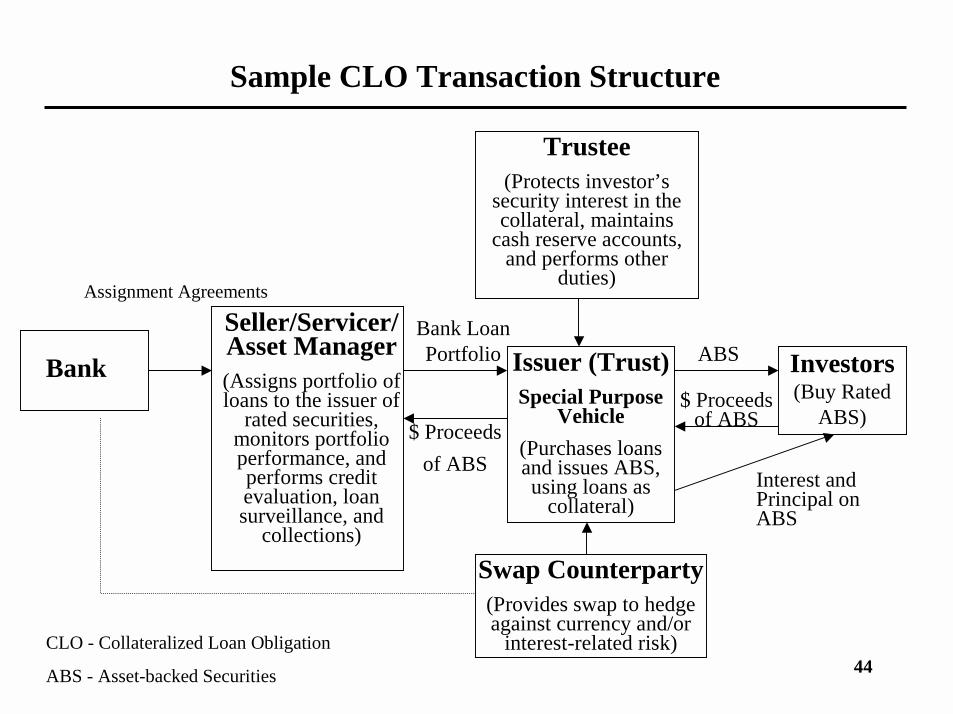
Sample CLO Transaction Structure
Bank Investors(Buy Rated
ABS)
Trustee(Protects investor’s
security interest in the collateral, maintains
cash reserve accounts, and performs other
duties)
Issuer (Trust)Special Purpose
Vehicle(Purchases loans and issues ABS, using loans as
collateral)
Swap Counterparty(Provides swap to hedge against currency and/or
interest-related risk)
Seller/Servicer/Asset Manager(Assigns portfolio of loans to the issuer of
rated securities, monitors portfolio performance, and performs credit evaluation, loan surveillance, and
collections)
Assignment Agreements
Bank Loan Portfolio ABS
$ Proceeds of ABS
$ Proceeds of ABS
Interest and Principal on ABS
CLO - Collateralized Loan Obligation
ABS - Asset-backed Securities
45
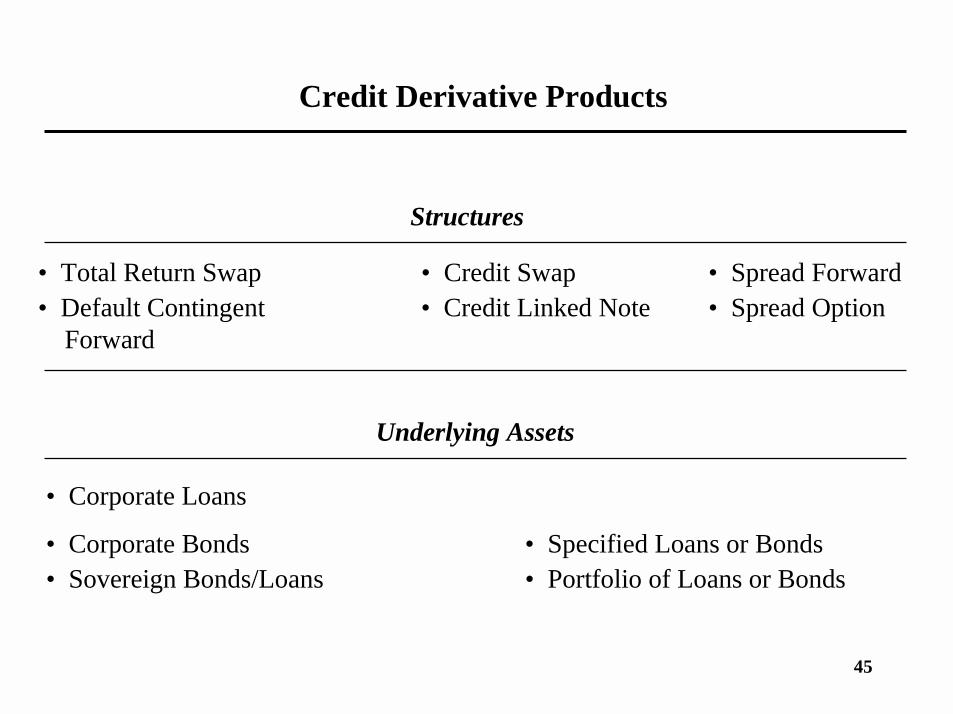
Credit Derivative Products
Structures
• Total Return Swap • Credit Swap • Spread Forward• Default Contingent • Credit Linked Note • Spread Option
Forward
Underlying Assets
• Corporate Loans
• Corporate Bonds • Specified Loans or Bonds• Sovereign Bonds/Loans • Portfolio of Loans or Bonds
46
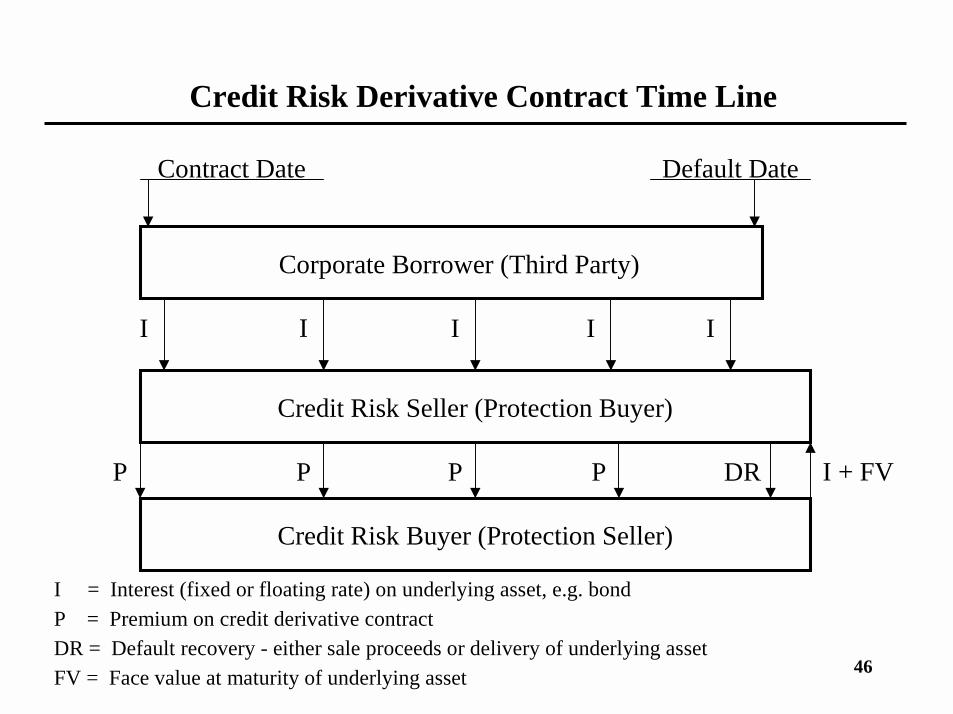
Credit Risk Derivative Contract Time Line
Contract Date Default Date
Corporate Borrower (Third Party)
Credit Risk Seller (Protection Buyer)
Credit Risk Buyer (Protection Seller)
I I I I I
P P P P DR I + FV
I = Interest (fixed or floating rate) on underlying asset, e.g. bondP = Premium on credit derivative contractDR = Default recovery - either sale proceeds or delivery of underlying assetFV = Face value at maturity of underlying asset
47
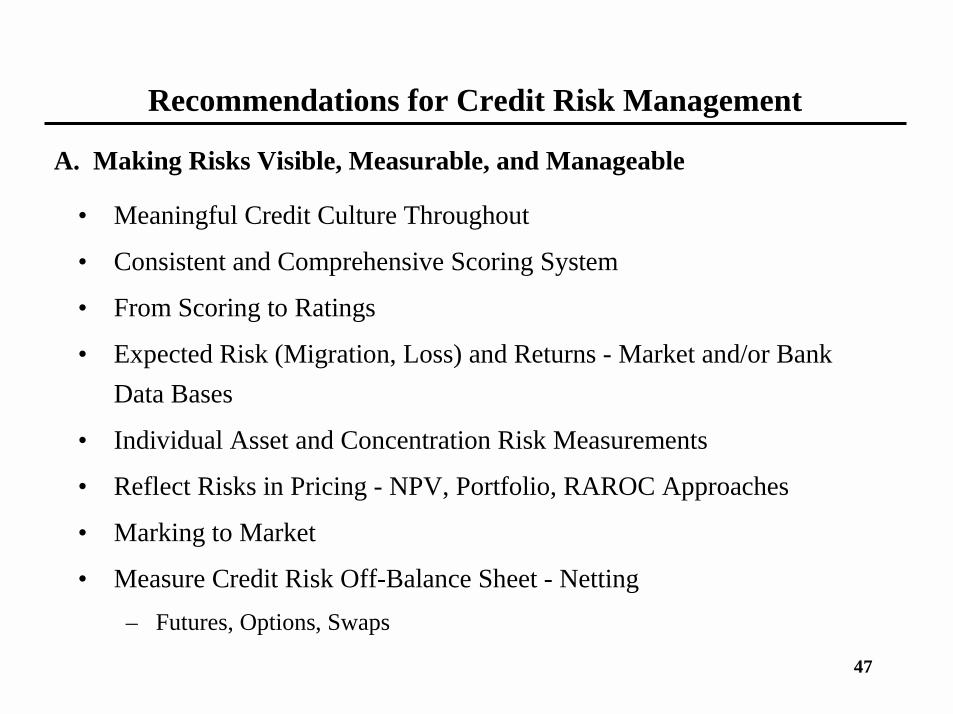
Recommendations for Credit Risk Management
• Meaningful Credit Culture Throughout
• Consistent and Comprehensive Scoring System
• From Scoring to Ratings
• Expected Risk (Migration, Loss) and Returns - Market and/or Bank Data Bases
• Individual Asset and Concentration Risk Measurements
• Reflect Risks in Pricing - NPV, Portfolio, RAROC Approaches
• Marking to Market
• Measure Credit Risk Off-Balance Sheet - Netting– Futures, Options, Swaps
A. Making Risks Visible, Measurable, and Manageable

48
Recommendations for Credit Risk Management(continued)
• Centralized vs. Decentralized
• Specialized Credit and Underwriting Skills vs. Local Knowledge
• Establishing an Independent Workout Function
• Managing Good vs. Bad Loans
• To Loan Sale or Not
• Credit Derivatives
• Credit Risk of Derivatives
B. Organizational Strategic Issues