challenges facing chicken production in katulani …
TRANSCRIPT

CHALLENGES FACING CHICKEN PRODUCTION IN KATULANI
DISTRICT, KITUI COUNTY
BY
MWOBOBIA ROYFORD MURANGIRI, BVM
J56/KIT/20137/2012
A thesis submitted in partial fulfilment of the requirements for the Degree of
Master of Science in Livestock Production Systems, South Eastern Kenya
University
January 2016

II
DECLARATION
I Mwobobia Royford Murangiri declare that this thesis is my original work and has
not been presented for the award of a degree in any other university or any other
award
Mwobobia Royford Murangiri
J56/KIT/20137/2012
Signature.............................................. Date............................................
We confirm that the work reported in this thesis was carried out by the candidate
under our supervision and has been submitted with our approval as university
supervisors.
Prof. Titus I. Kanui. BVM, PhD
Department of Range and Wildlife Sciences
School of Agriculture and Veterinary Sciences
South Eastern Kenya University
Sign......................................... Date.............................
Dr. Dorothy A. Amwata. B.Sc. M.Sc., PhD
Department of Range and Wildlife Sciences
School of Agriculture and Veterinary Sciences
South Eastern Kenya University
Sign........................................ Date..............................

III
DEDICATION
This work has been dedicated to my wife Joyce Wanja Irware for her support and
encouragement throughout the study period.

IV
ACKNOWLEDGMENTS
My greatest appreciation and gratitude goes to the Almighty God, who by his mercies
and grace made my schooling possible. Special thanks also go to my supervisors Dr.
Dorothy A. Amwata and Professor Titus Kanui for their contribution in my research
project. Their valuable guidance, support and dedication have made it possible for me
to accomplish this study. I would like to extend my thanks to the staff at the Ministry
of Agriculture, Livestock and Fisheries (MOALF), Department of Registration of
Persons and Chiefs in Katulani District. I also wish to acknowledge the hospitality
and cooperation of farmers and dedication of the enumerators who supported this
study. My sincere heartfelt thanks go to all friends and loved ones who saw the
potential in me and encouraged me to go through this programme.

V
ABSTRACT The poultry industry in Kenya is a key contributor to the local economy as well as
food security and income with over 90% of households owning a flock of chicken
(Kingori et al., 2010). The main objective of this study was to investigate the
challenges faced by rural and peri urban chicken farmers in Katulani District, Kitui
County. The study focussed on understanding the challenges affecting chicken
farming, factors affecting technology adoption, access to institutional support
services, choice of chicken health management strategies, flock structure and
dynamics, in order to devise innovative approaches for promoting chicken industry in
the study area. Data were collected through questionnaires, personal observations,
photography and interviews on flock size, flock species and purpose, access to credit
facilities and trainings. For this study, simple random sampling technique was used to
select the respondents and data collected was analysed using Statistical Package for
Social Sciences software. Over 80% of households kept indigenous chicken under
free range using family labour, which were mainly reared for income and subsistence.
Household size had influence on flock size with large households keeping larger
flocks. There were more female headed households (59.1%) keeping chicken in the
study area as compared to the males (40.1%). However, male headed households kept
larger flock sizes in both study sites. Education levels had influence on flock size with
peri urban areas having higher education levels (average of 10 years studying) and
flock sizes compared to the rural households (average of 8 years studying). There
were high levels of unemployment in both areas with those who were employed
having higher flock sizes. Employment had a significant positive correlation (p<0.05,
r=0.643) on purchasing power which was the main method of initial poultry
acquisition. Approximately 84.5% of respondents earned their livelihood from mixed
farming as compared to crop farming or livestock keeping in isolation with the
employed having higher monthly incomes than from any farm related activities.
Chicken contribute about 4.18% and 26.8% of total Tropical Livestock Units in rural
and peri urban sites respectively with chicken, hens and pullets dominating the flock
structure since they are mainly retained for production purposes. The cock to hen ratio
was 1:2, i.e. one cock for every two hens. The main opportunities for chicken rearing
in the study area were availability of land, water and labour while the main challenges
were diseases, predators, limited poultry production skills and high cost of
drugs/vaccines. There were low adoption of all chicken rearing technologies in both
rural and peri urban areas; while the latter had higher technology adoption rates. Most
of the farmers reported disease incidences in their farms especially Newcastle (NCD)
and coccidiosis. About 98.6% and 90% of rural and peri urban respondents applied
medicines to manage these diseases with rural farmers mostly using traditional
medicinal products (80%) and peri urban farmers mostly using conventional
medicines (58%). The main traditional medicinal products used were Aloe vera, neem
tree, pepper and goat milk. Healing ability, availability of drugs, culture and cost of
drugs were the main factors guiding the choice of drugs used by farmers. Therefore, a
chicken disease control programme specific to the area which is lacking should be put
in place. Also a review of extension models according to farmers needs should be put
in place. Chicken farmers should be encouraged to form farmer groups for ease of
accessing various types of services and bargaining power. Since ethno veterinary
medicine and practice is widespread in this community, there is a need to improve
veterinary services by integrating modern medicine with some of the used ethno
veterinary medicine subject to validation.
VI
TABLE OF CONTENTS
Contents Page
DECLARATION .......................................................................................................... II
DEDICATION ............................................................................................................. III
ACKNOWLEDGMENTS ........................................................................................... IV
ABSTRACT .................................................................................................................. V
TABLE OF CONTENTS ............................................................................................. VI
LIST OF TABLES ....................................................................................................... IX
LIST OF FIGURES ...................................................................................................... X
LIST OF APPENDICES .............................................................................................. XI
ABBREVIATIONS AND ACRONYMS .................................................................. XII
CHAPTER 1: INTRODUCTION .................................................................................. 1
1.1 Background of the Study ................................................................................... 1
1.2 Statement of the Problem and Significance of the Study .................................. 3
1.3 Research Objectives ........................................................................................... 3
1.3.1 General Objective .............................................................................................. 3
1.3.2 Specific Objectives…………………………………...………………………..3
1.4 Research Questions ............................................................................................ 3
1.5 Justification ........................................................................................................ 4
CHAPTER 2: LITERATURE REVIEW ....................................................................... 5
2.1 Background Information .................................................................................... 5
2.2 Chicken Management Interventions and Strategies ........................................... 8
2.2.1 Brooding ............................................................................................................ 9
2.2.2 Shelter ................................................................................................................ 9
2.2.3 Predators ............................................................................................................ 9
2.2.4 Vaccination ...................................................................................................... 10
2.2.5 Feed Supplementation ...................................................................................... 10
2.3 Institutional Support to Farmers ...................................................................... 11
2.3.1 Farmer Groups ................................................................................................. 11
2.3.2 Veterinary Services .......................................................................................... 11
2.3.3 Credit................................................................................................................ 11
2.3.4 Training ............................................................................................................ 12
2.3.5 Marketing ......................................................................................................... 12

VII
2.4 Flock Structure and Dynamics ......................................................................... 12
2.4.1 Flock Structure ................................................................................................. 13
2.4.2 Production System ........................................................................................... 13
2.4.3 Source of Chicks .............................................................................................. 13
2.5 Chicken Production Constraints ...................................................................... 13
2.5.1 Feeds ................................................................................................................ 14
2.5.2 Diseases and Predation .................................................................................... 14
2.5.3 Harsh Environment .......................................................................................... 15
2.6 Awareness of Common Chicken Diseases ...................................................... 15
2.6.1 Metabolic and Nutritional Conditions………………………………………..15
2.6.2 Infectious Diseases........................................................................................... 16
2.6.3 Parasitic Conditions ......................................................................................... 16
2.6.4 Behavioural Diseases ....................................................................................... 16
2.7 Poultry Medications ......................................................................................... 17
CHAPTER 3: RESEARCH METHODOLOGY ......................................................... 20
3.1 Study Area ....................................................................................................... 20
3.2 Target Population ............................................................................................. 21
3.3 Sample Size ...................................................................................................... 21
3.4 Research Design............................................................................................... 22
3.5 Sampling Design .............................................................................................. 22
3.6 Sampling Frame ............................................................................................... 22
3.7 Data Collection ................................................................................................ 22
3.8 Questionnaire Design ....................................................................................... 22
3.9 Data Analysis ................................................................................................... 23
CHAPTER FOUR: RESULTS AND DISCUSSION .................................................. 24
4.1 Introduction ...................................................................................................... 24
4.2 Demographic Characteristics of the Respondents ........................................... 24
4.2.1 Size of Household ............................................................................................ 24
4.2.2 Gender of the Respondent………..…………………………………………..25
4.2.3 Level of Education and Flock Sizes ................................................................. 26
4.2.4: Marital Status of the Respondents ................................................................... 28
4.2.5 Employment Status .......................................................................................... 29
4.2.6 Livelihood and Income Sources....................................................................... 30
VIII
4.3 Flock Structure and Dynamics ......................................................................... 32
4.3.1 Existing Poultry Flock Dynamics .................................................................... 32
4.3.2 Flock Structure ................................................................................................. 34
4.3.2.1 Other Livestock Species Kept .......................................................................... 34
4.3.2.2 Chicken Flocks Composition ........................................................................... 36
4.4 Factors Influencing Chicken Rearing in Katulani District .............................. 38
4.5 Technology and Support Services Adoption ................................................... 41
4.5.1 Farmers’ Adoption of Different Chicken Management Practices ................... 41
4.5.2 Access to Extension Support Services ............................................................. 43
4.5.3 Sources of Chicken Rearing Support Services ................................................ 44
4.5.4 Factors Influencing the Current Adoption of Various Management
Technologies, Innovations and Institutional Support Services in the Study
Area. ................................................................................................................. 45
4.6 Health Management ......................................................................................... 46
4.6.1 Disease Occurrence and Management ............................................................. 46
4.6.2 Factors Influencing Farmers’ Choice of Health Management Strategies ........ 51
CHAPTER 5: CONCLUSION, RECOMMENDATIONS AND FUTURE
RESEARCH AREAS....................................................................................... 54
5.1 Conclusions ...................................................................................................... 54
5.2 Recommendations ............................................................................................ 54
5.3 Future Research Areas ..................................................................................... 55
References ........................................................................................................ 56

IX
LIST OF TABLES
Tables Page
Table 1: Chicken Populations by Country, 000 Head from 2009-2013 ........................ 6
Table 2: Chicken Populations by Type and County. ..................................................... 6
Table 3: Indigenous and Exotic Chicken Distribution in Selected Districts in Kitui .... 8
Table 4: Various Disease Conditions and their Therapeutic Agents ........................... 18
Table 5: Distribution of Flock Size in Relation to Household Size in Rural and Peri
Urban Settings .................................................................................................. 25
Table 6: Distribution of Flock Size in Numbers in Relation to Gender in the Study
Area .................................................................................................................. 26
Table 7: Distribution of Flock Size Based on Education Level in Rural and Peri Urban
Settings ............................................................................................................. 27
Table 8: Distribution of Flock Size Based on Marital Status in Rural and Peri Urban
Areas ................................................................................................................ 28
Table 9: Distribution of Flock Sizes Based on Employment Status in the Study Area
.......................................................................................................................... 30
Table 10: Distribution of Respondents by Livelihood Sources ................................... 30
Table 11: Average Monthly Incomes for the Respondents in Kenyan Shillings ......... 31
Table 12: Summary of some Selected Variables ......................................................... 32
Table 13: Distribution of Livestock in TLU in the Study Area ................................... 35
Table 14: Chicken Flock Composition in the Study Area ........................................... 36
Table 15: Distribution of Chicken Flocks in the Study Area ....................................... 37
Table 16: Opportunities and Challenges of Chicken Rearing in Rural and Peri Urban
Areas ................................................................................................................ 39
Table 17: Adoption Rates of Various Poultry Management Technologies ................. 42
Table 18: Sources of Support Services ........................................................................ 44
Table 19: Disease Occurrence and Management in the Study Area ............................ 46
Table 20: Traditional Practices in Chicken Health Management ................................ 48
Table 21: Factors Influencing Choice of Medication .................................................. 51
Table 22: Chicken Farmers Support Needs ................................................................. 52

X
LIST OF FIGURES
Figure Page
Figure 1: Location of Katulani District within Kitui County. ..................................... 20
Figure 2 and 3: Indigenous Chicken Under Free Range .............................................. 33
Figure 4: Distribution of Livestock in the Study Area ................................................ 34
Figure 5 And 6: Above Ground Chicken Houses as an Innovative way used by
Farmers to Protect Chicken. …………………………………...……………42
Figures 7 and 8: Example of Supplementation mainly Practiced in the Study Area
Using Left Over’s and Mostly Thrown on the Ground.................................... 43
Figure 9: Factors Influencing Adoption Of Chicken Rearing Technologies and Access
to Institutional Support Services. ..................................................................... 45
Figure 10: Recept acle Placed Within the Compound to Administer Drinking Water to
Free Range Chickens in Mavindini Village, Kitui County. ............................. 50

XI
LIST OF APPENDICES
Appendices ................................................................................................................... 62
Appendix 1: Introductory Letter .................................................................................. 62
Appendix 2: Questionnaire .......................................................................................... 63

XII
ABBREVIATIONS AND ACRONYMS
AHA Animal Health Assistant
ANOVA Analysis of Variance
ASALs Arid and Semi-Arid Lands
DF Degrees of Freedom
DFID Department for International Development
DVO District Veterinary Officer
EVM Ethno Veterinary Medicine
FAO Food and Agricultural Organisation
GDP Gross Domestic Product
H1N1 Influenza A Virus Subtype
HPAI Highly Pathogenic Avian Influenza
IFPRI International Food Policy Research Institute
KARI Kenya Agricultural Research Institute
KNBS Kenya National Bureau of Statistics
NGO Non-Governmental Organisation
OIE Office International des Epizooties
SPS Sanitary and Phytosanitary Agreement of the World Trade
Organisation
SPSS Statistical Package for Social Scientist
TLU Tropical Livestock Unit
WTO World Trade Organisation
1
CHAPTER 1: INTRODUCTION
1.1 Background of the Study
Agriculture contributes about to 26% of annual gross domestic product (GDP) in
Kenya with poultry contributing 30% of the agricultural GDP (FAO, 2008; GOK,
2010). Majority of the rural populations in the developing world keep a flock of
poultry either in free range or confined system (FAO, 2009; IFPRI, 2010). Chicken
(Gallus domesticus) dominates most of the rural areas in the developing world (FAO,
2009) with 80% and 20% of chickens in Kenya being of indigenous and exotic types
respectively (GOK, 2009). Kitui County constitutes 2.76% of the total Kenyan
population of indigenous chickens (Table 2). Other poultry species include ducks,
geese, pigeons and guinea fowls.
This study focussed on chicken rearing because of their resilience to harsh climate,
need for less space and they are the most preferred and widely kept by the majority of
Kenyan population. Therefore they form an important component of rural livelihoods.
In Kenya, indigenous chicken flocks were estimated at about 25.7 million (GOK,
2009) and are kept by about 90% of the population in the rural areas in small flock of
up to 30 birds mainly under free range system (Kingori et al., 2010; Kirwa et al.,
2010). Chicken are family owned and managed mostly by women and children (FAO,
2009). Their products are used for home consumption, as gifts, religious purposes or
are sold to earn some income to buy basic household food items (FAO, 2009). With
the rapidly growing human populations, demand for high quality food especially
protein; improving income levels and standards of living have all created a high
demand for chicken products.
Despite the growing demand, chicken face several challenges namely; 1) production
related which include diseases, predators, theft, harsh environment, lack of and/or
inadequate production skills, poor nutrition, high feed costs, flock sizes and marketing
(KARI, 2006; Kirwa et al., 2010; Ochieng et al., 2013); 2) Adoption of various
management interventions like feed supplementation, vaccination, brooding, housing
and labour (Ochieng et al., 2013). For example, under free range production system,
which is commonly practised in Kitui County, chicken are rarely vaccinated or treated
against diseases and parasites (FAO, 2009). Besides, different poultry species are kept
2
together hence failure to take into consideration the bird specific nutrition requirement
resulting in low production. Under free range system, chicken are left to scavenge and
may be easily infected and also spread the disease to the rest of the flock (FAO, 2009;
3) Institutional support to farmers like limited access to: extension services, veterinary
services, credit facilities, trainings, access to markets and market information and
group memberships (Ochieng et al., 2013).
(4) Low awareness levels among chicken farmers on common poultry diseases
especially potential zoonotic diseases and more so the emerging diseases like Highly
Pathogenic Avian Influenza (HPAI), (FAO, 2009). A study done in Kenya by FAO,
(2008) had recommended that public education and training on safe poultry
production, good bio-security and management was critical for rural areas. However,
limited studies have been conducted to establish these challenges among chicken
farmers in Kitui County. Since chicken diseases are a constraint to production in
terms of cost and time, it is important to understand how farmers respond to these
diseases. Smallholder chicken farmers under free range production system respond
differently in times of disease occurrence; they may choose to; do nothing, use ethno-
veterinary medicine, use modern (conventional) medicine and/or human medicine
(Mapiye and Sibanda, 2005).
Failure by farmers to respond to disease incidences was attributed to inadequate cash
to purchase veterinary drugs and shortage of veterinary extension services, while
traditional medicine are often used and preferred due to their low cost, ease of
application and local availability. The type of medication used is important since
conventional medicine have been tested and evaluated for efficacy and side effects
while traditional medicine are centred on activating the body’s own natural healing
ability but have not been tested or evaluated (Mapiye and Sibanda, 2005). This
threatens the quality of chicken meat and eggs, thus a health hazard.

3
1.2 Statement of the Problem and Significance of the Study
This study focuses on chicken rearing since they are kept by about 90% of Kenyan
population (Kingori et al., 2010). They play a great role socially, economically and
nutritionally to chicken farming households. Despite this potential, several challenges
face the sector and continue to reduce these benefits through low production levels
and subsequent economic losses. Chicken are said to be appropriate in rural areas
because they require minimum inputs which rural farmers can easily afford leading to
a significant contribution to food security and poverty reduction. Therefore, the
significance of this study is to shed light on challenges facing chicken farmers and
propose innovative approaches to address these challenges and maximise
opportunities for enhanced productivity and improved livelihoods.
1.3 Research Objectives
1.3.1 General Objective
To identify challenges and opportunities facing chicken production and management
in Katulani District, Kitui County.
1.3.2 Specific Objectives
i. To establish and prioritize factors influencing chicken rearing in Katulani
District, Kitui County.
ii. To establish factors influencing the adoption of various chicken management
technologies and innovations in Katulani District, Kitui County.
iii. To determine the existing chicken production systems including distribution
and flock size among farmers in Katulani District, Kitui County.
iv. To determine factors influencing farmer’s choice of chicken health
management strategies (traditional and conventional) in Katulani District,
Kitui County.
1.4 Research Questions
i. What factors influence chicken rearing in Katulani District, Kitui County?
ii. What factors influence the adoption of various chicken management
technologies and innovations in Katulani District, Kitui County?

4
iii. What are the existing chicken production systems in terms of distribution and
flock size in Katulani District, Kitui County?
iv. What factors influence farmer’s choice of health management strategies for
chicken diseases?
1.5 Justification
Several challenges facing farmers result in reduction in chicken numbers productivity
in a household and therefore impact on the food security of the farmer (FAO, 2008).
This is a major setback in increasing food production and improving the livelihood of
Kenyans as the human population increases. The rapidly growing human population,
income levels and diet choices (white meat) have led to increased demand for chicken
and its products. Increased human population has also led to land subdivision, chicken
are therefore an ideal entry point since they require less space.
Small holder chicken rearing is an ideal entry point as a potential tool for poverty
reduction, improvement of household food security and nutrition when adopted as an
alternative land use option. In addition, the study area experiences perennial droughts
and this makes the area unsuitable for other agricultural activities especially the ones
dependent on rain. This makes chicken rearing an alternative since it is not climate
dependent and chicken can tolerate harsh weather. Besides, over 90% of rural
households own a flock of poultry, making poultry integral part of household income.
It is therefore important that challenges and opportunities facing farmers are
understood and information generated to guide policy formulation, service provision
and create innovative approaches for solving the challenges and maximising the
opportunities.

5
CHAPTER 2: LITERATURE REVIEW
2.1 Background Information
The word poultry is applicable to bird species raised in most countries including
Kenya for meat and eggs (Oyeyinka et al., 2012). They include chicken, ducks,
turkeys, pigeons, ostriches, guinea fowls and quails. The main genotypes of
commercial layers are Shaver Star cross, Isa Brown and Ross, while commercial
broiler genotypes include Arbor Acres, Hybro, Cobb (United Kingdom) and Hype co
(Holland). Indigenous chicken genotypes include the Rhode Island Red, Light Sussex,
New Hampshire Red, Black Australorps, White Leghorns, Plymouth Rock, Barred
Rock and Buff Rock (FAO, 2008).
There are two types of turkeys; local small bronze and buff type and the commercial
large white and buff types. Ducks are of the Muscovy type while guinea fowls are the
helmeted type (FAO, 2008). The poultry sector employs people either directly in
production and marketing or indirectly through linkages with suppliers of such inputs
as day‐old chicks, feed and veterinary services (Omiti and Okuthe, 2008). The sector
also contributes to food security throughout the developing countries by diversifying
and improving incomes, food quality, energy and fertilizer in over 80% of rural
households (FAO, 2004). Poultry also play important social and cultural roles among
communities (FAO, 2009). Of all the poultry classes, chicken (Gallus domesticus)
dominates the smallholder poultry production systems in Kenya with a total
population of 31.8 million including exotic and indigenous breeds (GOK, 2009).
Indigenous chicken are mainly reared in the rural areas while commercial birds
(broilers and layers) are kept in urban or peri urban areas of main centers, such as
Nairobi, Kisumu, Nakuru and Mombasa where access to markets is guaranteed
(Omiti and Okuthe, 2008; FAO, 2008). Chicken are easier and cheaper to start rearing
than other types of livestock which require a large start-up capital more so in the rural
areas where chicken are reared under freehold , they scavenge for food during the day
and are housed in the night to escape predators and harsh weather. This is therefore a
low input enterprise for the farmers. Therefore anything that impacts adversely on the
chicken affects the livelihood of the farmers and consequently food security (FAO,
2008). Table 1 shows chicken populations across East African Community (EAC).

6
Table 1: Chicken populations by country, 000 head from 2009-2013
Livestock Partner state 2009 2010 2011 2012 2013
Chicken Burundi 1,591 1,719 1,857 2449 2571
Tanzania 58,000 58,000 42,667 42,667 66,000
Uganda 39,290 43,201 47,520 36,956 38,064
Kenya 31,800 31,800 31,800 31,800 31,800
Rwanda 2,848 4,081 4,420 4,688 4,803
Totals 132,796 135,314 121,649 118,560 143,238
Source: East African Community portal (www.eac.int/): accessed on 27th June 2015.
From Table 1 above, chicken population across East Africa Region had a zigzag trend
from 2009 to 2013. In Burundi and Rwanda, the chicken population was increasing
throughout the period. In Kenya, the population was constant while in Tanzania and
Uganda the population had a zigzag trend. Chicken contribute significantly in the
rural trade, welfare and food security especially in small holder farms where an
average household keeps 13 birds per flock in Kenya (FAO, 2008).
Table 2: Chicken populations by type and County
S/No County Indigenous chicken Commercial chicken
Population National % Population National %
1 Baringo 392,298 1.52 38,152 0.63
2 Bomet 694,599 2.7 39,422 0.65
3 Bungoma 1,192,446 4.63 63,394 1.04
4 Busia 869,695 3.38 42,799 0.7
5 ElgeyoMarakwet 309,633 1.2 28,744 0.47
6 Embu 436,899 1.7 67,892 1.12
7 Garrisa 82,127 0.32 22,168 0.37
8 Homabay 1,094,776 4.25 55,801 18.03
9 Isiolo 35,137 0.14 6,652 0.11
10 Kajiado 267,913 1.04 276,291 4.55
11 Kakamega 1,604,159 6.23 120,012 1.98
12 Kericho 409,727 1.6 43,810 0.72
13 Kiambu 801,072 3.11 1,686,565 27.78
14 Kilifi 655266 2.54 176740 2.91
15 Kirinyaga 465,455 1.8 82,458 1.36
16 Kisii 1,026,431 3.99 123,760 2.04
17 Kisumu 852,495 3.31 127,464 2.1

7
18 Kitui 711,182 2.76 44,238 0.73
19 Kwale 433,827 1.68 98,220 1.62
20 Laikipia 318,125 1.24 41,847 0.69
21 Lamu 87,951 0.34 7,636 0.13
22 Machakos 862,592 3.35 182,952 3.01
23 Makueni 762,778 2.96 46,027 0.76
24 Mandera 200,662 0.78 27,008 0.44
25 Marsabit 46,308 1.8 4,382 0.07
26 Meru 111,7305 4.34 186,977 3.08
27 Migori 1,285,736 5 88,182 1.45
28 Mombasa 101,418 0.39 189,427 3.12
29 Muranga 682,752 2.65 515,090 8.48
30 Nairobi 279,397 1.08 342,788 5.65
31 Nakuru 1,102,321 4.28 428,484 7.06
32 Nandi 600,613 2.3 41,846 0.69
33 Narok 561,319 2.18 37,523 0.62
34 Nyamira 351,793 1.37 53,081 0.87
35 Nyandarua 576,870 2.24 53,344 0.88
36 Nyeri 513,637 2 152,380 2.51
37 Samburu 37,749 0.15 4,962 0.08
38 Siaya 994,247 3.86 52,768 0.87
39 TaitaTaveta 212,129 0.82 38,235 0.63
40 Tanariver 109,105 0.42 11,606 0.19
41 TharakaNithi 135,417 0.53 5,692 0.09
42 Trans Nzoia 630,615 2.45 161,455 2.66
43 Turkana 165,349 0.64 15,444 0.25
44 UasinGishu 664,005 2.58 159,333 2.62
45 Vihiga 478,051 1.86 33,772 0.56
46 Wajir 140,110 0.54 22,137 0.36
47 West Pokot 402,996 1.56 22,052 0.36
TOTAL 25,756,487 100 % 6,071,042 100%
Source: GOK (2009) Kenya National Bureau of Statistics 2009 Census
From Table 2 above, total chicken population was 31,827,529; Indigenous chicken
population was 25,756,487 representing 80.9% of total population. While commercial
chicken population was 6,071,042 representing 19.1% of total population. Indigenous
chicken are the majority as they are cheap, easy to rear and manage and this has led to
a lot of interest in their production at village level as well as peri urban and urban
areas throughout the developing world (FAO, 2009). From the table, Kitui County
contributes to 2.76% and 0.73% of the national indigenous and exotic chicken

8
population respectively. Kitui County also ranks number 13 and 26 nationally in
populations of indigenous and commercial chicken respectively.
Table 3: Indigenous and exotic chicken distribution in selected districts in Kitui
District Indigenous chicken Exotic chicken
Kyuso 78526(10.87)* 3371(8.22)
Kitui 370942(52.17) 31868(71.23)
Mwingi 144292(20.29) 5249(12.33)
Mutomo 117422(16.67) 3750(8.22)
TOTAL 711,182(100) 44,238(100)
*Figures in brackets are in percentages
Source: (GOK, 2009) Kenya National Bureau of Statistics 2009 census
Table 3 indicates indigenous and exotic chicken population distribution among
various districts in Kitui County. Kitui District (where the study area falls) constituted
52.17% and 71.23% of Kitui County indigenous and exotic chicken population
respectively. This is higher compared to all other districts in the County. Kitui is a
semi-arid area where crop farming is unsustainable due to unreliable and insufficient
rainfall leading to recurrent crop failure. In addition, the dry weather in unable to
support other agricultural activities requiring sufficient rains. Therefore chicken
provide an alternative land use option since they are more resilient to climate
variability. This information supports FAO (2008) which noted that the arid and semi-
arid and neighbouring districts of Kitui, Makueni, Mwingi and Machakos have the
highest concentration of indigenous chicken.
2.2 Chicken Management Interventions and Strategies
Management interventions are technologies and innovations used by chicken farmers
to improve the production and profitability of their chicken enterprises. They include
proper housing, feed supplementation, vaccination; brooding and predator control
(Ochieng et al., 2013). These technologies influence the level of output, product
quality, employment, trade and benefits (Teklewold et al., 2006), thereby increasing
the income generating capacities of the farmers. The technologies also allow farmers

9
to rear genetically improved chicken which are generally more productive and also
use locally available feed resources to formulate diets that are nutritionally balanced.
2.2.1 Brooding
A brooder is where young day old chicks are put to start growing. It should be
warmed to between 38-40 degrees Celsius using charcoal burners or infra-red bulbs to
provide heat to chicks, since at that age the chicks are not able to regulate their own
body temperature due to undeveloped feather coat. The brooder should be heated
before the arrival of the chicks (Maina, 2008). On arrival the chicks should be
provided with a mixture of glucose and vitamins dissolved in warm water to revitalize
them in case they are tired. Feed should be sprinkled on the surface of clean
newspapers to stimulate feeding. After three days the chicks should be introduced to
feeding from feeders. Few drops of liquid paraffin should also be added in drinking
water for the first few days to aid in defecation (Maina, 2008).
2.2.2 Shelter
Chickens need a good shelter; therefore they should be housed to protect them from
bad weather, predators and thieves. A shelter allows farmers to inspect and handle
chicken to see if any is sick or needs attention and collects eggs from the same place.
It should be built on a shady, dry, safe place and the size depends on the number of
chicken kept. It should have a secure door, allow plenty of light and air movement
and designed to put into consideration the needs of the chicken and the people
operating, it should be labour efficient and reasonable in investment. Chicken houses
can either be semi intensive, deep litter, slatted or wire floor, a combination of slated
and deep litter and cage or battery system. There should be perches, feeders, drinkers
and the house always kept clean (FAO, 2008; FAO, 2009).
2.2.3 Predators
Predation is more common in free range chicken due to tendency of farmers to let
their chicks scavenge with the mother hen from the first day due to increased feed
cost in confined systems. With predators such as snakes, rats, dogs, cats and birds of
prey as the main causes of losses especially in young birds, controlling them either by

10
housing, trapping, hunting or using repellents are technologies farmers have adopted
(Berg, 2001).
2.2.4 Vaccination
A vaccine is a biological preparation that provides active acquired immunity to a
particular disease. Active immunization involves administration of antigen(s) derived
from an infectious agent so that the chicken gets an acquired immune response and
achieves resistance to that agent. When properly used, vaccines are highly effective in
controlling infectious chicken diseases. In chicken, entire flock vaccination is
encouraged as it results in increased resistance of a flock due to presence of immunity
within the group, thus reduces the probability of a susceptible chicken being infected.
As a result, spread of infectious disease is slowed or blocked (Merck’s manual, 2006).
Farmers should therefore adopt this disease control strategy, more so for Newcastle
Disease (NCD) which kills on average 70-80% of unvaccinated free ranging chicken.
The reason for low poultry vaccination rates in most developing countries is because
of the following reasons; majority are reared under free range and therefore difficult
to group together an adequate (large) number in order to obtain an efficient
vaccination rate, raising chicken of varying ages together therefore requiring different
vaccine regimes and the need to maintain a cold chain for vaccine storage throughout
(Branckaert et al., 2000).
2.2.5 Feed Supplementation
Feed supplementation is necessary to allow for maximum production of meat and
eggs from chicken. This is especially in free range chickens which usually starve out
during the dry season as a result of diminishing feed resource base (Scavengeable
Feed Resource Base). Inadequate feed and water also reduces the chicken’s resistance
to diseases and parasites. The best way to supplement chicken is by use of local feed
resources; also pre-mixed supplementary feed from the market can be used (FAO,
2009).
11
2.3 Institutional Support to Farmers
Institutional support to chicken farmers include extension and veterinary services,
credit facilities, training, access to market, market information and group
membership.
2.3.1 Farmer Groups
Membership to farmer groups facilitate easier access to inputs like feed supplements,
improved chicks, drugs and vaccines, technical advice, credit, training, transportation
and marketing of chicken products (Branckaert et al., 2000). Organising poultry
farmers into groups has not been easy especially among free range chicken keepers
since flock sizes are small and chicken are maintained with minimal labour and
capital inputs. This means that this farming system is considered by farmers as
secondary occupation compared with other activities like crops farming and trade.
Nevertheless, it is essential that farmers are encouraged to initiate chicken farming
using medium sized flocks (Branckaert et al., 2000).
2.3.2 Veterinary Services
Veterinary care especially to chicks is one of the most important factors affecting
chicken production; it helps in detecting and treatment of any kind of disease at an
early stage. To protect and increase the immunity of chicken, they should be
vaccinated against all locally important diseases at the recommended periods (Grepay,
2009).
2.3.3 Credit
Limited access to credit is universally indicated as a key problem for chicken farmers
in Kenya. This affects technology choice by limiting the number of alternative
technologies and innovations considered for adoption, it forces farmers to rely on self-
financing or borrowing from friends or relatives. Besides lack of access to long term
credit also forces farmers to rely on high cost short term finance. In addition, other
financial challenges facing farmers in Kenya include the high cost of credit and high
bank transaction costs (Munyaka, 2010).
12
2.3.4 Training
Education and relevant skills are important in running any business enterprise.
Chicken farmers should therefore be trained in the following areas i.e. disease and
predator control, proper housing, use of equipment, entrepreneurship, feeding, value
addition, record keeping, budgeting, genetic improvement, marketing and the basic
understanding of the chicken anatomy and physiology. The trainings should
preferably be conducted on-farm. In addition, local craftsmen should be trained to
manufacture small equipment like feeders and drinkers (Branckaert et al., 2000). The
trainings should be conducted by qualified and experienced personnel such as
extension staff and training institutes taking into consideration household and
community levels (Mapiye et al., 2008).
2.3.5 Marketing
Access to market and market information also poses a challenge to farmers especially
those in rural areas. The market prices are mostly demand driven with local purchases
and middlemen being the main outlets, mainly for local consumption or restocking.
Pricing mechanism is on bargain basis and prices are based on size and condition of
the bird. Bird size is used to estimate weight with middlemen using hand weighing
estimation to exploit producers (Danda et al., 2010).
Despite the availability and possibility of accessing national and international
databases, lack of sufficient market information has been a setback to chicken farmers
with most farmers relying on private or even physical contacts for market related
information. This is mostly attributed to poor telecommunication infrastructure in
rural areas (Munyaka, 2010).
2.4 Flock Structure and Dynamics
Flock structure entails number of chicks, pullets, hens, cockerels, cocks and the entire
flock size. Flock dynamics includes type of production system, source of chicks,
purpose of keeping chicken and source of initial breeding stock.
13
2.4.1 Flock Structure
For the success of a chicken rearing enterprise, it is necessary to use stock proven to
be of good quality and of the appropriate genotype for the product to be produced.
The first decision is to choose meat type for meat production and egg type for egg
production. Having made the decision, the next step is to analyse the production
system and market to select a genotype that suits the production system and produces
a product suitable for the market. The size of the flock should always match the size
of the house, the amount of feed one can produce or afford to buy, and the feed
resources in the environment (scavenging feed resource base). The surplus cocks
should be sold to prevent them from eating the scarce feed resources, to increase
efficiency as well as prevent them from fighting and stressing the hens (FAO, 2009).
2.4.2 Production System
Poultry production systems are usually categorised into four types; 1) the large scale
integrated commercial system common in breeding flocks; 2) the large scale
producing system with over 10,000 chickens; 3) the small scale commercial system
with hybrid chickens referred as small scale confined system and finally; 4) the
backyard production system with indigenous chicken commonly referred to as
traditional free range (FAO, 2009; Moreki, 2010).
2.4.3 Source of Chicks
Chicks can either be sourced from hybrid strains in well managed hatcheries and
parent stock or from indigenous/ local breeds. Local breeds are usually selected for
their hardiness and sometimes meat production but not for egg production, their hens
are good hatchers but poor layers. Comparatively, hybrid strains are more productive
and suitable for more intensive poultry production system (Branckaert et al., 2000).
2.5 Chicken Production Constraints
The chicken production constraints include use of poor quality and high cost feed
rations, lack of disease and predator control, harsh environment and limited
production skills (Ochieng et al., 2013). Any improvements in these constraints may
lead to sustainable increase in chicken productivity.

14
2.5.1 Feeds
Feed contribute to 70% of total variable cost of chicken rearing and therefore greatly
influencing the economics of chicken production management. It not only affects the
quantity of chicken products but their quality. A proper feeding program should result
in less quantity of feed consumed at an affordable price to give the highest quantity
and quality products hence giving the highest profits. Although each poultry strain
bears its special feed conversion efficiency and characteristics, the right feed is an
important factor to support such efficiency; on the same note, chicken feed differ
depending on the purpose, type and class of chicken kept. For example feed needs of
layers differ with those of broilers (Grepay, 2009). It is recommended that farmers use
locally available feed resources to formulate balanced diets (Branckaert et al., 2000).
Chicken are able to obtain some of their nutrients from insects, worms, and plants
when on pasture, thus reducing feeding costs.
2.5.2 Diseases and Predation
The presence of disease in a chicken flock is reflected by inferior performance. It is
therefore essential that the flock is in good health to achieve their performance
potential. There are three elements of good health management of a chicken flock.
These are: prevention, early recognition and early treatment of the diseases. Disease
prevention is a more economical way of health management than waiting for the early
recognition and treatment (FAO, 2009). A majority of chicken diseases can be
prevented by timely vaccinations. Although it has been difficult to organize
vaccination campaigns covering free range chickens due to the following reasons; the
difficulty in grouping together an adequate (large) group of chicken in order to
achieve an efficient vaccination rate, raising of different aged chicken together and
the requirement to maintain cold chain for proper vaccine storage. Predators should be
controlled by housing, trapping, hunting and use of repellants (Branckaert et al.,
2000).
Generally there are ten simple rules for disease control; (i) Providing the right feed
and clean water, (ii) Shelter built against wind and rain, (iii) Regular house cleaning,
(iv) Providing dry litter, (v) Proper stocking rates, (vi) Separating different chicken
classes based on age and health status, (vii) Vaccination and revaccination if
15
necessary, (viii) Isolation and treatment of the sick (ix) If no medication is available,
the sick should be killed and burned or (x) Buried (FAO, 2009).
2.5.3 Harsh Environment
A harsh environment is defined as one that is outside of the comfort range of chicken
(www.poultryhub.org (2014). In this context high and low temperature, high
humidity, excessively strong wind, inadequate ventilation and/or air movement and
high levels of harmful air pollutants such as ammonia are examples of a harsh
environment. Much effort should be made in designing and building chicken houses
that will permit the regulation of the environment to a significant degree. It is the
responsibility of those in charge and responsible for the day-to-day management of
chicken, that the environment be controlled as efficiently as possible.
To this end, a good knowledge of the different factors that constitute the environment
and how they interact with each other to influence actual conditions in the house and,
more importantly, what measures to be taken to improve the house environment
(www.poultryhub.org (2014). Harsh weather usually results in a huge shortage of
scavengeable feed due to shortage of insects and green material. This makes chicken
to depend on the owner for survival (Petrus et al., 2011).
2.6 Awareness of Common Chicken Diseases
Farmers should be aware of normal chicken behaviour, daily rhythm, natural
incubation and hatching, management of young chicks, housing, hygiene, feeding,
watering and healthcare (FAO, 2009). This allows production to be kept at optimum
levels in line with proper management practices (Kingori et al., 2010). Farmers
should also be aware of common chicken diseases as they cause death, unthriftness
and lowered production. There are four main types of diseases affecting chicken:
metabolic and nutritional diseases; infectious diseases; parasitic diseases; and
behavioural diseases.
16
2.6.1 Metabolic and Nutritional Conditions
Metabolic and nutritional conditions are caused by a disturbance of normal metabolic
functions either through a genetic defect, inadequate or inappropriate nutrition or
impaired nutrient utilisation; an example is rickets and cage layer fatigue.
2.6.2 Infectious Diseases
An infectious disease is any disease caused by invasion of chicken by a pathogen
which subsequently grows and multiplies in the body. Infectious diseases are often
contagious, which means that they can be spread directly or indirectly from one
chicken to another. Examples include avian influenza, fowl cholera (or
Pasteurellosis), fowl pox, infectious bronchitis, infectious bursal disease (or
gumboro), infectious coryza, infectious laryngotracheitis, Newcastle disease and
salmonellosis.
2.6.3 Parasitic Conditions
Parasitic diseases are infections or infestations with parasitic organisms. They are
often contracted through contact with an intermediate vector, but may also occur as
the result of direct exposure. A parasite is an organism that lives in or on, and takes its
nourishment from, another organism. They cannot live independently; they include
coccidiosis, histomoniasis, lice, mites and helminths.
2.6.4 Behavioural Diseases
Behavioural diseases are as a result of abnormal behavioural patterns that lead to
injury or ill health of the abnormally behaving chicken and/or its companions, an
example is cannibalism (www.poultryhub.org (2014).
The most important diseases which affect chickens are viral diseases. Newcastle
disease (NCD) is the most devastating, especially in unvaccinated village chickens.
Others are fowl pox and infectious bursal disease where the later has become a very
important disease in small scale confined systems and to some extent free-range
systems. The frequently encountered bacterial diseases are fowl typhoid, fowl cholera,
infectious coryza and pullorum disease. Ecto and endo-parasitic diseases are
frequently seen among both village and commercial chickens. Helminthes account for
17
most of the parasitic diseases. Ecto-parasites are most prevalent among village
chickens and include fleas, lice, and mites. Ticks are less common (FAO, 2009).
Increasing awareness on detection and treatment of these diseases leads to better
welfare standards and increased production (Laura and Blake, 2012). All farmers
should therefore be empowered and trained to recognise and report disease incidences
since good surveillance is a vital tool in controlling chicken diseases. Disease
reporting is important due to losses and welfare issues arising from their effects. For
example, an endoparasite like ascaridia galli causes emaciation, diarrhoea, weakness
and in large numbers lead to intestinal obstruction. Similarly, coccidiosis causes
haemorrhage and thickened intestinal wall thereby compromising carcass weight and
feed conversion efficiency.
FAO (2009) noted that improving on the care and vaccination of chicks against
diseases such as Newcastle and fowl pox can minimize losses. Farmers should be
advised against buying chicken at live bird markets or from unknown sources
especially during outbreaks. Vaccination is recommended against all locally important
diseases to all chicken, in addition, isolation of sick chicken and treatments are
fundamental. If there are dead birds they should be burnt or buried deep enough about
one metre deep to prevent animals from digging them up and spreading diseases. If
chicken are sick, definitive diagnosis should be arrived at before vaccinating or
introducing new flock. In rural areas farmers may not be aware that certain diseases
such as Newcastle can be prevented by vaccination (Kingori et al., 2010).
2.7 Poultry Medications
Medication is any substance administered by mouth, applied to the body or introduced
into the body for the purpose of treatment (Oxford dictionary, 2002). Table 4 shows
various diseases or conditions and therapeutic agents used for their management. If a
disease infects a flock, it is important that an appropriate treatment be commenced as
soon as possible. This can only be achieved when the correct diagnosis has been made
at an early stage. It is recommended that all field diagnosis i.e. a farm autopsy, be
supported by a laboratory examination to confirm the field diagnosis as well as
to ensure that other conditions are not also involved. Most treatments should be
administered under the guidance of the regular flock veterinarian (FAO, 2009).

18
Table 4: Various disease conditions and their therapeutic agents
Disease or Condition Therapeutic agent
Worms Anthelmintics (dewormer)
Bacteria Antibiotics
Coccidia Coccidiostats
Fungi Antifungal
Lice and mites Insecticides/Acaricides
Vitamin/Mineral deficiencies Vitamin/Mineral supplements
Source: Tablante, 2010.
During the14th World Organisation For Animal Health (OIE) conference held in
Tanzania in 2001, it was noted that the use of drugs in animals is beneficial by
keeping them healthy and well through relief of pain and suffering, they also help to
control animal infections that could be passed on to humans. However guidelines on
drug administration, dosage, and route of administration, withdrawal period and
disposal of unused packages should be followed according to manufacturer’s
instructions (Andrews, 2000). Antimicrobials should be administered to compliment
good management practice, vaccination programmes and site hygiene.
Disease control in poultry involves reducing susceptibility to infection through proper
antimicrobial use and proper parasite control, increasing resistance by vaccination and
decreasing exposure to pathogens such as bacteria, viruses, and coccidia. However
concerns are arising due to improper handling and use of antimicrobials, feed
additives, and hormones and pesticides leading to development of resistant bacteria, it
is therefore recommended that use of other means like improved animal husbandry
and hygiene, routine health monitoring and vaccinations should be considered before
antimicrobial therapy (Andrews, 2000).
Turkson (2008) found in Accra, Ghana that most of drugs used by farmers were
dewormers, coccidicidals and antibacterials’ excluding vitamin and mineral
supplements, yet information on which drug to buy is normally acquired from
veterinarians, veterinary technicians, drug sellers, other farmers and self-experience
and no withdrawal periods observed after administration.

19
Some poor rural chicken farmers also consider these antimicrobials as expensive and
unaffordable (Marizvikuru et al., 2005), hence prompting the farmers to use ethno
veterinary medicines which they consider as easily accessible, affordable and
apparently effective (Gueye, 1999; Moreki, 2012). Use of medicines is among
multidisciplinary approach measures of disease control in addition to culling,
vaccination, quarantine, biosecurity and sources of introductions (Karin and Jonathan,
2007). Simple medical control measures recommended for use in the small scale rural
chicken include vaccinations against NCD, fowl pox and gumboro; regular
deworming with a broad spectrum dewormer (like piperazine) added to drinking
water and control of all external parasites by use of acaricides, insecticides or dusting
powders (FAO, 2009). Antibiotics are not effective against viral infections (Tablante,
2010).

20
CHAPTER 3: RESEARCH METHODOLOGY
3.1 Study Area
This study was carried out in Katulani District of Kitui County. It was chosen as it
had two poultry markets, constitutes both peri urban and rural populations and its
close proximity to Kitui town ensuring a ready market. The study is therefore giving
insights on peri urban and rural chicken rearing. It is located along latitude -1.4167°
and longitude 38.0000° (in decimal degrees). It borders Kisasi District to the east,
Kitui Central and Matinyani to the west and Lower Yatta District to the south.
Figure 1: Location of Katulani District within Kitui County.

21
It covers an area of 330.4 square km with a population of 45,042 persons according to
the KNBS, 2009 population and housing census (GOK, 2009). The district is
normally warm and dry for most months of the year with temperatures ranging
between 20ºC and 35ºC and experiences bimodal pattern of rainfall with long rains
during April to June and short rains in October to December. The average annual
rainfall is between 250 mm to 350 mm per annum (GOK, 2014). The area falls in
Agro-ecological zones IV and V. The vegetation ranges from scrubland to thorny
thickets. The district is served by seasonal rivers which dry after the rains. The other
sources of water are shallow wells, pans, dams and boreholes. The pans and dams dry
up during the dry season (DAO Katulani, 2012). Also some parts of the district are
supplied with piped treated water from Masinga Dam by the Kitui Water and
Sewerage Company. Cattle, sheep, goats, poultry and donkeys are the main livestock
kept.
3.2 Target Population
This study focused on chicken farming households within Katulani District-Kitui
County
3.3 Sample Size
The population of the study area was 45,042 persons (GOK, 2009) comprising of
approximately 9,593 households. A proposed sample size was calculated based on the
formula used by Israel (1992) and assuming 95% confidence level and p = 0.5
n= N = 9593 =99
1+ N (e) 2 1+9593 (0.1)2
Where
n= was the sample size
N= was the number of households’ within Katulani District (sampling frame)
e =is the level of precision/sampling error. 10% was used.
P=degree of variability. 0.5 was assumed as maximum variability in the population
Additional 10% respondents were included to cater for attrition, thus the total number
of respondents was 110.

22
3.4 Research Design
A cross section survey research design was used for this study. Both qualitative and
quantitative data were collected. Questionnaires were administered to 110 chicken
rearing households in the study area.
3.5 Sampling Design
The study used multi stage sampling design. In the first stage, all sub locations in the
district were classified into two: to be either in peri urban or rural area through a pre
survey of the area with the help of chiefs and other government officers. Then two
sub-locations were randomly selected from each of the two areas, giving a total of
four sub-locations. Then two villages were randomly selected from each sub location.
The final stage was simple random sampling from the list of all households in each
village to proportionately select the respondents.
3.6 Sampling Frame
A sampling frame is a description of the units of the population from which the
sample was drawn. Katulani District has 14 sub-locations, of which 4 are in peri urban
while 10 are in a rural setup. Out of the total 9,593 households in the area, 3,465 and
6,128 households are located in peri urban and rural areas respectively; this represents
36% and 64% of the population. The data was obtained from the district registrar of
persons. It is on these figures that 40 and 70 questionnaires were proportionately
administered to peri urban and rural populations respectively.
3.7 Data Collection
Primary data was collected through observations, photography and using structured
questionnaires while secondary data was collected from literature review of existing
documentation and unpublished reports from Ministry of Agriculture, Livestock and
Fisheries in Katulani District. Each respondent was guided to fill the questionnaire.
3.8 Questionnaire Design
Questionnaires were designed to capture information on farm household
demographics, flock structure and dynamics, factors influencing chicken rearing,
23
adoption of technology and institutional support services and health management on
poultry.
3.9 Data Analysis
Data was analysed using Statistical Package for Social Sciences (SPSS) computer
software to generate descriptive statistics, Analysis of Variance (ANOVA), chi-square
tests and tables.
24
CHAPTER FOUR: RESULTS AND DISCUSSION
4.1 Introduction
This chapter presents the results and discussion of data collected to achieve the set
objectives. The first section characterises the household demographics namely
household size, gender of the respondent, age, level of education of the respondents,
marital status, employment status and sources of livelihood that influence the
perceptions, choices and preferences associated with chicken rearing in the two study
sites. The second section describes the flock structure and dynamics of chicken and
other livestock in the study area. Flock structure entails number of chicks, pullets,
hens, cockerels, cocks and the entire flock size. Similarly, flock dynamics includes
type of production system, source of chicks, purpose of keeping chicken and source of
initial breeding stock. This is followed by a presentation of respondents’ perceptions
regarding factors affecting chicken rearing in the study area. The fourth section
describes adoption of various technologies, innovations and services that are
fundamental for chicken rearing; including factors that influence their adoption and
up-scaling. Lastly, section five presents chicken health management practices and
strategies in both study sites taking into consideration the indigenous and
conventional methods; and factors that influence farmers’ choice of different health
management strategies.
4.2 Demographic Characteristics of the Respondents
4.2.1 Size of Household
A household size refers to the number of individuals living under one housing unit
(Amwata, 2004). In this survey, households were classified into two; small household
which refers to households with between 1 ≤ 5 persons and large households for those
with more than 5 persons. 0n the other hand, flock sizes were grouped into three
classes namely: small flock size for households with less than 10 chicken, medium for
those owning between11 ≤ 50 chicken and lastly large for those households that had
more than 50 chicken. The distribution of household size in relation to number of
chicken owned is presented in Table 5.
25
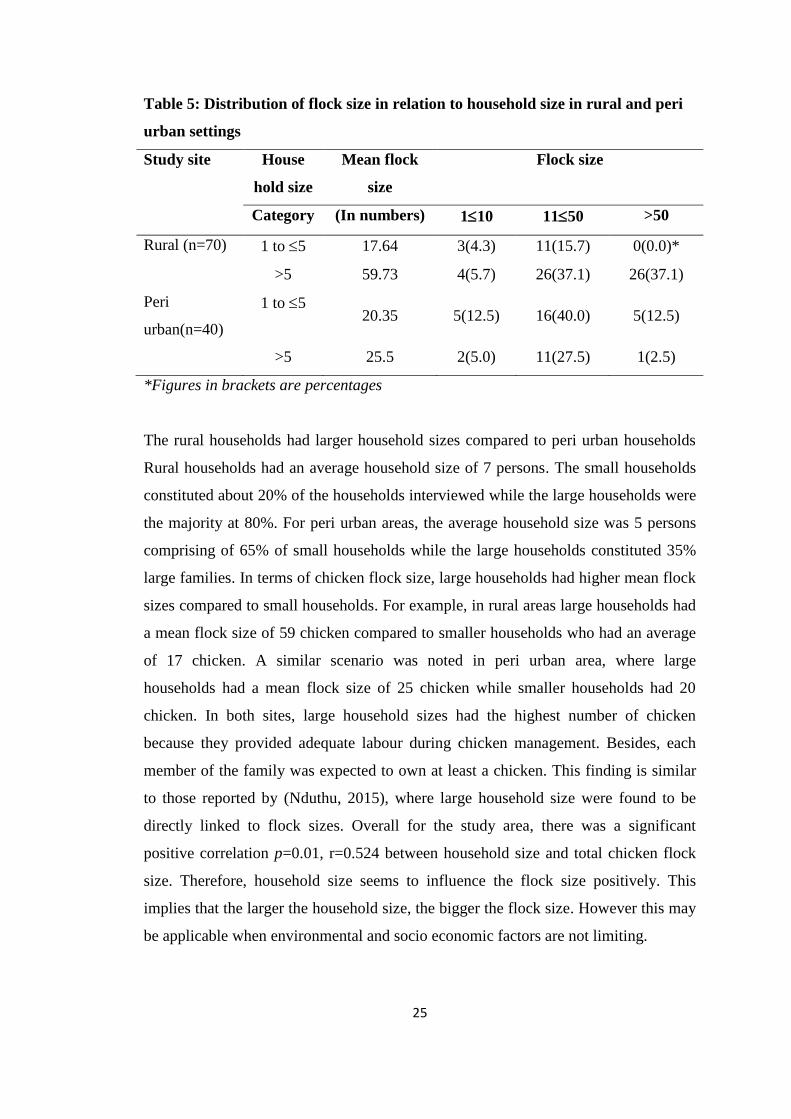
Table 5: Distribution of flock size in relation to household size in rural and peri
urban settings
Study site House
hold size
Mean flock
size
Flock size
Category (In numbers) 110 1150 >50
Rural (n=70) 1 to 5 17.64 3(4.3) 11(15.7) 0(0.0)*
>5 59.73 4(5.7) 26(37.1) 26(37.1)
Peri
urban(n=40)
1 to 5 20.35 5(12.5) 16(40.0) 5(12.5)
>5 25.5 2(5.0) 11(27.5) 1(2.5)
*Figures in brackets are percentages
The rural households had larger household sizes compared to peri urban households
Rural households had an average household size of 7 persons. The small households
constituted about 20% of the households interviewed while the large households were
the majority at 80%. For peri urban areas, the average household size was 5 persons
comprising of 65% of small households while the large households constituted 35%
large families. In terms of chicken flock size, large households had higher mean flock
sizes compared to small households. For example, in rural areas large households had
a mean flock size of 59 chicken compared to smaller households who had an average
of 17 chicken. A similar scenario was noted in peri urban area, where large
households had a mean flock size of 25 chicken while smaller households had 20
chicken. In both sites, large household sizes had the highest number of chicken
because they provided adequate labour during chicken management. Besides, each
member of the family was expected to own at least a chicken. This finding is similar
to those reported by (Nduthu, 2015), where large household size were found to be
directly linked to flock sizes. Overall for the study area, there was a significant
positive correlation p=0.01, r=0.524 between household size and total chicken flock
size. Therefore, household size seems to influence the flock size positively. This
implies that the larger the household size, the bigger the flock size. However this may
be applicable when environmental and socio economic factors are not limiting.

26
4.2.2 Gender of the Respondent
Gender refers to the social roles and identities associated with what it means to be a
male or female (FAO, 2011). The distribution of household in relation to gender and
chicken flock size for the rural and peri urban sites is shown in Table 6.
Table 6: Distribution of flock size in numbers in relation to gender in the study
area
Study
site
Gender Mean flock size Flock size
(in numbers) 110 1150 >50
Rural
(n=70)
Male 53.84 2(2.9) 18(25.7) 12(17.1)*
Female 49.18 5(7.1) 19(27.1) 14(20.0)
Peri
urban
(n=40)
Male 28.15 2(5.0) 9(22.5) 2(5.0)
Female 19.26 5(12.5) 18(45.0) 4(10.0)
*Figures in brackets are percentage
From Table 6, more female headed households were rearing chicken in both study
sites. More females (54% in rural and 67.55 in peri urban) kept chicken in the study
area because chicken were easily disposable for subsistence purposes. Besides
chicken are considered a women venture and men have limited interest due to its low
value. Furthermore women who run daily household affairs, chicken can bring quick
cash to buy basic household food requirements. This outcome is similar to the
findings by Kingori et al., (2010) who reviewed the indigenous chicken production in
Kenya; Kyule et al., (2014) in Nakuru County and Addis and Malede, (2014) in
Ethiopia who reported that indigenous chicken rearing is usually associated with
women as it is considered a venture of the poor. However even though smaller
number of male headed households kept chicken, they kept larger flock sizes than
females in both areas. For example, in rural areas males kept a mean flock size of 53
chicken compared to 49 chicken by females. In peri urban areas males kept a mean
flock size of 28 chicken compared to 19 chicken by females.
4.2.3 Level of Education and Flock Sizes
Education levels refer to mean years of formal schooling (Amwata, 2004). The
respondents level of education were classified into; 1) those with no formal education;
27
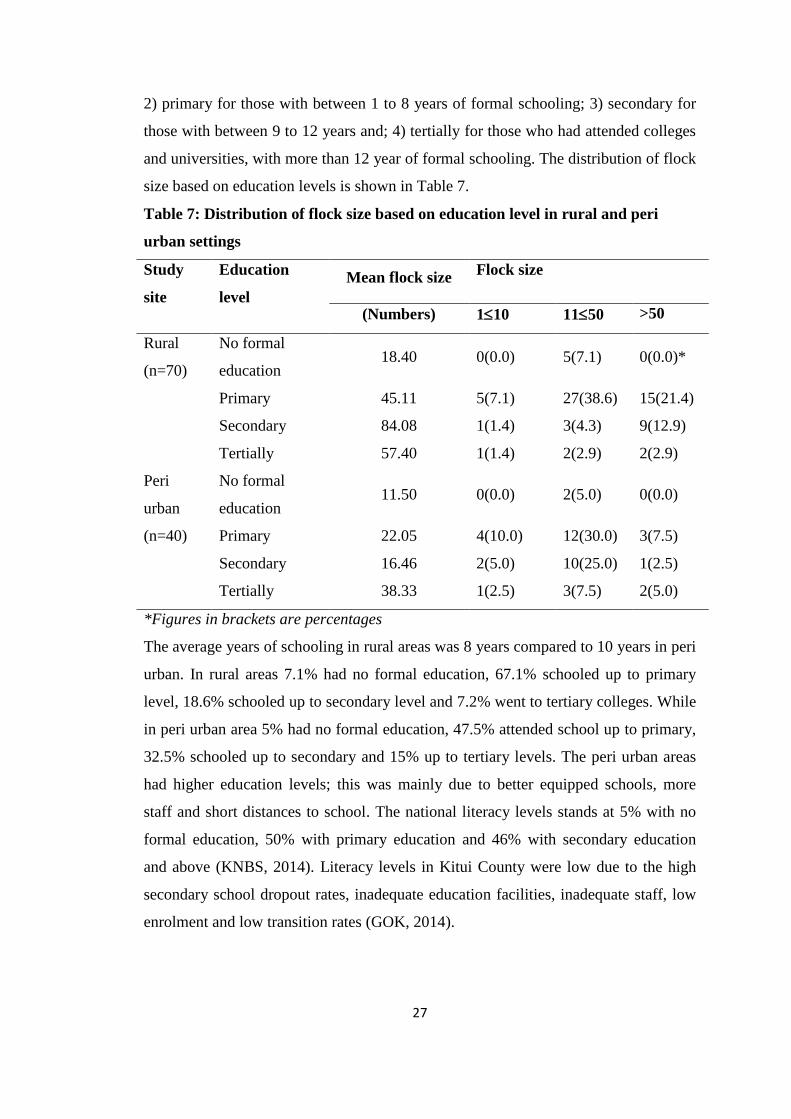
2) primary for those with between 1 to 8 years of formal schooling; 3) secondary for
those with between 9 to 12 years and; 4) tertially for those who had attended colleges
and universities, with more than 12 year of formal schooling. The distribution of flock
size based on education levels is shown in Table 7.
Table 7: Distribution of flock size based on education level in rural and peri
urban settings
Study
site
Education
level
Mean flock size Flock size
(Numbers) 110 1150 >50
Rural
(n=70)
No formal
education 18.40 0(0.0) 5(7.1) 0(0.0)*
Primary 45.11 5(7.1) 27(38.6) 15(21.4)
Secondary 84.08 1(1.4) 3(4.3) 9(12.9)
Tertially 57.40 1(1.4) 2(2.9) 2(2.9)
Peri
urban
(n=40)
No formal
education 11.50 0(0.0) 2(5.0) 0(0.0)
Primary 22.05 4(10.0) 12(30.0) 3(7.5)
Secondary 16.46 2(5.0) 10(25.0) 1(2.5)
Tertially 38.33 1(2.5) 3(7.5) 2(5.0)
*Figures in brackets are percentages
The average years of schooling in rural areas was 8 years compared to 10 years in peri
urban. In rural areas 7.1% had no formal education, 67.1% schooled up to primary
level, 18.6% schooled up to secondary level and 7.2% went to tertiary colleges. While
in peri urban area 5% had no formal education, 47.5% attended school up to primary,
32.5% schooled up to secondary and 15% up to tertiary levels. The peri urban areas
had higher education levels; this was mainly due to better equipped schools, more
staff and short distances to school. The national literacy levels stands at 5% with no
formal education, 50% with primary education and 46% with secondary education
and above (KNBS, 2014). Literacy levels in Kitui County were low due to the high
secondary school dropout rates, inadequate education facilities, inadequate staff, low
enrolment and low transition rates (GOK, 2014).

28
In rural areas the mean flock size kept was 18 chicken by those with no formal
education, 45 chicken by those with up to primary level of education, 84 chicken by
those with secondary level of education and 57 chicken by those with tertially
education. This generally shows that the higher the education level the bigger the
flock size kept. With high education level, farmers’ intellectual capacity is expected to
be high. This would in return enhance application of proper chicken rearing practices
hence improve household income derived from chicken (Kyule et al., 2014).
In peri urban areas the mean flock size kept was 11chicken by those with no formal
education, 22 chicken by those up to primary level of education, 16 chicken by those
with secondary level of education and 38 chicken by those with tertially education.
This also shows that the higher the education level the bigger the flock size kept.
Majority in both study sites preferred rearing medium sized flocks.
4.2.4: Marital Status of the Respondents
Marital status was grouped into four, namely; single, married, divorced/separated or
widowed. The distribution of flock size based on marital status in rural and urban
setting is shown in Table 8.
Table 8: Distribution of flock size based on marital status in rural and peri
urban areas
Study
site
Marital status Mean flock size Flock size
(In numbers) 110 1150 >50
Rural
(n=70)
Single 68.33 0(0.0) 2(2.9) 1(1.4)*
Married 53.16 5(7.1) 32(45.7) 24(34.3)
Divorced/
separated 0.00 0(0.0) 0(0.0) 0(0.0)
Widowed 24.00 2(2.9) 3(4.3) 1(1.4)
Peri
urban
(n=40)
Single 9.50 1(2.5) 2(5.0) 1(2.5)
Married 24.62 3(7.5) 23(57.5) 3(7.5)
Divorced/
separated 5.50 1(2.5) 0(0.0) 1(2.5)
Widowed 24.60 2(5.0) 2(5.0) 1(2.5)

29
*Figures in brackets are in percentage
From Table 8, rural areas had 4.3% household heads who were single, 87.1% married
and 7.7% widowed. Peri urban areas had 10% single, 72.5% married, 5% divorced
and 12.5% widowed household heads. From the survey, the separated/divorced had
the lowest flock size in both rural and peri urban sites. In rural areas, single
households were rearing larger flock sizes than married ones. The likely explanation
is that single households were mainly rearing chicken to supplement household
income, hence kept larger flocks to maximise benefits as opposed to married
household heads who reared chicken for subsistence. However, in peri urban areas,
majority of the married had larger flock sizes to provide additional source of food for
their families. From Table 8, majority of the respondents kept medium size flocks
(1150). Among married households like in the study area, women are considered to
have limited control over decision making on agricultural resource allocation (FAO,
2011; African Development Bank, 2015).
4.2.5 Employment Status
Only 1.4% of rural respondents reported to have been in formal employment
compared to 42.5% in peri urban. The unemployment rate was 98.6% in rural areas
and 57.5% in peri urban areas. Overall the study area had an unemployment rate of
79.5%; this is compared to 65% unemployment rate for the whole of Kitui County.
The high unemployment in Kitui County is attributed to lack of/or limited vocational
skills demanded by the economy and the employers (GOK, 2014).
The unemployment rates for the study area and Kitui County as a whole were higher
than the national average of 40% (Biko, 2012). However the study showed that the
employed in rural areas had larger mean flock sizes of 140 chicken compared to 24
chicken in peri urban areas. This is because the employed have access to capital that
enables them to purchase more chicken which was found to be the main method of
initial stock acquisition as shown in Table 9.
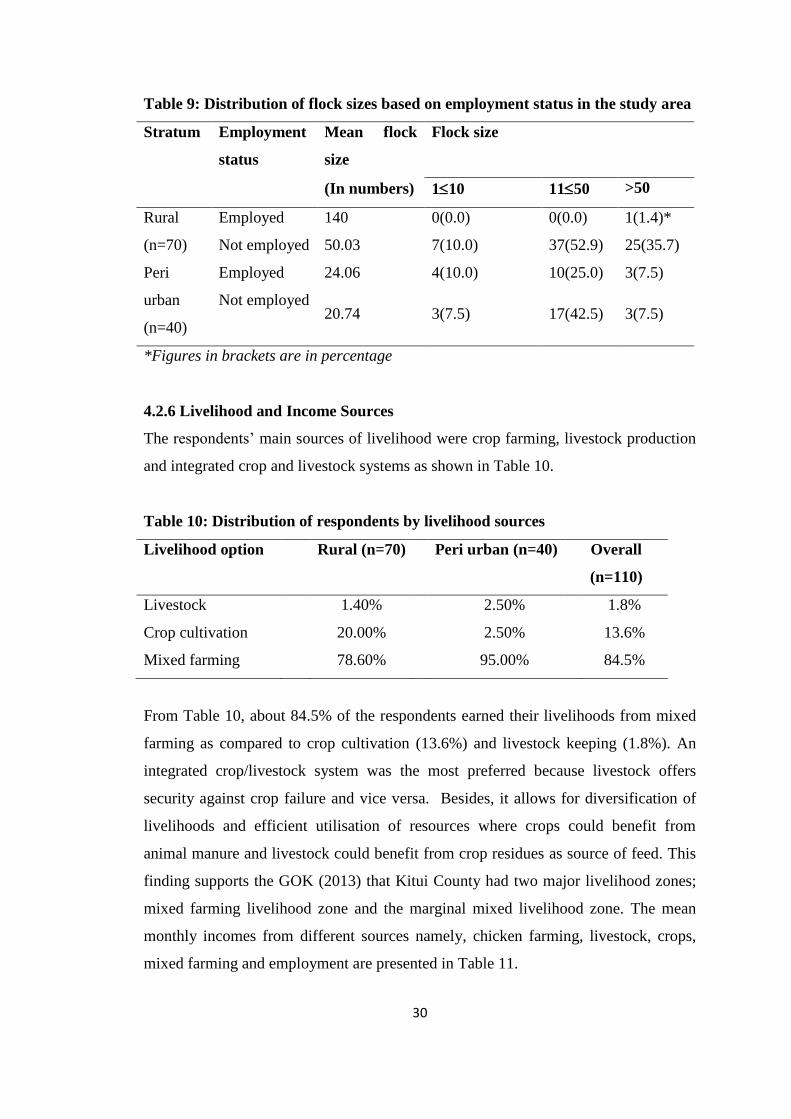
30
Table 9: Distribution of flock sizes based on employment status in the study area
Stratum Employment
status
Mean flock
size
Flock size
(In numbers) 110 1150 >50
Rural
(n=70)
Employed 140 0(0.0) 0(0.0) 1(1.4)*
Not employed 50.03 7(10.0) 37(52.9) 25(35.7)
Peri
urban
(n=40)
Employed 24.06 4(10.0) 10(25.0) 3(7.5)
Not employed 20.74 3(7.5) 17(42.5) 3(7.5)
*Figures in brackets are in percentage
4.2.6 Livelihood and Income Sources
The respondents’ main sources of livelihood were crop farming, livestock production
and integrated crop and livestock systems as shown in Table 10.
Table 10: Distribution of respondents by livelihood sources
Livelihood option Rural (n=70) Peri urban (n=40) Overall
(n=110)
Livestock 1.40% 2.50% 1.8%
Crop cultivation 20.00% 2.50% 13.6%
Mixed farming 78.60% 95.00% 84.5%
From Table 10, about 84.5% of the respondents earned their livelihoods from mixed
farming as compared to crop cultivation (13.6%) and livestock keeping (1.8%). An
integrated crop/livestock system was the most preferred because livestock offers
security against crop failure and vice versa. Besides, it allows for diversification of
livelihoods and efficient utilisation of resources where crops could benefit from
animal manure and livestock could benefit from crop residues as source of feed. This
finding supports the GOK (2013) that Kitui County had two major livelihood zones;
mixed farming livelihood zone and the marginal mixed livelihood zone. The mean
monthly incomes from different sources namely, chicken farming, livestock, crops,
mixed farming and employment are presented in Table 11.

31
Table 11: Average monthly incomes for the respondents in Kenyan shillings
Variable Rural
(n=70)
Peri urban
(n=40)
Overall
(n=110)
Chicken farming 527 600 563.5
Livestock income 1800 3467 3229
Crop income 3762 3000 3550
Mixed income 5077 5275 5129
Employment income 8,500 11,417 11,192
Overall mean income 3933 4752 4733
Chicken contribution to overall mean
income
13.4% 12.6% 11.9%
Monthly incomes from mixed farming in the study area were found to be highest (Ksh
5,129) compared to incomes from either livestock farming (Ksh3,229) or crop (Ksh
3,550) farming singly. The few, who had formal employment (16%), had higher
monthly incomes (Ksh.11,192) than those relying on agricultural activities. This may
be due to the fact that formal employment offered stable and guaranteed income as
opposed to farming in an environment characterised by unreliable rainfall and
recurrent droughts, often resulting in crop failure and destocking of livestock at low
market prices. Employment income had a significant positive correlation p<0.05,
r=0.643 on how farmers acquired initial poultry flocks, which was mainly through
purchase.
Income from chicken farming constituted 13.4% and 12.6% of overall mean
household income in rural areas and peri urban sites respectively. In the study area
income from chicken farming represented 11.9% of overall mean income. Mean
household incomes were Ksh 3,933, Ksh 4,752 and Ksh 4,733 for rural, peri urban
and overall respectively. This implied that most of the households had low level of
income to meet basic needs and invest in intensive indigenous chicken activities such
as construction of chicken house, purchase of good indigenous chicken breeds and
even provide good disease/ parasites control. Kitui county income per capita is Ksh
18,240 (GOK, 2013). Poultry contributes 55% to the livestock income, 30% to the

32
agricultural contribution to GDP and 7.8% of the total Gross Domestic Productin
Kenya (Labanthua, 2015; FAO, 2008 and Ochieng et al., 2013).
4.3 Flock Structure and Dynamics
4.3.1 Existing Poultry Flock Dynamics
Poultry flock dynamics is one of the factors influencing poultry management. Table
12 summarises the number of farmers rearing poultry, poultry types, use, duration
reared, mode of acquisition, breeds, production systems and labour source among
poultry farmers in both rural and peri urban areas.
Table 12: Summary of some selected variables
Variable Choice
Rural
(n=70)
Peri
urban
(n=40)
Overall
(n=110)
Type of poultry kept Chicken only 98.6% 100.0% 99.1%
Chicken
+Ducks 1.4% 0.0%
0.9%
Purpose of keeping
poultry Subsistence 4.3% 25.0%
11.8%
Income 22.9% 2.5% 15.5%
Subsistence
and income 72.9% 72.5% 72.7%
Duration of keeping
poultry ≤ 5 years 2.86% 27.5%
11.8%
> 5 years 97.14% 72.5% 88.2%
Method of poultry
acquisition Purchase 95.7% 90.0%
93.6%
Gift 1.4% 10.0% 4.5%
Inheritance 2.9% 0.0% 1.8%
Breed of poultry Indigenous 100.0% 100.0% 100.0%
Production system Free range 100.0% 90.0% 96.4
Small scale
confined 0.0% 10.0% 3.6%
Labour source
Nuclear
family 82.9% 82.5%
82.7%
Extended
family 17.1% 17.5%
17.3%
A majority of households (99%) in the study area kept chicken with only 1% of the
respondents keeping a combination of chicken, ducks and doves. Chicken are

33
increasingly becoming a dual enterprise, for subsistence and commercial roles rather
than each in isolation. For example, in the study area approximately 72.7% of
respondents reared poultry for both income and subsistence while only 11.8% reared
for subsistence and 15.5% for income generation. Farmers slaughter them for meat
and/or consume their eggs and also sell them in the local poultry markets in small
scale to brokers, middlemen or consumers. The income generated is normally used to
buy basic household items.
In terms of experience, only 2.86% of respondents in rural areas had reared poultry
for less than five years compared to 27.5% in peri urban areas; this indicates that peri
urban study site had more new chicken farmers. In the study area, most respondents
(96.4%) rear chicken under free range as shown in Figure 2 and 3.
Figure 2 and 3: Indigenous Chicken under Free Range
Almost all the poultry kept in the study area were of indigenous type. The likely
explanation was because of the minimal costs involved as chicken scavenge the whole
day with limited labour and feed costs. A similar finding has been reported by studies
by Danda et al., (2010) in the costal lowlands of Kenya; Mailu et al., (2012) in
Eastern Kenya and Bwalya and Kalinda (2014) in Lusaka, Zambia. From these
studies, indigenous chicken were favoured by farmers because they had several
advantages namely; resistance to diseases than exotic breeds, cheaper to buy, taste
preferences for their meat and eggs in the market, free ranging ability, ability to
tolerate harsh climate, easy to dispose/sell and need for less labour. In addition,
Bwalya and Kalinda, 2014 indicated that indigenous chicken were favoured since they
Figure 2 Figure 3

34
cause minimal destruction to the environment and require very little feed
supplementation.
The study also found that 82.7% indigenous poultry keeping households utilise
nuclear family labour since it is cheap, this agrees with studies done in Machakos
County by Nduthu, (2015) who found out that 82% of households were depending on
family labour. The main method of initial poultry acquisition was through purchase
(93.6%), other methods were 4.5% through gifts and 1.8% through inheritance. This
was similar to studies done by Ochieng et al., (2013) who found that the main method
of initial stock acquisition was through purchase by 74% of farmers in western Kenya.
The flocks mainly increased through random breeding and hatching of own chicks.
Employment income was found to positively influence purchasing power.
4.3.2 Flock Structure
4.3.2.1 Other Livestock Species Kept
Other livestock species kept by farmers in the study area were goats, cattle, donkey
and sheep in decreasing order as shown in Figure 4.
Figure 4: Distribution of livestock in the study area
Chicken and other livestock kept in rural and peri urban areas were converted into
Tropical Livestock Units (TLU) and compared to determine the contribution of
chicken to overall TLU as shown in Table 13. A Tropical Livestock Unit (TLU) is a
12.72
2.78
29.92
5.56 8.66
5.8
2 2
Rural (n=70) Peri urban (n=40)
Average flock sizes of various livestock in the study area
Cattle Goats Sheep Donkey Other
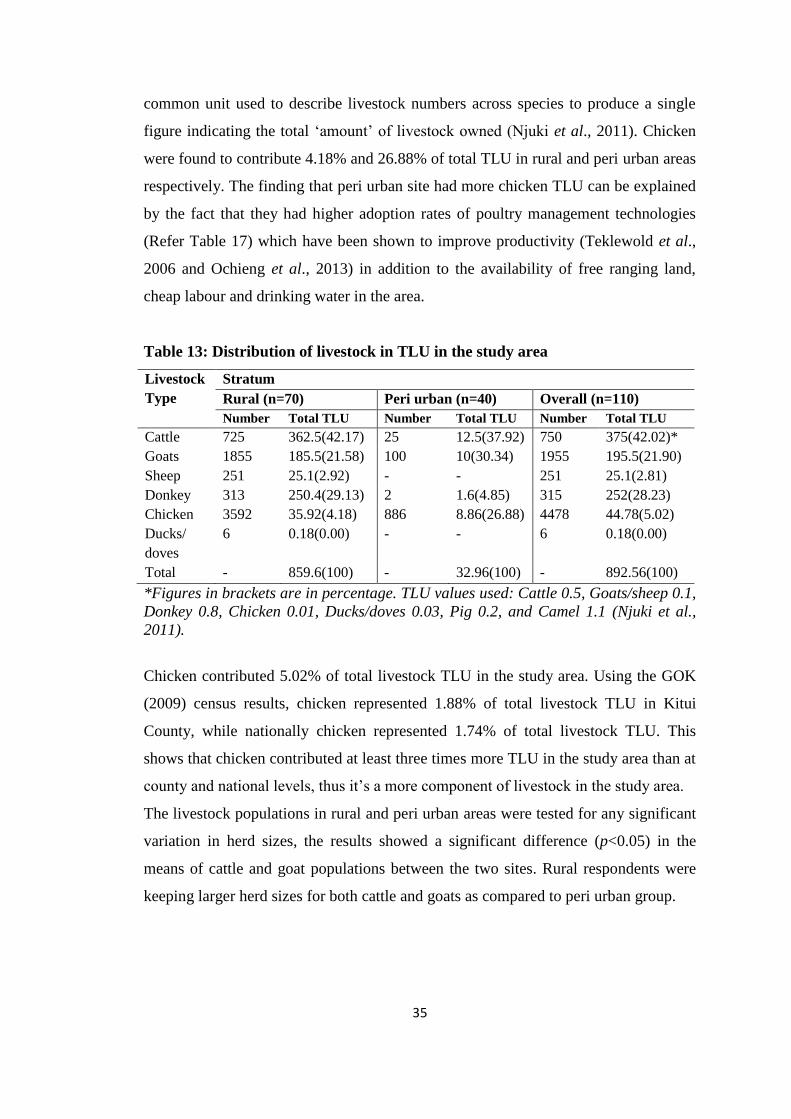
35
common unit used to describe livestock numbers across species to produce a single
figure indicating the total ‘amount’ of livestock owned (Njuki et al., 2011). Chicken
were found to contribute 4.18% and 26.88% of total TLU in rural and peri urban areas
respectively. The finding that peri urban site had more chicken TLU can be explained
by the fact that they had higher adoption rates of poultry management technologies
(Refer Table 17) which have been shown to improve productivity (Teklewold et al.,
2006 and Ochieng et al., 2013) in addition to the availability of free ranging land,
cheap labour and drinking water in the area.
Table 13: Distribution of livestock in TLU in the study area
Livestock
Type
Stratum
Rural (n=70) Peri urban (n=40) Overall (n=110)
Number Total TLU Number Total TLU Number Total TLU
Cattle 725 362.5(42.17) 25 12.5(37.92) 750 375(42.02)*
Goats 1855 185.5(21.58) 100 10(30.34) 1955 195.5(21.90)
Sheep 251 25.1(2.92) - - 251 25.1(2.81)
Donkey 313 250.4(29.13) 2 1.6(4.85) 315 252(28.23)
Chicken 3592 35.92(4.18) 886 8.86(26.88) 4478 44.78(5.02)
Ducks/
doves
6 0.18(0.00) - - 6 0.18(0.00)
Total - 859.6(100) - 32.96(100) - 892.56(100)
*Figures in brackets are in percentage. TLU values used: Cattle 0.5, Goats/sheep 0.1,
Donkey 0.8, Chicken 0.01, Ducks/doves 0.03, Pig 0.2, and Camel 1.1 (Njuki et al.,
2011).
Chicken contributed 5.02% of total livestock TLU in the study area. Using the GOK
(2009) census results, chicken represented 1.88% of total livestock TLU in Kitui
County, while nationally chicken represented 1.74% of total livestock TLU. This
shows that chicken contributed at least three times more TLU in the study area than at
county and national levels, thus it’s a more component of livestock in the study area.
The livestock populations in rural and peri urban areas were tested for any significant
variation in herd sizes, the results showed a significant difference (p<0.05) in the
means of cattle and goat populations between the two sites. Rural respondents were
keeping larger herd sizes for both cattle and goats as compared to peri urban group.

36
Donkeys were used as working animals to carry water, firewood and other small
luggage while bulls were mainly used as draught animals during land preparation and
planting seasons.
4.3.2.2 Chicken Flocks Composition
The respondents also indicated the composition of their flocks. Chicks, hens and
pullets were found to dominate the flock structure as they were mainly retained for
production purposes. On average, households kept flock sizes of 40 chicken, although
there was a big variation in means between peri urban (22 chicken) and rural areas (51
chicken) mainly attributed to more availability of land and labour in rural areas.
The average flock size of 40 chicken for the study area is higher than that reported by
Kingori et al., (2010). He established that Kenyan farmers kept an average of 30
indigenous chicken; further Addis and Malede (2014) noted that the average flock
size in Ethiopia was 16 chicken while Gueye (1998) reported a flock size of 5-20
chicken in most African villages (Table 14).
Table 14: Chicken flock composition in the study area
Number Rural (n=70) Peri urban (n=40) Overall (n=110)
Number of chicks 14.84±1.9 12.2±1.7 15.42±1.4
Number of pullets 14.19±2.0 1.73±0.8 15.62±2.0
Number of hens 9.31±1.0 5.63±0.5 7.97±0.7
Number of cockerels 8.46±1.2 1.15±0.5 9.97±1.2
Number of cocks 4.59±5.6 1.88±0.5 4.26±0.4
Mean flock size 51.31±0.6 22.15±3.0 40.71±4.0
Chicks, pullets and hens constituted the largest proportion of the total flock size.
Chicks constituted the biggest proportion (37.8%). In support Ochieng et al., (2013)
established that in western Kenya, 80% of the flock structure was dominated by
chicks, hens and pullets. Also Addis and Malede (2014) noted that in Ethiopia, flock
structure was dominated by chicks and hens. These flock types were mainly retained
for production purposes through hatching of own chicks.

37
The average cock to hen ratio in the study area was 1:2; this slightly differs with the
national average as reported by Okeno et al., (2010) where the ratio was 1:3. The
figures generated in this study fall within the range of other studies from developing
countries where the cock to hen ratio was found to be between 1:2.3 -1:6.4
(Mwalosanya et al., 2001; Halima et al., 2007 and Muchadeyi et al., 2007). However,
the recommended cock to hen ratio is 1; 10-15 (FAO, 2009). This implies more cocks
are kept for breeding than needed thus waste of resources especially on feeding and
health management issues. Thus extra cocks should be sold or fattened and sold for
meat.
The mean chicken flock size in rural and peri urban areas was tested for significant
difference. The results showed significant differences (p<0.05) in the means of
pullets, hens, cocks and total flock size between the two sites, where rural respondents
had larger flock sizes compared to the peri urban group as shown in Table 15.
Table 15: Distribution of chicken flocks in the study area
Variable Location Df F
value
Sig.
Composition of
pullets
Between rural and peri urban
groups
1 4.571 0.036*
Within Groups 66
Total 67
Composition of hens Between rural and peri urban
groups
1 5.792 0.018*
Within Groups 10
8
Total 10
9
Composition of cocks Between rural and peri urban
groups
1 5.014 0.028*
Within Groups 91
Total 92
Total flock size Between rural and peri urban
groups
1 14.144 0.000*
Within Groups 10
8
Total 10
9
* The F statistic is significant at the p<0 .05 level.

38
The mean effective flock size per household in the study area was estimated to be 11
chicken, ranging from 12 chicken in rural areas to 6 chicken in peri urban areas. The
inbreeding rate per generation was 4.5% in comparison to acceptable levels of 1-2%
per generation (Henson, 1992). This means that during scavenging different flocks
mix and cocks mate hens from other flocks hence increasing the rate of inbreeding.
Farmers therefore need to be encouraged to keep breeding cocks and exchange them
with other farmers located further than the scavenging distance. Having many cocks is
counterproductive since they spend most of their time fighting for dominance.
Ne is the effective population size per breeding population (study area), Ne was
computed as:
Ne= 4NmNf
Nf + Nf
Rural Ne = 4x4.59x9.31 = 12 Chickens Peri urban Ne = 4x1.88x5.63 = 6 Chickens
4.59+9.31 1.88+5.63
Total population Ne = 4x4.26x7.97=11 Chickens
4.26+7.97
Where Nm and Nf are the average number of breeding cocks and hens per household
in the respective populations.
Inbreeding rate (ΔF) was estimated using Wrights equation (Falconer and Mackay,
1996). It was calculated as;
F= 1 = 1 = 4.5 chickens
(2Ne) (2x11)
4.4 Factors Influencing Chicken Rearing in Katulani District
Various factors influencing chicken rearing in the study area and are categorised into
opportunities and challenges are shown in table 16
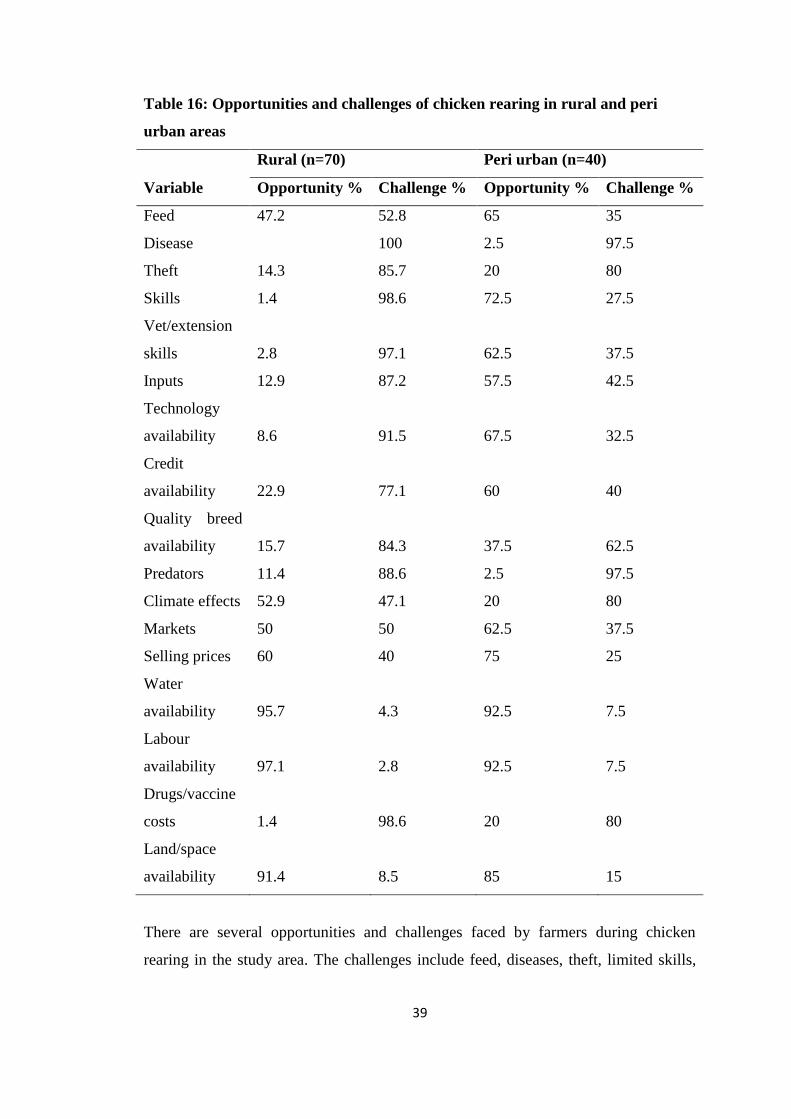
39
Table 16: Opportunities and challenges of chicken rearing in rural and peri
urban areas
Variable
Rural (n=70) Peri urban (n=40)
Opportunity % Challenge % Opportunity % Challenge %
Feed 47.2 52.8 65 35
Disease 100 2.5 97.5
Theft 14.3 85.7 20 80
Skills 1.4 98.6 72.5 27.5
Vet/extension
skills 2.8 97.1 62.5 37.5
Inputs 12.9 87.2 57.5 42.5
Technology
availability 8.6 91.5 67.5 32.5
Credit
availability 22.9 77.1 60 40
Quality breed
availability 15.7 84.3 37.5 62.5
Predators 11.4 88.6 2.5 97.5
Climate effects 52.9 47.1 20 80
Markets 50 50 62.5 37.5
Selling prices 60 40 75 25
Water
availability 95.7 4.3 92.5 7.5
Labour
availability 97.1 2.8 92.5 7.5
Drugs/vaccine
costs 1.4 98.6 20 80
Land/space
availability 91.4 8.5 85 15
There are several opportunities and challenges faced by farmers during chicken
rearing in the study area. The challenges include feed, diseases, theft, limited skills,

40
limited veterinary extension and in adequate inputs. Also limited access to technology
and credit facilities were among the factors critical for chicken rearing.
Chicken diseases were a major setback to chicken rearing in the study area. They
constituted 100% and 97.5% challenge in rural and peri urban sites respectively.
These findings are similar to those of Kyule et al., (2014) and Ochieng et al., (2013)
who reported that diseases were the major cause of chicken deaths and it discourages
farmers from keeping large flocks of chicken for fear of losing them during disease
incidences. The main opportunities listed in rural areas were availability of labour
(97.1%), availability of land (91.4%) and availability of water (95.7%). Major
challenges listed were diseases incidences by all respondents especially NCD and
coccidiosis, limited expertise in chicken production (98.6%), and high cost of
drugs/vaccines (98.6%). In peri urban areas the main opportunities listed were
availability of labour (92.5%), availability of water (92.5%) and availability of land
(85%). While main challenges listed were predation (97.5%), diseases (97.5%), theft
and high cost of drugs and or vaccines (80%).
Unavailability of chicken rearing technologies usually prevents farmers from
overcoming traditional chicken farming behaviours thereby unable to increase income
and reduce poverty (Epiphane and Arne, 2012). The authors also suggested that
farmers should be initially advised to adopt low cost technologies like chicken house
construction using local materials, vaccinations and feed supplementation in that
order as the three have shown to enhance the survival rate of chicken.
Limited access to veterinary, extension services and chicken production skills in the
study area is common in most extensive chicken production systems, chicken
productivity usually increases when proper and timely veterinary and extension
services are provided to farmers (Ochieng et al., 2013).
Unavailability of superior chicken breeds was reported in both sites; by 84.3% and
62.5% of respondents in rural and peri urban areas respectively. Okeno et al., (2010)
indicates that the improved breeds possess characteristics such as bigger body size,
improved growth rate and egg yield, better mothering ability, disease tolerance and

41
improved fertility. These are traits of economic importance and in any breeding
program it is recommended to consider current and future production circumstances.
4.5 Technology and Support Services Adoption
4.5.1 Farmers’ Adoption of Different Chicken Management Practices
The respondents listed the different chicken management practices carried out in the
households, which included vaccinations, predator and rodent control, feed
supplementation, housing, brooding, hatching and use of improved chicks or
improved cockerels. The use of each technology was categorised as; regularly or
rarely as shown in Table 17.
In overall, the results showed low adoption of all chicken management technologies
in the study area especially in rural areas. This indicates a low input-low output
production system which is characteristic of free range system (Bwalya and Kalinda,
2014; Ochieng et al., 2013). There were higher adoption rates of all technologies in
peri urban areas than rural areas. In rural areas the regularly used technologies were
predator and rodent control (47.2%), vaccination (18.5%), housing (11.4%), brooding
and hatching (10%), with feed supplementation and improved chick rearing having
the least at 1.4%. In peri urban areas, the regularly used technologies were vaccination
(87.5%), feed supplementation (80%), predator and rodent control (72.5%) and
brooding (55%) in that descending order. The least adopted technology in the study
area was improved chick rearing by 2.7% of respondents, while the best adopted
technology was predator and rodent control by 56.4% of respondents. On the same
note only 20.9% of respondents regularly house their chicken.
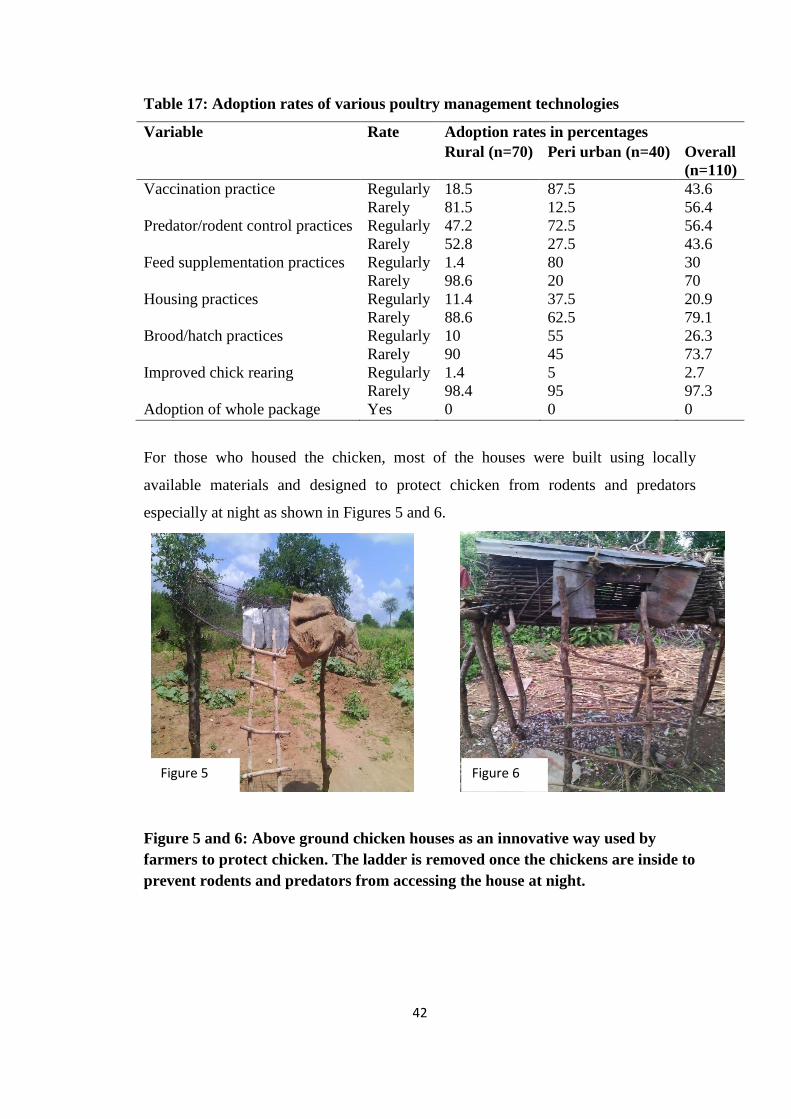
42
Table 17: Adoption rates of various poultry management technologies
Variable Rate Adoption rates in percentages
Rural (n=70) Peri urban (n=40) Overall
(n=110)
Vaccination practice Regularly 18.5 87.5 43.6
Rarely 81.5 12.5 56.4
Predator/rodent control practices Regularly 47.2 72.5 56.4
Rarely 52.8 27.5 43.6
Feed supplementation practices Regularly 1.4 80 30
Rarely 98.6 20 70
Housing practices Regularly 11.4 37.5 20.9
Rarely 88.6 62.5 79.1
Brood/hatch practices Regularly 10 55 26.3
Rarely 90 45 73.7
Improved chick rearing Regularly 1.4 5 2.7
Rarely 98.4 95 97.3
Adoption of whole package Yes 0 0 0
For those who housed the chicken, most of the houses were built using locally
available materials and designed to protect chicken from rodents and predators
especially at night as shown in Figures 5 and 6.
Figure 5 and 6: Above ground chicken houses as an innovative way used by
farmers to protect chicken. The ladder is removed once the chickens are inside to
prevent rodents and predators from accessing the house at night.
Figure 5 Figure 6

43
Only 30% of respondents regularly provided feed supplements to the chicken in the
study area. Feed supplementation was lowest in rural areas while 80% of peri urban
respondents regularly provided feed supplementation to their flock as compared to
1.4% in rural areas. Most of the supplements were cereal grains thrown on the ground
for chicken to feed on as they free range within the compound as shown in Figures 7
and 8.
Figures 7 and 8: Example of supplementation mainly practiced in the study area
using left over’s and mostly thrown on the ground.
Brooding and hatching was regularly practiced by only 10% and 55% in rural and peri
urban areas respectively, while rearing of improved chicks was regularly practised by
2.7% of respondents in the study area. There was no farmer who adopted the package
as a whole. Hatching is important in rural settings since it is more economical in time
and money than artificial incubators, as broody hens only need to be given a safe,
clean shelter, adequate feed and clean water to hatch. In addition, brooding is
important as it allows chicks to feed without competition from other chicken and stay
safe from predators; thus, faster growing chicks, fewer expenses on feeds and more
surviving chicks (Farzin and Ineke, 2011).
4.5.2 Access to Extension Support Services
The respondents also acknowledged accessing the various institutional support
services such as extension, veterinary health care, credit facilities, chicken rearing
trainings, markets and market information. Access to extension support services was
Figure 7 Figure 8

44
classified into yes or no. There was generally poor accessibility to extension services
in the study area.
When accessibility to these services were tested for any variation, rural areas were
found to have higher access to extension services compared to peri urban areas with a
significant difference (p=<0.05). This is mainly because rural areas had higher
demand for extension services to increase survivability of their large flock size.
4.5.3 Sources of Chicken Rearing Support Services
The main chicken rearing support service providers include non-government
organisation (NGO), government, community based organisations and microfinance
banks (Table 18).
Table 18: Sources of support services
Variable Level Rural % (n=70) Peri urban % (n-40)
Extension services
providers
NGO 1.4 0
Government 42.9 2.5
None 55.7 97.5
Credit sources
Formal 1.4 0
Informal 7.1 10
None 91.4 90
Membership to a poultry group
Yes 0 2.5
No 98.60 95.00
Sometimes 1.40 2.50
Government staff offered 42.9% and 2.5% of all poultry production extension
services in rural and peri urban areas respectively. NGO were only accessible in rural
areas to 1.4% of respondents. The rest of the farmers could not access these services;
this indicates poor accessibility of extension services in the study area.
Credit facilities for rearing chicken were mostly accessed from the informal market by
7.1% and 10% of respondents in rural and peri urban areas respectively. Credit from
formal markets i.e. microfinance institutions like banks, savings and credit

45
cooperatives and Agricultural Finance Corporation was only accessed by 1.4% of
respondents in rural areas.
There was also poor membership to chicken rearing groups; this is similar to a finding
by Ayieko et al., (2014) in Makueni County. Group membership has been shown to
have benefits like easier access to trainings, collective purchasing of inputs so as to
reduce costs because of economies of scale, easy access to credit services since they
could guarantee each other, collective marketing with the aim of reducing transaction
costs and bargaining power (Ayieko et al., 2014; Kinambuga, 2010 and Danda et al.,
2010).
4.5.4 Factors Influencing the Current Adoption of Various Management
Technologies, Innovations and Institutional Support Services in the Study Area.
Respondents were asked to indicate factors that influence their adoption of various
chicken rearing technologies and access to institutional support services. Adoption of
chicken management technologies has been shown to move indigenous chicken
production from more subsistence to income generation in rural households (Epiphane
and Arne, 2012). The factors are shown in Figure 9.
Figure 9: Factors influencing adoption of chicken rearing technologies and
access to institutional support services.
70
52.9 47.1
2.9 11.4
78.6
42.9
2.9
82.8
41.4 48.3
10.3 20.7
13.8 24.1
3.4
Percentage of respodents influenced by various factors into techology adoption and access to servives in both study sites
Rural (n=70) Peri urban (n=40)

46
In rural areas the main factors considered by farmers before adopting a technology or
seeking support services were culture (78.6%), awareness of expected benefits (70%),
cost of the technology/service (52.9%), farmer’s knowledge on the application of the
technology (47.1%) and availability of ready market (42.9%) while in peri urban areas
the main factors considered were awareness of expected benefits (82.8%), farmer’s
knowledge on the application of the technology (48.3%) and cost (41.4%).
The pricing mechanism was on bargain basis for a willing buyer and seller. Chicken
markets among free range farmers were mainly dominated by middlemen who mainly
used hand weighing to estimate weights thereby exploiting farmers; this has a
potential to influence farmers into maintaining low input production systems instead
of adopting modern chicken production technologies and extension support services
(FAO, 2009; Danda et al., 2010).
4.6 Health Management
4.6.1 Disease Occurrence and Management
Respondents were asked to indicate if they had experienced diseases in their chicken
flocks, whether they had used any intervention to manage the diseases and the type of
medication used as shown in Table 19.
Table 19: Disease occurrence and management in the study area
Variable Options
Rural
(n=70)
Peri urban
(n=40)
Sig. Values
Disease
occurrence in
chicken Yes 100.00% 52.50%
0.000*
No 0.00% 47.50%
Medication use
in chicken Yes 98.60% 90.00%
0.038*
No 1.40% 10.00%
Medication type Traditional 80.00% 20.00% 0.000*
Conventional 10.00% 57.50%
Traditional and
conventional 10.00% 22.50%
* The Chi-square statistic is significant at the p<0.05 level.

47
Diseases were reported by all respondents in rural areas, as opposed to 52.5% in peri
urban areas. It was concluded that Newcastle disease and coccidiosis were the
common diseases since majority of farmers reported sudden deaths associated with
greenish or bloody diarrhoea which are characteristic of the two diseases. This finding
is similar to that of Mutombo (2015) who documented that in Machakos County,
coccidiosis and Newcastle are the commonest diseases. The respondents indicated
sneezing, nasal discharges, eye infections, inability to feed, general weakness, bloody
and greenish diarrhoea, dropping feathers, sudden deaths and slow movements as
ways of knowing when their chicken were sick.
Medicines to manage chicken diseases were applied by 98.6% and 90% of
respondents in rural and peri urban areas respectively. Traditional medicinal products
were the most common method of disease management in the rural areas where 80%
of respondents used them; this is similar to findings by Mutombo (2015) in Machakos
County where about 87% of chicken farmers were reported to use traditional medicine
to treat diseases due to limited access to cash. Conventional medicines were mostly
used in peri urban areas where 58% of respondents preferred their use. This is mainly
due to their proximity to town centres and access to cash. The results showed
significant differences (p<0.05) between the two study sites on disease occurrence,
medication use and type of medicinal product used. Rural areas had more disease
incidences, used more medication on their chicken and preferred use of traditional
medicinal products (Table 19).
From the survey, the medicinal products used for health management on chicken can
be classified into three categories; biological, chemical and conventional. Chemical
products used were sugar, charcoal powder, battery cell powder and soot. The
biological products used were Aloe vera, red bitter belly, Maerua decumbens roots,
Africa night shade, neem tree, marabou thorn leaves, euphorbia, mush room, cough
grass, wandering jew, Vernonia lasiopus, pepper, goat milk, Melia volkensii guerke,
onions and wild lettuce. Lastly, the conventional medicines bought from agrovets and
the common products were egocin and metrocycline. Aloe vera, neem tree, pepper
and goat milk were the most common medicinal products used by respondents.

48
The use of medicinal products in rural areas were as follows; Aloe vera (42.86%),
neem tree (38.57%), pepper (25.71%), goat milk (14.29%), Vernonia lasiopus
(11.43%) and Mellia volkensii guerke (10%). Other products used in rural areas were
African night shade, tobacco powder, sugar, marabou thorn leaves, charcoal powder,
euphorbia, mushroom, cough grass, wandering jew, soot, battery cell powder and
onions (Table 20).
On the other hand only four medicinal products were used in peri urban area as
follows; Aloe vera (32.5%), pepper (15%), red bitter belly (7.5%) and Maerua
decumbens roots (2.5%).
Table 20: Traditional practices in chicken health management
Local name English/scientific
name
Preparation and
administration
Diseases treated
Battery cell
powder
Battery cell powder Powder in drinking
water
Diarrhoea
Muvatha Vernonia lasiopus Smashed leaves in
drinking water
Newcastle disease
Kiluma Aloe species/Burn
plant
Juice mixed in water
or slice leaves put into
drinking water
Newcastle and other
diseases
Muteta Red bitter berry/
strychnos henningsii
Roots and bark in
boiled drinking water
Various diseases
Goat milk Goat milk Milk administered
orally
Diarrhoea
Onions Allium species/
Onions
Slices in drinking
water
All diseases
Tobacco
powder
Nicotinia tubacum/
Tobacco powder
Powder Drowsiness
Kitulu
/manage
African night
shade/Sollanum
villosum
Leaves fed to poultry Diarrhoea
Mwarobaini Azandirachta indica/
Neem tree
Smashed leaves and
bark in drinking water
Newcastle disease
Worms, coccidiosis
Fowl typhoid and
cholera
Ndulu and
kiluma
Pepper, euphorbia and
aloe species
Chopped pepper
mixed with aloe juice
and euphorbia in
drinking water
Newcastle and
Fowl typhoid
Mukau tree Melia volkensii guerke Smashed bark and
leaves in drinking
water
Worms, Newcastle
disease, coccidiosis

49
Uthunga Launaea cornuta/ wild
lettuce
Chopped in drinking
water
Various diseases
Muwae Soot In drinking water.
Usually mixed with
pepper
Newcastle disease and
other diseases
Kinatha
roots
Maerua decumbens Roots soaked in
drinking water
Various diseases
Charcoal
powder
Charcoal powder In drinking water Diarrhoea and
poisonings
Ndulu and
ikunu
Pepper and mushroom Crushed and mixed in
drinking water
Improving
immunity/quick
recovery in all diseases
Respiratory
disturbances
Cough grass
and Ndulu
Elymus repens
Cough grass/quack
grass
Mixed in drinking
water
Newcastle disease and
fowl typhoid
Sukali Sugar Solution in drinking
water
Weakness
Muselesele
leaves
Sickle bush, Marabou
thorn
Smashed leaves in
drinking water
Anthelmintics and
stomach problems
Wandering
jew juice
Wandering jew plant Leaves smashed in
drinking water
Fowl typhoid and
coccidiosis
Medicinal plants were used more than other types of traditional products, the main
plant parts used were roots, seeds and leaves. The method of preparation involved
giving some parts of the plant like leaves alone or a combination of parts of the same
plant like roots and bark. Combination of parts of different plants was also widely
practiced. Routes of administration were mainly orally where plant parts were mixed
in drinking water.
The most widely used medicinal plant was Aloe vera; it was used to manage several
diseases including Newcastle disease. Their leaves were harvested, cleaned with
water, and crushed or sliced into pieces before mixing with drinking water. The
medicated water was offered to sick chicken until they showed signs of good health.
Aloe vera has been documented to have several pharmacological properties: it is
antibacterial, antifungal, antivenin, immunological properties, anti-allergy and anti-
inflammatory properties. It is a perennial herb that originates in the tropics and
therefore is readily available, accessible and inexpensive (Marizvikuru et al., 2005). It
has a wide usage even by many other communities in Kenya (Shivairo et al., 2013

50
and Ndegwa et al., 2014). Some chicken farmers in the study area used it for
prophylactic purposes by mixing it in drinking water and strategically placing it in the
compound so that chicken can drink it while on free range.
Another commonly used medicinal plant was neem tree (Azandirachta indica);
commonly known as mwarobaini in Kenya. Its leaves and bark are smashed and
mixed with water to treat various conditions. Gueye (1999) and Ndegwa et al., (2014)
found that it had been used to treat various endoparasites in many African villages.
Pepper (capsicum species) was used to manage several diseases. Onions (Allium
species) chopped and soaked in drinking water has been used to treat fever (Gueye,
1999). Melia volkensii guerke, locally known as Mukau tree has also been reported to
increase appetite when given in boiled drinking water while Vernonia lasiopus locally
known as Muvatha has been administered in drinking water to treat digestive
disturbances (Kwesi and Philip, 2004). Battery cell powder was used by farmers in
the study area to treat diarrhoea. Strychnos henningsii locally known as Muteta was
also widely used; it has been reported to treat various diseases when the bark, roots
and fruits were administered in boiled drinking water (Kuria et al., 2012). Soot and
pepper have been used to treat coccidiosis (Marizvikuru et al., 2005).
Charcoal powder and sugar were administered as solutions in water. Figure 10 shows
how one of the respondents administered medicated drinking water.
Figure 10: Receptacle placed within the compound to administer drinking water
to free range chickens in Mavindini village, Kitui County.

51
The container in Figure 10 was anchored to the ground at one point in the compound
so that chicken could access it throughout the day. Medication could be added to the
water for treatment or prophylactic purposes. Farmers discontinued administering the
medication once signs of good health were observed. No adverse effects were
reported during administration
4.6.2 Factors Influencing Farmers’ Choice of Health Management Strategies
There are several factors that influence the choice of health management strategies
among farmers. They include costs, availability, accessibility, religion, culture and
ease of administration (Table 21).
Table 21: Factors influencing choice of medication
Factors
Location Overall (%)
Rural (%)
(n=70)
Peri urban (%)
(n=40) (n=110)
Cost 59.4 25.0 47.6
Availability 91.3 36.1 72.4
Accessibility 56.5 22.2 44.8
Healing ability 89.9 94.4 91.4
Ease of
administration 44.9 19.4 36.2
Risk of
overdose 2.9 16.7 7.6
Indigenous
knowledge 34.8 16.7 28.6
Religion 1.4 2.8 1.9
Culture 71.0 5.6 48.6
Respondents were asked to indicate factors that influenced their choice of using
traditional or conventional medicinal products. Over 90% and 94% of the respondents
in rural and peri urban areas respectively would chose a strategy that has the ability to
heal a certain disease until signs of recovery were observed. There was a significant
difference at p<0.05 on local availability of a medicinal product with 91% of rural
respondents listing it as a key factor to consider compared to 36% of peri urban
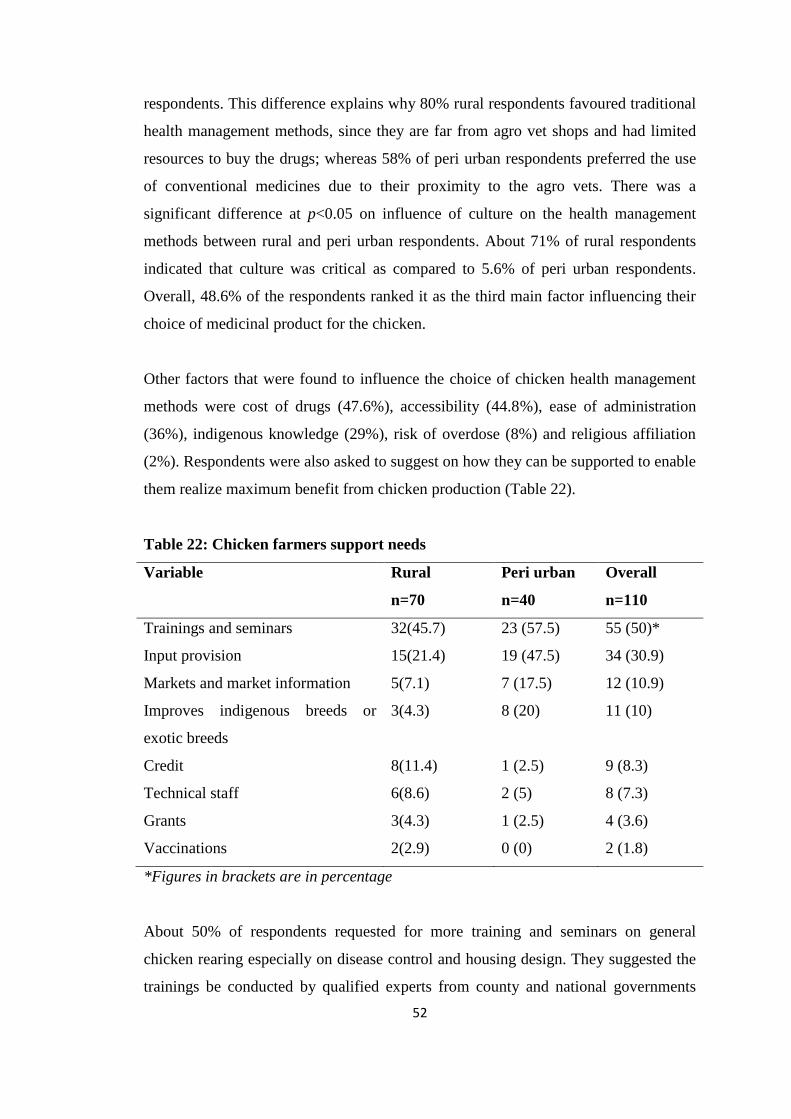
52
respondents. This difference explains why 80% rural respondents favoured traditional
health management methods, since they are far from agro vet shops and had limited
resources to buy the drugs; whereas 58% of peri urban respondents preferred the use
of conventional medicines due to their proximity to the agro vets. There was a
significant difference at p<0.05 on influence of culture on the health management
methods between rural and peri urban respondents. About 71% of rural respondents
indicated that culture was critical as compared to 5.6% of peri urban respondents.
Overall, 48.6% of the respondents ranked it as the third main factor influencing their
choice of medicinal product for the chicken.
Other factors that were found to influence the choice of chicken health management
methods were cost of drugs (47.6%), accessibility (44.8%), ease of administration
(36%), indigenous knowledge (29%), risk of overdose (8%) and religious affiliation
(2%). Respondents were also asked to suggest on how they can be supported to enable
them realize maximum benefit from chicken production (Table 22).
Table 22: Chicken farmers support needs
Variable Rural
n=70
Peri urban
n=40
Overall
n=110
Trainings and seminars 32(45.7) 23 (57.5) 55 (50)*
Input provision 15(21.4) 19 (47.5) 34 (30.9)
Markets and market information 5(7.1) 7 (17.5) 12 (10.9)
Improves indigenous breeds or
exotic breeds
3(4.3) 8 (20) 11 (10)
Credit 8(11.4) 1 (2.5) 9 (8.3)
Technical staff 6(8.6) 2 (5) 8 (7.3)
Grants 3(4.3) 1 (2.5) 4 (3.6)
Vaccinations 2(2.9) 0 (0) 2 (1.8)
*Figures in brackets are in percentage
About 50% of respondents requested for more training and seminars on general
chicken rearing especially on disease control and housing design. They suggested the
trainings be conducted by qualified experts from county and national governments

53
and Non-Governmental organisations. However, 30.9% of respondents requested for
provision of inputs, specifically chicken feeds, feed supplements, drugs/vaccines and
construction of chicken houses. About 10.9% suggested provision of regular market
information to ensure they get maximum benefits from their chicken rather than being
exploited by middlemen. About 10% requested the provision of improved indigenous
and exotic breeds, 8.3% for provision of credit, 7.3% for additional extension and
veterinary staff, 3.6% for provision of grants and 1.8% for regular vaccinations
campaigns by veterinary department.

54
CHAPTER 5: CONCLUSION, RECOMMENDATIONS AND FUTURE
RESEARCH AREAS
5.1 Conclusions
Household demographics (house hold size, education, gender, employment status)
had influence on flock size kept
The production system in the area was low input
There was an opportunity for small start-up and low capital investment
Main challenges included diseases, theft, predators, harsh weather and high cost of
drugs/vaccines
Chicken were a key livestock component although kept under poor husbandry
Ethno veterinary medicines were widely used in the area, especially aloevera,
neem tree, goat milk and pepper
Healing ability, availability and cost of any drug were main factors guiding choice
of drug used
The area had poor access to extension services
Farmers needed more trainings and subsidized services
Benefits of using any technology, affordability, knowledge and skills about
application of any technology were the main factors considered by farmers when
using any management technologies like vaccination, feed supplementation,
housing, brooding and hatching.
5.2 Recommendations
Initiatives that support women in chicken production should be prioritized since
they form the majority of chicken farmers
Enhance education and awareness as it is critical for uptake of chicken
technologies and innovations in chicken farming
Reduce number of cocks and start cock exchange programs to reduce inbreeding
and wastage of feed resources
Initiate awareness creation on benefits of various management technologies, cost-
benefit analysis and impact skills on their application to increase their uptake
55
Initiate trainings on disease control and put in place a regular disease control
programme
Provide regular support services to farmers especially extension services, market
information including price trends
Encourage chicken farmers to form farmer groups for ease of accessing various
services and enhanced bargaining power.
Train Village Based Advisors/Agents (VBAs)
Facilitate farmer field schools to share indigenous knowledge on use of traditional
medicinal products
5.3 Future Research Areas
More research needs to be conducted on chemical composition, efficacy, dosage and
side effects of key traditional medicinal products used in the study area. They can act
as a substitute for conventional drugs or in combinations.
More field observations on use of traditional medicines on chicken health
management should be documented in order to highlight chicken healthcare needs
among the chicken farmers.
56
REFERENCES
African Development Bank (2015). Empowering African Women: An Agenda For
Action.www.afdb.org/.../afdb/.../African_Gender_Eq/
Amwata, D.A. (2004). Effects of Communal and Individual Land Tenure Systems on
Land Use and Food Security in Kajiado District, Kenya. MSc Thesis, University of
Nairobi, Kenya.
Andrews, T. (2000). Guidelines for Responsible Use of Antimicrobials in Poultry
Production. Responsible Use of Antimicrobials in Agriculture Alliance (RUMA).
www.ruma.org.uk/
Ayieko, D.M.O., Bett, E.K., Kabuage, L.W. (2014). Profitability of Indigenous
Chicken: The Case of Producers in Makueni County, Kenya. International Journal of
Agricultural Extension Vol.02 (02): 137-145.
Berg, C. (2001). Health and Welfare in Organic Poultry Production. Acta Veterinaria
Scandinavica and Supplementum Vol. 95: 37-45.
Biko, S. (2012). Increasing unemployment rate continues to push Kenya to the
precipice of chaos in an election year,
http://www.sokodirectory.com/index.php?page=2&article= 53 retrieved on October
12th 2014.
Branckaert, R.D.S., Gaviria, L., Jallade, J. and Seiders, R.W. (2000). Transfer of
Technology in Poultry Production for Developing Countries. SD dimensions
website.http://www.fao.org/sd/cddirect/cdre0054.htm.
Bwalya, R and Kalinda, T. (2014). Analysis of The Value Chain for Indigenous
Chickens in Zambia’s Lusaka and Central Provinces. Journal of Agricultural Studies
Vol. 2 (2): 32-51.
Danda, M. K., Mwamachi, D. M., Lewa, K. and Jefa, F. (2010). Characterization
of indigenous Chicken Sub-Sector in the Coastal Lowlands of Kenya. Kenya
Agricultural Research Institute (KARI), Mtwapa, Kenya.
District Agricultural Officer (2012). Updated District Profile, Katulani District,
Kenya.
East African Community (2013). Livestock Population by Type, Accessed on 17th
June 2013. www.eac.int/
Epiphane, S and Arne, H. (2012). FOI Working Paper: Community-based
Management and Interrelations Between Different Technology Adoption Decisions:
Innovations in Village Poultry Farming in Western Africa; Institute of Food and
Resource Economics, University of Copenhagen, Denmark.
Falconer, D.S. and Mackay, T.F.C. (1996). Introduction to Quantitative Genetics.
4th Edition. Longman Scientific and Technical. Brnt Mill. Harlow, England.

57
FAO (2004). Small-scale Poultry Production Technical Guide. Sonaiya, E.B. and
Swan, S.E.J, Rome, Italy.
FAO (2008). Poultry Sector Country Review, Kenya. FAO Animal Production and
Health Division. Emergency Centre for Transboundary Animal Diseases, Social
Economics, Production and Biodiversity unit. Philip Nyaga, University of Nairobi,
Kenya.
FAO (2009). Good Practices in Small Scale Poultry Production: A Manual for
Trainers and Producers in East Africa, FAO ECTAD Regional office, Eastern Africa,
Nairobi, Kenya. Anders Permin, FAO Consultant
FAO (2009). How to Breed and Grow Healthy Chicks. FAO ECTAD Regional unit,
Eastern Africa, Nairobi, Kenya.
FAO (2011). Women in Agriculture: Closing the Gender Gap for Development. The
state of Food and Agriculture 2010 –11. Rome, Italy.
Farzin, W. and Ineke, P. (2011). Improving hatching and brooding in small-scale
poultry keeping. Agrodok-series No. 34: 1-80.
Addis, G. and Malede, B. (2014). Chicken Production Systems, Performance and
Associated Constraints in North Gondar Zone, Ethiopia. Journal of Fisheries
Livestock Production Vol. 2 (115): 2332-2608.
GOK (2013). Kitui County Short Rains Food Security Assessment Report,3rd to 13th
February 2014. Kitui, Kenya.
GOK (Government of Kenya) (2014). Kitui County Integrated Development Plan
2013-2017. County Government of Kitui, Kenya.
GOK, (2010). Agricultural Sector Development Strategy 2010-2020.
Grepay, N.A. (2009). The Main Factors Affecting Poultry Production in Libya.
Oeconomia Vol. 8 (4): 43–49.
Guèye, E.F. (1998). Poultry Plays an Important Role in African Village Life. World
Poultry Science Journal Vol. 14 (10): 14–17.
Gueye, E.F. (1999). Ethno Veterinary Medicine against Poultry Diseases in African
villages. World’s Poultry Science Journal Vol. 55: 187-198.
Halima, H., Neser, F.W.C., Van Marle-Koster, E. and De Kock, A. (2007).
Village-Bases Indigenous Chicken Production System in North-West Ethiopia.
Tropical Animal Health and Production journal Vol.39: 189-197.
Henson, E. L. (1992). In situ Conservation of Livestock and Poultry. FAO Animal
Health and Health Paper No. 99, FAO, Rome, Italy.

58
IFPRI (2010). Investigating the Role of Poultry in Livelihoods and the Impact of
Avian Flu on Livelihoods Outcomes in Africa. Evidence from Ethiopia, Ghana,
Kenya, and Nigeria. IFPRI Discussion Paper 01011.
Israel, D.G. (1992). Determining Sample Size, Fact Sheet PEOD-6. University of
Florida, USA.
Karin, S. and Jonathan, R. (2007). Veterinary Services for Poultry Production,
Animal Production and Health Division, FAO, Rome, Italy.
Kenya Agricultural Research Institute (KARI) (2006). Indigenous Chicken
Production Manual; Technical Note No. 18. Compiled by Henry Ondwasy, Hezron
Wesonga and Ludovicus Okitoi. Nairobi, Kenya.
GOK (2009). Kenya National Bureau of Statistics, 2009 Population and Housing
census. www.or.ke/Census%20Results.
Kenya National Bureau of Statistics (2014). 2014 Kenya Demographic and Health
Survey (KDHS), Nairobi, Kenya.
Kinambuga, D. (2010). Evaluation of the Constraints to Profitable Smallholder
Dairying: A case of Nakuru County, Kenya. MSC Thesis. Egerton University, Kenya.
Kingori, A.M., Wachira, A.M and Tuitoek, J.K. (2010). Indigenous Chicken
Production in Kenya. A review; International Journal of Science Vol.9 : 4.
Kirwa, C.E, Muthiani, E. N. and Ndathi, A. J. N. (2010). Pastoral Chicken
Production Trends: the Case of Mashuru and Loitoktok Divisions in Kajiado District,
Kenya. Livestock Research for Rural Development Vol. 22: 124.
Kuria, M. W., Njenga, P. K. and Ngumi, V. W. (2012). Ethno Botanical Studies of
Strychnos Henningsii in Five Natural Habitats in Kenya. International Journal of
Medicinal Plant Research Vol.1: 6.
Kwesi, Y. and Philip, M.P. (2004). African Folklore, an Encyclopedia. New York,
USA www.ebookstore.tandf.co.uk
Kyule, N. M., Nkurumwa, O. A., Konyango, J. J. O. (2014). Performance and
Constraints of Indigenous Chicken Rearing Among Small Scale Farmers in Mau-
Narok ward, Njoro sub county, Nakuru County, Kenya. International Journal of
Advanced Research Vol. 3.
Labanthua, (2015). Retrieved http://www.softkenyafarm.com/poultry-farming-
project-in-kenya/ accessed on 21st September 2015.
Laura, L. and Darmer, B. (2012). Awareness of Chicken Parasites Among Backyard
Chicken Keepers, Commercial Producers and Vets. Royal Veterinary College,
England.

59
Mailu, S.K., Wachira, M.A., Munyasi, J.W., Nzioka, M., Kibiru, S.K., Mwangi,
D.M., Kaguthi, P. & Kithome, J, (2012). Influence of Prices on Market Participation
Decisions of Indigenous Poultry Farmers in Four Districts of Eastern Province,
Kenya. Journal of Agriculture and Social Research (JASR) Vol. 12 (1): 1-10.
Maina, S. (2008). Poultry Management in East Africa (Guidelines for rearing
chicken). www.elewa.org© Elewa publications.
Mapiye, C. and Sibanda, S. (2005). Constraints and Opportunities of Village
Chicken Production Systems in The Smallholder Sector of Rushinga District of
Zimbabwe. Livestock Research for Rural Development. Vol. 17:115.
Mapiye, C., Mwale, M., Mupangwa, J.F., Chimonyo, M., Foti, R and Mutenje,
M.J. (2008). A research Review of Village Chicken Production Constraints and
Opportunities in Zimbabwe. Asian-Australian Journal of Animal Science Vol. 21
(11): 1680 – 1688.
Marizvikuru, M., Evison B., Michael, C. and Tinyiko, E.H. (2005). Use of Herbal
Plants in Poultry Health Management in the Mushagashe. Small Scale Commercial
Farming Area in Zimbabwe. International Journal of Applied Research in Veterinary
Medicine Vol. 3 (2): 163-170.
Merck’s Manual Edition (2006) www.merckvetmanual.com. Copyright © 2006;
Merck & Co., Inc. Whitehouse Station New Jersey, USA.
Moreki, J. C. (2010). Opportunities and Challenges for The Botswana Poultry
Industry in The 21st Century: A Review. Livestock Research for Rural Development
Vol. 22: 89.
Moreki, J.C. (2012). Use of Ethno Veterinary Medicine in Family Poultry Health
Management in Botswana. A review: Journal of Veterinary Advances, Vol.2 (6): 254-
260.
Muchadeyi, F.C., Wollny, C.B.A., Eding, H., Weigend, S., Makuza, S.M. and
Simianer, H. (2007). Variation in Village Chicken Production Systems among Agro-
Ecological Zones on Zimbabwe. Tropical Animal Health and Production Vol.39: 453-
461.
Munyaka, F.G. (2010). Factors Affecting the Performance of Small and Medium
Scale Poultry Farming Enterprises in Karuri, Kenya. (MBA research project). School
of Business, University of Nairobi, Kenya.
Mutombo, P.K. (2015). An Assessment of Natural and Socio- economic Impacts on
Indigenous Chicken Production: A case study of Katangi and Ikombe divisions of
Yatta Sub County, Machakos County. A Master of Science Thesis, South Eastern
Kenya University, Kenya.
60
Mwalosanya, N.A., Katule, A.M., Mutayoba, S.K., Mtambo, M.M.A., Olsen, J.E.
and Minga, U.M. (2001). Productivity of Local Chickens Under Village
Management Conditions. Tropical Animal Health and Production journal Vol.34:
405-416.
Ndegwa, J. M., Mead, R., Norrish, P., Shephered, D. D., Kimani, C. W.,
Wachira, A. M. and Siamba, D. N. (2014). Investigating Eggs Hatchability in
Indigenous Chicken System with Smallholder Farms in Kenya. Journal of Applied
Biosciences Vol.80: 7000 – 7013.
Nduthu, P. W. (2015). Social- economics Influence on Indigenous Poultry
Production Project in Kenya. A case of Machakos indigenous poultry. International
Journal of Education and Research Vol. 3 (1): 1-12.
Njuki, J., Poole, J., Nancy, J., Isabelle, B., Pamela, P., Zaibet, L. and Mburu, S.
(2011). Gender, Livestock and Livelihood Indicators, ILRI, Nairobi, Kenya.
Ochieng, J., Owuor, G. and Bebe, J.O. (2013). Management Practices and
Challenges in Small Holder Indigenous Chicken Production in Western Kenya.
Journal of Agriculture and Rural Development in the Tropics and Sub Tropics
Vol.114: 151-158.
Okeno, T.O., Kahi, A.K. and Peters, J.K. (2010). Characterization of indigenous
Chicken Production Systems in Kenya: Household Flock Structure, Dynamics and
Breeding Practices, Animal Breeding and Genetics Group, Department of Animal
Science, Egerton University, Kenya.
Omiti, J.M. and Okuthe, S.O. (2008). An Overview of the Poultry Sector and Status
of Highly Pathogenic Avian Influenza (HPAI) in Kenya-background paper.
Africa/Indonesia Regional Report NO.4
Oxford medical dictionary, Sixth edition (2002). Oxford University Press.
Oyeyinka, R. A., Raheem, W. K., Ayanda, I. F and Abiona, B. G. (2012). Poultry
Farmers Awareness and Knowledge of Improved Production Practices in Afijio Local
Government Area, Oyo State, Nigeria. International Journal of Agricultural
Economics and Rural Development Vol. 5 (1): 74-82
Petrus, N. P., Mpofu, I. and Lutaaya, E. (2011). The Care and Management of
Indigenous Chicken in Northern Communal Areas of Namibia. Livestock Research
for Rural Development Vol. 23: 253.
Shivairo, R.M., Musalia, L. M. and Muleke, C.I. (2013). Ethno Veterinary
Knowledge and Practice Among the Pastoralists of Baringo District, Kenya. Journal
of Biology Agriculture and Healthcare Vol.3 (14): 75-77
Tablante, N.L. (2010). Vaccination and Medication Programs for Small Poultry
Flocks; Associate Professor and Extension Poultry Veterinarian. Regional College of
Veterinary Medicine. University of Maryland College Park, USA

61
Teklewold, H., Dadi, L., Yami, A. and Dana, N. (2006). Determinants of Adoption
of Poultry Technology: A Double-Hurdle Approach. Livestock Research for Rural
Development Vol. 18: 40.
The 14th Conference of the Regional Commission for Africa of the Office
International des Epizooties (OIE), World Organisation for Animal Health, held in
Arusha (Tanzania) from 23-26 January (2001). Veterinary Services in Africa
strengthen their solidarity by establishing a Regional Representation of the OIE and
by seeking common strategies to eliminate animal diseases and improve public health.
Turkson, P.K. (2008). Use of Drugs and Antibiotics In Poultry Production in Ghana;
Ghana Journal of Agricultural Science, Vol. 41: 1.
www.poultryhub.org accessed on 23rd May 2014. Poultry Husbandry, Management
and Health Management©Poultry CRC 2006 – 2014.
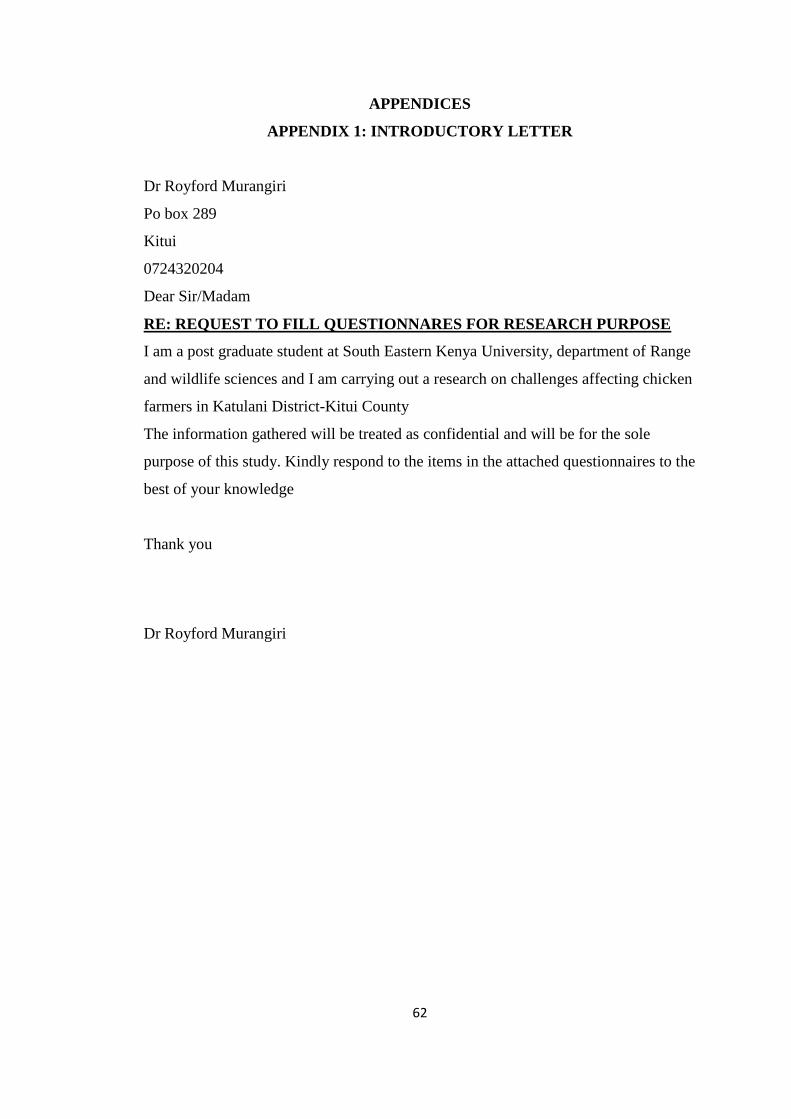
62
APPENDICES
APPENDIX 1: INTRODUCTORY LETTER
Dr Royford Murangiri
Po box 289
Kitui
0724320204
Dear Sir/Madam
RE: REQUEST TO FILL QUESTIONNARES FOR RESEARCH PURPOSE
I am a post graduate student at South Eastern Kenya University, department of Range
and wildlife sciences and I am carrying out a research on challenges affecting chicken
farmers in Katulani District-Kitui County
The information gathered will be treated as confidential and will be for the sole
purpose of this study. Kindly respond to the items in the attached questionnaires to the
best of your knowledge
Thank you
Dr Royford Murangiri

63
APPENDIX 2: QUESTIONNAIRE
QUESTIONNAIRE NO…… Date..............................................
SECTION A: GENERAL INFORMATION
Location________________________Village__________________________
Contact information: ________________________
1. Size of the household ________
2. Gender of the respondent (a) Male ( ) (b) Female ( )
3. Age of the respondent: 0-5 years--------------5-14 years…………+15 years………..
4. Level of education of the respondent (state formal years of schooling in
numbers)………….
5. Marital Status
a. Single ( ) b. Married ( ) c. Divorced/separated ( ) d. Widowed
( )
6. Employment status a. Employed ( ) b. Not employed ( )
7 i) What is your main source of livelihood?
a) Livestock b) crop cultivation c) mixed farming d) Others (specify)……
ii) What would be your monthly income estimate from the above mentioned
livelihood sources
Livestock …………Kshs/month
Crop cultivation………..Kshs/month
Mixed farming …………Kshs/month
Employment…………….Kshs/month
Others (specify)………..Kshs/month
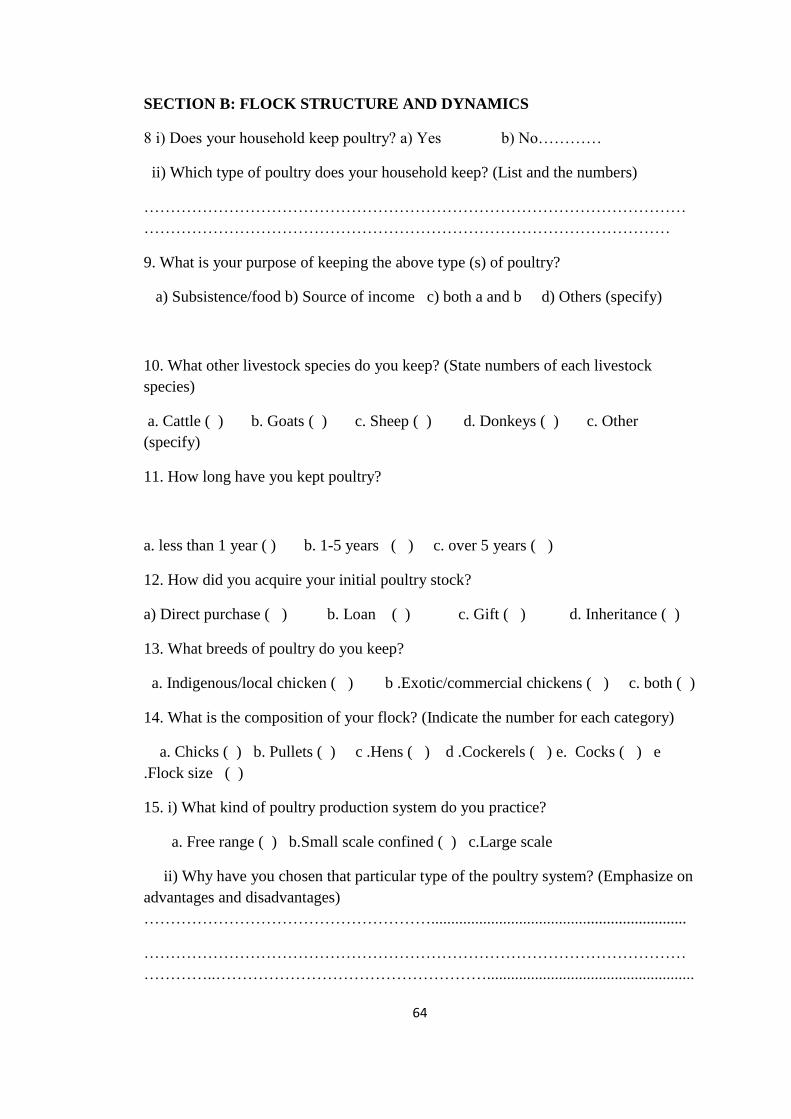
64
SECTION B: FLOCK STRUCTURE AND DYNAMICS
8 i) Does your household keep poultry? a) Yes b) No…………
ii) Which type of poultry does your household keep? (List and the numbers)
…………………………………………………………………………………………
………………………………………………………………………………………
9. What is your purpose of keeping the above type (s) of poultry?
a) Subsistence/food b) Source of income c) both a and b d) Others (specify)
10. What other livestock species do you keep? (State numbers of each livestock
species)
a. Cattle ( ) b. Goats ( ) c. Sheep ( ) d. Donkeys ( ) c. Other
(specify)
11. How long have you kept poultry?
a. less than 1 year ( ) b. 1-5 years ( ) c. over 5 years ( )
12. How did you acquire your initial poultry stock?
a) Direct purchase ( ) b. Loan ( ) c. Gift ( ) d. Inheritance ( )
13. What breeds of poultry do you keep?
a. Indigenous/local chicken ( ) b .Exotic/commercial chickens ( ) c. both ( )
14. What is the composition of your flock? (Indicate the number for each category)
a. Chicks ( ) b. Pullets ( ) c .Hens ( ) d .Cockerels ( ) e. Cocks ( ) e
.Flock size ( )
15. i) What kind of poultry production system do you practice?
a. Free range ( ) b.Small scale confined ( ) c.Large scale
ii) Why have you chosen that particular type of the poultry system? (Emphasize on
advantages and disadvantages)
………………………………………………................................................................
…………………………………………………………………………………………
…………..……………………………………………....................................................

65
..........................................................................................................................................
..........................................................................................................................................
16. What is the source of labour for your poultry production system?
a. Nuclear family ( ) b. Extended family ( ) c. Hired ( ) d. Others (specify) ( )
SECTION C: FACTORS INFLUENCING CHICKEN REARING
17. Indicate how the following factors influence chicken rearing in your farm? Rank
the factors whether an opportunity, major, minor or not a challenge.
Factors Opportunity Major
challenge
Minor
challeng
e
Not a
challenge
A Feeds availability and feed costs
B Diseases and parasites
C Theft/insecurity
D Availability of production poultry
skills
E Availability of veterinary/extension
services
F Costs of initial inputs-eg housing
G Availability of poultry rearing
technologies
H Access to credit
I Availability of quality chicken breeds
J Predators
K Climate effects
L Marketing and availability of markets
M Selling prices for chicken/eggs
N Water availability

66
O Labour availability
P Cost of drug and vaccination
Q Availability of land/space
R Others
SECTION D: TECHNOLOGY AND SERVICES ADOPTION
18 a) Do you normally carry out any poultry handling and management practices?
List them in order of priority.
i)
ii
iii
iv
v. etc
19 b) How frequently do you carry out the following poultry management practices?
Practice Regularly Occasionally Rarely Never
Vaccinations
Predator/rodent control
Feed supplementation
Housing
Brooding/hatching
Rearing improved chicks
(possess improved
cockerels)
Adoption of whole package
above
A. Yes ( ) B. No ( )

67
20. Do you have access to the following services?
Type of Service Yes No Sometimes Remarks
Access to extension services
If yes above who is the main
extension service provider and
how regularly
a)NGO
b)Government
Access to veterinary services
Access to credit
If yes above what is the source of
credit
a)Formal
b)Informal
Access to chicken rearing
trainings
Are you a member of any poultry
related group
Access to market/marketing
information
21.Which of the following factors influenced your use of above technologies and
support services? (Tick only the ones applicable to you)
Factor Tick
1 Awareness of their benefits
2 Cost of adoption/affordability
3 Technical Skills and/or knowledge of owner/staff
4 External factors e.g. government policies, infrastructure,
5 Availability of the technology and services

68
6 Culture
7 Ready market for the products
8 Others (Specify)
SECTION D: HEALTH MANAGEMENT
22 i) Have your poultry suffered from any disease(s)? a) Yes ( ) b) No ( )
ii) If Yes, how did you diagnosis the disease?
............................................................................………………………………………
…………………………………………………………………………………………
23 i) Have you ever used medication to treat any of the poultry diseases in your
farm?
a. Yes ( ) b. No ( )
ii) If Yes what medications are commonly/frequently used?
Decision Tick Remarks
Natural/traditional/herbal products
Drugs bought from agrovets/modern drugs
Both traditional and modern drugs
Other(please state)
24. If you have used any natural/traditional products, please list them below and the
health issues they address.
a) ………………………………………………………………………………………
b) ……………………………………………………………………………………….
c) ……………………………………………………………………………………….
d)……………………………………………………………………………………….

69
25. Which of the listed factors below influenced your choice of medication above?
(Tick where applicable)
Factor
Cost
Local availability
Accessibility
Its healing ability
Ease of administration
Risk of overdose
Local indigenous knowledge
Religion
Culture
26. Do you have any suggestions on how you can be supported to enable realize
maximum benefit from poultry production? (State the suggestion and who/ the
institution to address it
…………………………………………………………………………………………
…………………………………………………………………………………………
…………………………………………………………………………………………
…………………………………………………………………………………………
…………………………………………………………………………………………
Thank you for taking your time.