challenges in controlling lateness, absenteeism and …approvedthesis.com/hrm/su.pdf · 4.2 causes...
TRANSCRIPT
i
CHALLENGES IN CONTROLLING LATENESS, ABSENTEEISM AND
LABOUR TURNOVER. A CASE STUDY OF CHRIST APOSTOLIC
UNIVERSITY COLLEGE, KWADASO, KUMASI.
By
Philipine Aseye Kasu, BBA Management
© 2014 Department of Managerial Science
A Thesis submitted to the Department of Managerial Science, Kwame Nkrumah
University of Science and Technology in partial fulfilment of the requirements for the
degree of
MASTER OF BUSINESS ADMINISTRATION (HUMAN RESOURCE
MANAGEMENT OPTION)
School of Business, KNUST
College of Art and Social Sciences
July 2014
ii
DECLARATION
I hereby declare that this submission is my own work towards the Master of Business
Administration (Human Resource Management Option) Degree and that, to the best of
my knowledge, it contains no material previously published by another person nor
material which has been accepted for the award of any other degree of the University,
except where due acknowledgement has been made in the text.
Philipine Aseye Kasu ...................................... ..........................................
(PG 7638012) Signature Date
Certified by:
Mr. J. K. Turkson .................................................................................
(Supervisor) Signature Date
Certified by:
Mr. J. K. Turkson ......................................... ....................................
(Head of Department) Signature Date
iii
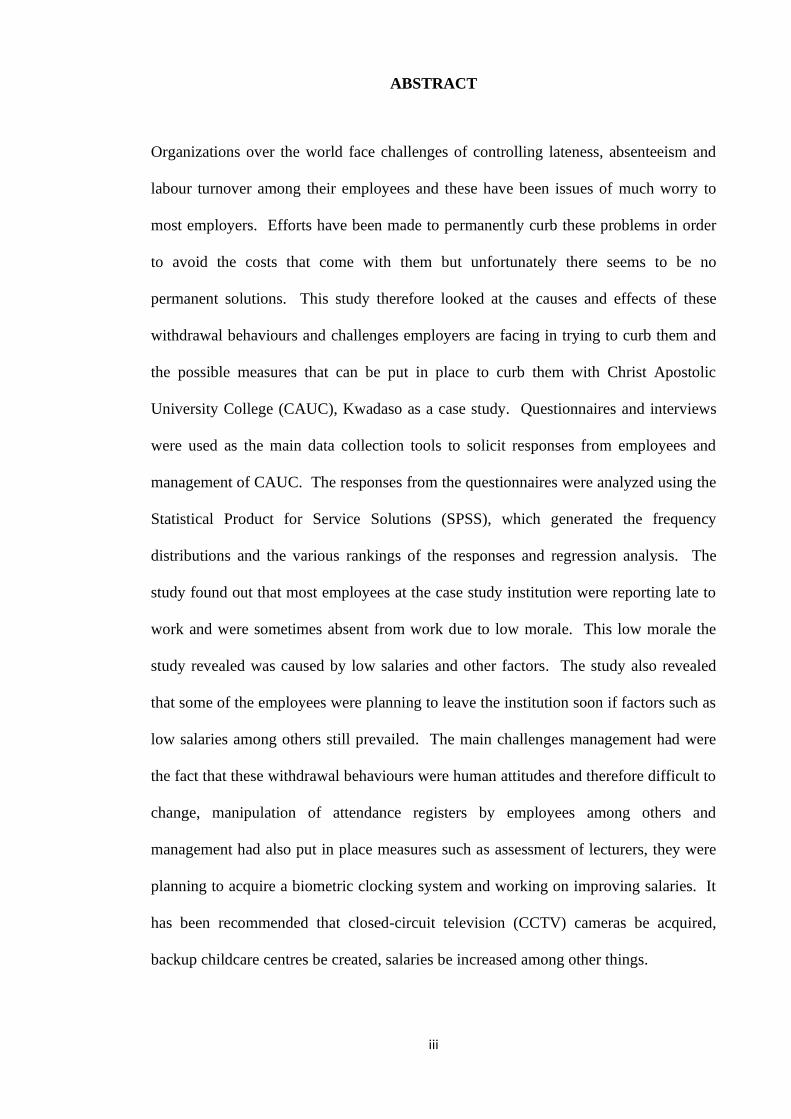
ABSTRACT
Organizations over the world face challenges of controlling lateness, absenteeism and
labour turnover among their employees and these have been issues of much worry to
most employers. Efforts have been made to permanently curb these problems in order
to avoid the costs that come with them but unfortunately there seems to be no
permanent solutions. This study therefore looked at the causes and effects of these
withdrawal behaviours and challenges employers are facing in trying to curb them and
the possible measures that can be put in place to curb them with Christ Apostolic
University College (CAUC), Kwadaso as a case study. Questionnaires and interviews
were used as the main data collection tools to solicit responses from employees and
management of CAUC. The responses from the questionnaires were analyzed using the
Statistical Product for Service Solutions (SPSS), which generated the frequency
distributions and the various rankings of the responses and regression analysis. The
study found out that most employees at the case study institution were reporting late to
work and were sometimes absent from work due to low morale. This low morale the
study revealed was caused by low salaries and other factors. The study also revealed
that some of the employees were planning to leave the institution soon if factors such as
low salaries among others still prevailed. The main challenges management had were
the fact that these withdrawal behaviours were human attitudes and therefore difficult to
change, manipulation of attendance registers by employees among others and
management had also put in place measures such as assessment of lecturers, they were
planning to acquire a biometric clocking system and working on improving salaries. It
has been recommended that closed-circuit television (CCTV) cameras be acquired,
backup childcare centres be created, salaries be increased among other things.
iv
ACKNOWLEDGEMENT
An academic work of this nature is an onerous one and one could not have
accomplished it without the assistance of a Supervisor, friends and well wishers.
I wish to thank the Almighty God for his care and guidance and also for granting me the
energy and wisdom which saw me successfully through this project.
My outmost gratitude goes to Mr. James K. Turkson my Supervisor for his guidance,
suggestions and selflessness throughout the research and presentation of the final work.
I also thank all staff of CAUC who offered me a lot of assistance and willingly provided
all the information that was needed.
Finally I extend my profound appreciation and gratitude to Mr. Jerry Jay Kraa a course
mate and a Graduate Assistant at the Kwame Nkrumah University of Science and
Technology and Mr. Joshua Kumi, the Accountant of Christ Apostolic University
College for their encouragement and contributions in diverse ways.
God bless you all richly!!!

v
DEDICATION
I dedicate this work to my mum Ms. Phyllis Emefa Senyo for her tireless efforts in
every aspect of my life and her free will to shoulder my needs even at the graduate
level. I LOVE YOU MUM.
vi
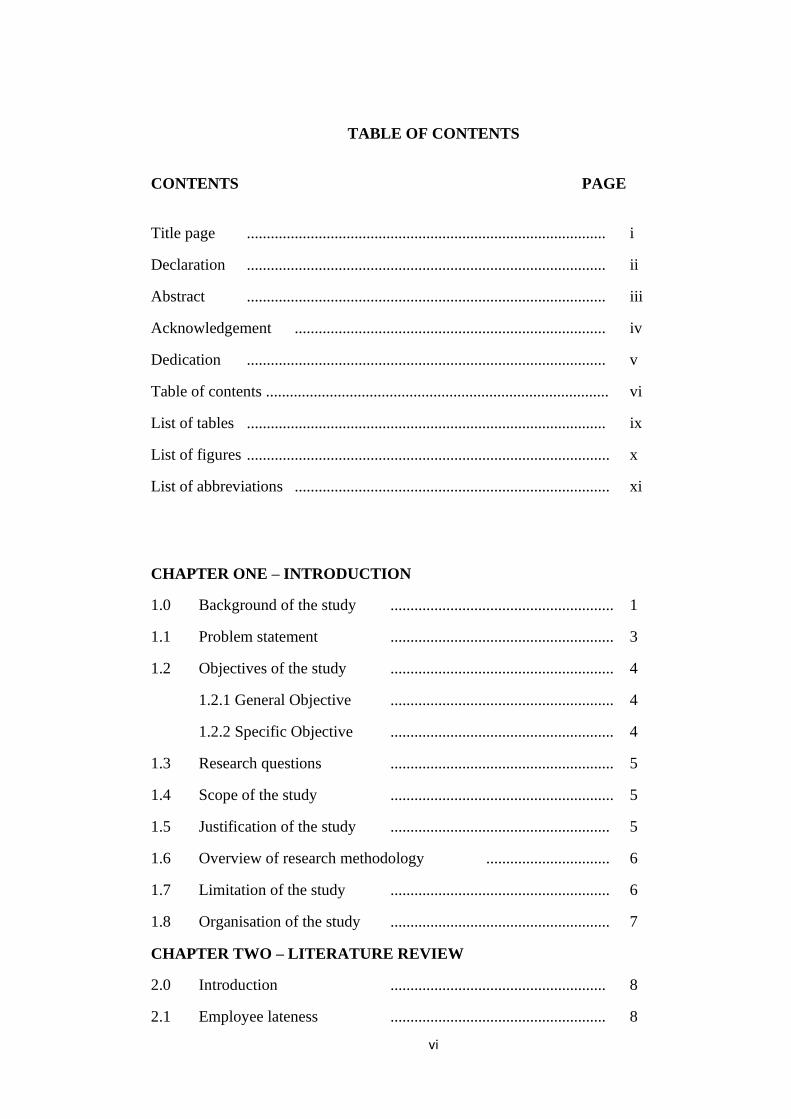
TABLE OF CONTENTS
CONTENTS PAGE
Title page .......................................................................................... i
Declaration .......................................................................................... ii
Abstract .......................................................................................... iii
Acknowledgement .............................................................................. iv
Dedication .......................................................................................... v
Table of contents ...................................................................................... vi
List of tables .......................................................................................... ix
List of figures ........................................................................................... x
List of abbreviations ............................................................................... xi
CHAPTER ONE – INTRODUCTION
1.0 Background of the study ........................................................ 1
1.1 Problem statement ........................................................ 3
1.2 Objectives of the study ........................................................ 4
1.2.1 General Objective ........................................................ 4
1.2.2 Specific Objective ........................................................ 4
1.3 Research questions ........................................................ 5
1.4 Scope of the study ........................................................ 5
1.5 Justification of the study ....................................................... 5
1.6 Overview of research methodology ............................... 6
1.7 Limitation of the study ....................................................... 6
1.8 Organisation of the study ....................................................... 7
CHAPTER TWO – LITERATURE REVIEW
2.0 Introduction ...................................................... 8
2.1 Employee lateness ...................................................... 8
vii
2.1.1 Causes of employee lateness ............................................. 8
2.1.2 Effects of employee lateness ............................................. 10
2.1.3 Measures used in controlling employee lateness ................ 11
2.1.4 Challenges in controlling employee lateness ..................... 12
2.2 Employee absenteeism ......................................................... 13
2.2.1 Types of employee absenteeism ................................. 13
2.2.2 Causes of employee absenteeism ................................. 14
2.2.3 Effects of employee absenteeism ................................. 16
2.2.4 Measures used in controlling absenteeism ......................... 17
2.2.5 Challenges in controlling employee absenteeism ............... 18
2.3 Labour turnover ..................................................................... 19
2.3.1 Types of labour turnover ............................................. 19
2.3.2 Causes of labour turnover ............................................ 20
2.3.3 Effects of labour turnover ............................................ 24
2.3.4 Measures used in controlling labour turnover ................... 26
2.4 Conceptual framework ………………………….... 27
CHAPTER THREE – METHODOLOGY AND
ORGANISATIONAL PROFILE
3.0 Introduction ........................................................ 29
3.1 Research design ........................................................ 29
3.2 Sources of data ........................................................ 29
3.2.1 Primary data ........................................................ 29
3.2.2 Secondary data ........................................................ 29
3.3 Population ........................................................ 30
3.4 Sample size ........................................................ 30
3.5 Sampling techniques ....................................................... 30
3.6 Data collection instruments ........................................................ 31
3.6.1 Questionnaire ........................................................ 31
3.6.2 Interview ........................................................ 31
3.7 Data analysis technique ......................................................... 31
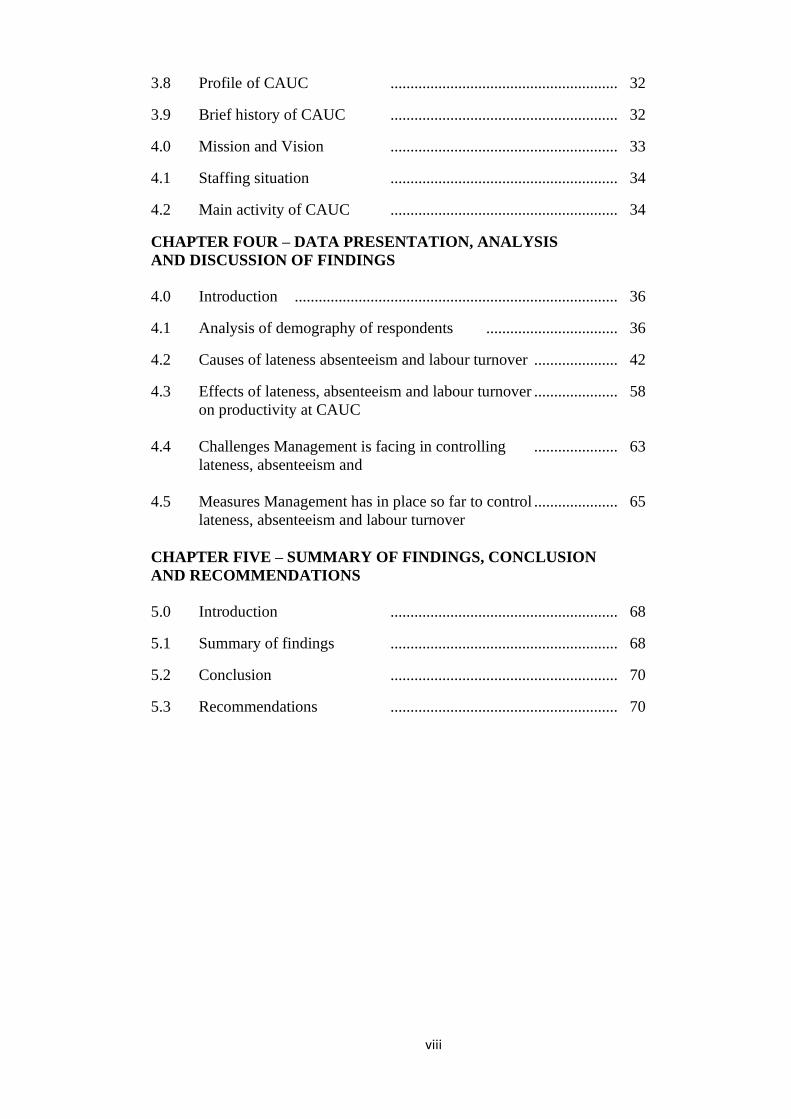
viii
3.8 Profile of CAUC ......................................................... 32
3.9 Brief history of CAUC ......................................................... 32
4.0 Mission and Vision ......................................................... 33
4.1 Staffing situation ......................................................... 34
4.2 Main activity of CAUC ......................................................... 34
CHAPTER FOUR – DATA PRESENTATION, ANALYSIS
AND DISCUSSION OF FINDINGS
4.0 Introduction ................................................................................. 36
4.1 Analysis of demography of respondents ................................. 36
4.2 Causes of lateness absenteeism and labour turnover ..................... 42
4.3 Effects of lateness, absenteeism and labour turnover ..................... 58
on productivity at CAUC
4.4 Challenges Management is facing in controlling ..................... 63
lateness, absenteeism and
4.5 Measures Management has in place so far to control ..................... 65
lateness, absenteeism and labour turnover
CHAPTER FIVE – SUMMARY OF FINDINGS, CONCLUSION
AND RECOMMENDATIONS
5.0 Introduction ......................................................... 68
5.1 Summary of findings ......................................................... 68
5.2 Conclusion ......................................................... 70
5.3 Recommendations ......................................................... 70
ix
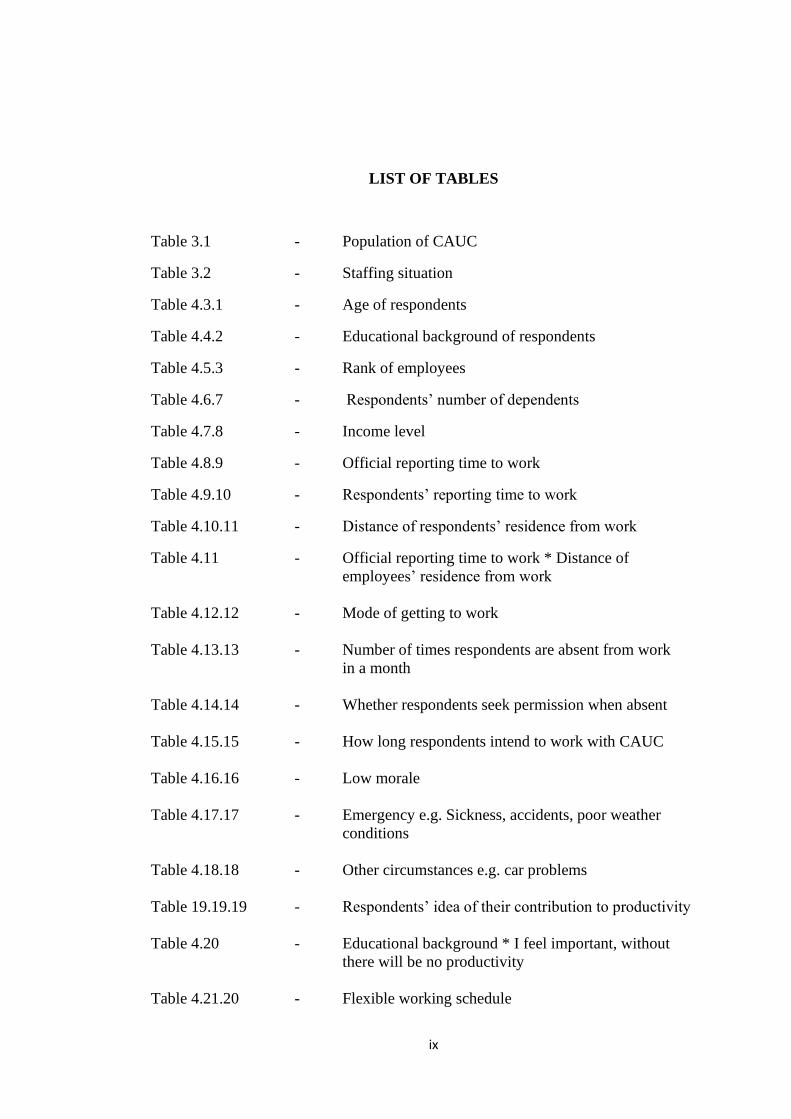
LIST OF TABLES
Table 3.1 - Population of CAUC
Table 3.2 - Staffing situation
Table 4.3.1 - Age of respondents
Table 4.4.2 - Educational background of respondents
Table 4.5.3 - Rank of employees
Table 4.6.7 - Respondents‟ number of dependents
Table 4.7.8 - Income level
Table 4.8.9 - Official reporting time to work
Table 4.9.10 - Respondents‟ reporting time to work
Table 4.10.11 - Distance of respondents‟ residence from work
Table 4.11 - Official reporting time to work * Distance of
employees‟ residence from work
Table 4.12.12 - Mode of getting to work
Table 4.13.13 - Number of times respondents are absent from work
in a month
Table 4.14.14 - Whether respondents seek permission when absent
Table 4.15.15 - How long respondents intend to work with CAUC
Table 4.16.16 - Low morale
Table 4.17.17 - Emergency e.g. Sickness, accidents, poor weather
conditions
Table 4.18.18 - Other circumstances e.g. car problems
Table 19.19.19 - Respondents‟ idea of their contribution to productivity
Table 4.20 - Educational background * I feel important, without
there will be no productivity
Table 4.21.20 - Flexible working schedule

x
Table 4.22.21 - Low salary levels
Table 4.23.22 - No opportunity for advancement
Table 4.24.23 - Delayed promotion
Table 4.25.24 - Respondents‟ opinion of causes of low morale at
CAUC
Table 4.26 - Low morale * Income level
Table 4.27 - Regression analysis
xi
LIST OF FIGURES
Figure 2.1 - Conceptual framework
Figure 4.2.4 - A pie chart showing category of respondents
Figure 4.3.5 - A pie chart showing gender of respondents
Figure 4.3.6 - A bar chart showing marital status of respondents
Figure 4.5.28 - A pyramid showing the agreement of respondents
xii
LIST OF ABBREVIATIONS
SPSS – Statistical Product for Service Solutions
CAUC – Christ Apostolic University College
CACI – Christ Apostolic Church International
NAB – National Accreditation Board
1
CHAPTER ONE
INTRODUCTION
1.0 Background of the study
Organizations over the world face challenges in controlling lateness, absenteeism and
labour turnover among their employees and these have been issues of much worry to
many employers. Efforts have been made to permanently curb these problems but
unfortunately there seems to be no permanent solutions. Lateness to work has been a
challenge of many employees due to personal and external forces. Lateness in
organizations bring both economic and psychological consequences on level of output
and organizations must strive to control and minimize it. When an employee arrives to
work late, it puts the whole organisation‟s production plan into disorder. This may go a
long way to affect productivity and therefore the organisation‟s effectiveness. If the
organization provides service, the employee‟s lateness may affect the quality and or
quantity of service offered, especially in a setup where one employee‟s output is the
other‟s input (Blau, 1994).
There are various researches that have been conducted on the question of how to reduce
absenteeism within organizations. There are various reasons why employees may
absent themselves from work. These range from illness, death of relatives, travelling
for funerals among others. According to Allegro and Veerman (1990) there are
(a) White absenteeism: In situations where the employee may be ill for example
having a high fever or broken leg may constitute white absenteeism.
(b) Grey: With grey absenteeism, the employee‟s illness is as a result of
psychological or psychosomatic, such as headache, stomach ache or tiredness
(c) Black absenteeism: An employee who is not ill at all reports himself or herself
2
sick constitutes black absenteeism also known as illegal absenteeism.
The ability of organizations to effectively control and manage absenteeism will
determine the impact on output of work in organizations. Sometimes, it is difficult to
determine if the employee has a genuine concern to absent themselves from work as
black absenteeism is controlled and at the discretion of the employee.
There have been attempts to understand why upon measures that are put in place by
organizations, there is prevalence of labour turnover. There is also an attempt to
understand management turnover and to ascertain why people quit their employment
career. Carbery et al., (2003) are of the view that, all other things being equal,
management turnover is likely to be lower than operational employees and this may be
as a result of the fact that they are more dedicated and sometimes have a stake in the
organization. There is also a consequence of labour turnover hindering the achievement
of broader business outcome as it involves a lot of cost in training, induction, growth
and skills development to replace employees who quit the organization. Controlling
labour turnover is important for organizations and must be efficiently dealt with because
of the impact on organizations. A substantial but often-overlooked direct cost is that of
hiring a person to cover absentee staff, a common practice in businesses leading to a
certain degree of turnover.
Lateness, absenteeism and turnover have been labelled by Hill and Twist (1955) as
withdrawal behaviours that work psychologists think is a product of unfavourable job
attitudes which are influenced by factors such as pay, job security, recognition and
appreciation, working hours and physical conditions among others. There are also
psychological withdrawal behaviours such as lack of creativity, minimal effort on a job
among others which often manifests in the form of laziness and refusal to think to
improve creativity (Pinder, 2008). The study therefore seeks to look at challenges in
3
controlling lateness, absenteeism and labour turnover using Christ Apostolic University
College (CAUC) as a case study.
1.1 Problem statement
Withdrawal behaviours in the form of lateness, absenteeism and labour turnover is very
costly to every organization even in developed countries like the United Kingdom (UK).
A research conducted into the Northern Ireland‟s Local Government Organizations
found that the economy lost about £250 million due to absenteeism of staff in the public
sector (Local Government Auditor, 1999).
DeLonzer (2005) estimated lateness of employees to cost the US businesses more than
$3 billion each year, absenteeism has also been estimated to cost about 15% of payroll
cost (Navarro & Bass, 2006) and cost of employing new workers as a result of turnover
has been estimated between 50% and 200% of those workers first year salaries (Fitz-
enz, 1997).
Many staff of the CAUC exhibit some of these withdrawal behaviours which are costly
to the organization. Many of the staff report late to work resulting in delays in
administrative and academic schedules and therefore fall in productivity. Sometimes,
some employees absent themselves without permission and when permission is sought
it is sought late creating difficulties in arranging replacements. The CAUC is in its third
year of existence and four employees have resigned.
The core aim of every organization is to maximize profit and therefore any form of cost
should be eliminated. It is therefore against this background that the researcher seeks to
identify measures that the CAUC can use in controlling lateness, absenteeism and
labour turnover (withdrawal behaviours), the possible challenges it will face trying to
curb them and the solutions to these challenges.
4
1.2 Objectives of the study
The objectives of the study are grouped into general objective and specific objectives.
1.2.1 General objective
The overall objective of this study is to ascertain the challenges in controlling lateness,
absenteeism and labour turnover.
1.2.2 Specific objectives
Specifically, the study seeks;
(a) To investigate causes of lateness, absenteeism and labour turnover among
employees of Christ Apostolic University College.
(b) To ascertain the effects of lateness, absenteeism and labour turnover on
productivity
at Christ Apostolic University College.
(c) To identify the challenges management face in controlling lateness, absenteeism
and labour turnover among employees of Christ Apostolic University College.
(d) To examine the measures management is putting in place in controlling lateness,
absenteeism and labour turnover among employees of Christ Apostolic
University
College.
1.3 Research questions
The following research questions were set in order to achieve the objectives of the
study:
(a) What are the causes of lateness, absenteeism and labour turnover among
5
employees of Christ Apostolic University College?
(b) What effects do lateness, absenteeism and labour turnover have on productivity
at Christ Apostolic University College?
(c) What challenges is management facing in curbing lateness, absenteeism and
labour turnover among employees of Christ Apostolic University College?
(d) What measures is management of Christ Apostolic University College putting in
place in controlling lateness, absenteeism and labour turnover among
employees?
1.4 Scope of the study
The focus of the study is on employees‟ lateness, absenteeism, and labour turnover at
Christ Apostolic University College. The research was limited to management and staff
at CAUC, Kwadaso, Kumasi. Management comprised of the President and the
Registrar. Staff comprised of both teaching and non-teaching staff.
1.5 Justification of the study
The study is important as it will contribute to dealing with lateness, absenteeism and
labour turnover. The research will serve as a guide and successive tool for potential
entrepreneurs and organizations that want to enter the education industry to know the
value of effective management of employees with respect to lateness, absenteeism and
labour turnover. This study will therefore serve as a successive tool for educational
institutions battling with these challenges. Also, the research will help Management of
CAUC in restructuring their human resource capabilities by putting strategies in place
to control lateness, absenteeism and labour turnover. The study will in this regard be
very useful in employee retention and minimizing the negative effects of lateness,
absenteeism and labour turnover. The study will serve as a base for further research for
6
students, consultants, teachers and others who are interested in the study of similar
topic. It will also serve as an academic reference in Human Resource Management and
Management related disciplines.
1.6 Overview of the Research Methodology
The population of this study comprised of Staff and Management of CAUC. The study
relied on both primary and secondary sources of data. Secondary sources of
information included literature from journals, textbooks, manuals, reports, and
publications and articles from the internet. The primary sources of data required
information from respondents through filling of questionnaires concerning the research
under study. Data collected were subjected to critical analysis and examinations to
enable the researcher come out with findings. Statistical Product for Service Solution
(SPSS) was used to facilitate the analysis.
1.7 Limitation of the study
The researcher was limited by the reluctance of some respondents to complete the
questionnaires promptly and also provide some of the information required. Some of
the respondents were economical with information: possibly they thought the researcher
could be an agent of management.
1.8 Organization of the study
The study is divided into five chapters:
Chapter one which is on introduction captured the background of the study, problem
statement, objectives of the study, research questions, justification of the study, scope of
the study, limitations of the study and organization of the study. Chapter two reviews

7
existing literature on lateness, absenteeism and labour turnover and their relevant
dimensions. Chapter three discusses the methodology used to accomplish the study.
Chapter four explores and discusses research findings and analysis of data that were
collected. Finally chapter five looks at the summary of findings, conclusion and
recommendations.
8
CHAPTER TWO
LITERATURE REVIEW
2.0 Introduction
This chapter presents the literature for the study. It focuses on findings from previous
studies with regard to lateness, absenteeism and labour turnover. It highlights the
theoretical perspective under which major concepts are discussed. The chapter also
expands the definition of these three issues and their causes, effects on organizations,
measures that can be used in controlling them and the possible challenges one will face
in trying to control them.
2.1 Employee lateness
Lateness behaviour can be described as arriving at work after the scheduled time
(Shafritz, 1980). Mobley (1987) described lateness, absenteeism and labour turnover as
withdrawal behaviour. Compared to the latter behaviours, lateness is a milder form of
withdrawal. Another distinctive characteristic of lateness is that, it can be controlled by
the employee unlike dismissal by an employer or absenteeism due to sickness. Most of
the lateness occurrences can be avoided (Sagie, 1998). Employee lateness is where an
employee goes or reports to his/her workplace late than the expected reporting time.
Example is when an employee reports to work at 9 o‟clock instead of 8 o‟clock.
2.1.1 Causes of employee lateness
Various causes of employee lateness have been postulated by various researchers.
Some of these are discussed below;
(a) Low morale
9
The level of employee morale is a key factor considering causes of lateness. No
compensation or workplace mistreatment on the side of leaders will help employees
have many reasons not showing up for work on time (Ralston, 1989).
(b) Illness
Workers who work long hours than they should or employees who are forced to work
long hours or are deliberate workaholics can force themselves into depression, tiredness
or physical pain. With this, it will be difficult to encourage themselves to attend work
on scheduled time (Richard and Slane, 1990).
(c) Arrogance
Some staff will think they are very important and without them there is going to be low
productivity, others may feel their work cannot be done by anyone else and therefore
may not obey rules. Managers must ensure discipline for lateness and follow work
rules. Failure to do so can cause dislike and loss of respect from fellow workers and
other workers may feel not valued and this may lead to late show up at work (Blau,
1994).
(d) Emergencies
Household crises, poor weather conditions or car accidents are incidents bound to
happen and thus employers should not find fault with; however, workers must alert their
employers immediately such incidents happen for courtesy and responsibility sake. In
the case of emergencies if they fail to do so, employers must call their employees to
know how they are doing (Barton, 1994).
(e) Minor circumstances
According to him, Lateness to work is sometimes caused by situations beyond workers
capabilities. Traffic jams, car problems or public transit issues are few things that
workers cannot avoid because it is part of life. In such conditions, it is expected of
managers to show understanding and flexibility on the side of workers. Management‟s
10
failure to do so can make the employee feel oppressed or afraid, resulting in low morale
at work and in turn, less output. But there are exceptions when a particular employee
frequently faces these problems, then there can be lies somewhere.
2.1.2 Effects of employee lateness
Some of the effects of employee lateness are;
(a) Low productivity
Employee lateness can negatively affect the productivity level of an organization. It
may negatively affect the performance of the late employee as well as the entire unit‟s
productivity (Blau, 1994).
(b) Low morale
In addition, employees who report late to work may reflect low motivation, discontent
at work and low commitment to the organization which may affect other employees
(Jamal, 1984). From the late employee‟s point of view, lateness behaviour may indicate
an initial withdrawal from work that may deteriorate toward more severe forms of
withdrawal such as absenteeism and turnover (Dolman-Singer, 1997).
(c) Cost
For the organization, lateness has many financial and non-financial costs. The effect of
an employee arriving late to work is the interruption and delay in the start of service for
any client and needs to be controlled. Additionally, management‟s responses to late
arrivals may include the recording of the late occurrences in the individual‟s file,
disciplinary reviews and outright punishment. In view of such responses, lateness could
indeed be considered a costly behaviour for the involved employee (Dolman-Singer,
1997).
2.1.3 Measures used in controlling employee lateness
11
Below are some of the measures that management can effectively put in place to control
lateness as postulated by various authors.
(a) Time register
Most organisations use and keep registers to register latecomers with the time they
report to work. The purpose is to keep records, particularly of regular latecomers, and
to build a history of how the organisation goes about dealing with such late comers
(Squelch, 2000). It is very important if the register is kept at the manager‟s office
instead of the reception to make the exercise a success else employees will abuse the
exercise. Concerning using the register as a tool to minimise lateness in the
organisation, to effectively discourage lateness, organisations should not rush the
marking of registers but rather keep their registers open for a reasonable time
(recommended maximum 30 minutes) for employees to sign after which it will be
closed (Hallam and Roaf, 1995). Where employees miss the register within the
stipulated time and fail to provide an adequate explanation, it constitutes truancy, and
thus should be marked absent for that day even though they will and should face
disciplinary action.
(b) Punishment and counselling
Management can eliminate employee lateness sometimes through punishments and
counselling. There are many reasons why an employee will be late to work. Therefore,
counselling can bring forth these reasons for it to be solved. On the other hand, if the
reasons are not reasonable, then management can punish the employee (Greenberg,
1995).
(c) Strict policies
Human resources departments need to have strict policies regarding not only lateness,
but professional conduct as well. Managers need to reward good performance at work
12
with bonuses and thanks. Also lateness must be attended to professionally, with
emphasis on helping the employee improve.
2.1.4 Challenges in controlling employee lateness
Inasmuch as organizations aspire to control lateness in organizations, there are
challenges that impede the smooth measure of control. It has been observed in
organizational behaviour literature and especially in the educational domain that
lateness is a variable related to general job attitudes of employees, such as
organizational justice and organizational commitment of staff to comply with the
directive (Bowers, 2001). Thus, inasmuch as the organisation tries to control lateness,
attitude and commitment of employees are paramount since they pose a challenge to
controlling such employees. It is worth noting that, a positive general attitude toward
the organization by an employee does not necessarily signify that the employee believes
it is important to appear regularly and timely at the workplace hence can pose a
challenge to controlling lateness (Koslowsky, 2009).
Voluntary absenteeism is a major contributory factor to controlling lateness in an
organisation. Sagie (1998) states that voluntary absenteeism which is under the direct
control of the employee and is frequently utilized for personal issues can be used as an
excuse by employees to become habitual late comers and involuntary absenteeism,
which is usually beyond the employee‟s immediate control such as unexpected
bereavement or happening, could also pose a challenge to controlling lateness. For
example an employee who hears a sudden death of a relative may want to pay
condolence to the bereaved family before proceeding to work and this is difficult for
management to control.
13
2.2 Employee absenteeism
Many authors tend to give their opinions and explanation to what constitutes
absenteeism since absence behaviour continues to attract researchers and managers
because of its prevalence among employees in many organizations (Steel, 2003).
Absenteeism can be described as any failure of an employee of an organization to report
for or to remain at work as scheduled, regardless of the reason (Cascio, 2003). It has
also been explained in a broader perspective that, absenteeism can be viewed as part of
withdrawal syndrome where employees react to undesirable working conditions by
behaviours designed to distant themselves from work, including lateness and the intent
to leave the job (Johns, 2003). From the above, one theme that runs through all the
definition is that, once the employee avoids work voluntarily or involuntarily, it
constitutes absenteeism.
2.2.1 Types of employee absenteeism
There are three main different categories of absence according to Nel (2001), namely:
sick absence, authorized absence and unexcused absence. These three are discussed
below:
(i) Sick absence
This occurs when a person is absent due to a reported illness, whether the illness is
genuine or not. A company‟s policy will usually state at what stage a medical
certificate is required, example after two days off.
(ii) Authorized absence
This occurs when the employee is absent for any reason other than illness, and it is
accepted by management. Employees should be encouraged to seek permission before
14
hand if the situation allows for it so that alternative arrangements can be made for
replacement.
(iii) Unexcused absence
This is when an employee is absent without permission and does not even inform the
employer of such unauthorized absence. This is considered as unacceptable and should
not be tolerated by the company‟s management. Disciplinary procedures are usually
used to handle this problem.
2.2.2 Causes of employee absenteeism
Various causes of employee absenteeism have been postulated by various researchers,
some of these are discussed below;
(a) Low commitment to work
Individuals‟ commitment to work, according to the discovery of Wooden (1995) is one
of the most important factors that influence absenteeism is individuals‟ commitment to
the organization. Attendance of employees to work is influenced by the higher levels of
commitment to their organisation, meaning employees who are highly committed to
their organizations report to work regularly as compared to those with low levels of
commitment to their organisations.
Commitment to the organisation as well as the involvement of employees in their jobs
are factors that can predict absenteeism. This was revealed by a research conducted by
Blau (1986). Individuals who are highly committed to their organisations and highly
involved in their jobs display few cases of absenteeism at work as compared to
individuals with a low commitment to their organisation and little involvement in their
jobs.
(b) Personal characteristics
Two of the personal characteristics are discussed below;
15
(i) Gender:
A research conducted by Steel and Rentsch (1995), found out that women will be absent
from work more than men. One reason is the traditional labour division in the family,
according to which women have more than an equal share in child raising and
housework. The second reason is the typically lower status of women‟s employment,
leading to a greater motivation to be absent from work (VandenHeuvel and Wooden,
1995). However, results pertaining to gender effect on absenteeism are not consistent.
In their study of American teachers, Scott and McClellan (1990) found that women
tended to be more absent on working days than men, but absenteeism frequency was not
different in the two genders.
(ii) Number of children:
Studies on family commitments showed that children and their ages affected
absenteeism. In an Australian study VandenHeuvel and Wooden (1995) found out that
married people who also had children were often late no matter their gender. Bridges
and Mumford (2001) also found that mothers whose children were younger than 2 years
were often late than their male counterparts in the same situation, but the situation
changed when their children grew older. Judge et al. (1997) also showed that the
number of children optimistically affected absenteeism because of family commitments
such as child care. Muchinsky (1977) also confirmed this finding.
(c) Occupational characteristics
The following are some of the occupational characteristics identified and discussed;
(i) Seniority:
Most findings on the relationship connecting seniority and absenteeism have not been
consistent. In past studies, Price (1995) reported both a negative relationship of
seniority with absenteeism and Kohler and Mathieu (1993) reported none at all.
16
However, in unionized workplaces, unions offer protection in the form of job security
that may reduce cost of absenteeism to the individual.
(ii) Position level:
Johns (1997), revealed that the higher an employee‟s position the lower his rate of
absenteeism. Schwarzwald et al., 1992 found that most employees who provide service
were absent because their promotions were delayed. Also, among health-care workers,
position of employees was one of the highest predictors as compared to other indicators
such as personal and occupational demographic variables (Goldberg and Waldman,
2000).
(iii) Salary:
Studies show that higher-salaried employees tend to be less absent. Winkelmann (1999)
found out that the salary of German employees did not have any relationship with
absenteeism and this was confirmed by Globerson and Ben-Yshai (2002) with regard to
Israeli teachers. Hackett (1990) showed that job satisfaction described the connection
between salary level and absenteeism.
2.2.3 Effects of employee absenteeism
Employee absenteeism could have effect of productivity and an organisation‟s financial
and administrative costs. These are discussed below;
(a) Decrease in productivity
When employees are absent from work, others would be required to work extra hours to
train new temporary replacements or relieve staff replacing the absent employee and
this can affect their overall productivity and output (Goldberg and Waldman, 2000).
(b) Financial cost
17
He also added that this could be additional cost associated with the payment of overtime
to those tasked to perform the duty of the absent worker. Also there is cost of re-
training or induction of the replacement workers in that particular post. In addition, the
company would also bear the wage costs of any replacement employees.
(c) Administrative costs
Administration will also spend time to recruit new replacements, reassign other
employees and these are cost to the organization. Additional management is required to
maintain administrative systems dealing with any control measures for absenteeism.
(Hackett, 1990).
2.2.4 Measures used in controlling absenteeism
Whilst some companies use disciplinary actions to curb the situation, some also use
incentives. Whichever option a company decides to use will depend on how important
the company considers the issue of absenteeism. These measures discussed below are
options available to organisations in controlling absenteeism according to various
researchers.
(i) Absence management programmes
Organizations can have disciplinary controls when cases of absenteeism become severe.
A system can be put in place to find out those who pretend to be sick when they are not,
for example asking them to provide an evidence from a Doctor confirming they are sick.
In a situation where their evidences are not satisfactory, then their salary may be
reduced or they will be made to forfeit their personal days such as leave (Poirier 2003)
(ii) Childcare
Organizations can create centres to help in the childcare of their employees to enable
them concentrate on work. In a study by Brown (1999), he revealed that a company
saved more than 2,500 lost days in one year, for creating a backup child-care program to
18
enable parents to send their kids for care rather than miss work days simply because
their babysitters could not show up. A corporate day care centre can help curb the issue
of absenteeism.
(iii) Incentives
The use of incentives to curb absenteeism is called the “carrot approach”. This
incentive system can be used in several ways and one is that employers pay employees
for any sick or off day not used at the end of every year. According to Neuborne 2003,
employers who used this approach confirmed that it worked for them. Some
organizations see this approach as too much cash invested and therefore rather pay for
perfect attendance. Other companies offer time off for perfect attendance each quarter
and a day‟s pay at the end of the year (Truman, 2003). Some companies also offer a
company party, a company picnic, or a corporate gift for perfect attendance (Poirier,
2003).
2.2.5 Challenges in controlling employee absenteeism
It is important to put measures in place to control absenteeism. However there are
certain factors that pose as a challenge to achieving this objective as many employees
put sort of legitimate reasons to prevent management from successfully controlling
absenteeism. Patton (2011) observed that, legitimacy predicted a host of reactions to
replicate absence scenarios, including judged responsibility, anger, sympathy, intention
to punish and intention to help. Many employees legitimately lie and absent themselves
from work in the quest of running their own errands. It can be ascertained that,
potential of legitimacy has been used by employees as a useful tool to absent
themselves from work and employees who saw absence as more legitimately reported
engaged in more absence (Johns, 2008). Other employees also used minor illnesses
19
which may not even affect them to legitimately absent themselves from work and they
turned to endorse such practices from others (Harvey and Nicholson 1999).
2.3 Labour turnover
Labour turnover is the rate at which an employer loses employees and replaces them.
Simply, it is "how long employees tend to stay" or "the rate of traffic through the
revolving door" (Wooden, 1995). The rate of labour turnover can be measured by
dividing the number of employees that are leaving the company by the total number of
employees of the company multiplied by hundred. High turnover becomes a
disadvantage when skilled workers leave and are replaced by unskilled workers. High
labour turnover in a company may be attributed to factors like, poor working conditions,
boredom at work place, poor job description, poaching and etc. (Kaye, 1999)
2.3.1 Types of labour turnover
Labour turnover can be grouped as internal and external. Internal labour turnover
occurs when current employees are promoted, new responsibilities are added to job
titles and bringing in entry-level employees due to company growth. External turnover
is when employees leave to other companies to seek jobs, raise families or enter
retirement. It has both positive and negative influences on an organisation. Positive
turnover creates new jobs due to a company's expansion, whiles negative turnover
demonstrates a contraction of company finances due to hard times (Neuborne, 2003)
2.3.2 Causes of labour turnover
The causes of labour turnover can be grouped into internal and external. These are
explained below;
(a) Internal causes
20
This is termed as the Peter‟s principle which states that as people get promoted to higher
levels in their jobs, they become less competent because doing well in one position does
not guarantee doing well in another. It simply means that as employees rise to the top,
they rise to their level of “incompetence”. (Wood and Macaulay, 1991).
(i) Organizational performance
Organizations that recognize themselves to be facing some difficulties economically
raises the spectre on its decision to lay-off some of its employees. In such cases,
employees are made to find employment in different organizations (Taylor 2002)
(ii) Structure of the organization
The decisions of turnover and the rate of turnover can be affected by employees‟
satisfaction with their existing jobs which is often influenced by several factors such as
the system of reward for employees, the organization‟s ability to get employees to
commit themselves to the organization as well as creating a feeling of shared aims and
goals within in the organization.
(iii) Job characteristics
The characteristics of a job as revealed by Brownell and Judi (1998) have stated that
employees in the hospitality sector are continuously faced with problems and
uncertainties about their jobs each day. According to Taylor (2002), some jobs are
naturally more attractive than others. There are several factors which affect the level of
attractiveness of jobs, some of which are the level of repetitiveness in the job, the
challenges involved, the changes that are encountered, benefits to be derived as well as
the degree of the sense of accomplishment. The job position is also an essential factor
which influences labour turnover just as the other factors.
(iv) Employees unrealized expectations
21
Job applicants‟ inadequate knowledge and skills about the job and their unrealized
expectations at the time of the reception of the job offer is also one of the causes of
labour turnover. Employees get disappointed and choose to leave their existing job
when they discover that their expectations are unrealistic.
(v) Demographic factors
In the examination of the factors that contribute to labour turnover Mitra et al. (1992)
found out that turnover was connected to certain conditions with regards to the features
of demography and biography of employees. This research played a crucial role to
explaining the performance of the labour market and makes possible the process of
linking workers to various organizations and the quality of the employment relationship
that exist. The trend of turnover has crucial possible effects for the establishment of
wages, work arrangements, success of the job and the increase in precise human capital
needed. The research again showed that lifestyle factors examples of which are
drinking or history of employment such as a frequent change in jobs can be used as an
implicit grounds to screen applicants as a means of checking such bio-data in way of
empiricism.
(vi) The individual
More to the already discussed causes of labour turnover are certain factors which are
particularly related to the individual and have the potential to affect the rate of turnover.
These factors consist of personal and character traits. Personal factors consist of
instances such as changes in the situation of the family, the desire to learn a new skill or
trade or an unsolicited offer. With reference to Mobley (1997), there are some aspects
of character traits which influence labour turnover in addition to the personal factors.
These character traits include the very factors that determine performance on the job,
negative behaviours such as absenteeism, production damages, tardiness and damages
22
to work equipment. These traits can be examined and used as a basis to screen
employees to find persons that will show a low level of turnover instances.
(vii) Complacency
The idea of complacency can also be said to be among reasons a final stimulator.
When an employee gets enough experience on a particular job, they feel their current
job is no more challenging and decide to find new jobs that suite their qualification and
experience (Mobley, 1997).
(b) External causes
External factors that cause turnover are present outside the organizational environment
and are not under the control of management (Nankervis et al., 1996). The
organization‟s policies, practices, strategies and human resource management plans can
be affected by external factors such as political, social and commercial environment.
Wood and Macaulay (1991) present the external causes of employee turnover in the
following ways:
(i) The economy
The existence of higher paying jobs is one of the major and common reasons employees
give as their basis for leaving their present employment. In a booming economy, the
existence of different jobs contributes to labour turnover, but this happens to be serious
during employees exit interviews.
(ii) Better pay in different jobs
A number of employees think they deserve to be paid an amount which is more than the
actual pay given to them by their employers. There is an intrinsic difference between
the amount individuals feel they should be paid for the work they do and the amount
organizations spend to compensate employees. In an additional argument, labour
23
turnover is experienced when the disparities between employees pay expectations and
organization‟s compensation becomes too wide and a different employment opportunity
emerges for employees. Pay refers to the wages, salary or compensation organizations
give to an employee in exchange of the services rendered to that organization. Gupta
and Shaw (2001) argued on pay to be the most important reason why employees are
members of an organization. Compensating employees with high possible wages is the
main and obvious way of dealing with the need for pay.
(iii) Pay increment in different organizations
One of the causes of disagreement between employers and their employees is the
shortage of reasonable payment distribution of wages and salaries (Kusluvan, 2003). It
is therefore essential to realize the significance of every job and get rid of factors that
are likely to bring about dissatisfaction to employees on their job. Phillips and Connell
(2003) in their conclusion stated that it is important to employ a method or system in
assessing jobs in order to give fair wages and salaries to employees. Considering the
fact that employees leave their jobs on their own without being dismissed by their
employers, it is the sole duty of employers to retain their employees. It is based on this
reason that employers should interview employees to examine their reasons for quitting
the job. The exit interview is likely to uncover particular information on the
employment conditions, conditions of employment of the competitive organization, the
level of quality of supervision as well as the training and selection procedures of the
organization.
(iv) A strong local or regional economy
In their further researches Phillips and Connell (2003) made a proposal that most
industrialized nations and a lot of developing countries have undergone a wide growth
in their economy. As the economy expands, growth in job opportunities will be existent
with the growth in the economy which gives a direct implication on the creation of new
24
job opportunities as a result for employees to leave their present job for different
employment.
(v) Low quality of employees overall
There is an increase in labour turnover in situations where the unemployment rate is low
due to the availability of more jobs according to Blotch (2001). He goes on to argue
that anytime there was a significant fall in the level of unemployment by a rate of 5% or
a lesser figure, it brings employers to face a serious problem of seeking employees to
fill vacant job positions in their organization. The degree of the problem is made worse
in situations where there is a decrease in the availability of employees with specific
skills.
2.3.3 Effects of labour turnover
Labour turnover has an important effect on the organization, the individual as well as
the management of the organization. Hiemstra (1990), states that considering the effect
of labour turnover on the organization, there is the possibility of an organization
accruing cost directly in the recruitment of new employees, low quality production
practices, decrease in production standards and a high cost in training and replacing
employees. Fair (1992) also gave a suggestion that there are several costs which come
with labour turnover. These consist of cost of separation of employees (exit interviews
and severance pay), cost of recruitments (advertising vacant positions and searching
fees), cost of selection (during interviews and checking of applicants references) cost of
hiring of employees (during induction and initial training) expenses incurred on
relocation, cost of working attires, cost involved in the loss of production which is often
connected with vacant positions not being occupied and the learning pace of new
employees. The author further stressed that it is possible for the skilled workers who
have quit their job to be given employment opportunity by competitive organizations in
the same industry.
25
The divulging of an organization‟s important information to competitive organizations
by employees who have left the job according to Ubeku (1975) is a serious effect of
labour turnover. The author furthermore noted that the unrealized training given to
workers who have quit the job can influence other workers in the organization to leave
their job and take employment from different organizations. .
Despite the negative impacts associated with the increase in the level of labour turnover,
such as the incurrence of costs by the organization, a break in the organizational plan
and existing projects as well as several challenges to the organization, labour turnover
impacts positively on the organization to some extent. These positive impacts are
derived in the replacing of employees who have quitted the job with new employees
who are likely to introduce new experiences, more knowledge, new practices and new
skills into the organization (Fair, 1992). Labour turnover has the potential of bringing a
renewal in all aspects of the organization. Though a high level of turnover is costly, a
low level in turnover can bring about rescuing losses. In addition to this, competent
employees who are given unsatisfactory compensation for the job they do get the
chance to replace employees with higher compensation for the same job. Turnover
lastly makes it possible for the organization to get rid of poor performing employees,
employees with low morale as well as employees who do not corporate with the
organization‟s rules and regulations (Ubeku 1975) .
2.3.4 Measures used in controlling labour turnover
Labour turnover can be remedied at its early stage before it becomes a serious problem
when the major signs are analyzed and acted upon. This makes it possible for the
organization to effect changes and improve decisions related to their employees as a
means of decreasing factors that influence labour turnover. According to Mobley
(1977), providing employees with a safe working environment and benefits can boost
26
the satisfaction of employees with their job which will help decrease the instances of
turnover in the organization.
Accessing the effect of labour turnover among employees, it is worth putting
appropriate measures and strategies in place to control it. Human resource management
practices have been recommended to management as potential control measures for
turnover, such as investment in training and development of employees, offering
organizational support in all aspects, adopting prudent recruitment and selection
processes in selecting job applicants, offering better career opportunities for employees
to aspire for (Hinkin and Tracey, 2000). There is a critical factor in making sure that,
employees are satisfied with their jobs through increased satisfaction. Controlling
labour turnover could be achieved through adopting measures to increase job
satisfaction and commitment among employees (Aksu, 2004). Employee relation
management approach is also key in controlling labour turnover among employees. It
has been ascertained that the role of employee relations practices and high levels of
labour turnover are seen as mitigating the achievement of broader business outcomes as
involvement in recruiting (including advertising), training, induction, growth and skill
development, and quality represent a direct cost to the organization (Hinkin and Tracey,
2006). It is clear from the above submissions that, the ability of firms to put appropriate
strategies in place right from recruitment and selection, on the job training till the
employee is at a retiring age is important in controlling labour turnover among
employees.
27
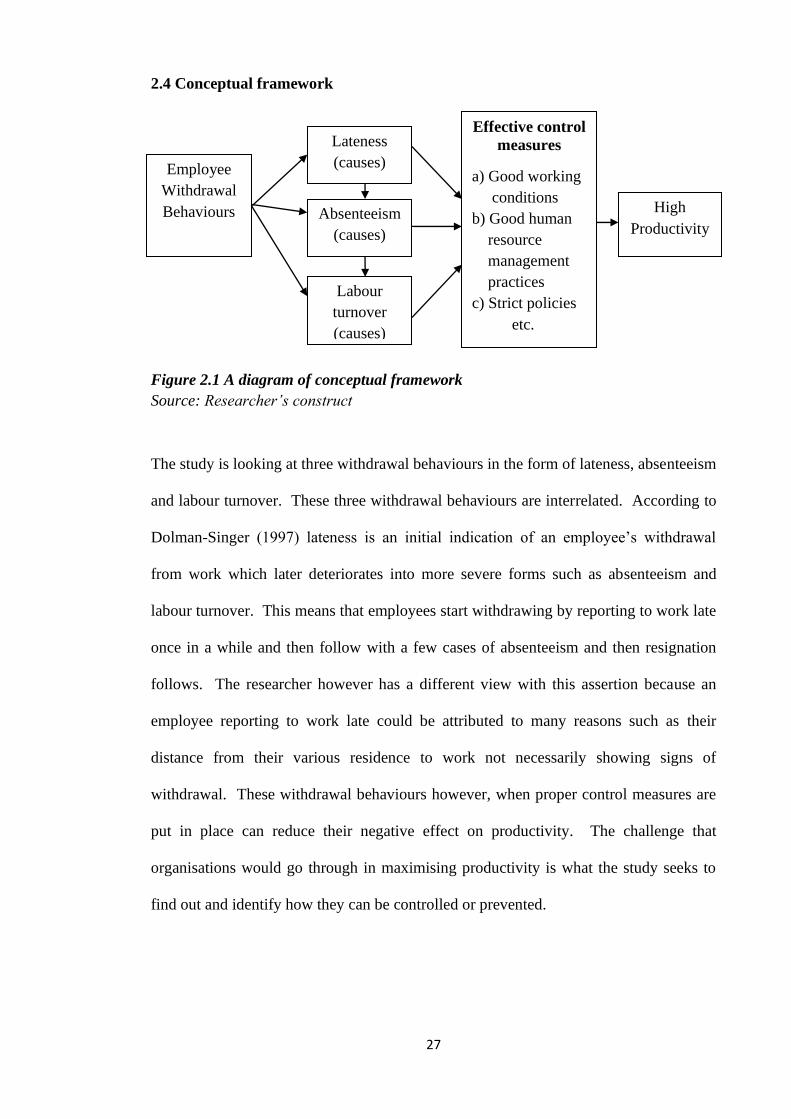
2.4 Conceptual framework
Figure 2.1 A diagram of conceptual framework
Source: Researcher’s construct
The study is looking at three withdrawal behaviours in the form of lateness, absenteeism
and labour turnover. These three withdrawal behaviours are interrelated. According to
Dolman-Singer (1997) lateness is an initial indication of an employee‟s withdrawal
from work which later deteriorates into more severe forms such as absenteeism and
labour turnover. This means that employees start withdrawing by reporting to work late
once in a while and then follow with a few cases of absenteeism and then resignation
follows. The researcher however has a different view with this assertion because an
employee reporting to work late could be attributed to many reasons such as their
distance from their various residence to work not necessarily showing signs of
withdrawal. These withdrawal behaviours however, when proper control measures are
put in place can reduce their negative effect on productivity. The challenge that
organisations would go through in maximising productivity is what the study seeks to
find out and identify how they can be controlled or prevented.
Employee
Withdrawal
Behaviours
Lateness
(causes)
Absenteeism
(causes)
Labour
turnover
(causes)
High
Productivity
Effective control
measures
a) Good working
conditions
b) Good human
resource
management
practices
c) Strict policies
etc.
28
CHAPTER THREE
RESEARCH METHODOLOGY AND ORGANIZATIONAL PROFILE
3.0 Introduction
This chapter answers the question on how data were collected and analyzed. It explains
the research design, sources of data, population, sampling technique, data collection
instruments, data analysis techniques and organizational profile of the Christ Apostolic
University College (CAUC), Kwadaso, Kumasi.
3.1 Research design
In this study, descriptive and explanatory research were used to answer the research
questions. According to Best and Khan (1998), descriptive research is concerned with
the conditions or relationships that exist, such as determining the nature of prevailing
conditions, practices and attitudes; opinions that are held; processes that are going on;
or trends that are developed. On the other hand, explanatory research seeks to know
„why‟, and to „explain‟. These were adopted because the researcher deemed it
appropriate to find out why these withdrawal behaviours exist and how they come
about, find out the effects they have on the organization, measures that can be used to
control them and some of the challenges organizations face in trying to control them.
3.2 Sources of data
Two sources of data were used for this research. These were primary and secondary.
3.2.1 Primary data
The primary sources of data were first-hand information collected from the field
through the administration of questionnaire and interview.
29
3.2.2 Secondary data
The secondary sources of data were information from books, journals and the internet.
3.3 Population
As far as this study was concerned, the target population was Staff and Management of
Christ Apostolic University College (CAUC). The population of fifty was categorized
as Management and Employees.
Table 3.1
Population of CAUC
Category Number
Management 2
Senior members 28
Senior staff 16
Junior staff 6
Total 52
3.4 Sample size
According to Saunders et al. (2009) with a population size of fifty, to gain a 1% margin
of error, the total population should be used. Therefore the researcher decided to use all
the 50 employees and 2 management personnel. The entire population was used for this
research implying a census.
3.5 Sampling techniques
This study used purely census. This sampling technique was used in the selection of the
sample for this study (Saunders et al. 2009). The census sampling technique is where
the entire population is used by the researcher. This sampling technique was adopted in
30
this study because the population was few and manageable. The researcher decided to
use this technique to avoid the complications associated with sample selection.
3.6 Data collection instruments
Data collection involves the use of various techniques to collect or gather information
necessary for the research. The tools were questionnaire and face-to-face structured
interview
3.6.1 Questionnaire
The researcher used questionnaire (Appendix A) as the main instrument for the
collection of data for the research. The reason for using questionnaire was that it is the
most effective instrument for data collection as far as field survey is concerned. This
was self-administered to respondents.
3.6.2 Structured interview
The researcher interviewed the President and the Registrar of CAUC using a structured
interview guide (Appendix B) consisting of seven questions with each interview lasting
for an average of twenty minutes.
3.7 Data analysis techniques
The data collected from the study was analyzed using the Statistical Product for Service
Solutions (SPSS). Data collected using the questionnaires were analyzed using
descriptive statistics and the data from the interviews were analyzed using content
analysis. Statistical Product for Service Solutions (SPSS) software was used to run
analysis collected from the field. The results from the analysis were presented using the
charts (bar and pie charts) and frequency tables. The use of the chart gave a pictorial
and graphical representation and understanding of the result at a glance. In predicting
31
the effect of these withdrawal behaviours (lateness, absenteeism and labour turnover) on
productivity, a simple multiple regression analysis was employed.
3.8 Profile of Christ Apostolic University College
The Christ Apostolic University College (CAUC), Kumasi is an initiative of the Christ
Apostolic Church International (CACI), with its headquarters in Accra, Ghana. It is
incorporated and operates as a tertiary institution with the status of a University College
offering degree and certificate programmes with the authorization of the National
Accreditation Board (NAB). It is affiliated to Kwame Nkrumah University of Science
and Technology (KNUST) and University of Cape Coast (UCC). The motto of the
University College is “Shining as Light; Holding forth the Word”.
3.9 Brief history of the CAUC
The Christ Apostolic University College (CAUC) started as a Bible Training Centre in
1973 at Bantama-Kumasi. The Centre commenced with fifteen students for a two-year
Diploma in Theology program. However, only eleven of them completed. In 1977 it
was closed down due to reasons beyond control.
In 1986, it was re-opened at Kwadaso in Kumasi and renamed Bible Training Institute
(BTI), this time to run a one-year Diploma course in Theology. Within that period, 300
students graduated from the Bible Training Institute. Most of them are currently
serving in various positions and areas within the Church (CACI) whilst others are
serving in other Pentecostal Churches.
As part of the corporate vision of the Christ Apostolic Church International, that is, to
help train people to meet the human resource needs of the church, the country and the
world at large, there was the need to diversify the programmes and courses run at the
Institute. Consequently, at an Emergency Ministerial and General Council Meeting
32
held at Bunso Cocoa College in the Eastern Region of Ghana, it was unanimously
approved that the Bible Training Institute be upgraded to a University College status,
hence was renamed Christ Apostolic University College. The University College was
granted accreditation in the year 2010.
4.0 Vision and mission
The vision and mission of CAUC are;
Vision:
The vision of CAUC is to be a distinguished seat of learning for its Academic quality
that emphasizes integrity, intellectual achievement and employability.
Mission statement:
As a Christian university in the Pentecostal tradition, the Christ Apostolic University
College (CAUC) exists to provide excellent student-centred undergraduate and graduate
education that seeks to integrate the intellectual, spiritual, moral, ethical and social
development of students and through university extension, the CAUC will provide
continuing education for students to improve their job skills, marketability and enhance
the quality of their lives.
4.1 Staffing situation
The University College currently has twenty-five (25) non-teaching staff comprising of
senior members, senior staff and junior staff who are in charge of the day-to-day
administration of the University College. It also has thirteen (13) full-time lecturers and
twelve (12) part-time lecturers in the four (4) departments it operates currently which
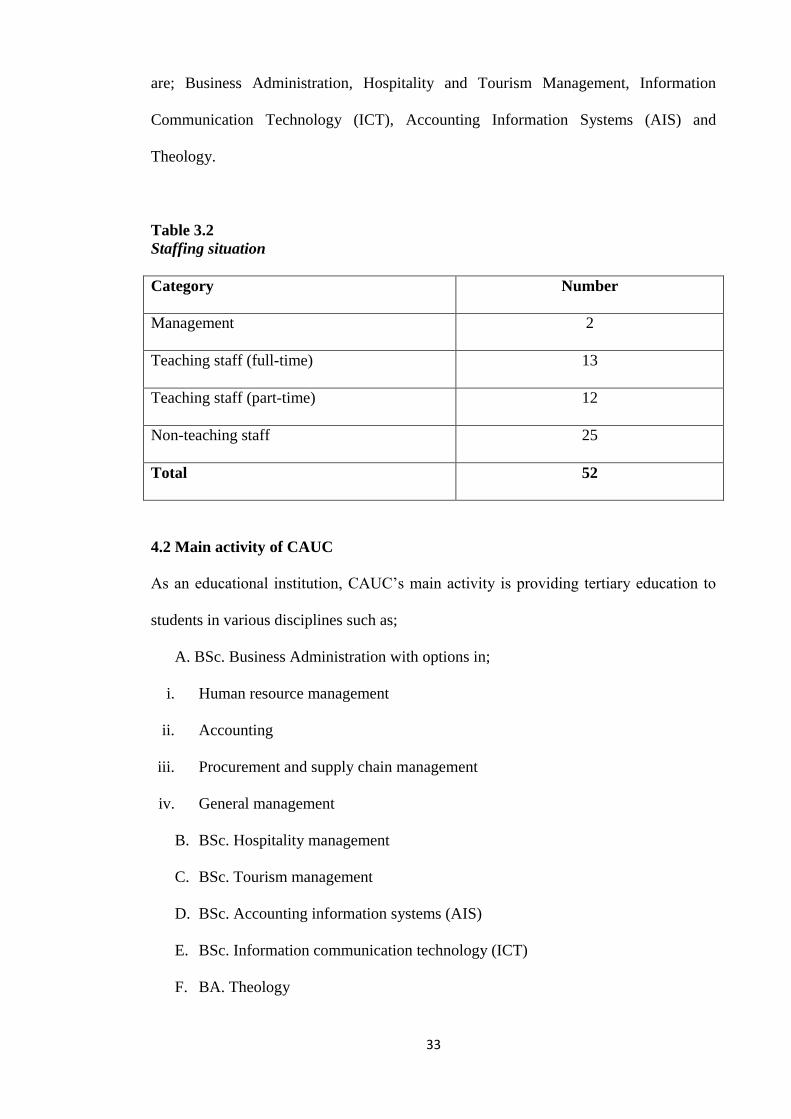
33
are; Business Administration, Hospitality and Tourism Management, Information
Communication Technology (ICT), Accounting Information Systems (AIS) and
Theology.
Table 3.2
Staffing situation
Category Number
Management 2
Teaching staff (full-time) 13
Teaching staff (part-time) 12
Non-teaching staff 25
Total 52
4.2 Main activity of CAUC
As an educational institution, CAUC‟s main activity is providing tertiary education to
students in various disciplines such as;
A. BSc. Business Administration with options in;
i. Human resource management
ii. Accounting
iii. Procurement and supply chain management
iv. General management
B. BSc. Hospitality management
C. BSc. Tourism management
D. BSc. Accounting information systems (AIS)
E. BSc. Information communication technology (ICT)
F. BA. Theology
34
The CAUC is working on introducing programs in Education by September 2014.
Some of these programmes are;
(i) B.Ed. Accounting
(ii) B.Ed. Management
(iii) B.Ed. Economics
(iv) B.Ed. Basic Education
Although a young institution, the canker of these withdrawal behaviours (lateness,
absenteeism and labour turnover) are seen to be prevailing. Some staff of CAUC report
to work late and are sometimes absent without permission. Four employees have
resigned and the prevalence of these withdrawal behaviours (lateness and absenteeism)
meant that more cases of labour turnover should be anticipated. It is important therefore
to know why the employees are exhibiting these withdrawal behaviours as these
behaviours can be attributed to many reasons or causes. This will enable management
come out with solutions that can at least reduce their effects on the organization if not
able to curb them completely. The best way of doing this is what this research seeks to
find out.

35
CHAPTER FOUR
DATA PRESENTATION, ANALYSIS AND DISCUSSION OF FINDINGS
4.0 Introduction
In this chapter, data gathered from field surveys are presented with the use of Statistical
Package for Service Solutions (SPSS). The use of this statistical tool is based on its
simplicity in application and clarity of presentation. The survey was conducted on a
total of 50 employees of Christ Apostolic University College (CAUC) out of which
forty three questionnaires were received representing 86% response rate.
4.1 Analysis of Demography of Respondents
Table 4.3.1
Age of Respondents
Responses Frequency Percentage
21-30 13 30.2
31-40 19 44.2
41-50 5 11.6
51 years and above 6 14.0
Total 43 100
Source: Field survey 2014
Majority of the respondents and therefore the staff of CAUC were between the ages of
31 and 40 years which constituted 19 (44%) of the entire population. This was followed
by those between the ages of 21 and 30 years which constituted 13 (30%) of the entire
population. Only 5 (11%) were between 41 and 50 years and 6 (14%) were between 41
and 50 years. Six representing 14% were 51 years and above. A conclusion can
therefore be drawn that 32 (74%) of the employees were 40 years and below which
meant CAUC had a youthful workforce which could lead to good performance
contributing to high productivity. The general perception is that employees in their
youthful years will work harder than old and weak employees.
36
Table 4.4.2
Educational background of respondents
Responses Frequency Percentage
MSLC 4 9.3
SSSCE/WASSCE 1 2.3
Diploma (HND) 4 9.3
Degree 8 18.6
Masters 25 58.1
Others 1 2.3
Total 43 100
Source: Field survey 2014
Majority of the employees constituting 25 (58%) of the total respondents were 2nd
degree (Masters) holders, 8 (19%) had 1st degrees, 4 (9%) held Diploma (HND), 1
(2.3%) held SSSCE/WASSCE and 4 (9%) held MSLC. In all 33 (77%) of the
respondents had 1st and 2nd degrees which also make the workforce strong. It is
inferred that majority of the employees have second degrees (masters) which is very
good for a tertiary institution. This could also mean that, the teaching staff have the
minimum requirement by the National Accreditation Board (NAB) to lecture.
Table 4.5.3
Rank of employees
Responses Frequency Percentage
Senior Member 23 53.5
Senior Staff 14 32.6
Junior Staff 6 14.0
Total 43 100
Source: Field survey 2014
Majority of the respondents, 23 (54%) were senior members, 14 (33%) were senior staff
and 6 (14%) were junior staff. It could be inferred that majority of those who had their
masters had been promoted to the rank that they deserved. From table 4.4.2 on page 37,
respondents had their masters and from this current table, 23 of them were senior
37
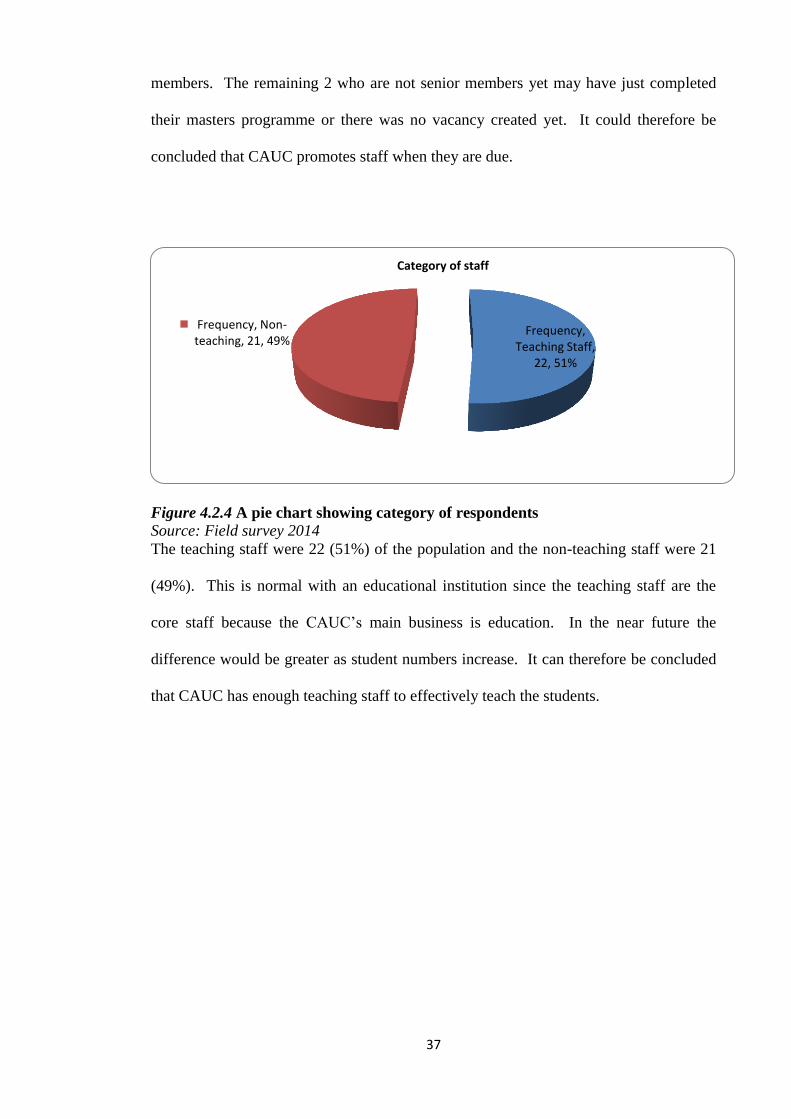
members. The remaining 2 who are not senior members yet may have just completed
their masters programme or there was no vacancy created yet. It could therefore be
concluded that CAUC promotes staff when they are due.
Figure 4.2.4 A pie chart showing category of respondents
Source: Field survey 2014
The teaching staff were 22 (51%) of the population and the non-teaching staff were 21
(49%). This is normal with an educational institution since the teaching staff are the
core staff because the CAUC‟s main business is education. In the near future the
difference would be greater as student numbers increase. It can therefore be concluded
that CAUC has enough teaching staff to effectively teach the students.
Frequency, Teaching Staff,
22, 51%
Frequency, Non-teaching, 21, 49%
Category of staff
38
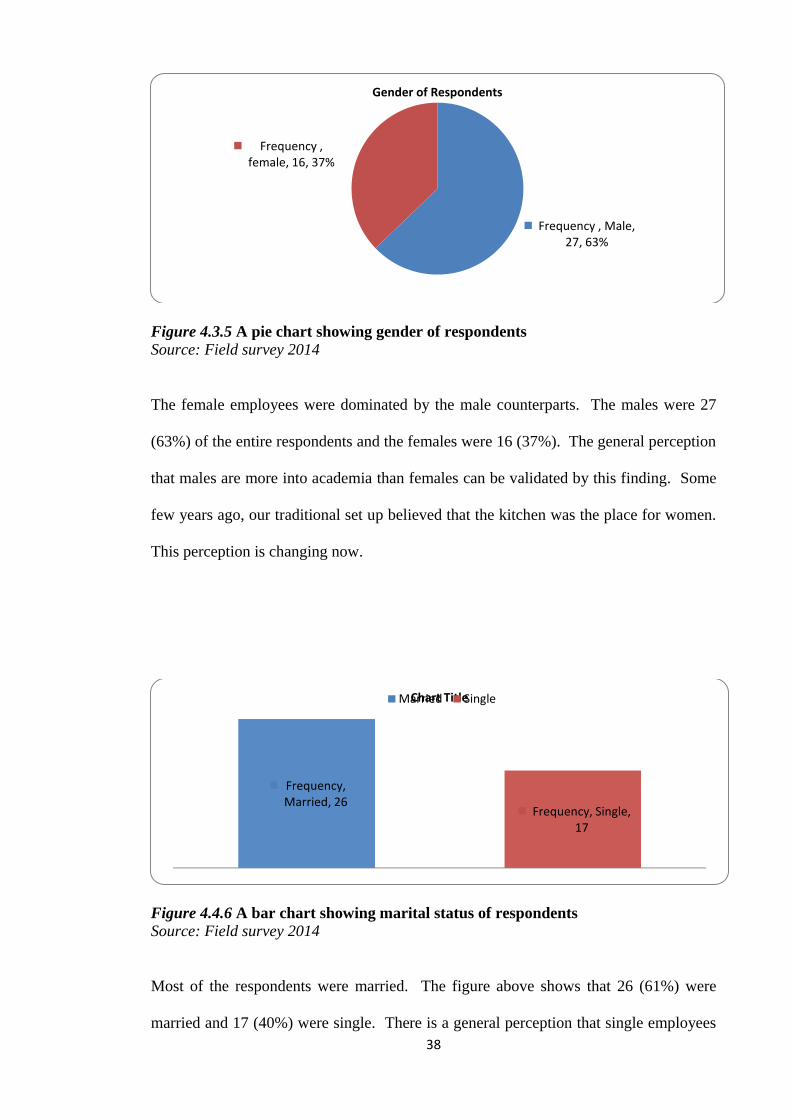
Figure 4.3.5 A pie chart showing gender of respondents
Source: Field survey 2014
The female employees were dominated by the male counterparts. The males were 27
(63%) of the entire respondents and the females were 16 (37%). The general perception
that males are more into academia than females can be validated by this finding. Some
few years ago, our traditional set up believed that the kitchen was the place for women.
This perception is changing now.
Figure 4.4.6 A bar chart showing marital status of respondents
Source: Field survey 2014
Most of the respondents were married. The figure above shows that 26 (61%) were
married and 17 (40%) were single. There is a general perception that single employees
Frequency , Male, 27, 63%
Frequency , female, 16, 37%
Gender of Respondents
Frequency, Married, 26
Frequency, Single, 17
Chart Title Married Single
39
tend to have much time for their job than married employees because they do not have
other family responsibilities. With majority of the employees married, the assumption
is that they are likely to exhibit lateness and absenteeism due to family responsibilities
if this perception is true and this could affect productivity in the long run. This
confirms the finding of VandenHeuvel and Wood (1995) that married employees who
are parents tend to be absent no matter their gender.
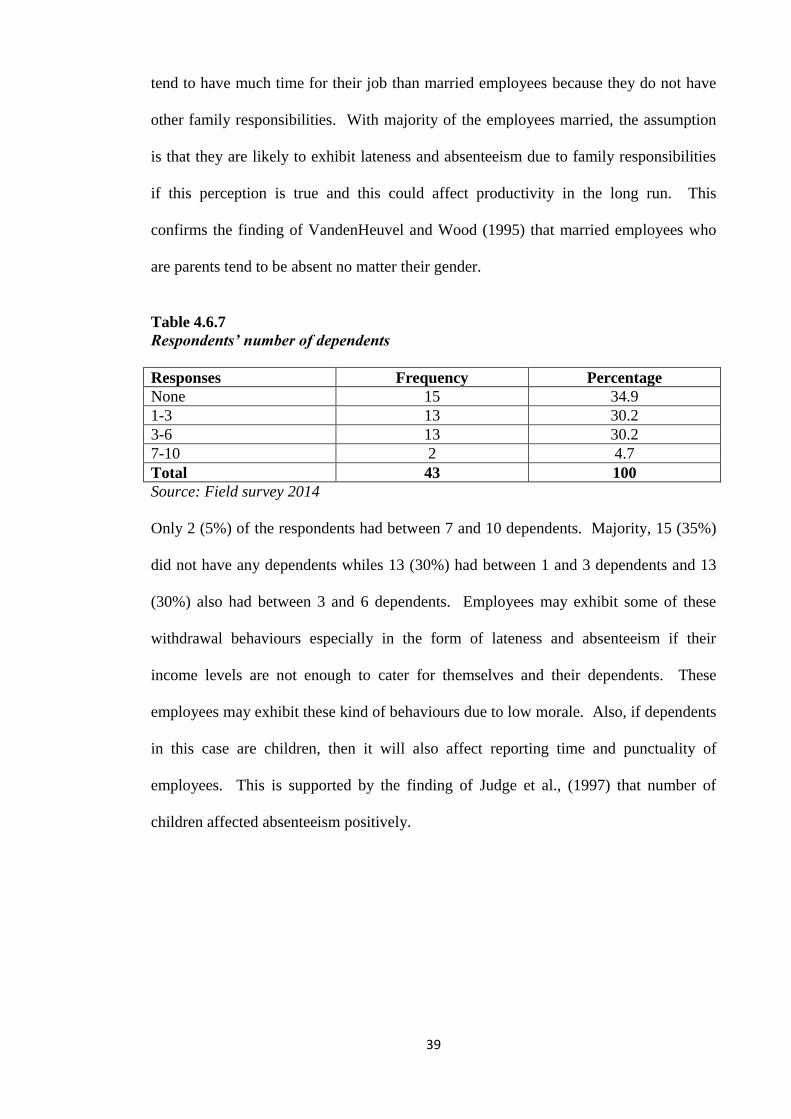
Table 4.6.7
Respondents’ number of dependents
Responses Frequency Percentage
None 15 34.9
1-3 13 30.2
3-6 13 30.2
7-10 2 4.7
Total 43 100
Source: Field survey 2014
Only 2 (5%) of the respondents had between 7 and 10 dependents. Majority, 15 (35%)
did not have any dependents whiles 13 (30%) had between 1 and 3 dependents and 13
(30%) also had between 3 and 6 dependents. Employees may exhibit some of these
withdrawal behaviours especially in the form of lateness and absenteeism if their
income levels are not enough to cater for themselves and their dependents. These
employees may exhibit these kind of behaviours due to low morale. Also, if dependents
in this case are children, then it will also affect reporting time and punctuality of
employees. This is supported by the finding of Judge et al., (1997) that number of
children affected absenteeism positively.
40
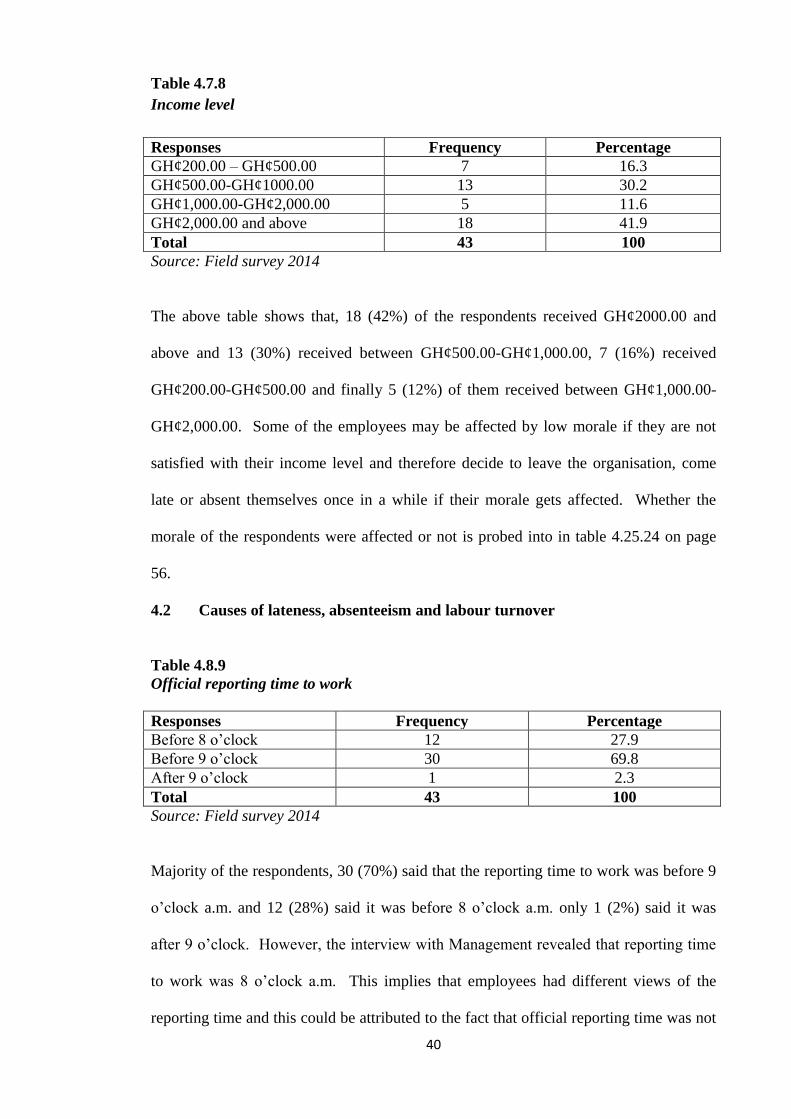
Table 4.7.8
Income level
Responses Frequency Percentage
GH¢200.00 – GH¢500.00 7 16.3
GH¢500.00-GH¢1000.00 13 30.2
GH¢1,000.00-GH¢2,000.00 5 11.6
GH¢2,000.00 and above 18 41.9
Total 43 100
Source: Field survey 2014
The above table shows that, 18 (42%) of the respondents received GH¢2000.00 and
above and 13 (30%) received between GH¢500.00-GH¢1,000.00, 7 (16%) received
GH¢200.00-GH¢500.00 and finally 5 (12%) of them received between GH¢1,000.00-
GH¢2,000.00. Some of the employees may be affected by low morale if they are not
satisfied with their income level and therefore decide to leave the organisation, come
late or absent themselves once in a while if their morale gets affected. Whether the
morale of the respondents were affected or not is probed into in table 4.25.24 on page
56.
4.2 Causes of lateness, absenteeism and labour turnover
Table 4.8.9
Official reporting time to work
Responses Frequency Percentage
Before 8 o‟clock 12 27.9
Before 9 o‟clock 30 69.8
After 9 o‟clock 1 2.3
Total 43 100
Source: Field survey 2014
Majority of the respondents, 30 (70%) said that the reporting time to work was before 9
o‟clock a.m. and 12 (28%) said it was before 8 o‟clock a.m. only 1 (2%) said it was
after 9 o‟clock. However, the interview with Management revealed that reporting time
to work was 8 o‟clock a.m. This implies that employees had different views of the
reporting time and this could be attributed to the fact that official reporting time was not
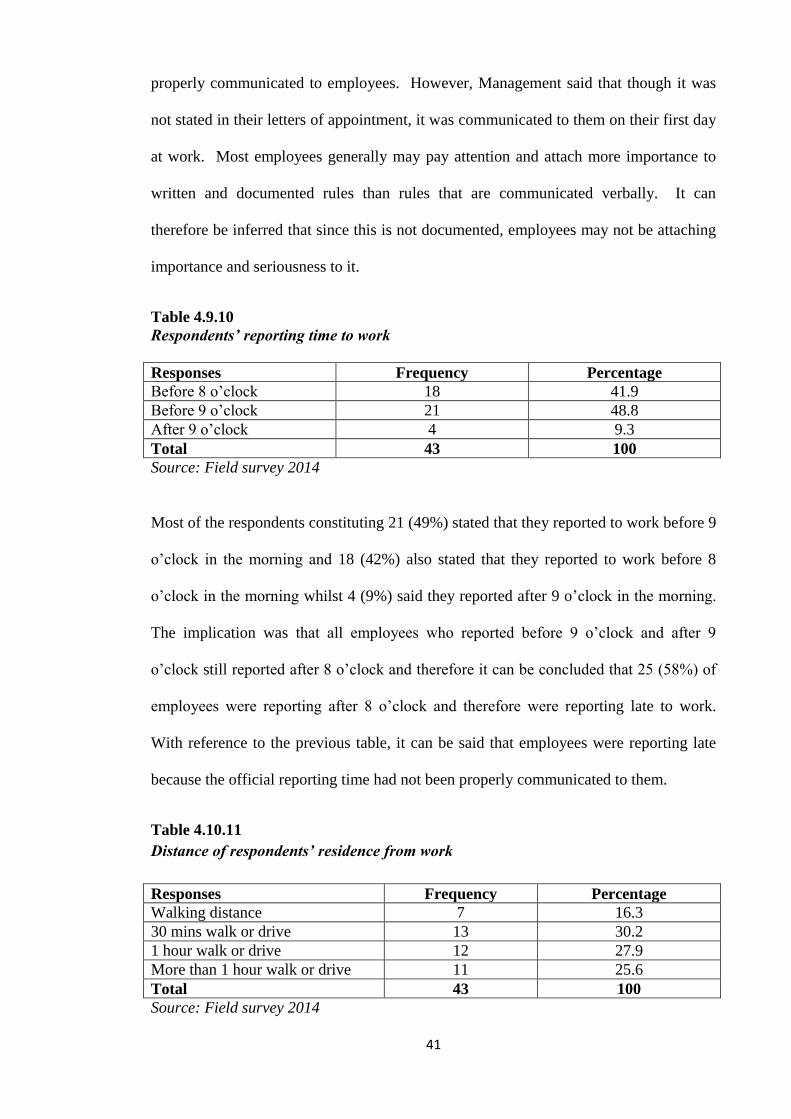
41
properly communicated to employees. However, Management said that though it was
not stated in their letters of appointment, it was communicated to them on their first day
at work. Most employees generally may pay attention and attach more importance to
written and documented rules than rules that are communicated verbally. It can
therefore be inferred that since this is not documented, employees may not be attaching
importance and seriousness to it.
Table 4.9.10
Respondents’ reporting time to work
Responses Frequency Percentage
Before 8 o‟clock 18 41.9
Before 9 o‟clock 21 48.8
After 9 o‟clock 4 9.3
Total 43 100
Source: Field survey 2014
Most of the respondents constituting 21 (49%) stated that they reported to work before 9
o‟clock in the morning and 18 (42%) also stated that they reported to work before 8
o‟clock in the morning whilst 4 (9%) said they reported after 9 o‟clock in the morning.
The implication was that all employees who reported before 9 o‟clock and after 9
o‟clock still reported after 8 o‟clock and therefore it can be concluded that 25 (58%) of
employees were reporting after 8 o‟clock and therefore were reporting late to work.
With reference to the previous table, it can be said that employees were reporting late
because the official reporting time had not been properly communicated to them.
Table 4.10.11
Distance of respondents’ residence from work
Responses Frequency Percentage
Walking distance 7 16.3
30 mins walk or drive 13 30.2
1 hour walk or drive 12 27.9
More than 1 hour walk or drive 11 25.6
Total 43 100
Source: Field survey 2014
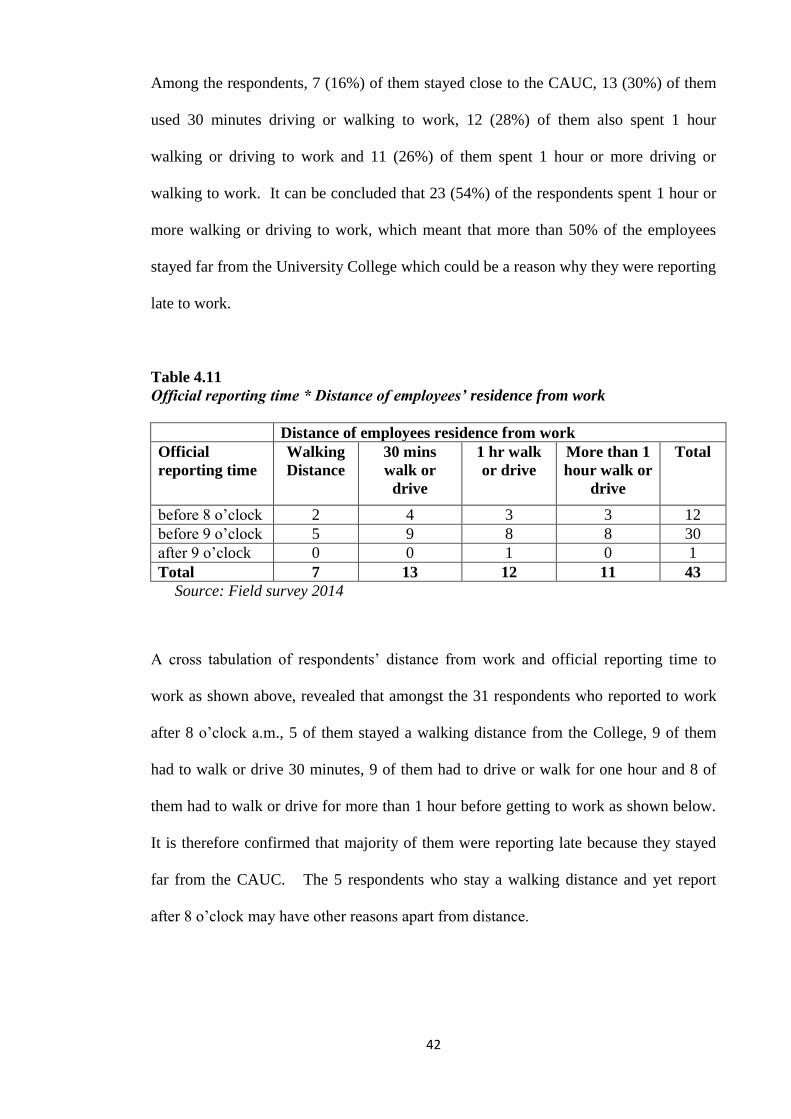
42
Among the respondents, 7 (16%) of them stayed close to the CAUC, 13 (30%) of them
used 30 minutes driving or walking to work, 12 (28%) of them also spent 1 hour
walking or driving to work and 11 (26%) of them spent 1 hour or more driving or
walking to work. It can be concluded that 23 (54%) of the respondents spent 1 hour or
more walking or driving to work, which meant that more than 50% of the employees
stayed far from the University College which could be a reason why they were reporting
late to work.
Table 4.11
Official reporting time * Distance of employees’ residence from work
Distance of employees residence from work
Official
reporting time
Walking
Distance
30 mins
walk or
drive
1 hr walk
or drive
More than 1
hour walk or
drive
Total
before 8 o‟clock 2 4 3 3 12
before 9 o‟clock 5 9 8 8 30
after 9 o‟clock 0 0 1 0 1
Total 7 13 12 11 43
Source: Field survey 2014
A cross tabulation of respondents‟ distance from work and official reporting time to
work as shown above, revealed that amongst the 31 respondents who reported to work
after 8 o‟clock a.m., 5 of them stayed a walking distance from the College, 9 of them
had to walk or drive 30 minutes, 9 of them had to drive or walk for one hour and 8 of
them had to walk or drive for more than 1 hour before getting to work as shown below.
It is therefore confirmed that majority of them were reporting late because they stayed
far from the CAUC. The 5 respondents who stay a walking distance and yet report
after 8 o‟clock may have other reasons apart from distance.
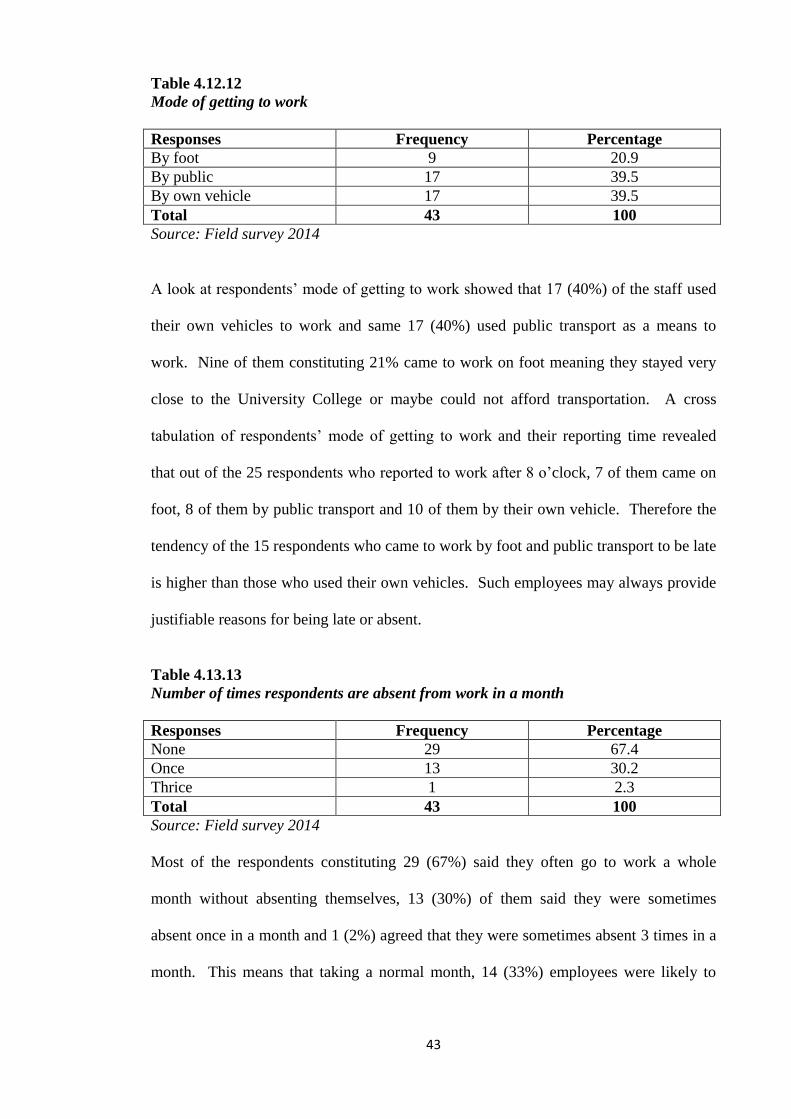
43
Table 4.12.12
Mode of getting to work
Responses Frequency Percentage
By foot 9 20.9
By public 17 39.5
By own vehicle 17 39.5
Total 43 100
Source: Field survey 2014
A look at respondents‟ mode of getting to work showed that 17 (40%) of the staff used
their own vehicles to work and same 17 (40%) used public transport as a means to
work. Nine of them constituting 21% came to work on foot meaning they stayed very
close to the University College or maybe could not afford transportation. A cross
tabulation of respondents‟ mode of getting to work and their reporting time revealed
that out of the 25 respondents who reported to work after 8 o‟clock, 7 of them came on
foot, 8 of them by public transport and 10 of them by their own vehicle. Therefore the
tendency of the 15 respondents who came to work by foot and public transport to be late
is higher than those who used their own vehicles. Such employees may always provide
justifiable reasons for being late or absent.
Table 4.13.13
Number of times respondents are absent from work in a month
Responses Frequency Percentage
None 29 67.4
Once 13 30.2
Thrice 1 2.3
Total 43 100
Source: Field survey 2014
Most of the respondents constituting 29 (67%) said they often go to work a whole
month without absenting themselves, 13 (30%) of them said they were sometimes
absent once in a month and 1 (2%) agreed that they were sometimes absent 3 times in a
month. This means that taking a normal month, 14 (33%) employees were likely to
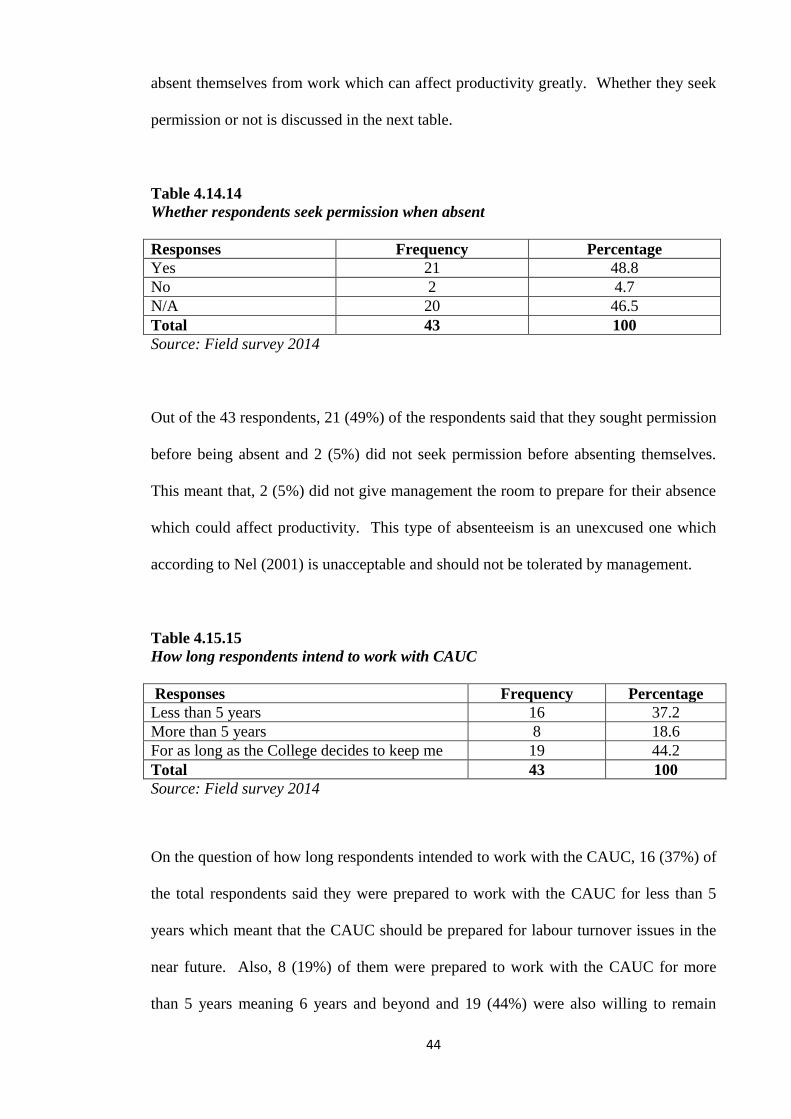
44
absent themselves from work which can affect productivity greatly. Whether they seek
permission or not is discussed in the next table.
Table 4.14.14
Whether respondents seek permission when absent
Responses Frequency Percentage
Yes 21 48.8
No 2 4.7
N/A 20 46.5
Total 43 100
Source: Field survey 2014
Out of the 43 respondents, 21 (49%) of the respondents said that they sought permission
before being absent and 2 (5%) did not seek permission before absenting themselves.
This meant that, 2 (5%) did not give management the room to prepare for their absence
which could affect productivity. This type of absenteeism is an unexcused one which
according to Nel (2001) is unacceptable and should not be tolerated by management.
Table 4.15.15
How long respondents intend to work with CAUC
Responses Frequency Percentage
Less than 5 years 16 37.2
More than 5 years 8 18.6
For as long as the College decides to keep me 19 44.2
Total 43 100
Source: Field survey 2014
On the question of how long respondents intended to work with the CAUC, 16 (37%) of
the total respondents said they were prepared to work with the CAUC for less than 5
years which meant that the CAUC should be prepared for labour turnover issues in the
near future. Also, 8 (19%) of them were prepared to work with the CAUC for more
than 5 years meaning 6 years and beyond and 19 (44%) were also willing to remain
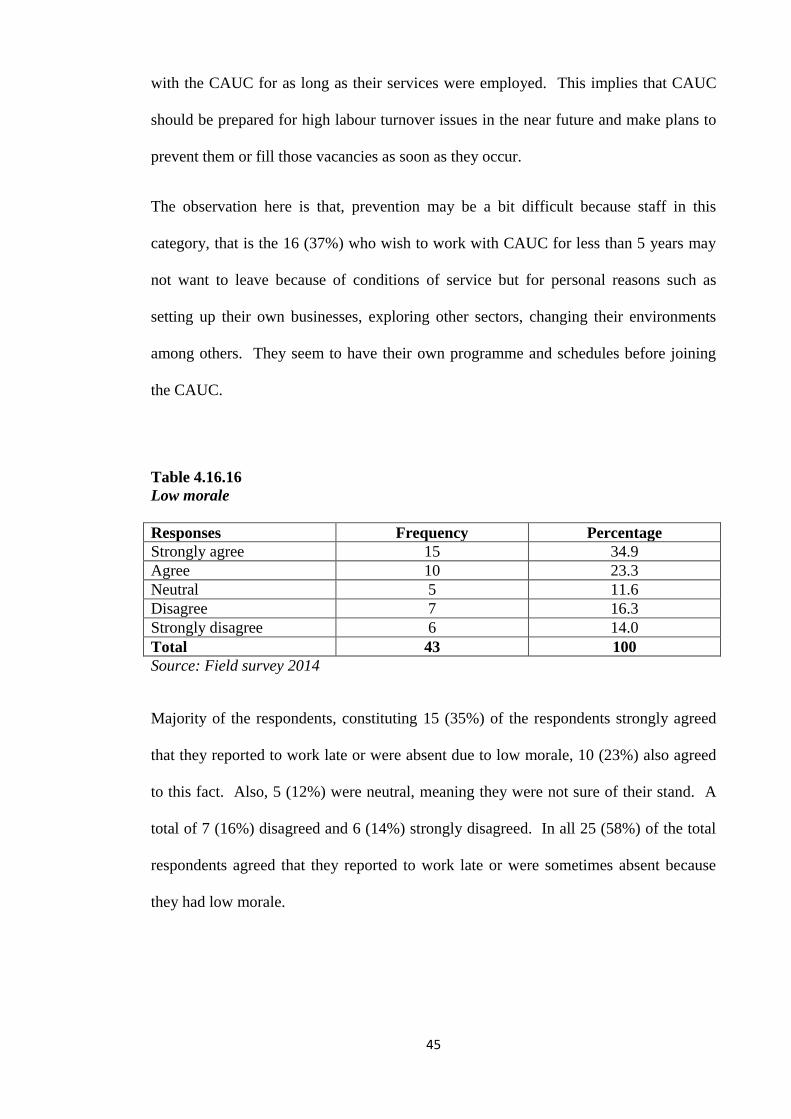
45
with the CAUC for as long as their services were employed. This implies that CAUC
should be prepared for high labour turnover issues in the near future and make plans to
prevent them or fill those vacancies as soon as they occur.
The observation here is that, prevention may be a bit difficult because staff in this
category, that is the 16 (37%) who wish to work with CAUC for less than 5 years may
not want to leave because of conditions of service but for personal reasons such as
setting up their own businesses, exploring other sectors, changing their environments
among others. They seem to have their own programme and schedules before joining
the CAUC.
Table 4.16.16
Low morale
Responses Frequency Percentage
Strongly agree 15 34.9
Agree 10 23.3
Neutral 5 11.6
Disagree 7 16.3
Strongly disagree 6 14.0
Total 43 100
Source: Field survey 2014
Majority of the respondents, constituting 15 (35%) of the respondents strongly agreed
that they reported to work late or were absent due to low morale, 10 (23%) also agreed
to this fact. Also, 5 (12%) were neutral, meaning they were not sure of their stand. A
total of 7 (16%) disagreed and 6 (14%) strongly disagreed. In all 25 (58%) of the total
respondents agreed that they reported to work late or were sometimes absent because
they had low morale.
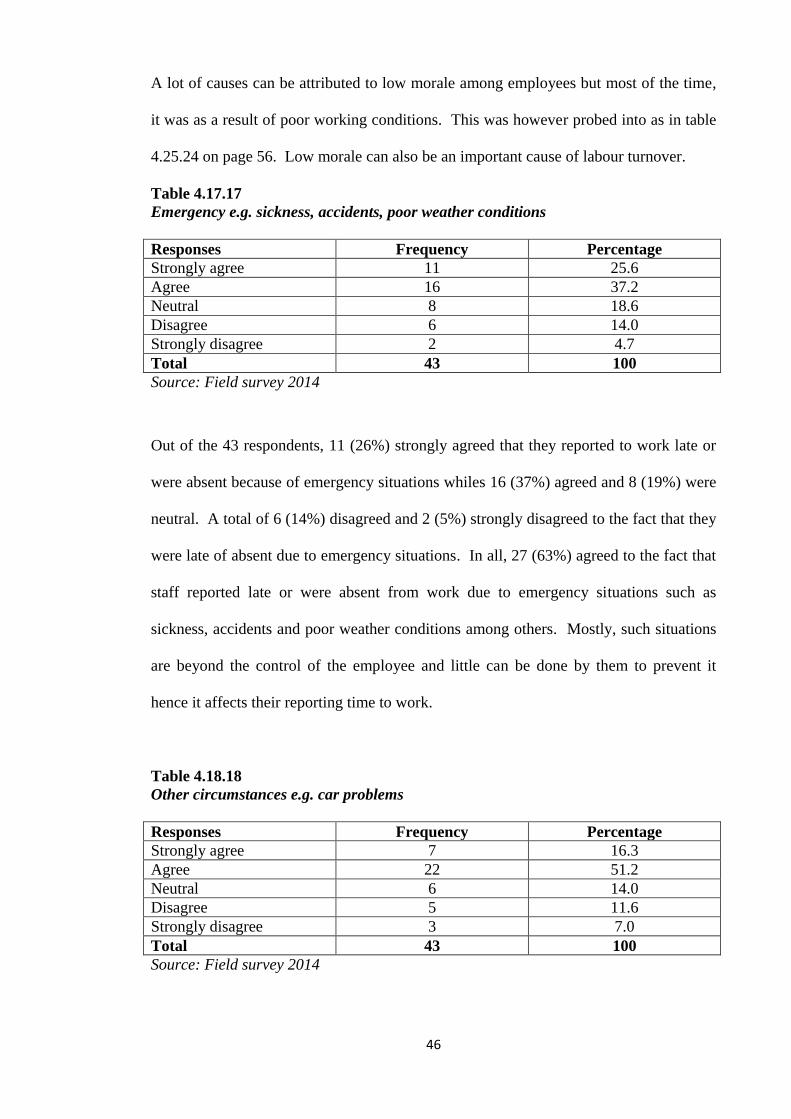
46
A lot of causes can be attributed to low morale among employees but most of the time,
it was as a result of poor working conditions. This was however probed into as in table
4.25.24 on page 56. Low morale can also be an important cause of labour turnover.
Table 4.17.17
Emergency e.g. sickness, accidents, poor weather conditions
Responses Frequency Percentage
Strongly agree 11 25.6
Agree 16 37.2
Neutral 8 18.6
Disagree 6 14.0
Strongly disagree 2 4.7
Total 43 100
Source: Field survey 2014
Out of the 43 respondents, 11 (26%) strongly agreed that they reported to work late or
were absent because of emergency situations whiles 16 (37%) agreed and 8 (19%) were
neutral. A total of 6 (14%) disagreed and 2 (5%) strongly disagreed to the fact that they
were late of absent due to emergency situations. In all, 27 (63%) agreed to the fact that
staff reported late or were absent from work due to emergency situations such as
sickness, accidents and poor weather conditions among others. Mostly, such situations
are beyond the control of the employee and little can be done by them to prevent it
hence it affects their reporting time to work.
Table 4.18.18
Other circumstances e.g. car problems
Responses Frequency Percentage
Strongly agree 7 16.3
Agree 22 51.2
Neutral 6 14.0
Disagree 5 11.6
Strongly disagree 3 7.0
Total 43 100
Source: Field survey 2014
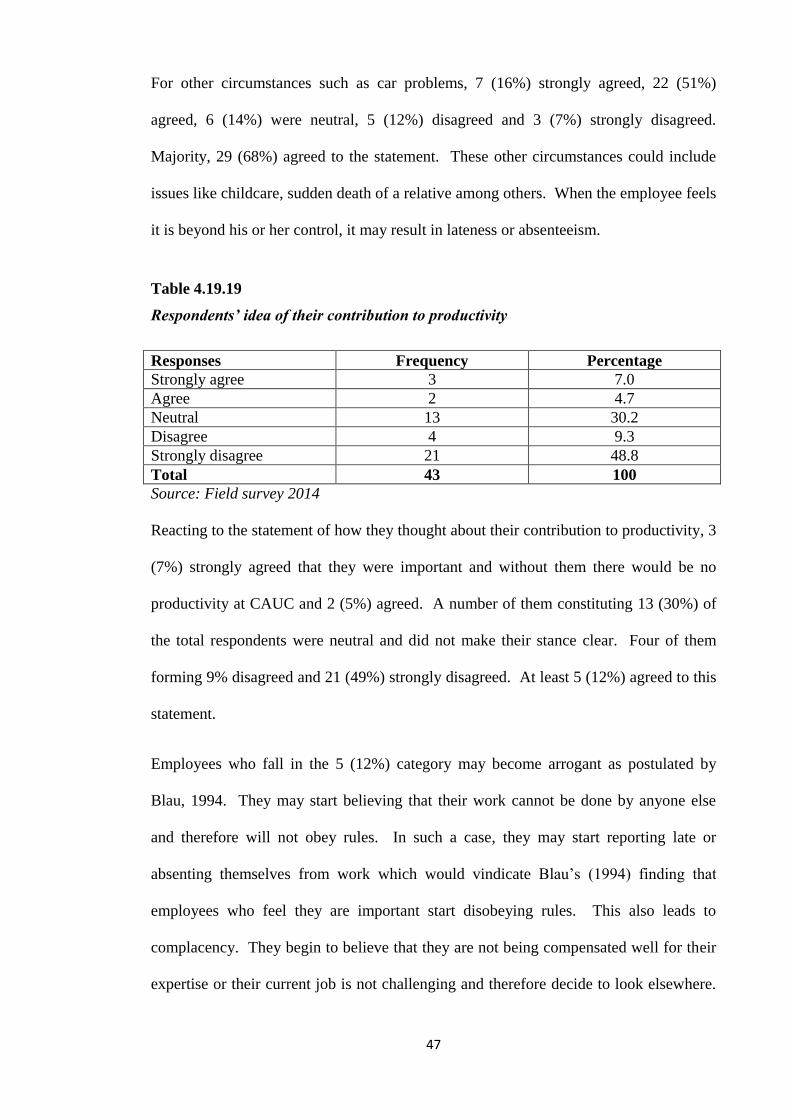
47
For other circumstances such as car problems, 7 (16%) strongly agreed, 22 (51%)
agreed, 6 (14%) were neutral, 5 (12%) disagreed and 3 (7%) strongly disagreed.
Majority, 29 (68%) agreed to the statement. These other circumstances could include
issues like childcare, sudden death of a relative among others. When the employee feels
it is beyond his or her control, it may result in lateness or absenteeism.
Table 4.19.19
Respondents’ idea of their contribution to productivity
Responses Frequency Percentage
Strongly agree 3 7.0
Agree 2 4.7
Neutral 13 30.2
Disagree 4 9.3
Strongly disagree 21 48.8
Total 43 100
Source: Field survey 2014
Reacting to the statement of how they thought about their contribution to productivity, 3
(7%) strongly agreed that they were important and without them there would be no
productivity at CAUC and 2 (5%) agreed. A number of them constituting 13 (30%) of
the total respondents were neutral and did not make their stance clear. Four of them
forming 9% disagreed and 21 (49%) strongly disagreed. At least 5 (12%) agreed to this
statement.
Employees who fall in the 5 (12%) category may become arrogant as postulated by
Blau, 1994. They may start believing that their work cannot be done by anyone else
and therefore will not obey rules. In such a case, they may start reporting late or
absenting themselves from work which would vindicate Blau‟s (1994) finding that
employees who feel they are important start disobeying rules. This also leads to
complacency. They begin to believe that they are not being compensated well for their
expertise or their current job is not challenging and therefore decide to look elsewhere.
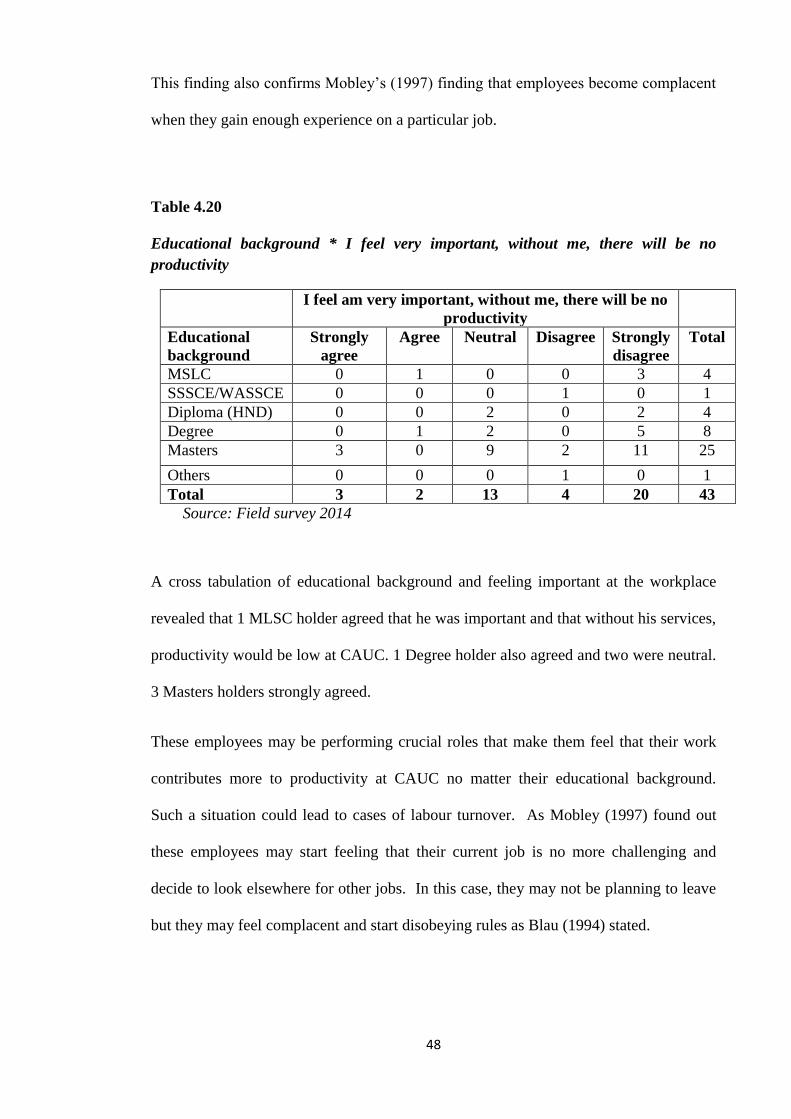
48
This finding also confirms Mobley‟s (1997) finding that employees become complacent
when they gain enough experience on a particular job.
Table 4.20
Educational background * I feel very important, without me, there will be no
productivity
I feel am very important, without me, there will be no
productivity
Educational
background
Strongly
agree
Agree Neutral Disagree Strongly
disagree
Total
MSLC 0 1 0 0 3 4
SSSCE/WASSCE 0 0 0 1 0 1
Diploma (HND) 0 0 2 0 2 4
Degree 0 1 2 0 5 8
Masters 3 0 9 2 11 25
Others 0 0 0 1 0 1
Total 3 2 13 4 20 43
Source: Field survey 2014
A cross tabulation of educational background and feeling important at the workplace
revealed that 1 MLSC holder agreed that he was important and that without his services,
productivity would be low at CAUC. 1 Degree holder also agreed and two were neutral.
3 Masters holders strongly agreed.
These employees may be performing crucial roles that make them feel that their work
contributes more to productivity at CAUC no matter their educational background.
Such a situation could lead to cases of labour turnover. As Mobley (1997) found out
these employees may start feeling that their current job is no more challenging and
decide to look elsewhere for other jobs. In this case, they may not be planning to leave
but they may feel complacent and start disobeying rules as Blau (1994) stated.
49
It could be inferred from the table that the higher one‟s educational qualification, the
more one feels important in the organisation all other things being equal as more of the
masters holders agreed to this.
Table 4.21.20
Flexible working schedule
Responses Frequency Percentage
Strongly agree 11 25.6
Agree 8 18.6
Neutral 9 20.9
Disagree 7 16.3
Strongly disagree 8 18.6
Total 43 100
Source: Field survey 2014
Out of the total respondents, 11 (26%) said they reported to work late or were absent
due to their flexible working schedule and 8 (19%) also agreed making a total of 19
(44.2%). Also, 9 (21%) were neutral, 7 (16%) disagreed and 8 (19%) strongly
disagreed.
The 19 (44.2%) may comprise of Lecturers who report to the CAUC only when they
had lectures. In their case they report when it is time for a particular lecture and when
they do not have any lecture, they may not show up at all.
Table 4.22.21
Low salary levels
Responses Frequency Percentage
Strongly agree 20 46.5
Agree 16 37.2
Neutral 3 7.0
Disagree 1 2.3
Strongly disagree 3 7.0
Total 43 100
50
Source: Field survey 2014
When asked what conditions will cause them to leave the service of CAUC, 20 (47%)
strongly agreed that low salaries would be a factor and 16 (37%) also agreed making the
total of those who agreed 36 (84%). Only 3 (7%) were neutral, 1 (2%) disagreed and 3
(7%) strongly disagreed. A total of 36 (84%) were in agreement that low salaries would
cause them to leave.
The implication is that, if the CAUC has low salary levels, very soon, a total of 36
(84%) will leave for other institutions. Wood and Macauley (1991) said better pay in
other organisations was an external cause of labour turnover. This means that once
other competitors in the industry are willing to pay higher for their services, they would
leave the service of the CAUC. Whether employees are actually satisfied with their
salary levels is yet to be ascertained.
Table 4.23.22
No opportunity for advancement
Responses Frequency Percentage
Strongly agree 18 41.9
Agree 13 30.2
Neutral 5 11.6
Disagree 5 11.6
Strongly disagree 2 4.7
Total 43 100
Source: Field survey 2014
Still on the question of what will cause them to leave the CAUC, 18 (42%) strongly
agreed that they would leave CAUC if there were no opportunities for advancement
whiles 13 (30%) agreed. Five of them constituting 12% did not take any specific
stance, 5 (12%) disagreed and 2 (5%) strongly disagreed. In all, 31 (72%) agreed. This
51
implies that some of the staff of CAUC think that they will not have the opportunity to
move to higher levels in the organization. This is no motivation to staff.
Table 4.24.23
Delayed promotion
Responses Frequency Percentage
Strongly agree 10 23.3
Agree 20 46.5
Neutral 7 16.3
Disagree 3 7.0
Strongly disagree 3 7.0
Total 43 100
Source: Field survey 2014
Further on the question of what will cause them to leave the service of the CAUC, 10
(23%) respondents strongly agreed that they would leave if their promotion was
delayed, 20 (47%) also agreed. Out of the respondents, 7 (16%) were neutral, 3 (7%)
disagreed and 3 (7%) strongly disagreed. In all 70% agreed to this statement. This
implies that CAUC has to put in place proper methods and procedures of promoting
staff and this should be known to the employees. Unless employees perceive this
process as fair, they will not be happy and motivated.
Table 4.25.24
Respondents’ opinion of causes of low morale at CAUC
Responses Frequency Percentage
Low salary 33 76.7
Inadequate retention plans 8 18.6
No opportunities for progression 2 4.7
Total 43 100
Source: Field survey 2014
Majority of the respondents, 33 (77%) agreed that their low morale was caused by low
salaries, 8 (19%) said it was as a result of inadequate retention plans and 2 (5%) said it
was due to the fact that there were no opportunities for progression. Though the other
52
responses; inadequate retention plans and opportunities for progression should all be
given attention, the issue of low salaries should be looked at critically. Below is a cross
tabulation of respondents‟ income level and the degree to which they are affected by
low morale.
Table 4.26
Low morale * Income level
Income level
Low morale GH¢200.00 –
GH¢500.00
GH¢500.00-
GH¢1,000.00
GH¢1,000.00-
GH¢2,000.00
GH¢2000
and above
Total
Strongly agree 2 5 1 7 15
Agree 1 2 2 5 10
Neutral 2 0 0 3 5
Disagree 2 3 0 2 7
Strongly
disagree
0 3 2 1 6
Total 7 13 5 18 43
Source: Field survey 2014
Amongst the respondents, 2 of them receiving a salary between GH¢ 200.00-GH¢
500.00 strongly agreed that they had low morale towards work and 1 person agreed.
Five respondents within GH¢ 500.00- GH¢ 1,000.00 salary range also strongly agreed
that they had low morale towards their work and 2 of them agreed. For salary earners in
the range of GH¢ 1,000.00 – GH¢ 2000.00, 1 person strongly agreed and 2 agreed. For
those earning GH¢ 2000.00 and above, 7 strongly agreed and 5 agreed. A total of 25
respondents agreed that they were not satisfied with what they were earning currently at
the CAUC out of the 43 respondents.
In table 4.16.16 on page 48, 25 (58%) of the respondents had agreed that they reported
late to work or were sometimes absent because their morale was low. In table 4.22.21
on page 54 majority constituting 33 (77%) agreed that low salaries were the main cause
of their low morale. This means that if CAUC is not able to increase salaries soon,
there is the possibility of losing about 36 (84%) of employees to other competitors in
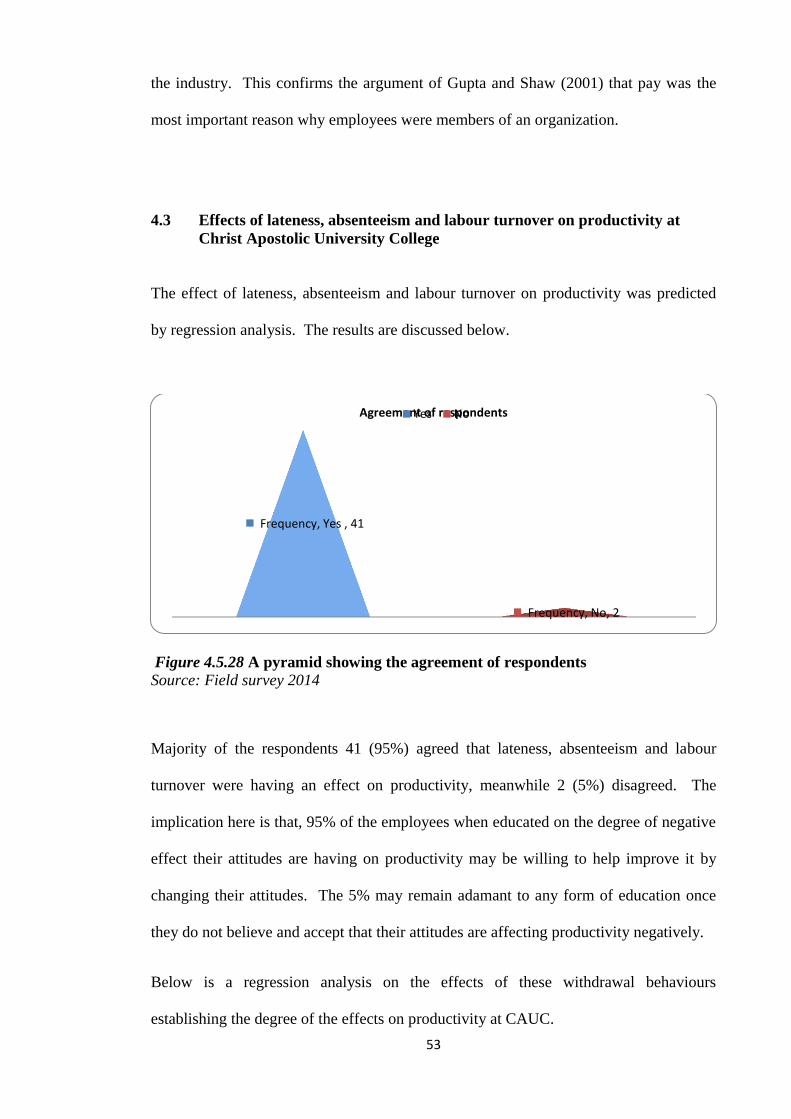
53
the industry. This confirms the argument of Gupta and Shaw (2001) that pay was the
most important reason why employees were members of an organization.
4.3 Effects of lateness, absenteeism and labour turnover on productivity at
Christ Apostolic University College
The effect of lateness, absenteeism and labour turnover on productivity was predicted
by regression analysis. The results are discussed below.
Figure 4.5.28 A pyramid showing the agreement of respondents
Source: Field survey 2014
Majority of the respondents 41 (95%) agreed that lateness, absenteeism and labour
turnover were having an effect on productivity, meanwhile 2 (5%) disagreed. The
implication here is that, 95% of the employees when educated on the degree of negative
effect their attitudes are having on productivity may be willing to help improve it by
changing their attitudes. The 5% may remain adamant to any form of education once
they do not believe and accept that their attitudes are affecting productivity negatively.
Below is a regression analysis on the effects of these withdrawal behaviours
establishing the degree of the effects on productivity at CAUC.
Frequency, Yes , 41
Frequency, No, 2
Agreement of respondents Yes No
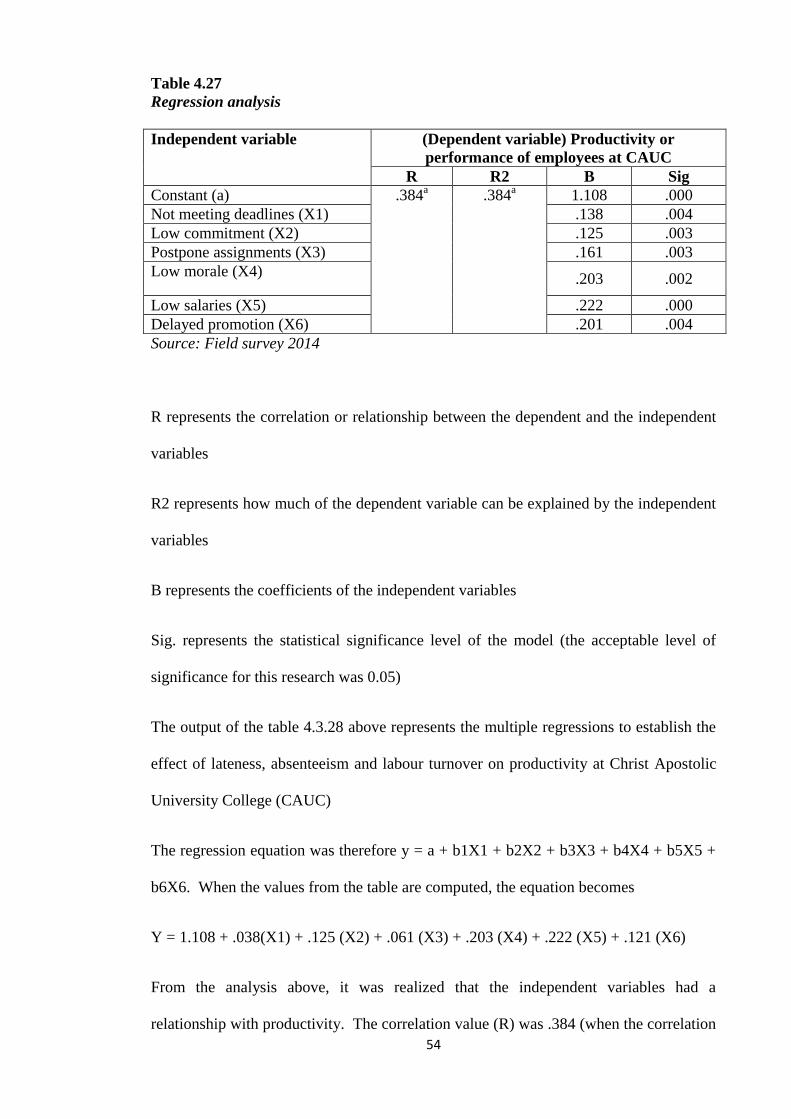
54
Table 4.27
Regression analysis
Independent variable (Dependent variable) Productivity or
performance of employees at CAUC
R R2 B Sig
Constant (a) .384a .384
a 1.108 .000
Not meeting deadlines (X1) .138 .004
Low commitment (X2) .125 .003
Postpone assignments (X3) .161 .003
Low morale (X4) .203 .002
Low salaries (X5) .222 .000
Delayed promotion (X6) .201 .004
Source: Field survey 2014
R represents the correlation or relationship between the dependent and the independent
variables
R2 represents how much of the dependent variable can be explained by the independent
variables
B represents the coefficients of the independent variables
Sig. represents the statistical significance level of the model (the acceptable level of
significance for this research was 0.05)
The output of the table 4.3.28 above represents the multiple regressions to establish the
effect of lateness, absenteeism and labour turnover on productivity at Christ Apostolic
University College (CAUC)
The regression equation was therefore y = a + b1X1 + b2X2 + b3X3 + b4X4 + b5X5 +
b6X6. When the values from the table are computed, the equation becomes
Y = 1.108 + .038(X1) + .125 (X2) + .061 (X3) + .203 (X4) + .222 (X5) + .121 (X6)
From the analysis above, it was realized that the independent variables had a
relationship with productivity. The correlation value (R) was .384 (when the correlation
55
value falls between .30 and .70, it is considered a moderate relationship). The value
was also positive which indicates that when the independent variable increases,
productivity also increases and when independent variable decreases, productivity also
decreases. The R2 value indicates that 38.4% (.384) of productivity could be explained
using the independent variables.
It was realized that the coefficient of employees not meeting deadlines was .038. This
meant that all other things being equal, when the other independent variables, low
commitment, postpone assignments, low morale, low salaries and delayed promotion
were held constant, productivity would increase by 3.8% if there was a 100%
improvement in meeting deadlines. This was statistically significant with a significance
value of .004 (0.004 < 0.05).
This meant that if employees of CAUC were able to report to work early and meet
deadlines, productivity would increase from its current level by 4%
It was also realized that a coefficient of “low commitment” of employees was .125.
This meant that all other things being equal, when the other independent variables, not
meeting deadlines, postpone assignments, low morale, low salaries and delayed
promotion were held constant; productivity would increase by 12.5% if there was a
100% improvement in “commitment”. This was statistically significant from the
research with a significant value of .003 (.003 < 0.05).
This meant that if employees of CAUC became sure of staying longer or shorter and
their commitment increased, productivity would increase by 13%
“Postponement of assignments” had a coefficient of .061. This meant that all other
things being equal, when the other independent variables, not meeting deadlines, low
commitment, low morale, low salaries and delayed promotion were held constant,
56
productivity would increase by 6% if there was a 100% improvement in “postponement
of assignments”. It was statistically significant with a significant value of .003 (.003 <
.05)
This meant that if employees of CAUC stopped postponing assignments, productivity
would increase by 6%.
Low morale also had a coefficient of .203. This meant that all other things being equal,
when the other independent variables, not meeting deadlines, low commitment,
postpone assignments, low salaries and delayed promotion were held constant;
productivity would increase by 20% if there was a 100% improvement in morale. Its
statistical significance was .002 (.002 < 0.05)
This meant that when the appropriate measures were put in place to increase the morale
of employees, productivity would increase by 20%.
The fifth independent variable, low salaries, had a coefficient of .222 which meant that
all other things being equal, holding all other independent variables, not meeting
deadlines, low commitment, postpone assignments, low morale and delayed promotion
were held constant, productivity would increase by 22% if there was a 100%
improvement in salaries. Its statistical significance was .000 (.000 < .05)
The implication was that, if salaries were increased, productivity would increase by
22%.
The last independent variable, which is delayed promotion, had a coefficient of .121.
All other things being equal, productivity would increase by 12% if other independent
variables, not meeting deadlines, low commitment, postpone assignments, low salaries
and low morale were held constant and there was a 100% improvement in promotion. It
had a statistical value of .004 (.004 < .05) which made it statistically significant.
57
The effects of the three withdrawal behaviours under study lateness, absenteeism and
labour turnover on productivity at CAUC, has been established in the analysis above.
Looking at the margins they can add to productivity, it is very important for
management of the CAUC to put in place good measures to prevent or manage them so
as to improve productivity.
4.4 Challenges Management is facing in controlling lateness, absenteeism and
labour turnover
In an interview with management, the following were revealed;
4.4.1 Official reporting time
Management informed that official reporting time to work at CAUC was 8 o‟clock a.m.
to 5 o‟clock p.m. from Monday to Friday.
4.4.2 Monitoring attendance of employees
On the question of how attendance was monitored and its effectiveness, Management
said that an attendance register was kept in an office where the administrative staff had
to sign when they reported to work. For the teaching staff, they also had an attendance
form that students were expected to complete for them after each lecture. These forms
were submitted to their Heads of Department at the end of every week which helped
them to check their attendance. For part-time lecturers, the forms were attached to their
claim forms before payments were made.
Management said they had realized that the attendance register system was not very
effective because the time was sometimes being manipulated by both students and staff.
Also the attendance system was difficult when it came to analysis because it had to be
done manually.
58
4.4.3 Compensation of employees
When asked about employee compensation, they admitted that their salary levels were
low as compared to other sister private university colleges. This confirms the position
of the employees on the issue of low morale and low salary levels.
4.4.4 Solution to compensation issues
On a follow up question of how they were planning to solve it, they stated that they had
some plans underway to improve their student numbers which could help them improve
salaries and therefore motivate employees to stay longer. They said their other
competitors were able to pay better because they had been in existence for long and had
greater student numbers which helped them to pay their employees better.
4.4.5 Labour turnover
Touching on labour turnover, they admitted that about four employees had left their
employment since the CAUC started and they will not be surprised to have more of
such cases. They believed that the main motivation was salary and once they were able
to work harder to increase salary levels, cases of labour turnover would reduce to the
minimal.
Apart from the issues discussed above, management also mentioned the following as
challenges they were facing;
4.4.6 Justifiable reasons
Management also added that most of the times, employees took advantage of
emergency cases to attend to their personal errands. Employees instead of giving prior
notice and seek for approval before absenting themselves or reporting late would call
rather on that very day stating how urgent the issue was and why they could not give
prior notice which made it difficult for management to plan for their absence. Examples
of such emergency situations were the death of a relative, sick child, having problems
59
with where to leave children for example when attendants did not report for work on a
particular day.
They also felt that, sometimes reasons for absenteeism and or lateness were within the
control of individuals and some were simply beyond their control. For instance an
employee‟s car breaking down on his/her way to work did not mean that he/she could
not pick a taxi to work comparing this to an employee who prepared for work and there
was a heavy downpour almost all day. In the two scenarios, management believed that
the first employee could have controlled the situation but the second could not have
however, both of them would have good reasons to stay away from work on that day.
4.4.7 Difficulty in checking attendance
In the case of the teaching staff, they admitted that it was a bit difficult because, they
had to report as and when they had lectures. Since they did not have a particular time
they all had to report, it was difficult to know when somebody came or not. It could
only be found out when the attendance register was checked against the various
timetables which was a bit difficult and quiet complex to do, they said.
4.4.8 Human attitude
Management also believed that to a large extent, these withdrawal behaviours were
individual human attitudes and were difficult to change. This confirms the finding of
Bowers (2001) that lateness is a general job attitude and therefore the attitude and
commitment of the employee in question is overriding.
4.5 Measures Management had put in place to control lateness, absenteeism and
labour turnover
Below are the measures management has and is planning to put in place.
60
4.5.1 Biometric clocking system
As of the time this research was being conducted, Management was planning to acquire
a biometric system also known as the clocking system. This system would register the
time employees reported to work automatically which would not permit any
manipulations. At the end of every month, the data would be extracted and used to pay
part-time lecturers. For fulltime employees, it would be used as part of their assessment
for promotion and other purposes. Generally, employees will perceive promotion to be
fair if it is tied to attendance because it will be questionable to promote an employee
with an abysmal attendance record to a leadership position where he/she will have to
enforce attendance policies that he/she could not adhere to before being promoted.
4.5.2 Counselling and Punishment
Management was planning to have a programme in place to continuously counsel
habitual latecomers and absent employees. This they believed would help them identify
the problems that caused these withdrawal attitudes and help them with suggestions
about how to overcome them. Those who would still put up those attitudes would be
punished. Sometimes employees who were absent without any good cause would have
to forfeit leave days among others. This method according to Greenberg (1995) is good
for the elimination of lateness.
4.5.3 Salaries
Management stated that, they were working hard towards increasing salaries.
According to them, this was difficult at the time because the school was still new and
the student numbers were low. Since they were not being supported by the government
to take care of their expenditure, they had to cater for all costs on their own. The CACI
was their sole sponsor and the rest depended on the funds they were able to generate.
61
They stated that they were preparing a comprehensive outreach programme which they
believed would help increase student numbers so that they could increase salaries.
4.5.4 Assessment
They had also started with assessment of lecturers. Students were given the opportunity
to express what they thought about their lecturers. They were made to comment on
various aspects of their lecturers‟ work. The assessment covered delivery, punctuality,
assignments etc. They were hopeful that students would bring out details that would
help them to improve performance of their lecturers in general and therefore their
attendance and punctuality. This is a widely used method in almost all tertiary
institutions and this may be good for CAUC as well.
62
CHAPTER FIVE
SUMMARY OF FINDINGS, CONCLUSION AND RECOMMENDATIONS
5.0 Introduction
This chapter of the report presents the summary of findings, conclusion and
recommendations of the entire study and highlights the findings in line with the research
questions and objectives. It also gives recommendations to help address the challenges
in controlling lateness, absenteeism and labour turnover at the CAUC.
5.1 Summary of findings
The study revealed the following;
5.1.1 Reporting time
The study revealed that the reporting time to work was not properly communicated to
employees. This was the reason why employees had different opinions as to what the
official reporting time was. This contributed to the employees reporting to work late.
5.1.2 Proximity
It was also revealed that most of the staff stayed far from the CAUC and they took one
hour or more to get to work and this was one reason why they reported to work late.
5.1.3 Length of service
The study revealed that some of the employees planned working with the CAUC for
less than five years for reasons best known to them. This decision was taken before
they joined the CAUC.
63
5.1.4 Low salaries leading to low morale
Again the study revealed that salaries at CAUC was comparatively low compared to
other sister private institutions. Both management and staff agreed to this. According
to some of the staff, it affected their morale and therefore had effect on their reporting
time (lateness), punctuality (absenteeism) and labour turnover (those with intentions of
leaving).
5.1.5 Other factors affecting low morale
It was realised from the study that some employees felt their promotions were being
delayed or there were no opportunities for advancement which was also affecting their
morale.
5.1.6 Childcare
It was realised from the study, that some of the employees were absent sometimes due
to emergencies, childcare, other circumstances such as car problems etc.
5.1.7 Effect of withdrawal behaviours on productivity
The study established that these three withdrawal behaviours were having an effect on
productivity. This was established by the regression analysis.
5.1.8 Challenges in control
Management admitted that they were having challenges in controlling these withdrawal
behaviours. Some of the challenges included the fact that these behaviours to a large
extent were individual attitudes which were difficult to change, attendance registers
were being manipulated, staff were giving justifiable excuses among others.
5.2 Conclusion
The conclusion of the study is that, the staff of CAUC reported late to work or were
sometimes absent mainly because of low morale, emergency situations, reporting time
64
not communicated to them properly and also because most of them stayed far from the
CAUC. It was also realized that their low morale was caused by low salaries and other
factors such as delayed promotion, no opportunities for advancement among others.
The effects of these on productivity were also clearly established. Management
admitted to having challenges in controlling these behaviours basically because, they
were more of human behaviours and attitudes and therefore difficult to change.
5.3 Recommendations
Based on the findings above, the researcher wishes to recommend the following to
Management. It is hoped that when consideration is given to these, lateness,
absenteeism and labour turnover could be reduced at the CAUC.
5.3.1 Communication of reporting time
It is highly recommended that, appointment letters issued to new employees should
include the official reporting time since the study revealed that it was not included in
employees‟ letters of appointment but communicated to them verbally.
5.3.2 Official reporting time
Based on the finding that most of the employees stayed far from the CAUC, it is highly
recommended that official reporting time be changed from 8:00 a.m. to 8:30 a.m and
closing time to 5:30 p.m. instead of 5:00 p.m. if this is suitable for employees. This
would give room to those who stay far from the CAUC to get to work on time. When
all opportunities have been given them to report on time, rules can be enforced when
they report late.
5.3.3 Labour turnover
The study revealed that some of the employees of the CAUC planned working for less
than five years not necessarily because of conditions of service but because of their own
ambitions. It is recommended that management puts in place a good human resource
65
planning and management policy to fill those vacancies as soon as they occur. In the
case of non-teaching staff, coaching, mentoring and other succession planning methods
can be used. In the case of teaching staff, part-time staff can serve as good
replacements when such situations occur.
Generally, labour turnover can be reduced by providing good conditions of service,
investing greatly in training and development, employing good human relations among
others.
5.3.4 Salary and allowance adjustment
It is highly recommended that the Management of CAUC should consider an upward
adjustment to the overall wage and salary structure as well as allowances. This is
because the study revealed that their wages and salaries appeared to be low compared to
other sister private institutions and some of the employees where thinking of looking
elsewhere for other jobs that pay better. This apart from reducing the anticipated
labour turnover would also increase morale and motivate those employees who will
decide to stay with the CAUC.
In addition to increasing salaries, incentives can also be used. Incentives should not
always be monetary. Incentives such as educational support for advancement, best
worker award, public recognition for good performance, regular staff meetings for staff
to express their concerns on issues, reward for punctuality, paying salaries on time
among others. This aside salary increment can motivate staff to stay and reduce labour
turnover.
5.4.5 Promotions and creation of opportunities for advancement
The study revealed that some of the employees had the impression that their promotion
had delayed and some also had the idea that there were no opportunities for
advancement. As much as management can, people due for promotion should be
66
promoted if there is a vacancy. If there are justifiable reasons why they cannot be
promoted, the employees involved should be informed and maybe given some
incremental jumps on their current level of salary. Also, employees should be made
aware and if possible, it should be documented that acquiring further qualifications only
is not a guarantee for promotions.
5.4.6 Tying promotions and cash incentives to attendance
It is further recommended that, promotions and cash incentives should be tied to
attendance and this could help to check lateness and absenteeism. This would require
that proper documentation be kept on lateness and absence issues. If two people with
the same performance level will have to be promoted or given any bonus, the employee
with superb attendance record should receive higher than the employee with abysmal
attendance record. In the same way, it will be questionable to promote an employee
with an abysmal attendance record to a leadership position where he/she will have to
enforce attendance policies that he/she could not adhere to before being promoted.
5.4.7 Biometric clocking system
Although as of the time this research was being conducted, management was planning
to acquire a biometric clocking system, the researcher wishes to stress the importance of
acquiring the system to ensure proper monitoring of attendance. It is important for
Management to note that, checking attendance does not only save cost but also give
clues in case of accidents, theft cases among others.
5.4.8 Closed-circuit television (CCTV) Cameras
With the use of the biometric clocking system however, there is the tendency of
employees clocking their reporting time and then leaving the work premises to attend to
private businesses. To prevent such a situation, CCTV cameras can be used at the entry
and exit gates of the CAUC to monitor employees coming in and going out. This will
67
mean that employees can leave the premises only with permission. It can help to
monitor how long they stay outside even during break.
5.4.9 Strict policies
Further to prevent lateness and absenteeism as the study revealed, management needs to
come out with strict policies regarding lateness and absenteeism. Employees should
know that they will not go unpunished when they default. A written policy can be
prepared to detail out various degrees of punishments that will be given to defaulters
depending on the default. For instance am employee may be made to forfeit some leave
days for absenting himself or herself without permission for say two times in a month.
5.4.10 Control measures
Control measures can be put in place to check absenteeism. For example, an employee
who does not report to work because of sickness should be made to submit an excuse
duty form properly signed by a Doctor. Once a while, the CAUC can follow up to
check the hospital records if an individual employee often reports of sickness. These
would deter employees from pretending to be sick as an excuse to stay away from work.
5.4.11 Childcare
CAUC can create a childcare centre for nursing mothers who may have to absent
themselves from work because their babysitters did not show up to take care of their
babies or because their little kids on vacation do not have anywhere to go. Only a room
with one attendant will be good for a start, depending on the number of nursing mothers
available at a particular period.
68
REFERENCES
AKSU, A.A. (2004), Turnover costs: research among five-star hotels in the city
of Antalya, Turkey. Tourism Analysis, Vol. 9 No. 3, pp. 207-17
ALLEGRO, J.T., VEERMAN, T.J. (1990), Absenteeism, in Drenth, In:
THIERRY, H., DE WOLFF, C.J. (eds.), New Introduction Book of Labour and
Organisation Psychology, Part 3,Van Loghum Slaterus: Deventer, pp. 9-41.
BARTON, J. (1994),Choosing to work at night: A moderating influence on
individual tolerance to shift work. Journal of Applied Psychology, Vol. 79, pp
449–454
BLAU, G.J. (1986), Job involvement and organisational commitment as
interactive predictors of tardiness and absenteeism. Journal of Management,
Vol. 12, pp. 577-84
BLAU, G. (1994), Developing and testing taxonomy of lateness behaviour.
Journal of Applied Psychology, Vol. 79, pp. 959–970
BLOTCH, M. (2001), The coming crunch; Human Resource Training Magazine,
April 22, pp. 42-46
BOWERS, T. (2001), Teacher absenteeism and ill health retirement: a review.
Cambridge Journal of Education, Vol. 31 No. 2, pp. 135-157
BROWNELL, K. D., JUDI, R. (1998) Striking a balance; the future of work and
Family issues in the Hospitality industry, Binghamton: The Haworth Press
inc.Vol.28 No1, 2, pp 21-26.
BROWN, S. (1999), Worker absenteeism and overtime bans. Applied
Economics, Vol. 31, pp. 165-74
BROWN, S. (1999), Dynamic implications of absence behaviour. Applied
Economics, Vol. 26, pp. 1163-75.
BRIDGES, S., MUMFORD, K. (2001), Predicting teacher absenteeism by
personal background factors. Journal of Educational Administration, Vol.
43, No. 2, pp. 209-225
CARBERY, R., GARAVAN, T.N., O‟BRIEN, F., MCDONNELL, J. (2003),
Predicting Hotel managers’ turnover cognitions. Journal of Managerial
Psychology, Vol. 18 No. 7, pp.649-79
CASCIO, W.F. (2003), Managing Human Resources: Productivity, Quality of
Work Life, Profits, 6th ed., Boston: McGraw-Hill, Boston
69
DELONZOR, D. (2005), Running late: Dealing with chronically late employees
who cost the company in productivity and morale, HR Magazine,
November, 109–112.
FAIR, R. (1992), Australian Human Resource Management: Framework and
practice, 2nd
Ed. McGraw-Hill
FITZ-ENZ, J. (1997), It’s costly to lose good employees. Workforce, Vol. 76, No.
8, p. 43
GREENBERG, J. (1995), Stress fairness to fare no stress: managing workplace
stress by promoting organizational justice. Organizational Dynamics, Vol. 33,
pp. 352-365.
GUPTA, N., SHAW, J. (2001), Pay fairness and Employee outcomes,
Exacerbation and attenuation effects of financial needs. Journal of
Occupational and Organizational Psychology, Vol. 74 (3), p. 22
HACKETT, R.D. (1990), Age, tenure, and employee absenteeism, Human
Relations, Vol. 43,pp. 601-618.
HARVEY, J., NICHOLSON, N. (1999), Minor illness as a legitimate reason for
absence. Journal of Organizational Behaviour, Vol. 20, pp. 979-993.
HIEMSTRA, S.J. (1990), Employment policies and practices in the lodging
industry. International Journal of Hospitality Management, Vol. 9 (No.3) pp.
207-221
HILL, J. M., TRIST, E. L. (1955), Changes in accidents and other absences with
length of service: A further study of their incidence and relation to each other
in an iron and steel works. Human Relations, Vol. 8, pp. 121–152
HINKIN, T.R., TRACEY, J.B. (2000), Impact of your employees resigning from
work. International journal of Industrial Organization, Vol. 16, (Issue 3), pp
353-376.
JAMAL, M. (1984), Job stress and job performance controversy: an empirical
assessment. Organisational Behaviour and Human Performance, Vol. 33, pp.
1-21
JOHNS, G. (1997), Contemporary research on absence from work: Correlates,
causes, And consequences. In: COOPER C.I, ROBERTSON, I. T. (eds.),
International review of industrial and organizational psychology. New York:
Wiley, Vol. 12, pp. 113–173
JOHNS, G. (2003), How methodological diversity has improved our
understanding of absenteeism from work. Human Resource Management
Review, Vol. 13, pp. 157-184.
JOHNS, G. (2008), Absenteeism and absenteeism: not at work or not working
70
well. In: COOPER, C.L., BARLING, J. (eds.), The Sage Handbook of
Organizational Behaviour. London: Sage, Vol. 1, pp. 160-177
JUDGE, T.A., MARTOCCHIO, J.J., THORESEN, C.J. (1997), Five factor model
of personality and employee absence. Journal of Applied Psychology,
Vol. 82, pp. 745-55
KASLOWSKY, M., KLUGER, A. N., REICH, M. (1995), Commuting stress:
Causes, effects, and methods of coping. New York: Plenum Press, pp
KOHLER, S.S., MATHIEU, J.E. (1993), Individual characteristics, work
perception, and affective reactions’ influence on differentiated absence
criteria. Journal of Organizational Behaviour, Vol. 14, pp. 515-30
Local Government Auditor (1999), The Absenteeism Report, Local Government
Auditor, Belfast
MITRA, A., JENKINS, G.D., GUPTA, N. (1992), A meta-analysis review of the
relationship between absence and turnover. Journal of Applied Psychology,
Vol.1 No. 3, p 879-889.
MOBLEY, W. H. (1977), Intermediate linkages in the relationship between job
satisfaction and turnover. Journal of Applied Psychology, Vol. 62, pp. 237-240
MUCHINSKY, P. (1977), Employee absenteeism: a review of the literature.
Journal of Vocational Behaviour, Vol. 10, pp. 316-40
NAVARRO, C., BASS, C. (2006), The cost of employee absenteeism,
Compensation and Benefits Review, International journal of Industrial
Organization, Vol. 38, pp. 26–30.
PHILLIPS, J.A., CONNEL, G.T (2003) Accountability in Human Resource
Management, Boston: Butterworth-Heinemann, pp. 25-28
PINDER, C. C., (2008), Work motivation in organisational behaviour, 2nd
Ed.
New York: Psychological Press, p. 40
PRICE, J.L. (1995), A role for demographic variables in the study of absenteeism
and turnover. The International Journal of Career Management, Vol. 7 No. 5,
pp. 26-32
71
RALSTON, D. A. (1989), The benefits of flextime: real or imagined? Journal of
Organisational Behaviour, VOL. 10 NO. 4, PP. 369 – 373
RICHARD, D. R., SLANE, S. (1990), Punctuality as a personality characteristic:
issues of measurement. Journal of Psychology, VOL. 124 NO. 4, PP.
SAGIE, A. (1998), Employee absenteeism, organizational commitment and job
satisfaction: Another look. Journal of Vocational Behaviour, Vol. 52, pp. 156–
171
SAUNDERS, M., LEWIS, P., THORNHILL, A. (2009), Research Methods for
Business Students, 5th
Edition. Sidney: Prentice Hall, p. 219
SCOTT, K.D., MCCLELLAN, E.L. (1990), Gender differences in absenteeism.
Public Personnel Management, Vol. 19 No. 2, pp. 229-53
SCHWARZWALD, J., KOSLOWSKY, M., SHALIT, B. (1992), A field study of
employees’ attitudes and behaviours after promotion decisions. Journal of
Applied Psychology, Vol. 77 No. 4, pp. 511-4.
SHAFRITZ, J. M. (1980),Dictionary of personnel management and labour
relations, Oak Park, IL: Moore
SQUELCH, J. (2000), Discipline: Impact on access to equal educational
opportunities. South African Journal of Education, Vol. 22, pp. 77-86
STEEL, R. P., RENTSCH, J.R (1995), The dispositional model of job attitudes
revisited, Journal of Applied Psychology, Vol. 82 No. 6, pp. 873-879
STEEL, R.P. (2003), Methodological and operational issues in the construction
of absence variables. Human Resource Management Review, Vol. 13, pp.
243-51
STEEL, R.P. (2003), Psychometric theory and the problem of relating prior and
Subsequent Absences. Journal of Organizational Behaviour, Vol. 11, pp. 407-
11
UBEKU, A.K., (1975), Personnel Management in Nigeria, Benin City: Ethiope
Publishing Company, pp 5-7
VANDENHEUVEL, A., WOODEN, M. (1995), Do explanations of absenteeism
differ for men and women? Human Relations, Vol. 48 No. 11, pp. 1309-29
WINKELMANN, R. (1999), Wages, firm size and absenteeism. Applied
Economics Letters, Vol. 6 No. 6, pp. 337-41.
WOODEN, M. (1995), Labour absence in Australia: an overview of dimensions,
causes and remedial strategies, Australian Bulletin of Labour, Vol. 21, pp. 323-
39

72
WOOD, R.H., MACAULAY, G .H. (1991), Predicting is difficult, especially
about the future: Human resources in the new millennium. International
Journal of Hospitality Management, Vol. 18 (4), pp. 443-456
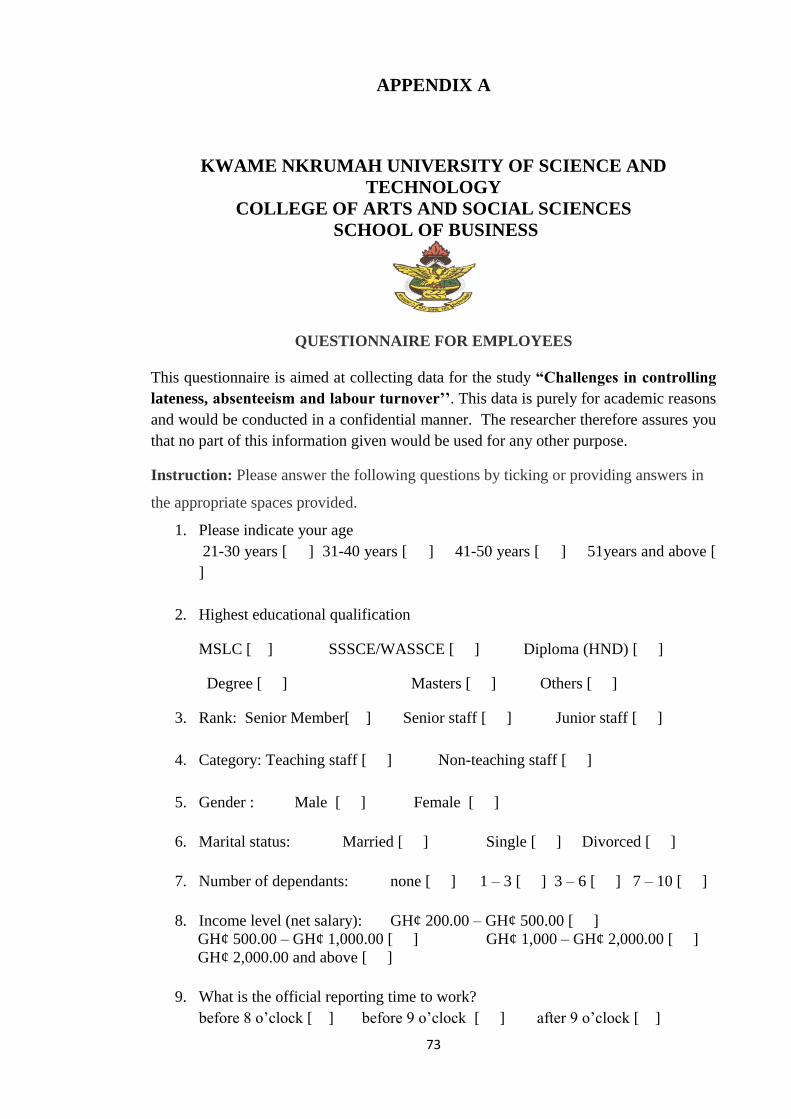
73
APPENDIX A
KWAME NKRUMAH UNIVERSITY OF SCIENCE AND
TECHNOLOGY
COLLEGE OF ARTS AND SOCIAL SCIENCES
SCHOOL OF BUSINESS
QUESTIONNAIRE FOR EMPLOYEES
This questionnaire is aimed at collecting data for the study “Challenges in controlling
lateness, absenteeism and labour turnover’’. This data is purely for academic reasons
and would be conducted in a confidential manner. The researcher therefore assures you
that no part of this information given would be used for any other purpose.
Instruction: Please answer the following questions by ticking or providing answers in
the appropriate spaces provided.
1. Please indicate your age
21-30 years [ ] 31-40 years [ ] 41-50 years [ ] 51years and above [
]
2. Highest educational qualification
MSLC [ ] SSSCE/WASSCE [ ] Diploma (HND) [ ]
Degree [ ] Masters [ ] Others [ ]
3. Rank: Senior Member[ ] Senior staff [ ] Junior staff [ ]
4. Category: Teaching staff [ ] Non-teaching staff [ ]
5. Gender : Male [ ] Female [ ]
6. Marital status: Married [ ] Single [ ] Divorced [ ]
7. Number of dependants: none [ ] 1 – 3 [ ] 3 – 6 [ ] 7 – 10 [ ]
8. Income level (net salary): GH¢ 200.00 – GH¢ 500.00 [ ]
GH¢ 500.00 – GH¢ 1,000.00 [ ] GH¢ 1,000 – GH¢ 2,000.00 [ ]
GH¢ 2,000.00 and above [ ]
9. What is the official reporting time to work?
before 8 o‟clock [ ] before 9 o‟clock [ ] after 9 o‟clock [ ]
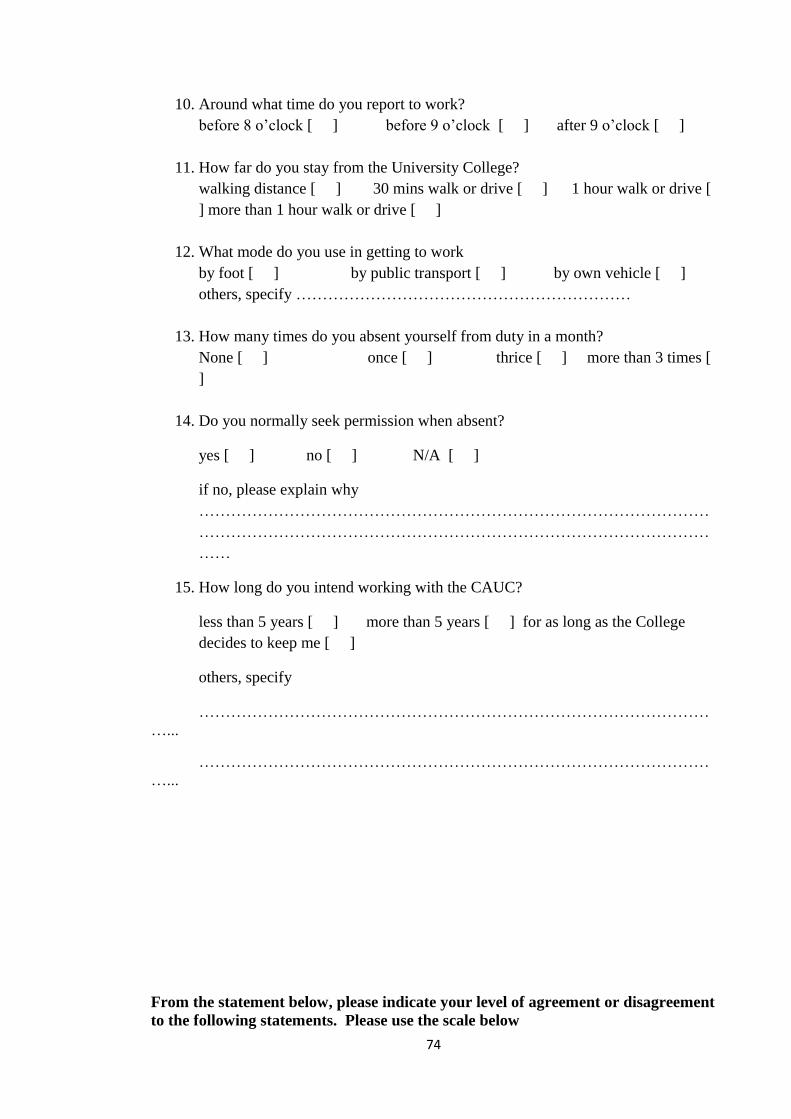
74
10. Around what time do you report to work?
before 8 o‟clock [ ] before 9 o‟clock [ ] after 9 o‟clock [ ]
11. How far do you stay from the University College?
walking distance [ ] 30 mins walk or drive [ ] 1 hour walk or drive [
] more than 1 hour walk or drive [ ]
12. What mode do you use in getting to work
by foot [ ] by public transport [ ] by own vehicle [ ]
others, specify ………………………………………………………
13. How many times do you absent yourself from duty in a month?
None [ ] once [ ] thrice [ ] more than 3 times [
]
14. Do you normally seek permission when absent?
yes [ ] no [ ] N/A [ ]
if no, please explain why
……………………………………………………………………………………
……………………………………………………………………………………
……
15. How long do you intend working with the CAUC?
less than 5 years [ ] more than 5 years [ ] for as long as the College
decides to keep me [ ]
others, specify
……………………………………………………………………………………
…...
……………………………………………………………………………………
…...
From the statement below, please indicate your level of agreement or disagreement
to the following statements. Please use the scale below
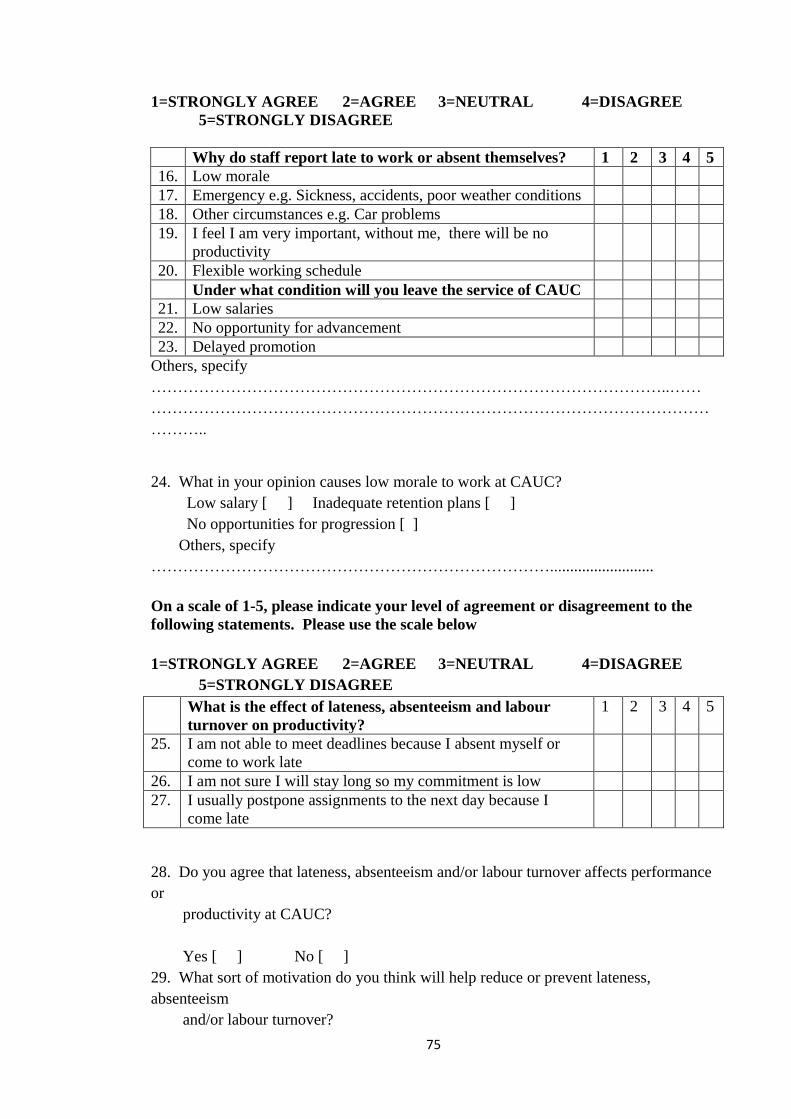
75
1=STRONGLY AGREE 2=AGREE 3=NEUTRAL 4=DISAGREE
5=STRONGLY DISAGREE
Why do staff report late to work or absent themselves? 1 2 3 4 5
16. Low morale
17. Emergency e.g. Sickness, accidents, poor weather conditions
18. Other circumstances e.g. Car problems
19. I feel I am very important, without me, there will be no
productivity
20. Flexible working schedule
Under what condition will you leave the service of CAUC
21. Low salaries
22. No opportunity for advancement
23. Delayed promotion
Others, specify
……………………………………………………………………………………..……
……………………………………………………………………………………………
………..
24. What in your opinion causes low morale to work at CAUC?
Low salary [ ] Inadequate retention plans [ ]
No opportunities for progression [ ]
Others, specify
…………………………………………………………………..........................
On a scale of 1-5, please indicate your level of agreement or disagreement to the
following statements. Please use the scale below
1=STRONGLY AGREE 2=AGREE 3=NEUTRAL 4=DISAGREE
5=STRONGLY DISAGREE
What is the effect of lateness, absenteeism and labour
turnover on productivity?
1 2 3 4 5
25. I am not able to meet deadlines because I absent myself or
come to work late
26. I am not sure I will stay long so my commitment is low
27. I usually postpone assignments to the next day because I
come late
28. Do you agree that lateness, absenteeism and/or labour turnover affects performance
or
productivity at CAUC?
Yes [ ] No [ ]
29. What sort of motivation do you think will help reduce or prevent lateness,
absenteeism
and/or labour turnover?
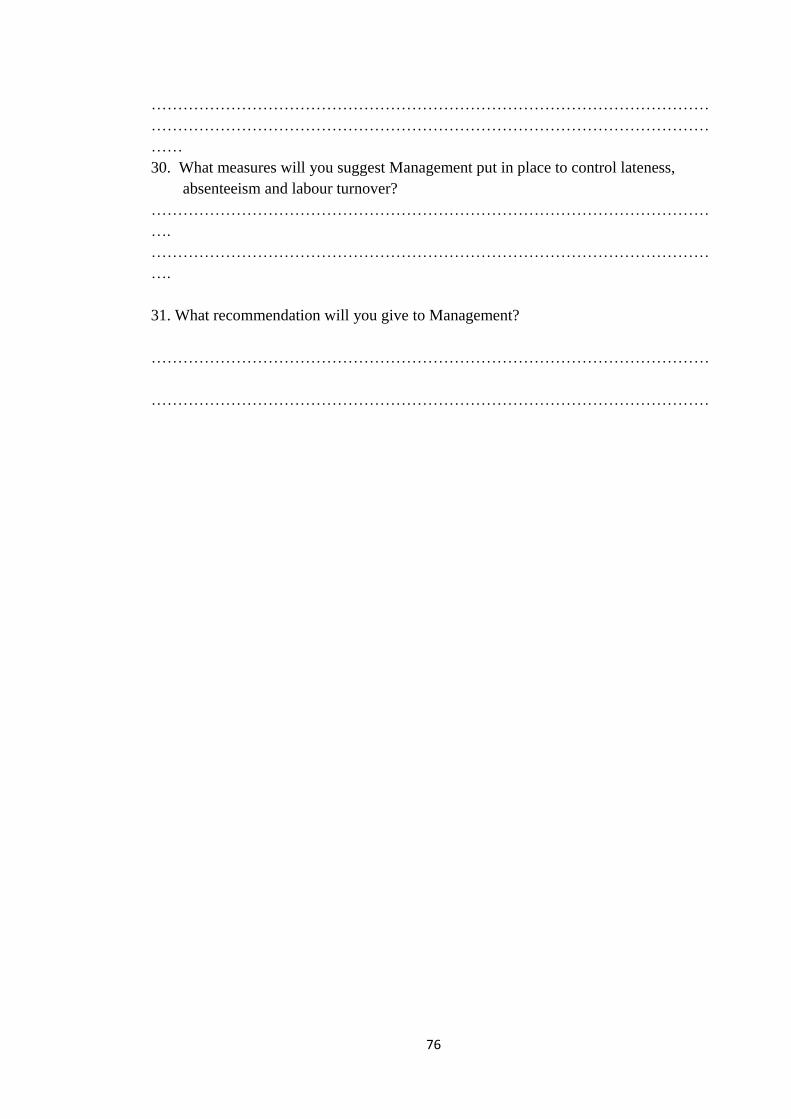
76
……………………………………………………………………………………………
……………………………………………………………………………………………
……
30. What measures will you suggest Management put in place to control lateness,
absenteeism and labour turnover?
……………………………………………………………………………………………
….
……………………………………………………………………………………………
….
31. What recommendation will you give to Management?
……………………………………………………………………………………………
……………………………………………………………………………………………
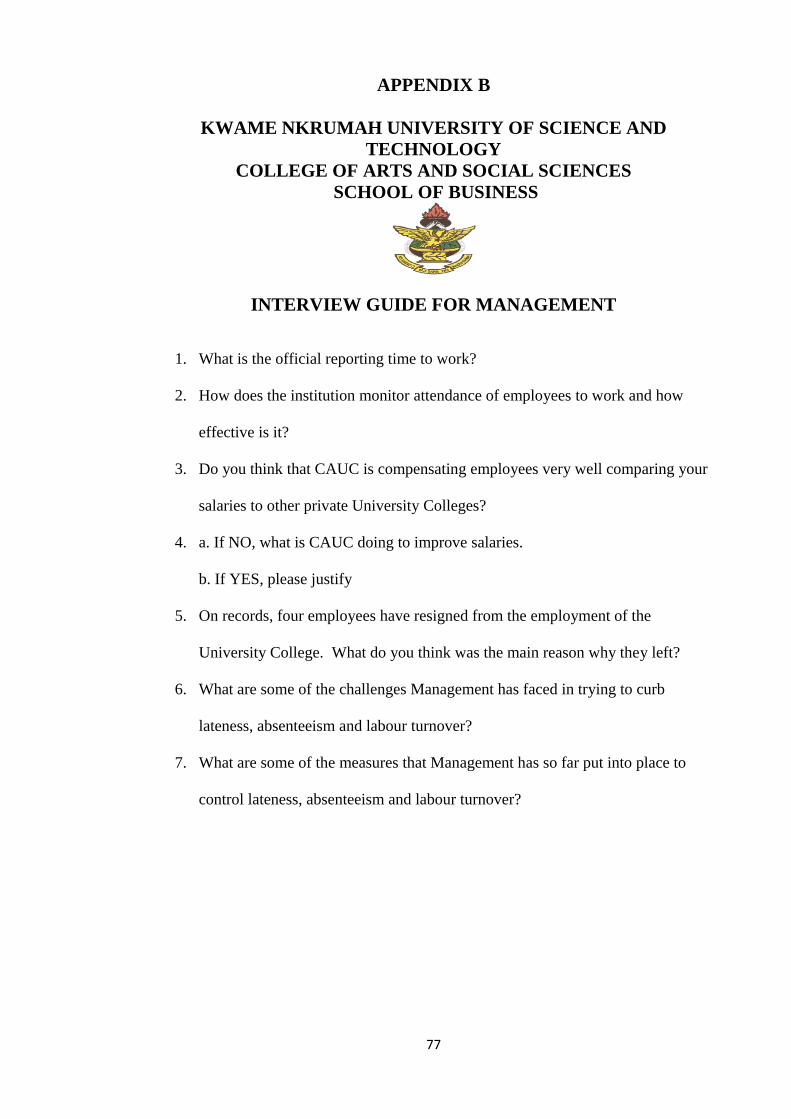
77
APPENDIX B
KWAME NKRUMAH UNIVERSITY OF SCIENCE AND
TECHNOLOGY
COLLEGE OF ARTS AND SOCIAL SCIENCES
SCHOOL OF BUSINESS
INTERVIEW GUIDE FOR MANAGEMENT
1. What is the official reporting time to work?
2. How does the institution monitor attendance of employees to work and how
effective is it?
3. Do you think that CAUC is compensating employees very well comparing your
salaries to other private University Colleges?
4. a. If NO, what is CAUC doing to improve salaries.
b. If YES, please justify
5. On records, four employees have resigned from the employment of the
University College. What do you think was the main reason why they left?
6. What are some of the challenges Management has faced in trying to curb
lateness, absenteeism and labour turnover?
7. What are some of the measures that Management has so far put into place to
control lateness, absenteeism and labour turnover?