challenges in mining: scarcity or opportunity? · 23/06/2015 · challenges in mining: scarcity or...
TRANSCRIPT
Challenges in Mining:
Scarcity or Opportunity?
June 23, 2015
World Materials Forum
CONFIDENTIAL AND PROPRIETARY
Any use of this material without specific permission of McKinsey & Company is strictly prohibited
Contribution of Advanced Technologies

McKinsey & Company | 1
65
70
75
80
85
90
95
100
105
110
-6.0% p.a.
-0.4% p.a.
-3.5% p.a.
201312111009080706052004
SOURCE: Company annual reports; McKinsey analysis
McKinsey Mining Productivity
Index, 2004 = 100
Mining productivity globally has declined ~30% over the past decade
▪ Between 2004 and
2013, global mining
productivity has
fallen ~30%, or
3.5% p.a., even
after accounting for
geological
degradation
McKinsey & Company | 2
McKinsey Mine Productivity Index
CAGR, 2009 - 2013
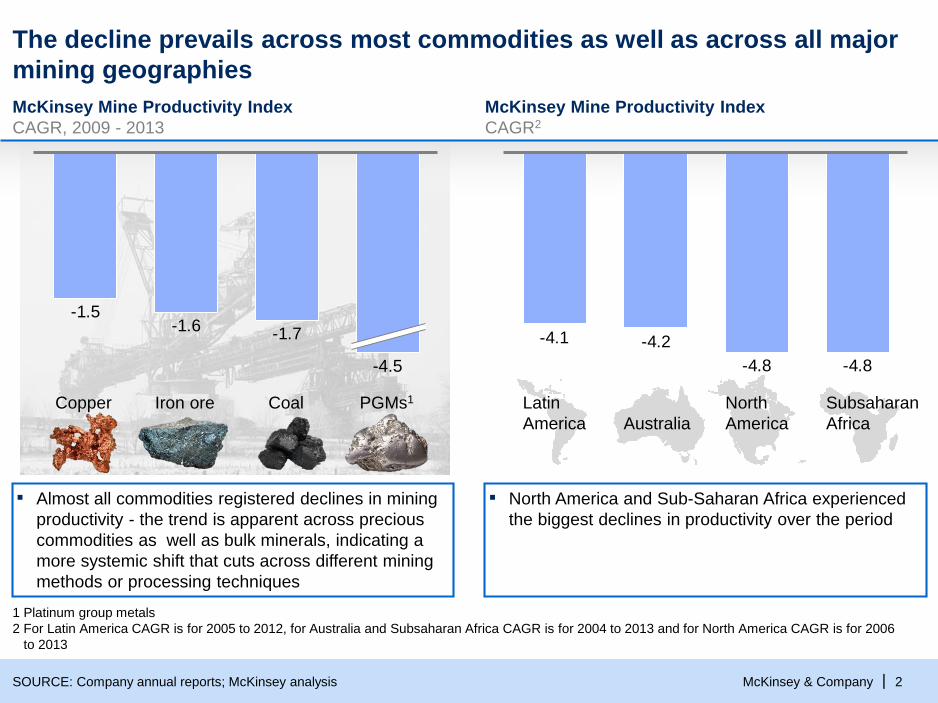
▪ Almost all commodities registered declines in mining
productivity - the trend is apparent across precious
commodities as well as bulk minerals, indicating a
more systemic shift that cuts across different mining
methods or processing techniques
The decline prevails across most commodities as well as across all major
mining geographies
SOURCE: Company annual reports; McKinsey analysis
-1.7-1.6
-1.5
PGMs1
-4.5
CoalIron oreCopper
1 Platinum group metals
2 For Latin America CAGR is for 2005 to 2012, for Australia and Subsaharan Africa CAGR is for 2004 to 2013 and for North America CAGR is for 2006
to 2013
▪ North America and Sub-Saharan Africa experienced
the biggest declines in productivity over the period
-4.8-4.8
-4.2-4.1
Subsaharan
Africa
North
AmericaAustralia
Latin
America
McKinsey Mine Productivity Index
CAGR2

McKinsey & Company | 3
The industry also faces dramatic capital and operating costs escalations
SOURCE: Company annual reports; McKinsey analysis
72
100
-3.5% p.a.
20132004
MineLens Productivity Index
indexed, 2004 = 100
345
100
178
100
1001,681
100
2004 2013
446
Employment, number of
workers
indexed, 2004 = 100
Capital expenditures,
asset value
indexed, 2004 = 100 in
real terms2
Operating expenditures,
excluding labor cost
indexed, 2004 = 100 in
real terms2
Production, mined
volume
indexed, 2004 = 100
CAGR,1 2004-13
%
14.8%
6.6%
36.8%
18.1%
1 Compound annual growth rate
2 Capital expenditures and operating expenditures adjusted for mine cost inflation
McKinsey & Company | 4
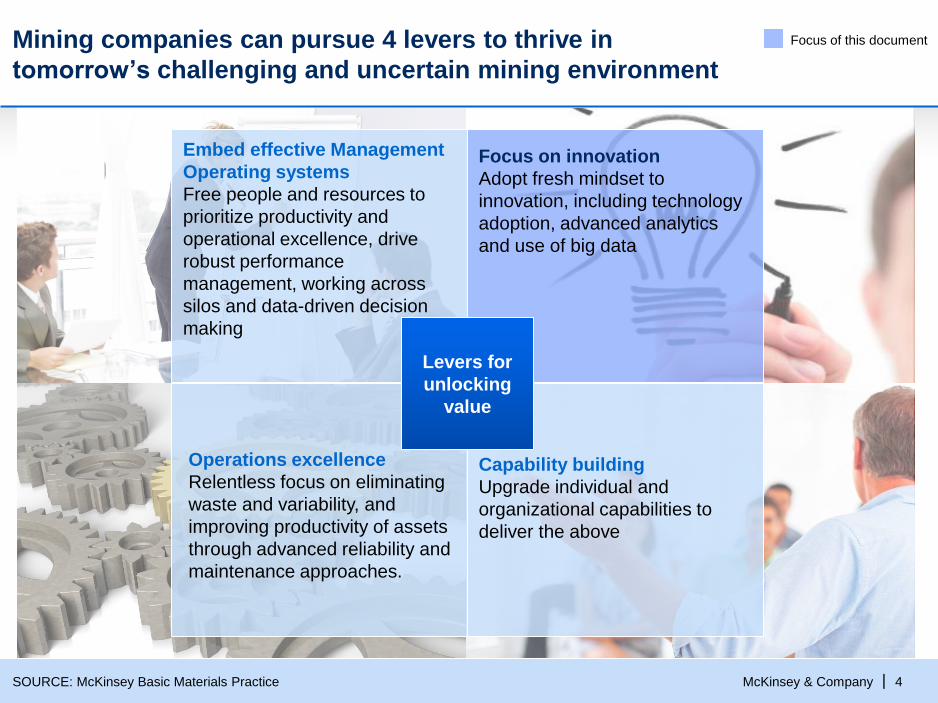
Mining companies can pursue 4 levers to thrive in
tomorrow’s challenging and uncertain mining environment
SOURCE: McKinsey Basic Materials Practice
Capability building
Upgrade individual and
organizational capabilities to
deliver the above
Operations excellence
Relentless focus on eliminating
waste and variability, and
improving productivity of assets
through advanced reliability and
maintenance approaches.
Focus on innovation
Adopt fresh mindset to
innovation, including technology
adoption, advanced analytics
and use of big data
Embed effective Management
Operating systems
Free people and resources to
prioritize productivity and
operational excellence, drive
robust performance
management, working across
silos and data-driven decision
making
Levers for
unlocking
value
Focus of this document
McKinsey & Company | 5
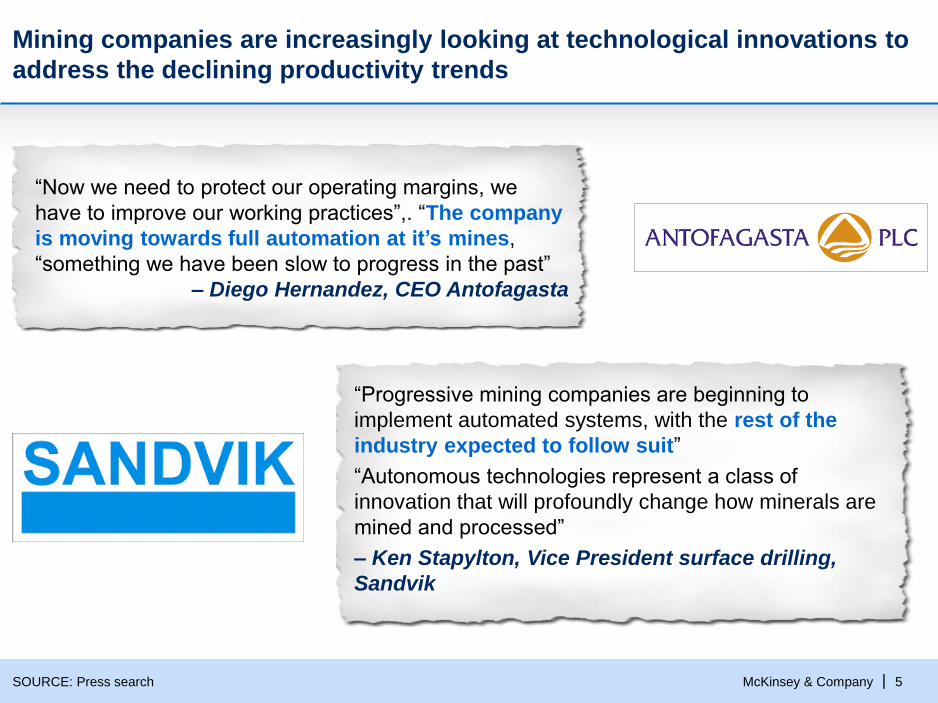
Mining companies are increasingly looking at technological innovations to
address the declining productivity trends
SOURCE: Press search
“Now we need to protect our operating margins, we
have to improve our working practices”,. “The company
is moving towards full automation at it’s mines,
“something we have been slow to progress in the past”
– Diego Hernandez, CEO Antofagasta
“Progressive mining companies are beginning to
implement automated systems, with the rest of the
industry expected to follow suit”
“Autonomous technologies represent a class of
innovation that will profoundly change how minerals are
mined and processed”
– Ken Stapylton, Vice President surface drilling,
Sandvik
McKinsey & Company | 6
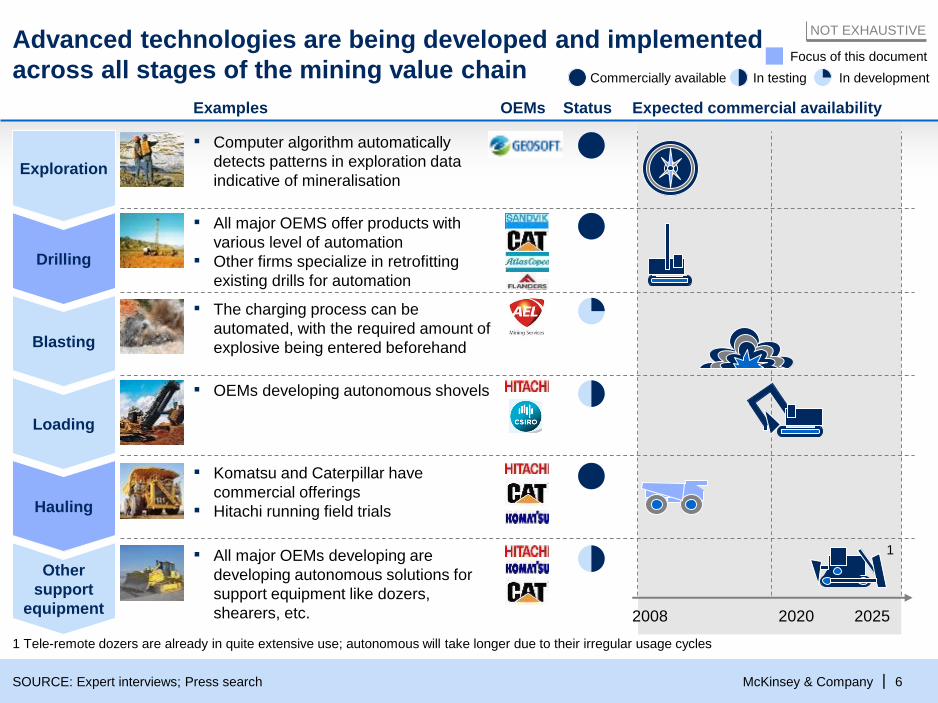
NOT EXHAUSTIVEAdvanced technologies are being developed and implemented
across all stages of the mining value chainFocus of this document
In developmentIn testingCommercially available
SOURCE: Expert interviews; Press search
Exploration
Drilling
Blasting
Loading
Hauling
Other
support
equipment
Expected commercial availability
2008 2020 2025
▪ Computer algorithm automatically
detects patterns in exploration data
indicative of mineralisation
▪ All major OEMS offer products with
various level of automation
▪ Other firms specialize in retrofitting
existing drills for automation
▪ OEMs developing autonomous shovels
▪ Komatsu and Caterpillar have
commercial offerings
▪ Hitachi running field trials
▪ All major OEMs developing are
developing autonomous solutions for
support equipment like dozers,
shearers, etc.
▪ The charging process can be
automated, with the required amount of
explosive being entered beforehand
Examples StatusOEMs
1 Tele-remote dozers are already in quite extensive use; autonomous will take longer due to their irregular usage cycles
1
McKinsey & Company | 7
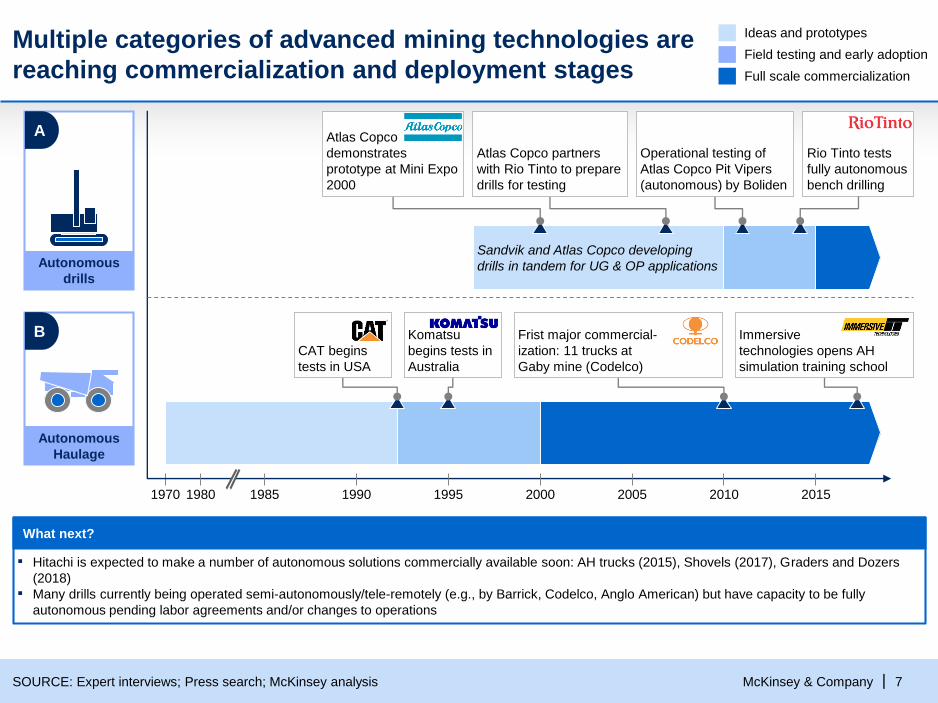
Multiple categories of advanced mining technologies are
reaching commercialization and deployment stages
SOURCE: Expert interviews; Press search; McKinsey analysis
Ideas and prototypes
Field testing and early adoption
Full scale commercialization
1970 1980 1985 1990 1995 2000 2005 2010 2015
What next?
▪ Hitachi is expected to make a number of autonomous solutions commercially available soon: AH trucks (2015), Shovels (2017), Graders and Dozers
(2018)
▪ Many drills currently being operated semi-autonomously/tele-remotely (e.g., by Barrick, Codelco, Anglo American) but have capacity to be fully
autonomous pending labor agreements and/or changes to operations
Autonomous
Haulage
Immersive
technologies opens AH
simulation training school
CAT begins
tests in USA
Komatsu
begins tests in
Australia
Frist major commercial-
ization: 11 trucks at
Gaby mine (Codelco)
Autonomous
drills
Sandvik and Atlas Copco developing
drills in tandem for UG & OP applications
Atlas Copco
demonstrates
prototype at Mini Expo
2000
Atlas Copco partners
with Rio Tinto to prepare
drills for testing
Operational testing of
Atlas Copco Pit Vipers
(autonomous) by Boliden
Rio Tinto tests
fully autonomous
bench drilling
A
B
McKinsey & Company | 8SOURCE: Press search; Company brochures
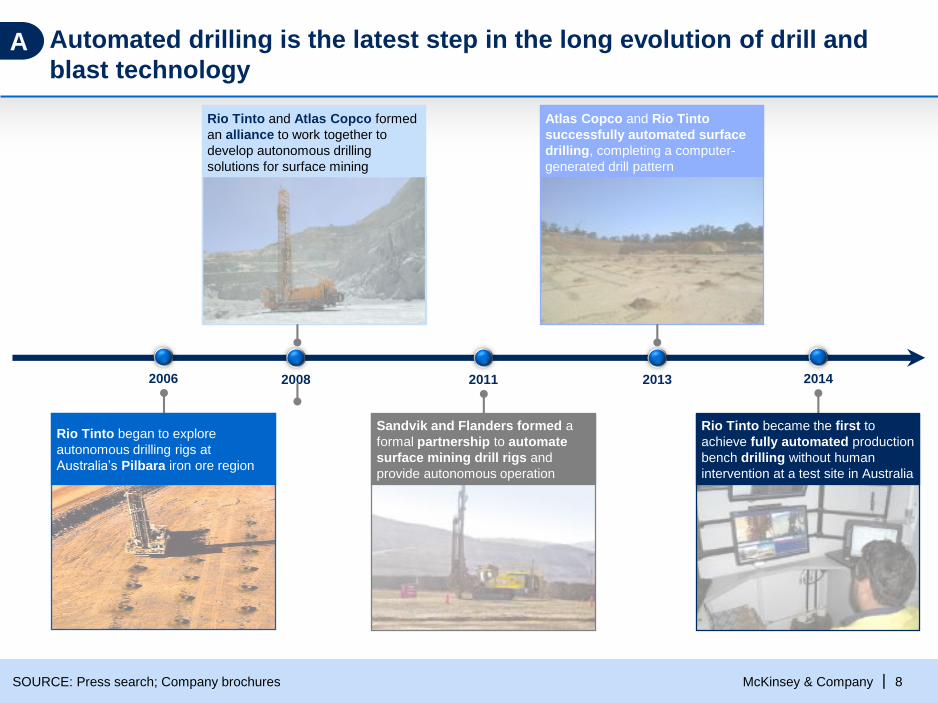
2008 2011 2013 20142006
Automated drilling is the latest step in the long evolution of drill and
blast technology
Sandvik and Flanders formed a
formal partnership to automate
surface mining drill rigs and
provide autonomous operation
Rio Tinto began to explore
autonomous drilling rigs at
Australia’s Pilbara iron ore region
Rio Tinto became the first to
achieve fully automated production
bench drilling without human
intervention at a test site in Australia
Atlas Copco and Rio Tinto
successfully automated surface
drilling, completing a computer-
generated drill pattern
Rio Tinto and Atlas Copco formed
an alliance to work together to
develop autonomous drilling
solutions for surface mining
A

McKinsey & Company | 9
Autonomous haulage has three key components
SOURCE: Expert Interviews; McKinsey Analysis
Description
▪ Standard truck body
▪ Onboard embedded systems and real-time operating software
informing and controlling the truck’s activities (e.g., sensors,
computers, video system, traction control, GPS tracking, and
radio receptivity for remote inputs)
Base vehicle
& automa-
tion kit
▪ High-capacity communications network
▪ GPS locators for all vehicles within the orbit of AH trucks
Critical mine
site infra-
structure
▪ Headquarters from which trucks monitored/remotely controlled
▪ Can be on-site or off-site (e.g., Rio Tinto is experimenting with
controlling autonomous equipment from 1500km away)
▪ Operator ensures adherence of vehicles to loading, dumping,
and traffic management plans, makes adjustments to vehicles’
trajectories where necessary, and restarts the trucks in case of
automatic shutdown triggered by trucks’ safety protocols
▪ 1 operator can track the progress of numerous vehicles
Command
and control
centre
B
1
2
3

McKinsey & Company | 10SOURCE: Technology Metals Research, expert interviews
0
1
2
3
4
5
6
7
8
9
10
12345678910111213
Niobec
Ore grade% TREO
Araxá
Mountain Pass
Mount Weld Duncan
Nechalacho
Strange Lake
Ngualla
Mount Weld
Dubo
NON-EXHAUSTIVE
Heavy1 Light
1 Heavy rare earths projects are the ones with more than 15% of total rare earth content of heavy elements
Size of the bubble indicates resource size
Two large projects close
to production, focused
on light rare earths
Innovation is key to overcome scarcity
issues in rare raw materials
Minimum lead timeYears
Drilling Pre-feasibility Feasibility Construction Ramp-
up
Levers to drive change
▪ Effective management
systmens
▪ Operational excellence
▪ Innovation across the
whole supply chain
▪ Capacity building
Long term industry sustainability requires additional
projects at later stages of the project pipeline
McKinsey & Company | 11
BACKUP (Presented on ad-hoc basis if there are questions)
McKinsey & Company | 12
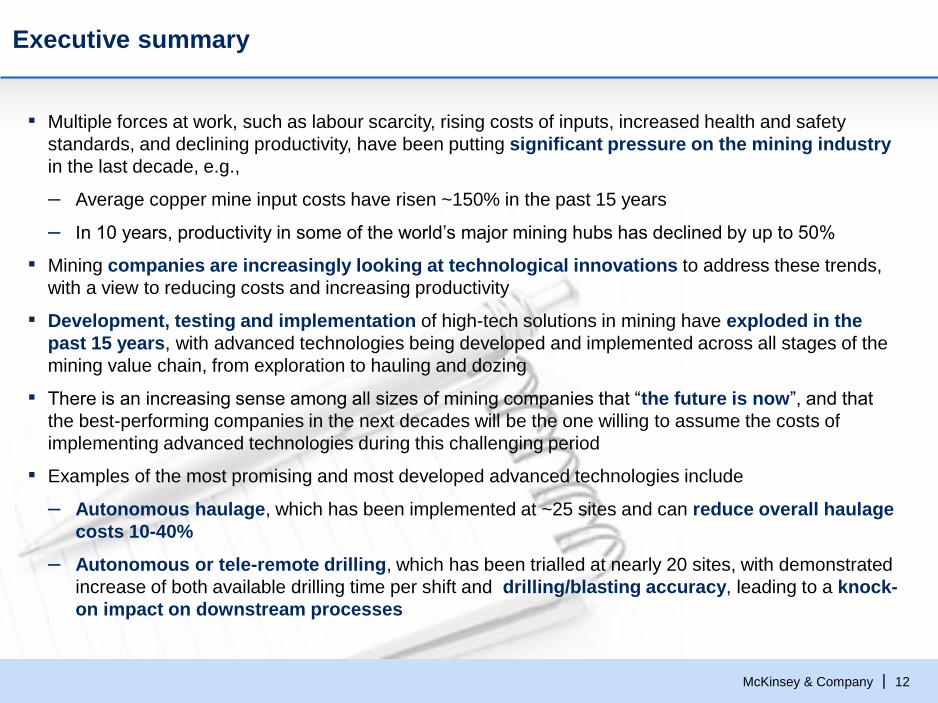
Executive summary
▪ Multiple forces at work, such as labour scarcity, rising costs of inputs, increased health and safety
standards, and declining productivity, have been putting significant pressure on the mining industry
in the last decade, e.g.,
– Average copper mine input costs have risen ~150% in the past 15 years
– In 10 years, productivity in some of the world’s major mining hubs has declined by up to 50%
▪ Mining companies are increasingly looking at technological innovations to address these trends,
with a view to reducing costs and increasing productivity
▪ Development, testing and implementation of high-tech solutions in mining have exploded in the
past 15 years, with advanced technologies being developed and implemented across all stages of the
mining value chain, from exploration to hauling and dozing
▪ There is an increasing sense among all sizes of mining companies that “the future is now”, and that
the best-performing companies in the next decades will be the one willing to assume the costs of
implementing advanced technologies during this challenging period
▪ Examples of the most promising and most developed advanced technologies include
– Autonomous haulage, which has been implemented at ~25 sites and can reduce overall haulage
costs 10-40%
– Autonomous or tele-remote drilling, which has been trialled at nearly 20 sites, with demonstrated
increase of both available drilling time per shift and drilling/blasting accuracy, leading to a knock-
on impact on downstream processes

McKinsey & Company | 13
These forces will have determine how mines are set up and run in the future
SOURCE: McKinsey Basic Materials Practice
Increasing price
volatility
(by-product
credits)
Global sourcing
changing
equipment
industry
structure
Declining
productivity
Rising cost of
production
inputs
Demand growth
fueled by population
growth and socio-
economic changes
Increasingly
challenging
geologies
Labor scarcity
Continuously
increasing
safety,
health and
environment
standards
The mining industry faces multiple forces which will adversely impact
industry economics going forward
McKinsey & Company | 14
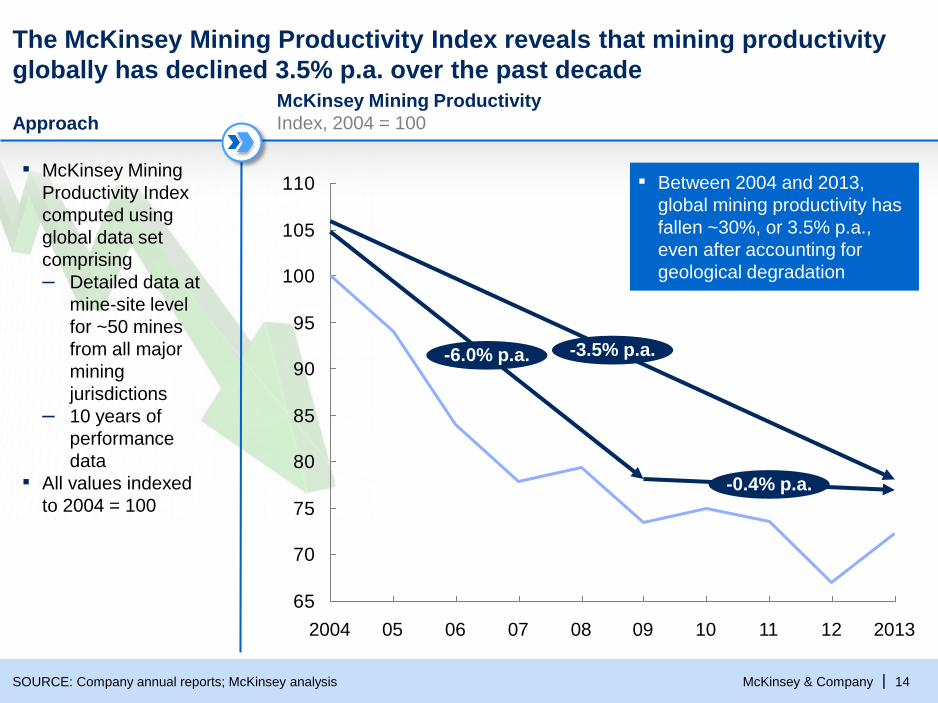
Approach
The McKinsey Mining Productivity Index reveals that mining productivity
globally has declined 3.5% p.a. over the past decade
▪ McKinsey Mining
Productivity Index
computed using
global data set
comprising
– Detailed data at
mine-site level
for ~50 mines
from all major
mining
jurisdictions
– 10 years of
performance
data
▪ All values indexed
to 2004 = 100
65
70
75
80
85
90
95
100
105
110
-6.0% p.a.
-0.4% p.a.
-3.5% p.a.
201312111009080706052004
SOURCE: Company annual reports; McKinsey analysis
▪ Between 2004 and 2013,
global mining productivity has
fallen ~30%, or 3.5% p.a.,
even after accounting for
geological degradation
McKinsey Mining Productivity
Index, 2004 = 100
McKinsey & Company | 15
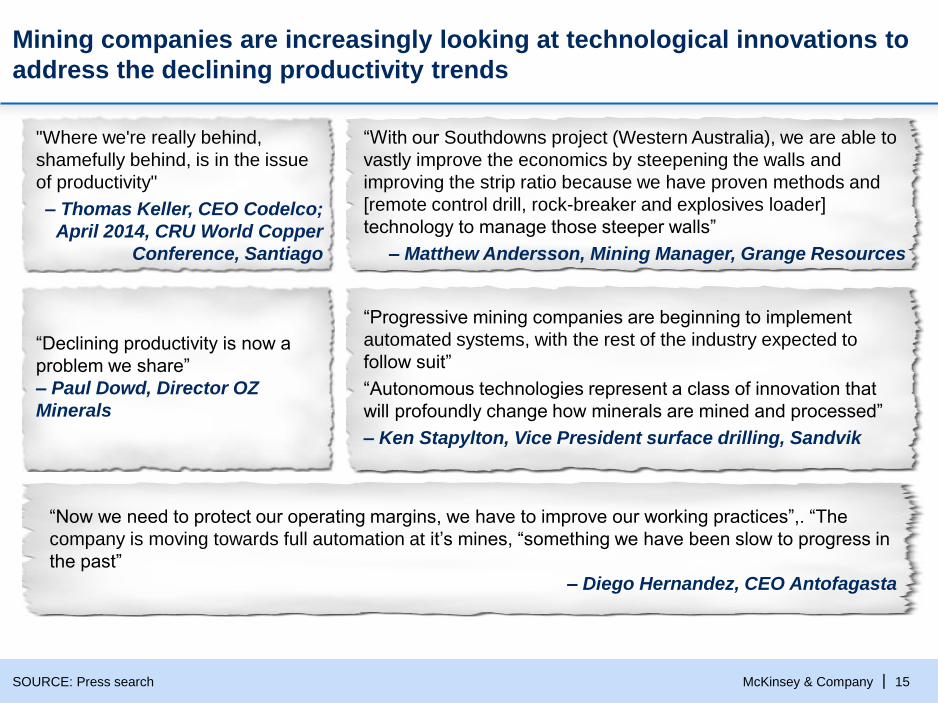
Mining companies are increasingly looking at technological innovations to
address the declining productivity trends
SOURCE: Press search
"Where we're really behind,
shamefully behind, is in the issue
of productivity"
– Thomas Keller, CEO Codelco;
April 2014, CRU World Copper
Conference, Santiago
“Now we need to protect our operating margins, we have to improve our working practices”,. “The
company is moving towards full automation at it’s mines, “something we have been slow to progress in
the past”
– Diego Hernandez, CEO Antofagasta
“With our Southdowns project (Western Australia), we are able to
vastly improve the economics by steepening the walls and
improving the strip ratio because we have proven methods and
[remote control drill, rock-breaker and explosives loader]
technology to manage those steeper walls”
– Matthew Andersson, Mining Manager, Grange Resources
“Declining productivity is now a
problem we share”
– Paul Dowd, Director OZ
Minerals
“Progressive mining companies are beginning to implement
automated systems, with the rest of the industry expected to
follow suit”
“Autonomous technologies represent a class of innovation that
will profoundly change how minerals are mined and processed”
– Ken Stapylton, Vice President surface drilling, Sandvik
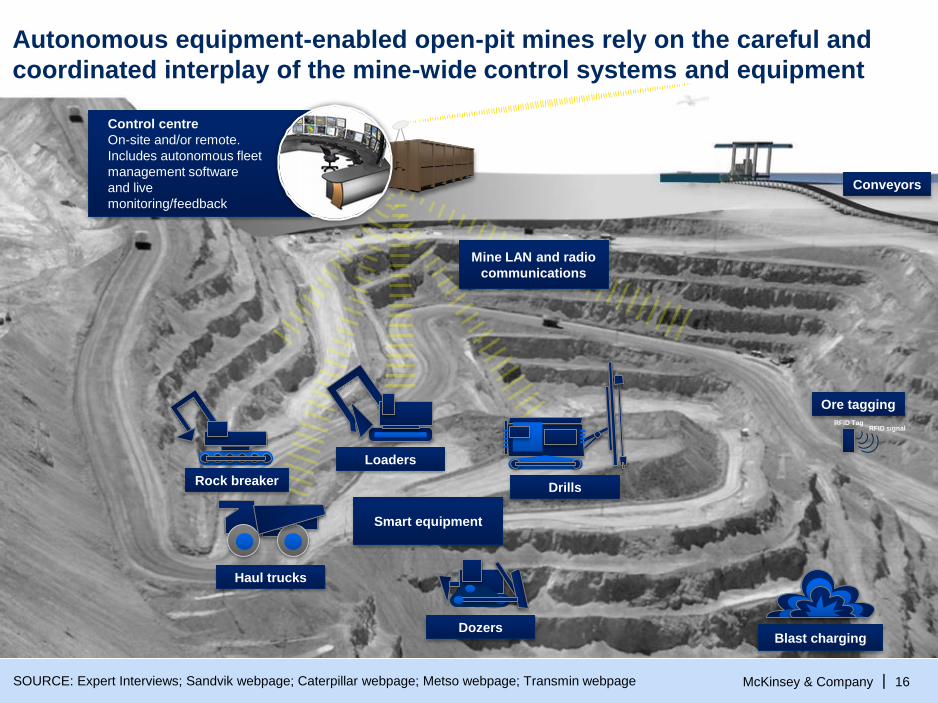
McKinsey & Company | 16SOURCE: Expert Interviews; Sandvik webpage; Caterpillar webpage; Metso webpage; Transmin webpage
Autonomous equipment-enabled open-pit mines rely on the careful and
coordinated interplay of the mine-wide control systems and equipment
Drills
Loaders
Blast charging
Conveyors
Mine LAN and radio
communications
Control centre
On-site and/or remote.
Includes autonomous fleet
management software
and live
monitoring/feedback
Haul trucks
Dozers
Rock breaker
Ore tagging
RFID TagRFID signal
Smart equipment
McKinsey & Company | 17
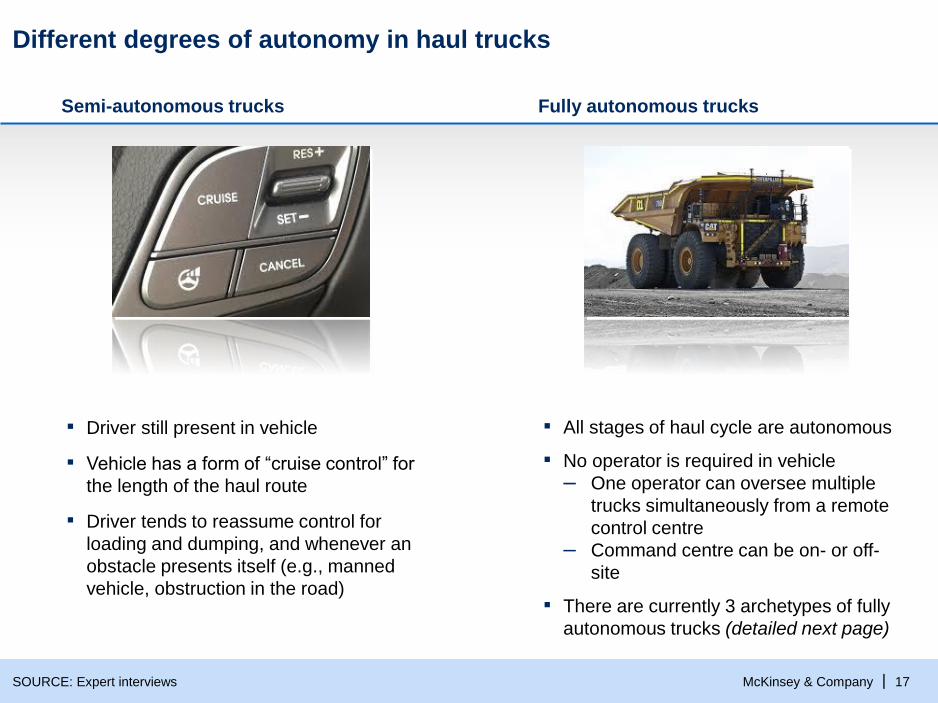
Different degrees of autonomy in haul trucks
SOURCE: Expert interviews
▪ Driver still present in vehicle
▪ Vehicle has a form of “cruise control” for
the length of the haul route
▪ Driver tends to reassume control for
loading and dumping, and whenever an
obstacle presents itself (e.g., manned
vehicle, obstruction in the road)
▪ All stages of haul cycle are autonomous
▪ No operator is required in vehicle
– One operator can oversee multiple
trucks simultaneously from a remote
control centre
– Command centre can be on- or off-
site
▪ There are currently 3 archetypes of fully
autonomous trucks (detailed next page)
Semi-autonomous trucks Fully autonomous trucks
McKinsey & Company | 18SOURCE: Expert Interviews; University of British Columbia; Caterpillar; Komatsu
Key on-board components of autonomous haul trucks
Autonomous Control Cabinet
Sealed hydraulic and electronic
controls
GPS
GPS technology is
combined with a
tracking system to
accurately monitor
location of vehicles
Autonomous
Status Lights
Mounted on all
sides of the truck to
safely display truck
operating status
Road Edge
Guidance (REG)
A mounted laser
guidance system
measures the dis-
tance to the road
berm to provide
additional naviga-
tion accuracy
▪ Object avoidance (e.g., radar
with 80m range, LIDAR with 20m
range at sides and rear)
▪ These sensor technologies are
still in their infancy
– Overall they have been
working effectively in dry, clear
climates such as in Australia or
the Atacama desert
– They have much lower
reliability in fog or rain, which
has impeded adoption of AH
technology in more temperate
climates
– In the next few years, some
AH sensor manufacturers will
likely turn to military sensors to
improve availability and
reliability; however, doing so is
currently cost-prohibitive
BASE VEHICLE AND AUTOMATION KIT
Senses changes in
orientation using
interference from
light
Optical fiber gyro

McKinsey & Company | 19
Communications technology is vital for relaying commands from the
control centre to the vehicles, and for managing vehicle interactions
Communications technology
▪ Open-pit communications tend to rely on satellite/GPS, wi-fi and/ or RFID
– This requires antennas / boosters around the site
– Each individual vehicle, and possibly personnel, must also be tagged (tele-
remote and manned) with positional trackers, in order to minimize
interactions with operational tele-remote vehicles (for reasons of safety and
productivity)
▪ System must have enough bandwidth to
– Relay live video feeds to the central control room
– Provide up-to-date tracking of all vehicle locations
– Convey real-time commands from the command centre to the tele-remote
or autonomous systems
McKinsey & Company | 20
Category Lever Rationale for impactImpact range
Autonomous haulage has multiple safety and
efficiency benefits
1 OEE: Overall Equipment Effectiveness
OEE1
Operating
and
mainten-
ance
costs
Mine
design
Capex
▪ Reduced unscheduled downtime from more
consistent usage cycles and reduced damage
Truck
speeds
Availability
▪ Higher truck speeds as fewer people in mine
areas; truck speeds more consistent
▪ Fewer (or zero) operators
Utilization ▪ Eliminate shift-change delays; reduce delays
due to traffic congestion
- 10-30%
Tires ▪ Improved tire life due to more consistent speeds
and driving patterns
- 5-10%
Maintena-
nce
Labor
▪ Lower maintenance parts and labour costs from
reduced wear and accident damage
- 10-20%
Strip ratio ▪ Fewer people in pit enables steeper pit walls and
thus ability to reduce strip ratio
- 0-5%
Fuel ▪ Lower fuel consumption from more consistent
driving cycles
- 5-10%
▪ Higher truck cost due to additional equipment
and sensors on trucks
~500k
autonomy kit
Truck
capex
Infrastruc-
ture capex
▪ Infrastructure costs for communications
infrastructure, refueling system
▪ Hub ~$1m
▪ Communica-
tions upgrade
~$15k
“During our first trials, we
were already able to
reduce exposure of our
workers to danger areas
by ~70%”
- Mine manager
Up to -95%
“The main benefits are in
operating labour costs
(down about 2/3) and
optimized productivity
(avoiding downtime and
operating at a faster and
safer cycle time)”
- AH electrical systems
specialist
“Capex costs are high,
though of course they
also depend on the pre-
existing level of
infrastructure, like for
communications. That
said, the upside of AH is
significant”
- AH developer
SOURCE: Expert interviews; Press search
Favourable impact on economics
Adverse impact on economics
- 10-30%
TBD
Safety ▪ Fewer people in dangerous areasSafety

McKinsey & Company | 21
High labor cost locations, e.g. remote
Australian mines, Canadian oil sands
$350K fully loaded, operator cost
Low labor cost locations, e.g. Africa, Asia
$35K fully loaded, operator cost
Capex
Opera-
ting and
mainte-
nance
costs
Mine
design
OEE1
Autonomous haulage can be a game changer in mining
productivity: 10% to 40% reduction in haulage costs
SOURCE: Team analysis; based on client mine plan
Hauling costs – USD c/ton
Autonomous trucks can reduce surface haulage costs by up to 40%
1 OEE: Overall Equipment Effectiveness
40.74
0.08
0.96
39.69
62.93
0
67.47
0
67.47
-1.72
Availability
-20.37
Truck speeds
Utilization -3.82
Labor
-0.72
Strip ratio
Manual Fleet
Maintenance -0.64
Tires -0.50
Fuel
-40%
Autonomous fleet
Infrastructure
Truck
39.88
0.08
0.96
38.83
43.74
0
45.41
45.41
-12%
-0.64
-0.50
-1.72
-2.04
-1.41
-0.27
0
AUTONOMOUS HAULAGEPRELIMINARY

McKinsey & Company | 22
To date, there have been ~25 autonomous haul truck
trials, most of which have taken place in Australia
SOURCE: Press search
...
Mine site
Year tests began
2006
Navajo
Coal
2006
2010
Kiruna
2005
Finsch
2015
TBD
2015
TBD
2013
Jimblebar
2010
West
Angelas
2012
Yandi-
coogina
2012
Nam-
muldi
2013
Hope
Downs
2014
Meandu
2013
Solomon
2005
Rado-
miro Tomic
2009
Gabri-
ela Mistral
…
Current trial and/or implementation locations

McKinsey & Company | 23
Automated drilling is the latest step in the long evolution of drill and
blast technology
SOURCE: Atlas Copco Blasthole Reference Book 2013, Sandvik
The beginnings of
mechanization
Drill-assist and
autonomous drills
Manual drilling and
blasting
Towards current-day
drills
▪ Gunpowder invented
~1000AD, but are no
references to
applications to mining
until 16th century
▪ One man drilling
(using a steel drill
and sledgehammer)
most common
approach into the 20th
century
▪ First steam driven
percussion rock drills
were invented in early-
1800s, but adoption slow
▪ Alfred Nobel invented the
blasting cap and safer
dynamite explosives
through the 1860s
▪ However, mechanized drill
productivity still low. In
1870, at a US drilling
competition,
– John Henry hammered
through 14 ft of rock in
35 minutes
– His steam drill
“competitor” only
managed 9 ft
▪ Late 1800s-early 1900s:
steam replaced by
compressed air, and
invention of the
jackhammer
▪ 1945: Sandvik, Atlas and
Fagersta designed a
cemented tungsten
carbide drill bit as
economical to use as the
conventional steel bits
▪ Post-war, drill rig
mechanization sped up,
with a strong emphasis
on increasing mobility
▪ Hydraulic technology
for rotary and
downhole drilling also
became available in the
1960s
▪ Drive towards
automated drills
picked up
momentum with
unveiling of the Atlas
Copco Pit Viper 351
with CAN-bus control
and 7 on-board
computers at
MineEXPO 2000
▪ Sandvik and Atlas
Copco lead the
pack, with automated
drills (with various
degrees of
automation) being
tested and
implemented around
the world
McKinsey & Company | 24SOURCE: Sandvik
High-resolution video
Transmit video back to the command center
▪ Enhance visibility
▪ No blind spot
See depths details and determine
hidden range of obstacles
Hazard avoidance cameras
Prevent
tramming into
hazards
Geo-fencing
sensors
High-speed on-board computer control
▪ Geological information
▪ Drilling times
▪ Penetration rates
▪ Navigation & traffic
▪ Machine diagnostics
Tele-Remote/Autonomous Drill

McKinsey & Company | 25
Tele-Remote and Autonomous drilling have significant potential
1 OEE: Overall Equipment Effectiveness
SOURCE: Expert interviews; Press search
Favorable
Adverse
Capex
OEE1
Category
Operating
and
maintenance
costs
Impact range
Lever Rationale for impactImpact
Safety Safety ▪ Fewer people in dangerous areas
Tele-remote
Auto-nomous
Utilization ▪ Eliminate shift-change delays; reduce time lost to
blast cycle
0-10% 0-15%
Drill speeds ▪ Algorithm reduces variation across fleet0-3% 0-3%
Availability ▪ Reduced unscheduled downtime from more
consistent usage cycles and reduced damage
0-10% 0-15%
Redrilling and
over-drilling
▪ Algorithm controls drilling reduces chances of error50% 75%
Surveying
labor
▪ GPS positioning system eliminates need for floor
demarcation tasks
100% 100%
Fuel ▪ Lower consumption from more consistent operation0-5% 0-10%
Drilling
consumables
▪ Lower consumption due to algorithm controlled,
more consistent drilling operation
0-10% 0-10%
Drill rig capex ▪ Higher drill costs due to additional equipment and
sensors on drill
5-10% 15-20%
Infrastructure
capex
▪ Infrastructure costs for communications
infrastructure, refueling system
~$0.5M ~$1M
Drill rig labor ▪ Operator:Machine ratio reduced to 1:3 for Tele-
remote and 1:5 for autonomous
Up to 75% Up to 95%
Maintenance ▪ Lower maintenance parts and labour costs from
reduced wear due to more consistent operation
0-10% 0-20%
Lubricants ▪ Lower consumption from more consistent operation0-5% 0-10%
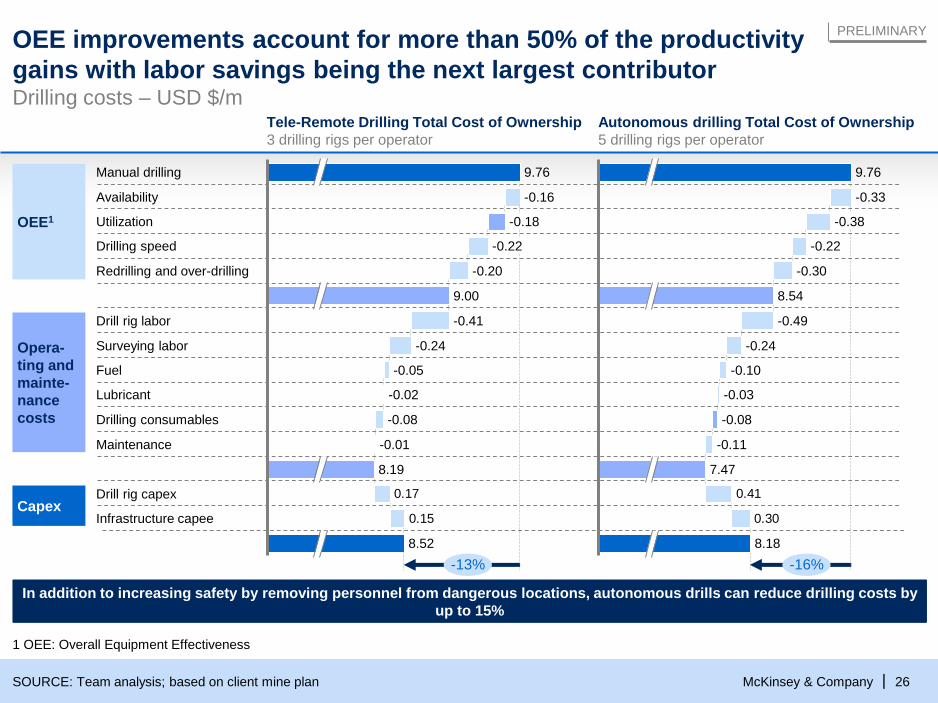
McKinsey & Company | 26SOURCE: Team analysis; based on client mine plan
In addition to increasing safety by removing personnel from dangerous locations, autonomous drills can reduce drilling costs by
up to 15%
Tele-Remote Drilling Total Cost of Ownership
3 drilling rigs per operator
Autonomous drilling Total Cost of Ownership
5 drilling rigs per operator
1 OEE: Overall Equipment Effectiveness
PRELIMINARY
Capex
Opera-
ting and
mainte-
nance
costs
Drilling costs – USD $/m
0.15
0.17
Drill rig labor -0.41
9.00
Redrilling and over-drilling -0.20
Drilling speed -0.22
Utilization -0.18
Availability -0.16
Manual drilling
Maintenance -0.01
Drilling consumables -0.08
Lubricant -0.02
-0.05
Surveying labor -0.24
Infrastructure capee
Fuel
9.76
8.52
-13%
Drill rig capex
8.19
0.30
0.41
-0.03
8.54
-0.30
-0.22
-0.38
8.18
9.76
-16%
7.47
-0.49
-0.11
-0.33
-0.08
-0.10
-0.24
OEE1
OEE improvements account for more than 50% of the productivity
gains with labor savings being the next largest contributor
McKinsey & Company | 27
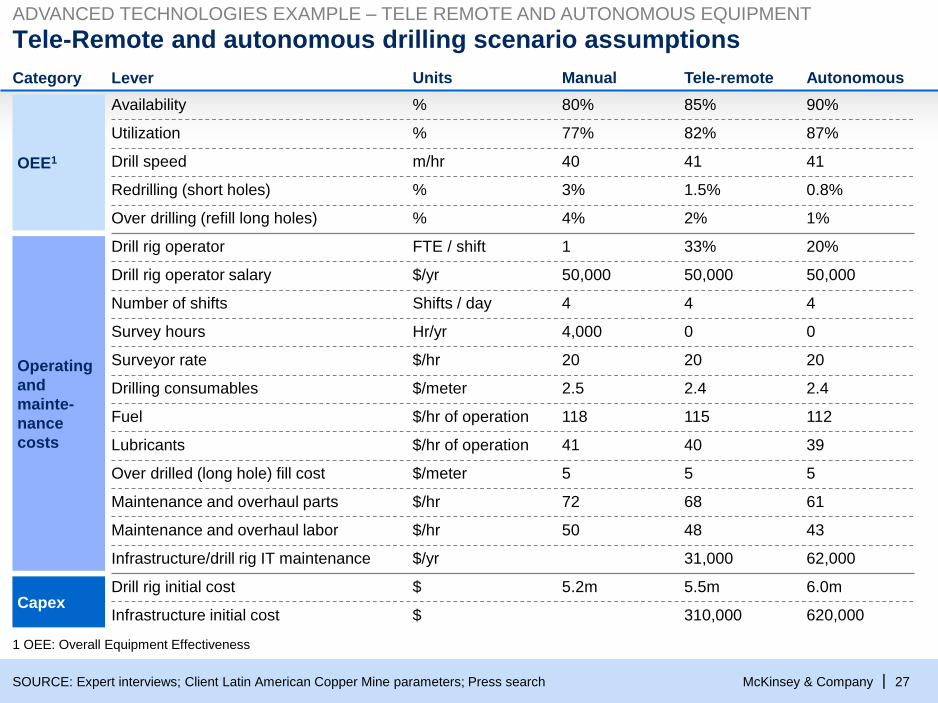
Tele-Remote and autonomous drilling scenario assumptions
1 OEE: Overall Equipment Effectiveness
SOURCE: Expert interviews; Client Latin American Copper Mine parameters; Press search
Capex
OEE1
Category
Operating
and
mainte-
nance
costs
ADVANCED TECHNOLOGIES EXAMPLE – TELE REMOTE AND AUTONOMOUS EQUIPMENT
ManualLever Tele-remote AutonomousUnits
80% 85% 90%%
77%Utilization 82% 87%%
40Drill speed 41 41m/hr
3%Redrilling (short holes) 1.5% 0.8%%
4%
Availability
Over drilling (refill long holes) 2% 1%%
1 33% 20%FTE / shift
50,000Drill rig operator salary 50,000 50,000$/yr
4Number of shifts 4 4Shifts / day
4,000Survey hours 0 0Hr/yr
20Surveyor rate 20 20$/hr
2.5Drilling consumables 2.4 2.4$/meter
118Fuel 115 112$/hr of operation
41Lubricants 40 39$/hr of operation
5Over drilled (long hole) fill cost 5 5$/meter
72Maintenance and overhaul parts 68 61$/hr
50Maintenance and overhaul labor 48 43$/hr
Drill rig operator
Infrastructure/drill rig IT maintenance 31,000 62,000$/yr
5.2m 5.5m 6.0m$Drill rig initial cost
Infrastructure initial cost 310,000 620,000$
McKinsey & Company | 28SOURCE: Company annual reports; McKinsey analysis
Revenues & EBITDA of the global mining industry
USD billion, real terms 2013
Companies are planning for the future with technology
in mind and expect revenues to keep growing at ~4%p.a.
1,500
1,000
500
0
2015100500
3.4% p.a.
3.9% p.a.
-5.1% p.a.
24.5% p.a.
0.8% p.a.
25
95
EBITDA
Revenues
~25 ~25 ~40 ~30~30
Revenue CAGR (%)
xAverage industry
EBITDA margin (%)

McKinsey & Company | 29
How are you positioning yourself for the future?
SOURCE: Press search
“I believe we need to hit the reset button in
terms of how we think about innovation and mining
in the future”
– Mark Cutifani, CEO Anglo American

McKinsey & Company | 30
Summary of the rare earth market outlook
▪ Rare earths are a group of 17 elements, which are divided into light and heavy rare earths. They
are used in a wide range of applications, such as permanent magnets, metal alloys, catalysts
and polishing powders
▪ The market is large and growing ($8B and ~113 ktons of demand after separation of
individual oxides, growing at a 7% CAGR), with heavy rare earths representing <15% of the
volume, but ~50% of revenues
▪ China holds most of the production along the value chain (~80-100%), as well as most of the
known reserves, letting it control prices through management of export quotas
▪ Outside of China, most projects are focused on light rare earths
– Rare earths expected to be critical are mainly heavies (Dysprosium, Yttrium, Terbium
and Europium), together with the light element neodymium
– The pipeline of heavy rare earth projects is limited to less than 10k tons and they are at very
early stages of development
▪ If China continues to act rationally (and from expert interviews it seems that it will maintain quotas
for heavy rare earths at present levels) prices should continue at greenfield incentive levels,
allowing some penetration from the rest of the world
▪ Based on this, a mine that is “heavy on heavies” would find itself in a privileged position
McKinsey & Company | 31
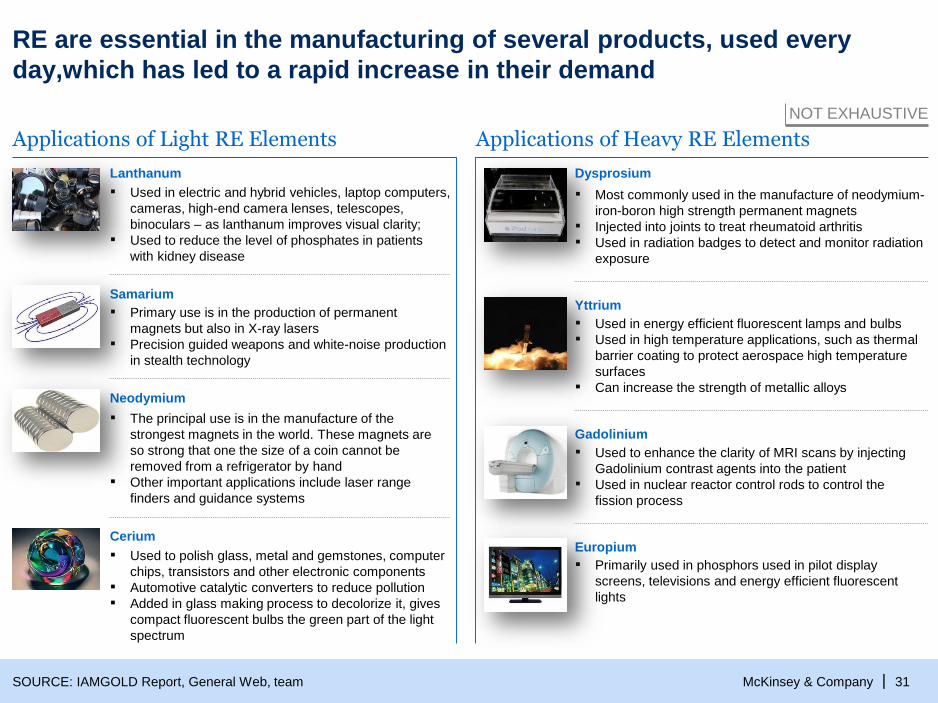
RE are essential in the manufacturing of several products, used every
day,which has led to a rapid increase in their demand
SOURCE: IAMGOLD Report, General Web, team
NOT EXHAUSTIVE
Applications of Heavy RE Elements
Dysprosium
▪ Most commonly used in the manufacture of neodymium-
iron-boron high strength permanent magnets
▪ Injected into joints to treat rheumatoid arthritis
▪ Used in radiation badges to detect and monitor radiation
exposure
Yttrium
▪ Used in energy efficient fluorescent lamps and bulbs
▪ Used in high temperature applications, such as thermal
barrier coating to protect aerospace high temperature
surfaces
▪ Can increase the strength of metallic alloys
Gadolinium
▪ Used to enhance the clarity of MRI scans by injecting
Gadolinium contrast agents into the patient
▪ Used in nuclear reactor control rods to control the
fission process
Applications of Light RE Elements
Lanthanum
▪ Used in electric and hybrid vehicles, laptop computers,
cameras, high-end camera lenses, telescopes,
binoculars – as lanthanum improves visual clarity;
▪ Used to reduce the level of phosphates in patients
with kidney disease
▪ Primary use is in the production of permanent
magnets but also in X-ray lasers
▪ Precision guided weapons and white-noise production
in stealth technology
Samarium
Neodymium
▪ The principal use is in the manufacture of the
strongest magnets in the world. These magnets are
so strong that one the size of a coin cannot be
removed from a refrigerator by hand
▪ Other important applications include laser range
finders and guidance systems
Cerium
▪ Used to polish glass, metal and gemstones, computer
chips, transistors and other electronic components
▪ Automotive catalytic converters to reduce pollution
▪ Added in glass making process to decolorize it, gives
compact fluorescent bulbs the green part of the light
spectrum
Europium
▪ Primarily used in phosphors used in pilot display
screens, televisions and energy efficient fluorescent
lights

McKinsey & Company | 32SOURCE: USGS, General web and press
Increasing demand for RE has led to other countries looking
for potential reserves to reduce their dependency on China
Rare Earth Reserves1
RoW
With the development of new projects, it is expected that this scenario, with China being the dominant player ,will also change
Million metric tons
USA
Was self-reliant
Currently imports 100%
Mainly due to lower costs
Molycorp owns biggest
deposit in USA
USA &
Canada
14
22
China
Holds 50% of reserves
Controls 90% of the supply
India
3.1
China
55
Australia
1.6
Japan
100% importer
Have recently found
80-100 mn metric
tons of REE in the
Pacific seabed
1 Referring only to the identified RE reserves
McKinsey & Company | 33
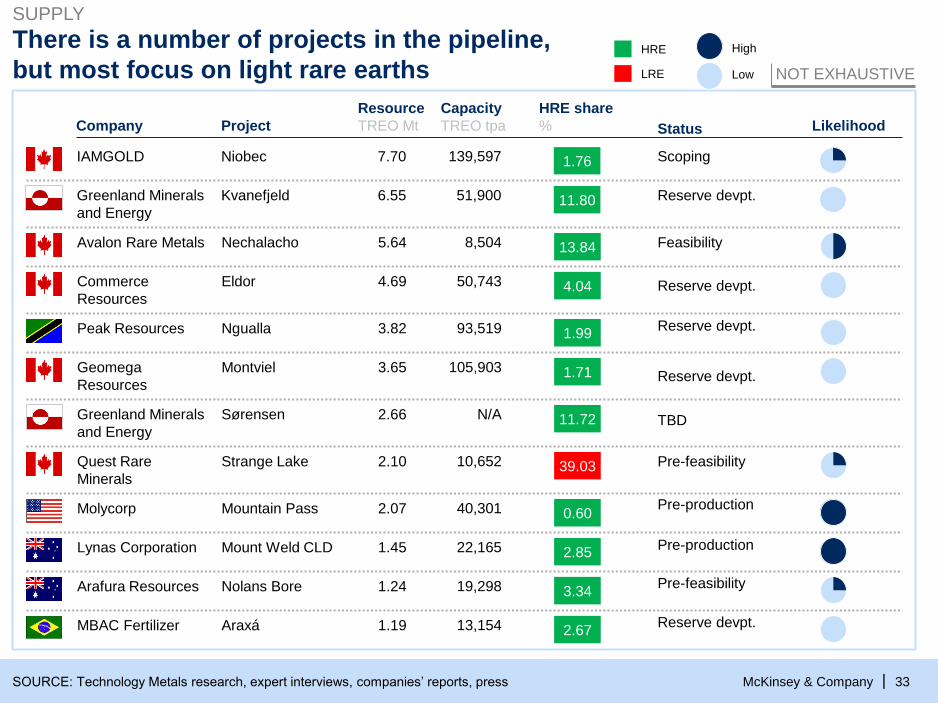
There is a number of projects in the pipeline,
but most focus on light rare earths
ProjectCompany
Capacity
TREO tpa
HRE share
%
Resource
TREO Mt Status Likelihood
IAMGOLD Niobec 139,597 1.767.70
Avalon Rare Metals Nechalacho 8,504 13.845.64
Commerce
Resources
Eldor 50,743 4.044.69
Geomega
Resources
Montviel 105,903 1.713.65
Quest Rare
Minerals
Strange Lake 10,652 39.032.10
Greenland Minerals
and Energy
Kvanefjeld 51,900 11.806.55
Peak Resources Ngualla 93,519 1.993.82
Greenland Minerals
and Energy
Sørensen N/A 11.722.66
Molycorp Mountain Pass 40,301 0.602.07
Lynas Corporation Mount Weld CLD 22,165 2.851.45
Arafura Resources Nolans Bore 19,298 3.341.24
MBAC Fertilizer Araxá 13,154 2.671.19
SOURCE: Technology Metals research, expert interviews, companies’ reports, press
Scoping
Feasibility
Pre-feasibility
Reserve devpt.
Pre-production
Reserve devpt.
Reserve devpt.
Reserve devpt.
TBD
Pre-production
Pre-feasibility
Reserve devpt.
SUPPLY
HRE
LRE
High
Low NOT EXHAUSTIVE
McKinsey & Company | 34
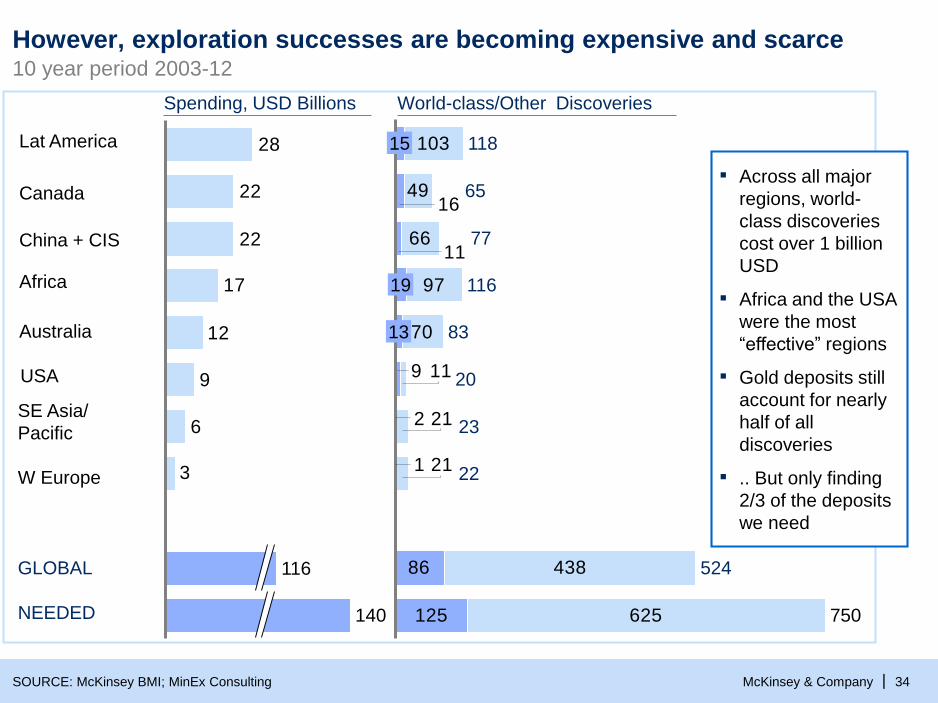
However, exploration successes are becoming expensive and scarce
SOURCE: McKinsey BMI; MinEx Consulting
Canada
China + CIS
Africa
SE Asia/
Pacific
Australia
USA
W Europe
Lat America
3
6
9
12
17
22
22
28
116
140
Spending, USD Billions
86
125
103
66
97
70
438
625
1
2
9
11
16
21
21
11
49
524
22
23
20
8313
11619
77
65
11815
750
World-class/Other Discoveries
GLOBAL
NEEDED
▪ Across all major
regions, world-
class discoveries
cost over 1 billion
USD
▪ Africa and the USA
were the most
“effective” regions
▪ Gold deposits still
account for nearly
half of all
discoveries
▪ .. But only finding
2/3 of the deposits
we need
10 year period 2003-12

McKinsey & Company | 35
New and current mining projects will be face strong market forces, which
will have significant impact on the industry over coming decades
SOURCE: McKinsey analysis
Rising water costs7
Polarization of scale creates new challenges4
Rising energy costs6
High demand and prices but significant volatility2
Increasingly challenging geologies3
Increasingly challenging supply chains5
Continuously increasing safety, health and environment standards1
Scarcity of talent8
Global sourcing9
McKinsey & Company | 36
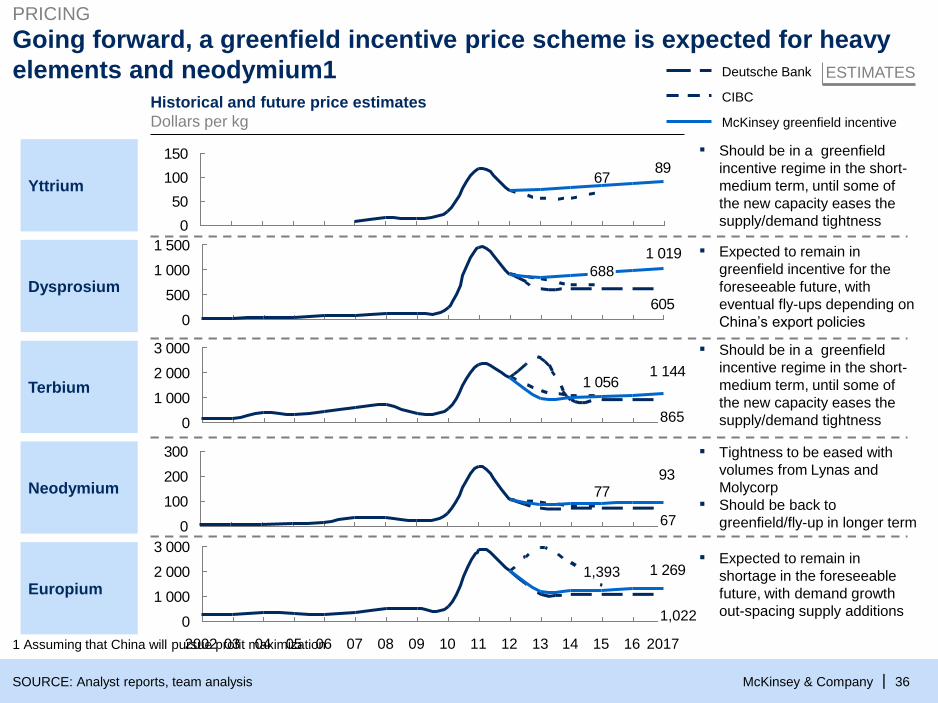
Going forward, a greenfield incentive price scheme is expected for heavy
elements and neodymium1
605
1 019
0
500
1 000
1 500
688Dysprosium
Terbium
SOURCE: Analyst reports, team analysis
1 0561 144
0
1 000
2 000
3 000
865
ESTIMATES
6789
0
50
100
150
McKinsey greenfield incentive
CIBC
Deutsche Bank
Yttrium
▪ Should be in a greenfield
incentive regime in the short-
medium term, until some of
the new capacity eases the
supply/demand tightness
▪ Expected to remain in
greenfield incentive for the
foreseeable future, with
eventual fly-ups depending on
China’s export policies
▪ Should be in a greenfield
incentive regime in the short-
medium term, until some of
the new capacity eases the
supply/demand tightness
Historical and future price estimates
Dollars per kg
1 Assuming that China will pursue profit maximization
PRICING
Neodymium 7793
0
100
200
300
67
▪ Tightness to be eased with
volumes from Lynas and
Molycorp
▪ Should be back to
greenfield/fly-up in longer term
1 269
0
1 000
2 000
3 000
09 10 11 12 13 14
1,393
15 16
1,022
2017080705042002 0603
Europium
▪ Expected to remain in
shortage in the foreseeable
future, with demand growth
out-spacing supply additions

McKinsey & Company | 37
Mines holding considerable quantities of these five elements will be in a
good position in the future
GLOBAL SUPPLY-DEMAND BALANCE
Y
Dy
Tb
Nd
Eu
▪ Yttrium is expected to be in shortage in the short term, with most of the new
supply only coming online through the end of the decade
▪ Expert opinions: “I don’t see relevant new capacity outside of China coming
online in the next few years”
▪ Dysprosium is expected to remain in shortage in the foreseeable future, with
demand growth out-spacing supply additions
▪ Severe shortage could trigger investments in magnet recycling technology or
even partial substitution/decrease in intensities
▪ Slower demand growth for Terbium when compared to Dysprosium and Yttrium
could lead to a balanced market already in the short term
▪ Given the relatively low volume of the global terbium market, small amounts as
by-product from large light-focused projects such as Mountain Pass and Mount
Weld could ease the tightness
▪ Relevant volumes of Neodymium coming from Mountain Pass and Mount Weld
in the short term should ease the tight supply-demand balance
▪ In the longer term, new projects will probably be needed to meet Nd demand
▪ Europium is expected to remain in shortage in the foreseeable future, with
demand growth out-spacing supply additions
▪ Severe shortage could trigger investments in phosphors recycling, such as the
research conducted by Rhodia in France in the last few years
SOURCE: Expert interviews, McKinsey

McKinsey & Company | 38
With this relevant position, China controls the current price dynamic
SOURCE: MOFCOM, Press search
313030
5047
6062
-40%
201211100908072006
Export quota evolution of rare earth in China
Thousand tons
800
0
500
1 000
1 500
2 000
201211100908072006
Prices of dysprosium oxide in China
$/kg
Peak of prices
caused by export
quotas reduction
▪ In 2010, China tightened export quotas for heavy and light rare earths; in the future:
– Light quotas could be eliminated as new light REO sources are coming online
– Heavy quotas should remain as China does not have enough reserves and few new heavy rare earth sources
are coming online in the future
▪ If China acts rationally, it will look to maximize profits which would maintain prices at higher than historical levels
letting smaller players into the market. However they hold the power to avoid the entry of other players if they
wanted to.
Drop in 2012 as a
result of demand
decrease due to
unsustainably high
prices, but still
significantly higher
than historical levels
SUPPLY

McKinsey & Company | 39
This has resulted in companies looking for different
avenues to meet their growing requirements;
for which substitution seems best suited
SOURCE: General web and press, team
3 best measures to adopt to avoid falling into supply shortage problems
RE used in fluorescent lighting and computer hard drives, can be recycled
Extract RE from used hybrid motors and lithium-ion batteries in addition to nickel-metal hydride
batteries
Benefits of recycling RE from batteries is that a supply of recycled lanthanum should be more
reliable than relying on new Chinese sources
Recycling also uses less energy and emits less carbon di than mining
Reduction in the usage of RE is a process that is not yet economically tested by many companies
Some areas where this has come useful is in LED television sets, which require lesser RE than LCD
sets
Recently, generator manufacturers have reduced RE content and have used other metals like nickel,
which provides similar levels of performance
Fuller the moon,
more viable
Best way forward
Motor companies are looking towards creating new techniques to substitute RE, like induction
motors and nickel-hydride batteries
Some companies have also substituted RE with iron based amorphous core for motors which is 5%
more efficient
Companies who are taking the initiative towards substitution are Hitachi, Ford, Continental AG and
Honda
McKinsey & Company | 40
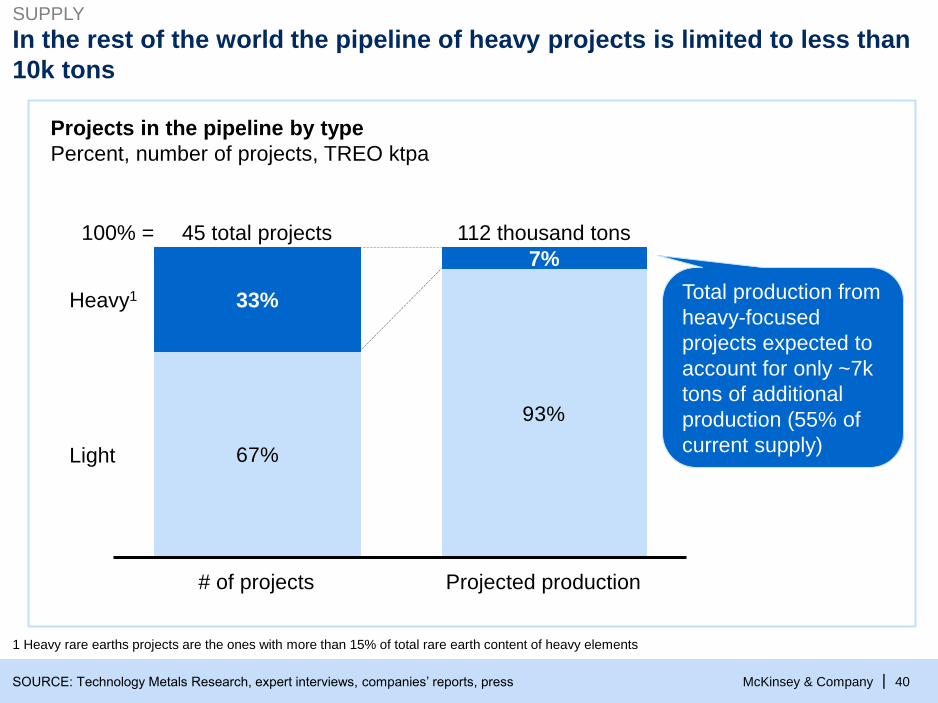
In the rest of the world the pipeline of heavy projects is limited to less than
10k tons
67%
93%
100% =
Light
Heavy1
Projected production
112 thousand tons
7%
# of projects
45 total projects
33%
Projects in the pipeline by type
Percent, number of projects, TREO ktpa
SOURCE: Technology Metals Research, expert interviews, companies’ reports, press
Total production from
heavy-focused
projects expected to
account for only ~7k
tons of additional
production (55% of
current supply)
1 Heavy rare earths projects are the ones with more than 15% of total rare earth content of heavy elements
SUPPLY