challenges, lessons learned, and best practices: a … · challenges, lessons learned, and best...
TRANSCRIPT
CHALLENGES, LESSONS LEARNED, AND BEST PRACTICES: A WAY FORWARD TO PREVENT, REDUCE AND CONTROL MARINE DEBRIS, PLASTICS AND MICRO-PLASTICS ANDREAS MERKL UNITED NATIONS INFORMAL CONSULTATIVE PROCESS ON OCEANS AND THE LAW OF THE SEA NEW YORK, NEW YORK – JUNE 15, 2016
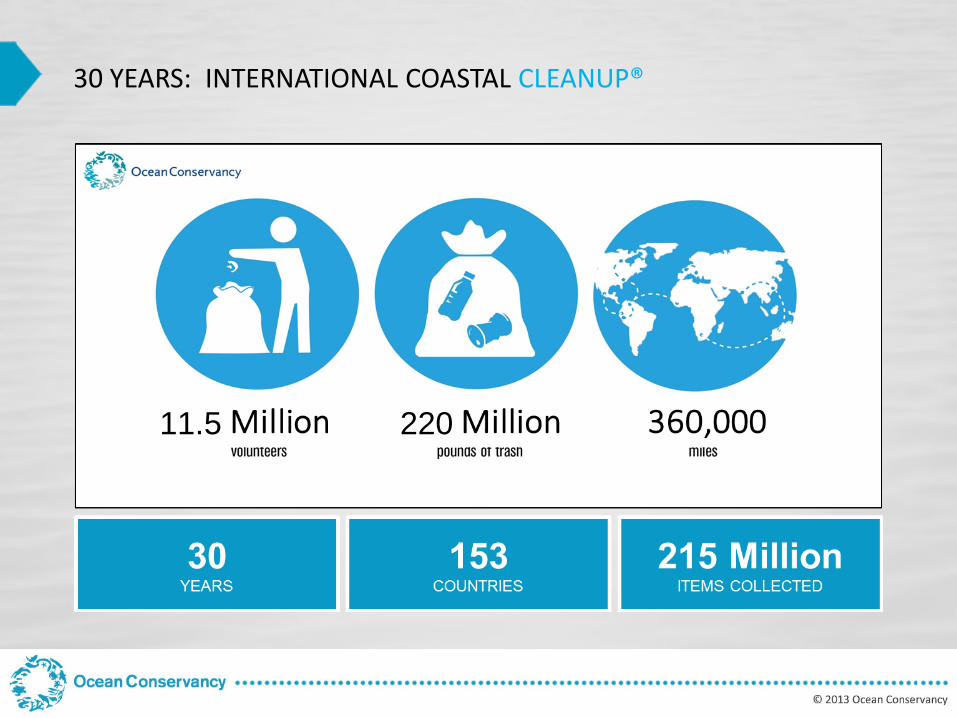
30 YEARS: INTERNATIONAL COASTAL CLEANUP®
1
200 11.5 220
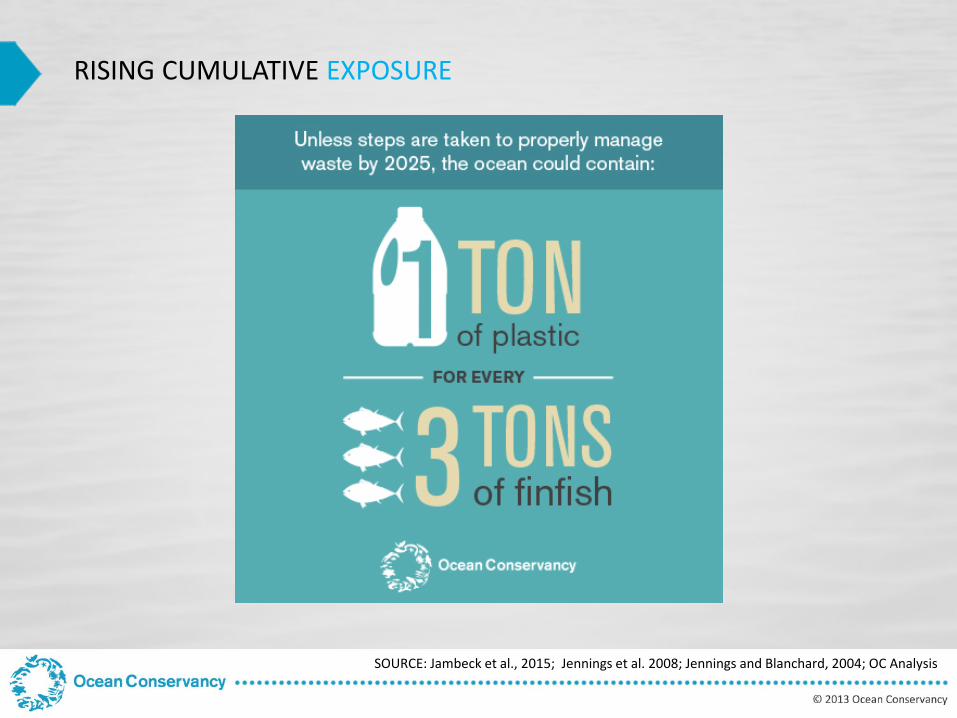
SOURCE: Jambeck et al., 2015; Jennings et al. 2008; Jennings and Blanchard, 2004; OC Analysis
RISING CUMULATIVE EXPOSURE
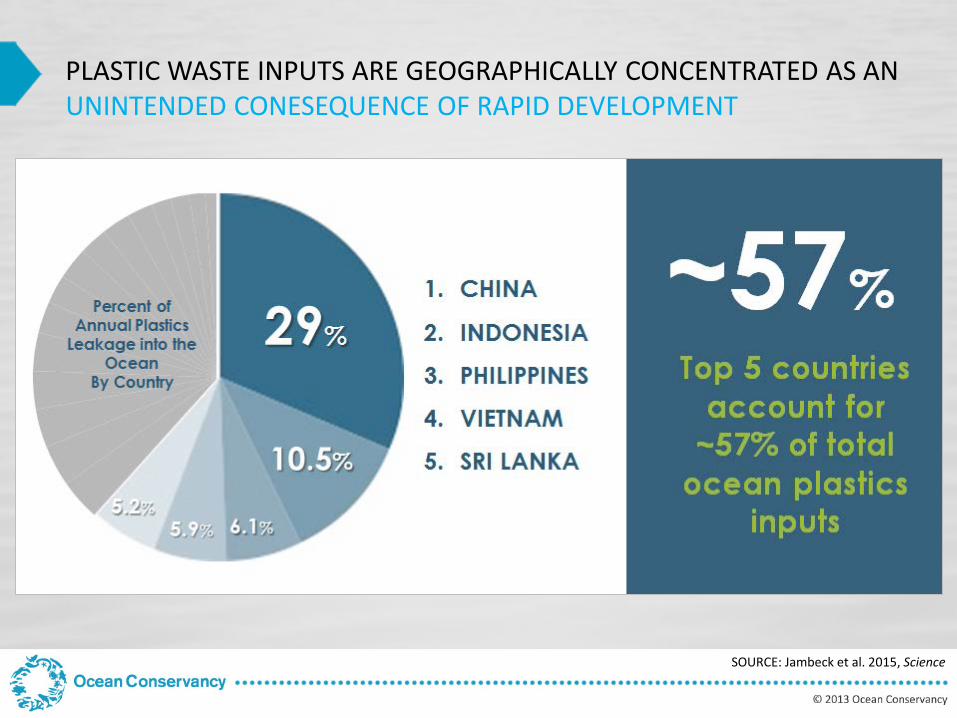
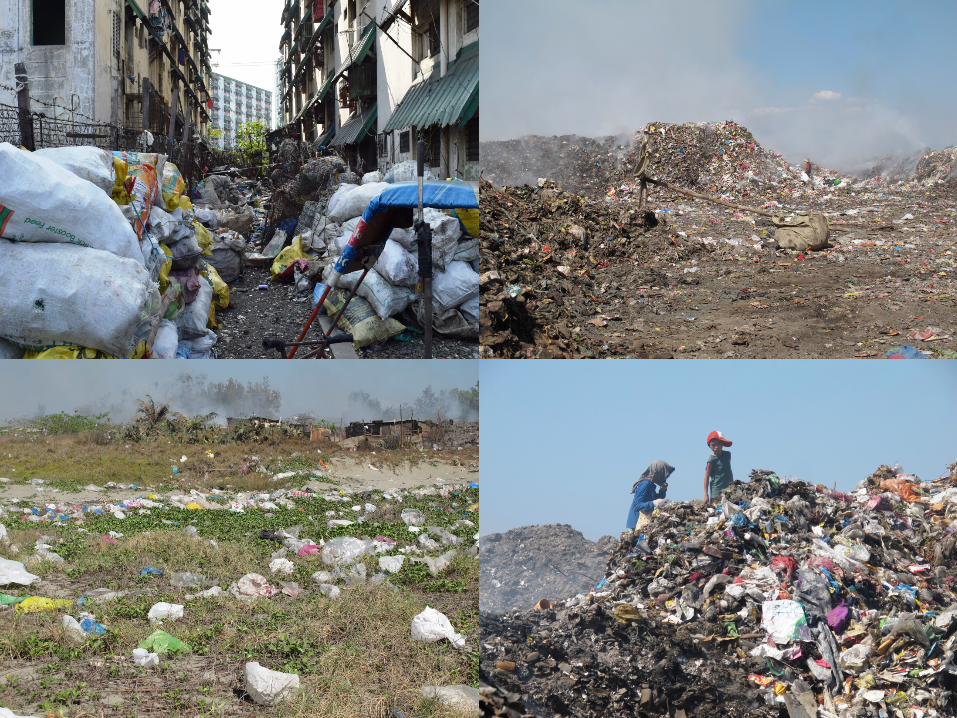
PLASTIC WASTE INPUTS ARE GEOGRAPHICALLY CONCENTRATED AS AN UNINTENDED CONESEQUENCE OF RAPID DEVELOPMENT
SOURCE: Jambeck et al. 2015, Science
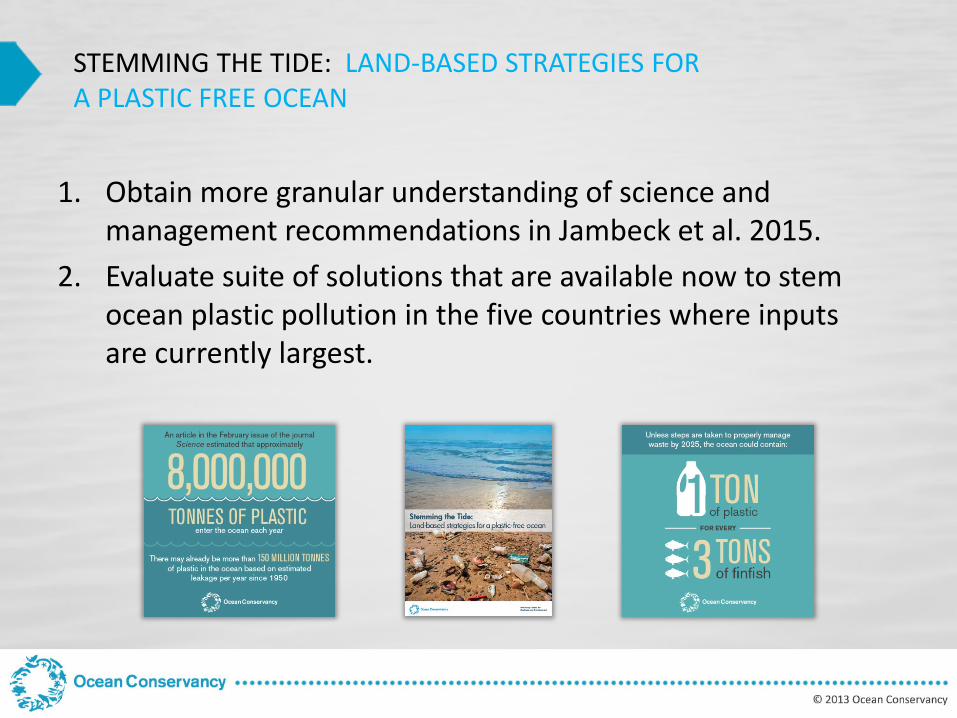
1. Obtain more granular understanding of science and management recommendations in Jambeck et al. 2015.
2. Evaluate suite of solutions that are available now to stem ocean plastic pollution in the five countries where inputs are currently largest.
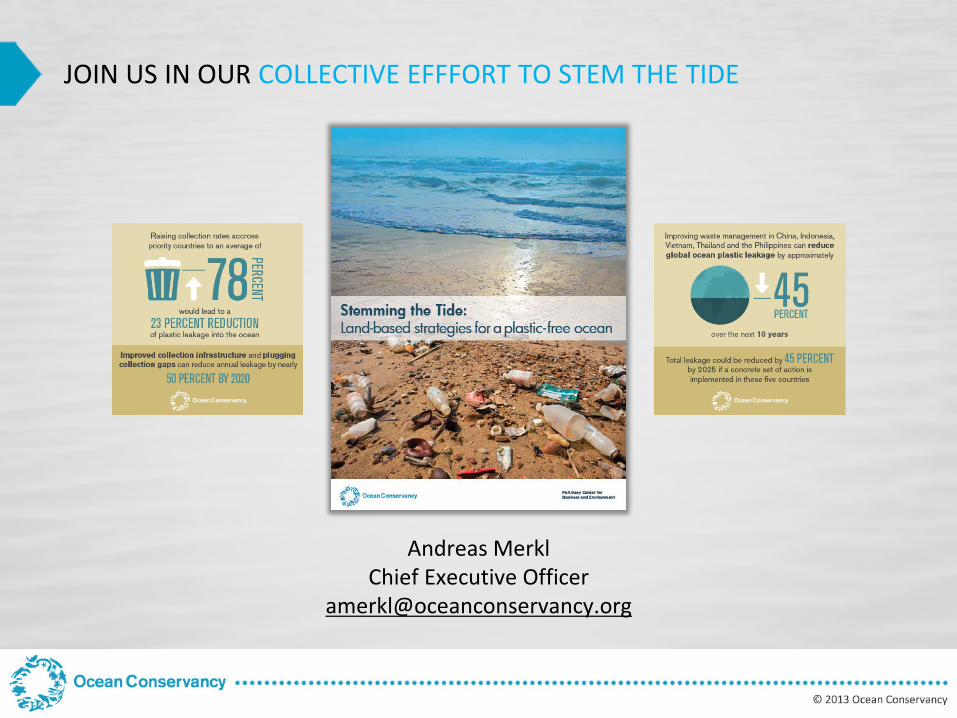
STEMMING THE TIDE: LAND-BASED STRATEGIES FOR A PLASTIC FREE OCEAN
7
Doc ID
© 2015 Ocean Conservancy
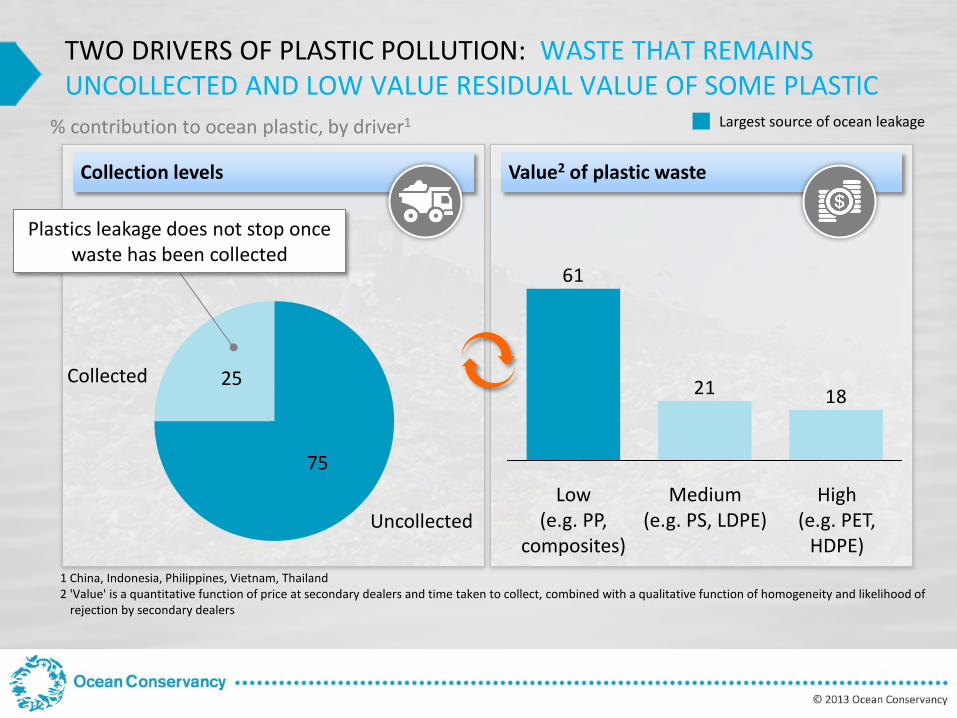
Value2 of plastic waste Collection levels
% contribution to ocean plastic, by driver1
75
25 Collected
Uncollected
1821
61
High (e.g. PET,
HDPE)
Medium (e.g. PS, LDPE)
Low (e.g. PP,
composites)
Largest source of ocean leakage
1 China, Indonesia, Philippines, Vietnam, Thailand 2 'Value' is a quantitative function of price at secondary dealers and time taken to collect, combined with a qualitative function of homogeneity and likelihood of
rejection by secondary dealers
Plastics leakage does not stop once waste has been collected
TWO DRIVERS OF PLASTIC POLLUTION: WASTE THAT REMAINS UNCOLLECTED AND LOW VALUE RESIDUAL VALUE OF SOME PLASTIC
8
Doc ID
© 2015 Ocean Conservancy
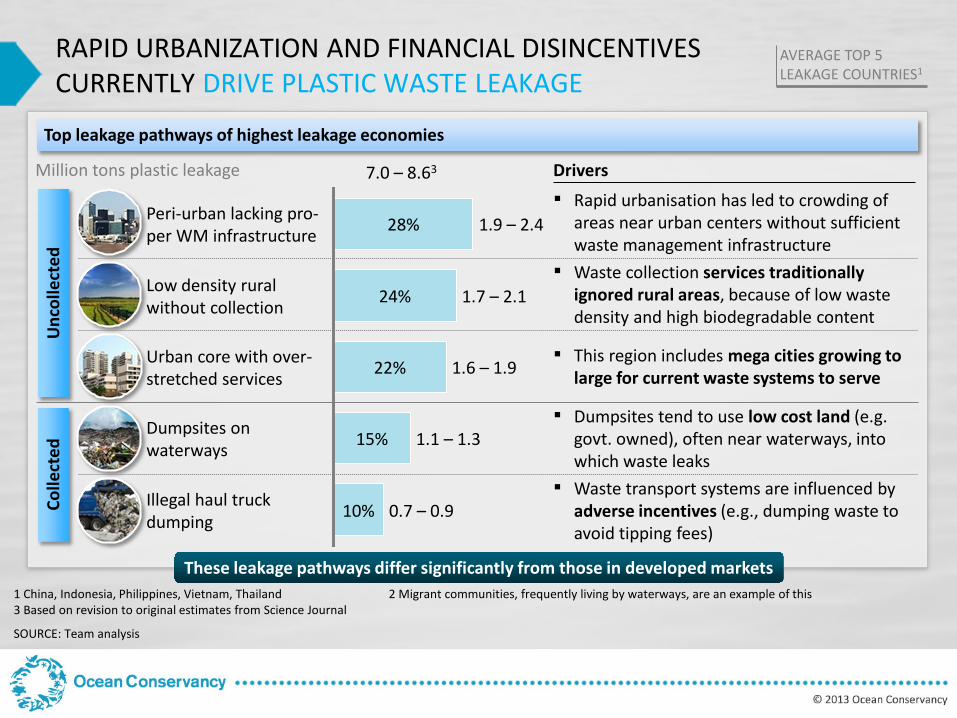
Top leakage pathways of highest leakage economies
RAPID URBANIZATION AND FINANCIAL DISINCENTIVES CURRENTLY DRIVE PLASTIC WASTE LEAKAGE
24%
Peri-urban lacking pro- per WM infrastructure 1.9 – 2.4 28%
7.0 – 8.63
Illegal haul truck dumping 0.7 – 0.9 10%
Dumpsites on waterways 1.1 – 1.3 15%
Urban core with over- stretched services 1.6 – 1.9 22%
Low density rural without collection 1.7 – 2.1
These leakage pathways differ significantly from those in developed markets
Million tons plastic leakage Drivers
▪ Rapid urbanisation has led to crowding of areas near urban centers without sufficient waste management infrastructure
▪ Waste collection services traditionally ignored rural areas, because of low waste density and high biodegradable content
▪ This region includes mega cities growing to large for current waste systems to serve
▪ Dumpsites tend to use low cost land (e.g. govt. owned), often near waterways, into which waste leaks
▪ Waste transport systems are influenced by adverse incentives (e.g., dumping waste to avoid tipping fees)
AVERAGE TOP 5 LEAKAGE COUNTRIES1
1 China, Indonesia, Philippines, Vietnam, Thailand 2 Migrant communities, frequently living by waterways, are an example of this 3 Based on revision to original estimates from Science Journal
Unc
olle
cted
Co
llect
ed
SOURCE: Team analysis
9
Doc ID
© 2015 Ocean Conservancy
SOURCE: Team analysis
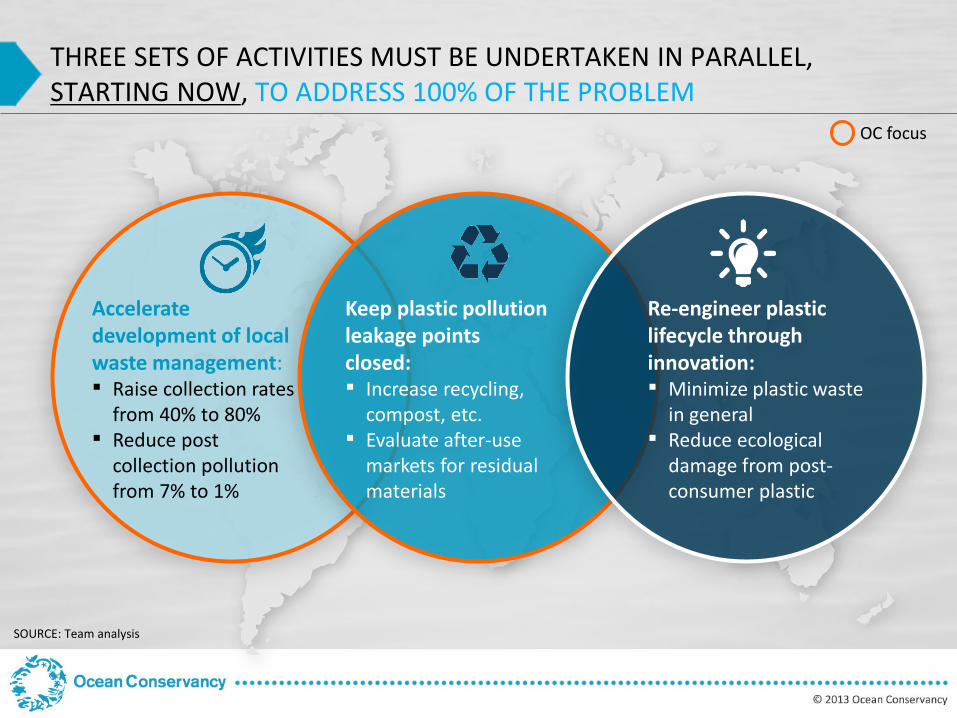
Accelerate development of local waste management: ▪ Raise collection rates
from 40% to 80% ▪ Reduce post
collection pollution from 7% to 1%
Keep plastic pollution leakage points closed: ▪ Increase recycling,
compost, etc. ▪ Evaluate after-use
markets for residual materials
Re-engineer plastic lifecycle through innovation: ▪ Minimize plastic waste
in general ▪ Reduce ecological
damage from post-consumer plastic
OC focus
THREE SETS OF ACTIVITIES MUST BE UNDERTAKEN IN PARALLEL, STARTING NOW, TO ADDRESS 100% OF THE PROBLEM
10
Doc ID
© 2015 Ocean Conservancy
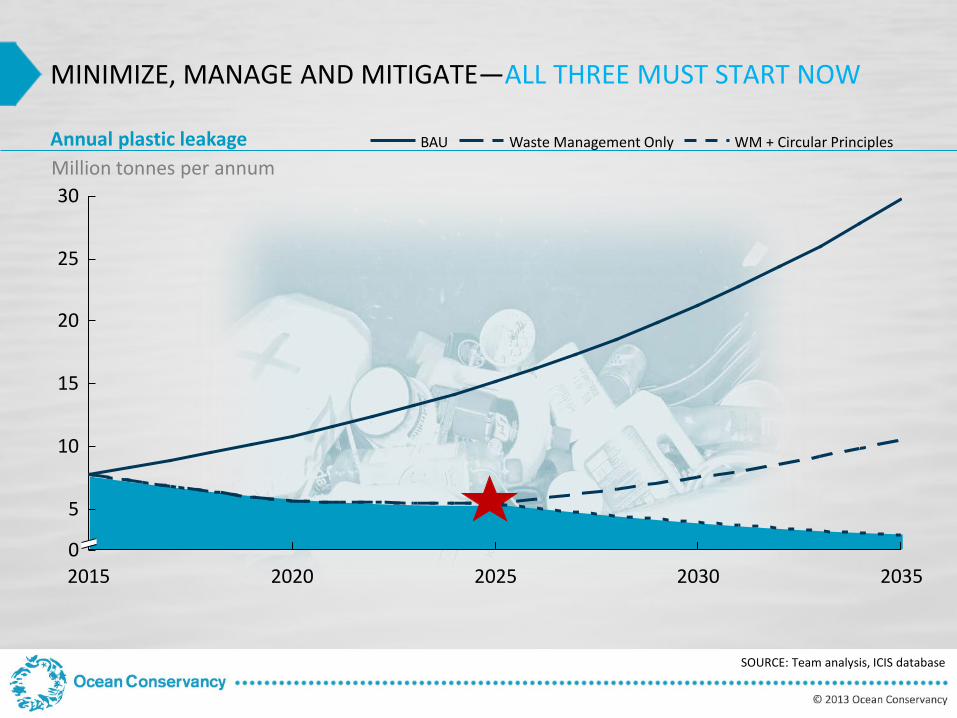
MINIMIZE, MANAGE AND MITIGATE—ALL THREE MUST START NOW
SOURCE: Team analysis, ICIS database
Waste Management Only WM + Circular Principles BAU Annual plastic leakage Million tonnes per annum
2015 2020 2025 2030 2035 0
5
10
15
20
25
30
11
Doc ID
© 2015 Ocean Conservancy
PHASE II GOVERNING THOUGHTS
Focus on creating the enabling conditions – financing, policy, legal, technical, behavioral – to accelerate the development of a waste management industry and infrastructure.
This continues to be a cross-sectoral challenge – requiring coordination across governments, private sector, and civil society.
12
Doc ID
© 2015 Ocean Conservancy
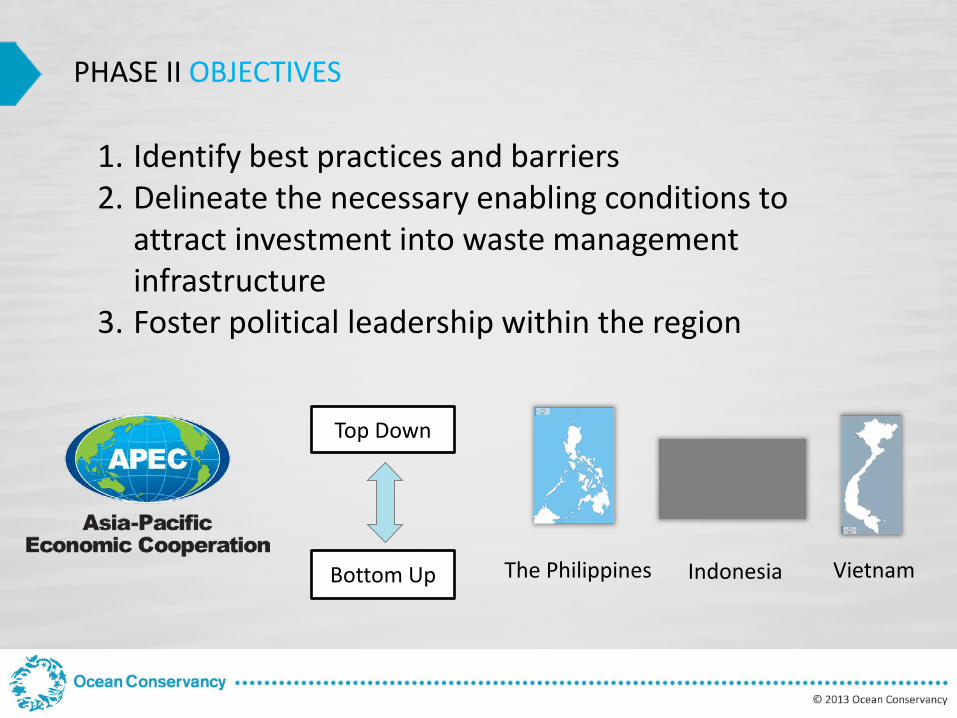
PHASE II OBJECTIVES
1. Identify best practices and barriers 2. Delineate the necessary enabling conditions to
attract investment into waste management infrastructure
3. Foster political leadership within the region
Bottom Up
Top Down
The Philippines Indonesia Vietnam
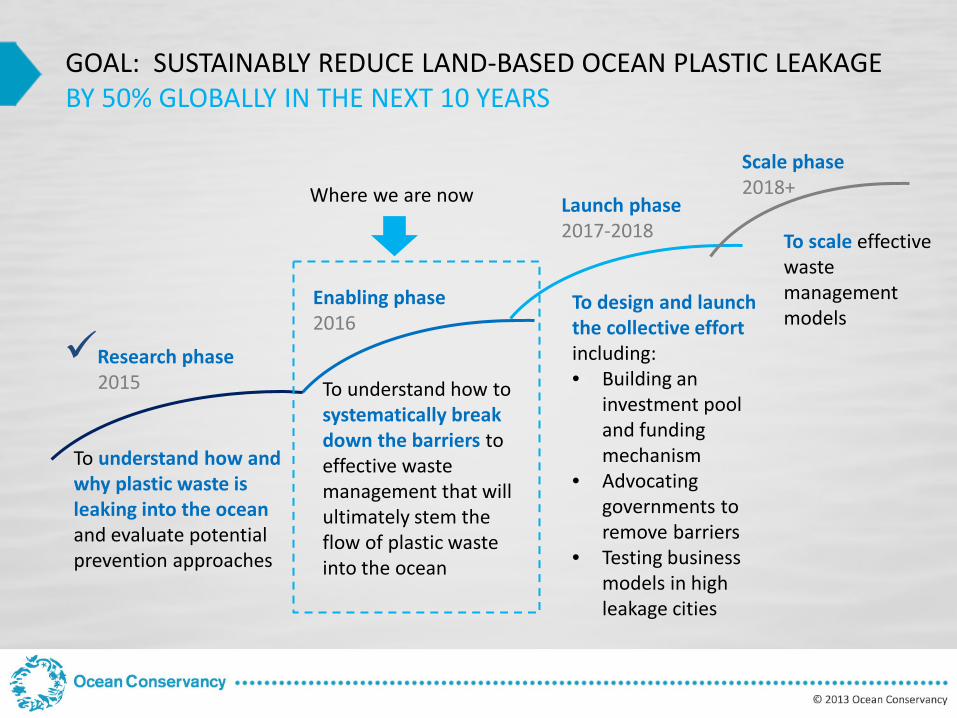
Research phase 2015
To understand how and why plastic waste is leaking into the ocean and evaluate potential prevention approaches
To understand how to systematically break down the barriers to effective waste management that will ultimately stem the flow of plastic waste into the ocean
To design and launch the collective effort including: • Building an
investment pool and funding mechanism
• Advocating governments to remove barriers
• Testing business models in high leakage cities
To scale effective waste management models
Enabling phase 2016
Launch phase 2017-2018
Scale phase 2018+ Where we are now
GOAL: SUSTAINABLY REDUCE LAND-BASED OCEAN PLASTIC LEAKAGE BY 50% GLOBALLY IN THE NEXT 10 YEARS
14
Doc ID
© 2015 Ocean Conservancy
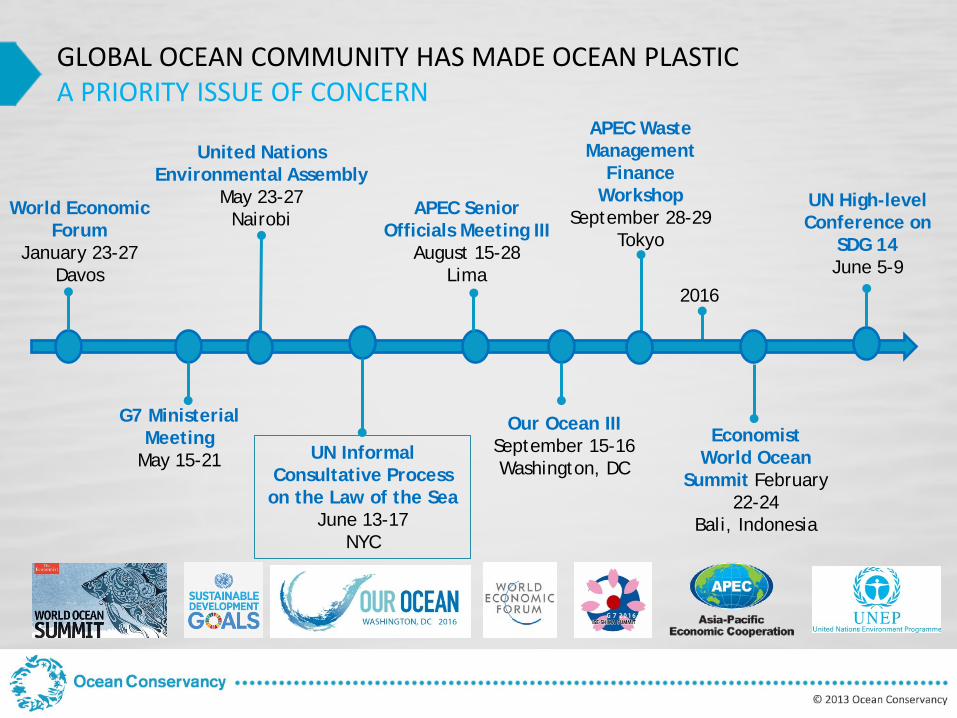
GLOBAL OCEAN COMMUNITY HAS MADE OCEAN PLASTIC A PRIORITY ISSUE OF CONCERN
APEC Waste Management
Finance Workshop
September 28-29 Tokyo
UN High-level Conference on
SDG 14 June 5-9
Economist World Ocean
Summit February 22-24
Bali, Indonesia
G7 Ministerial Meeting
May 15-21
APEC Senior Officials Meeting III
August 15-28 Lima
Our Ocean III September 15-16 Washington, DC
United Nations Environmental Assembly
May 23-27 Nairobi
UN Informal Consultative Process on the Law of the Sea
June 13-17 NYC
World Economic Forum
January 23-27 Davos
2016
15
Doc ID
© 2015 Ocean Conservancy
Andreas Merkl Chief Executive Officer
JOIN US IN OUR COLLECTIVE EFFFORT TO STEM THE TIDE