challenges of incremental sales modeling in direct · challenges of incremental sales modeling in...
TRANSCRIPT

Challenges of Incremental Sales Modeling in Direct
Marketing
Andrew Pole
Sr. Manager, Guest Data & Analytical Services
Target
October 20, 2009
Predictive Analytics World
Agenda
2
Background on Target and analytics team
Direct mail program at Target
Project background and objectives
Incremental sales measurement methodology
Models used in Target campaigns today
Incremental sales modeling methods investigated
Model development and selection
Model results
Hypotheses: Why the models didn’t work

Background on Target
3

Target stores and Target.com
4
Target operates over 1,700 stores in 49 states nationwide, including more than 240 SuperTarget® stores.
– In addition to the photo processing, pharmacy, and Food Avenue® restaurants found in almost every Target, SuperTarget offers guests in-store bakery, deli, meat and produce sections.
Launched in 1999, Target.com is consistently ranked as one of the most-visited websites, offering access to the world of Target online
Target operates its own proprietary cards: Target VISA, Target guest card, and the Target check card.
In FY 2008, Target, Corp. revenues were nearly $65B.
The analytical team
5
Guest Data & Analytical Services (GDAS)
Comprised of four teams: marketing analytics, merchandising analytics, data quality, and project management (totaling about 70 team members)
GDAS-Media and Database Marketing (MDM)
40 team members (20 US, 20 India) that provide analytics, modeling, campaign execution, and custom reporting for our marketing partners in-store and online
Support campaigns for direct mail, POS marketing, email, online targeted content, banner ads, search, as well as measurement and analysis for circular and other mass media
Tools we use include: SAS, SQL, Unica Affinium Campaign, WebFOCUS, MicroStrategy, Omniture Insight (online browse data)

Direct mail program at Target
6
Direct mail program at Target
7
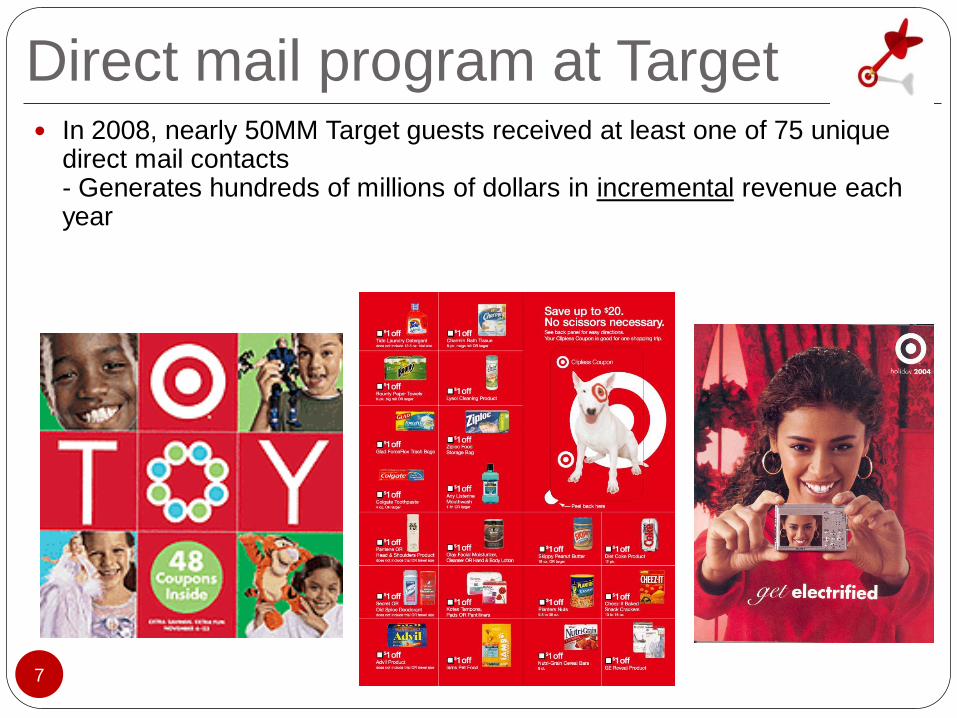
In 2008, nearly 50MM Target guests received at least one of 75 unique direct mail contacts- Generates hundreds of millions of dollars in incremental revenue each year
Direct mail successes
8
Many successes with direct mail program
Guest segmentation: Years of campaign testing has helped Target identify which guest segments will generate incremental sales, and how much RFM, demographic, and model-based segments
Customized mailers: Guests receive mail pieces with unique combination of relevant offers, based on brand-level models and optimization algorithm 15-20% lift in incremental sales vs. static mailer

Direct mail successes
9
Segment-level offer testing: Determine offer values (e.g. $5 off $50) for different segments 10-15% lift in incremental sales with optimal offer value
Coupon redeemer models: Overlaying coupon redemption likelihood models on existing guest segmentation (e.g. top 10% grocery guests) 15-30% lift in incremental sales
Target marketing challenged us to do
even better. Campaign execution at the
guest-level!

Project objectives
10
Incremental sales modeling project
11
Business objective
Increase revenue and profit, by identifying and contacting guests (i.e. customers) that are likely to spend incrementally upon receiving a Target direct mail piece
Analytical objective
Build a model to predict which guests are most likely to spend incrementally upon receiving Target direct mail

How Target designs and
measures direct mail
campaigns
12
How we analyze campaigns
13
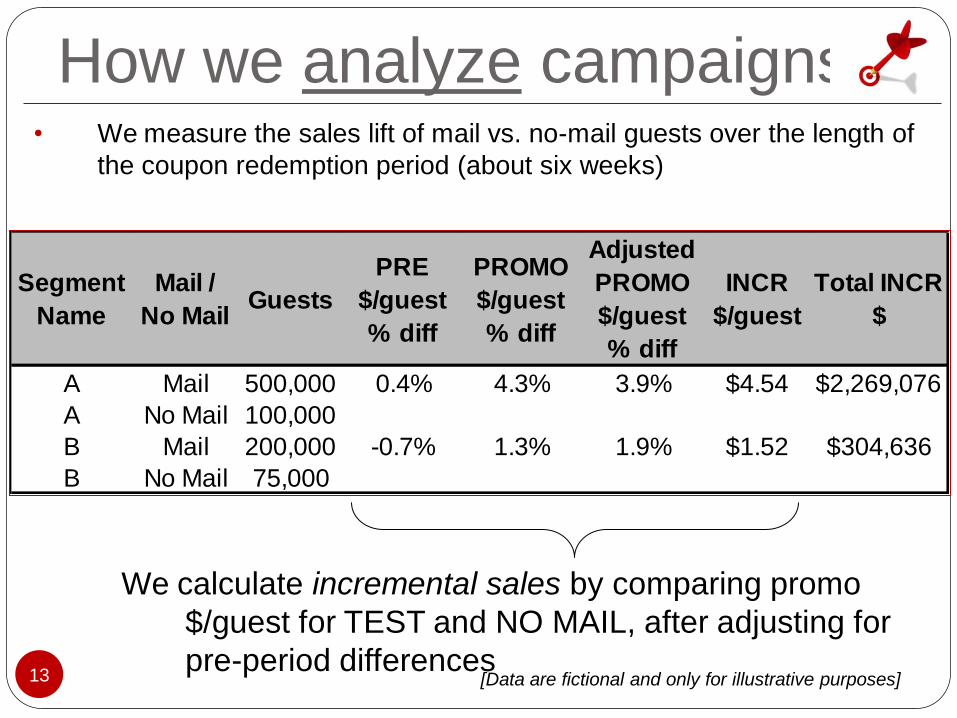
• We measure the sales lift of mail vs. no-mail guests over the length of
the coupon redemption period (about six weeks)
Segment
Name
Mail /
No Mail Guests
PRE
$/guest
% diff
PROMO
$/guest
% diff
Adjusted
PROMO
$/guest
% diff
INCR
$/guest
Total INCR
$
A Mail 500,000 0.4% 4.3% 3.9% $4.54 $2,269,076
A No Mail 100,000
B Mail 200,000 -0.7% 1.3% 1.9% $1.52 $304,636
B No Mail 75,000
We calculate incremental sales by comparing promo
$/guest for TEST and NO MAIL, after adjusting for
pre-period differences[Data are fictional and only for illustrative purposes]

The challenge
14
This report gives us performance at a guest segment level, but notat a guest level
Segment
Name
Mail /
No Mail Guests
INCR
$/guest
A Mail 500,000 $4.54
A No Mail 100,000
B Mail 200,000 $1.52
B No Mail 75,000
• So, how do we know which guests spent incrementally and which ones didn’t?
[Data are fictional and only for illustrative purposes]
Who should we target?
15
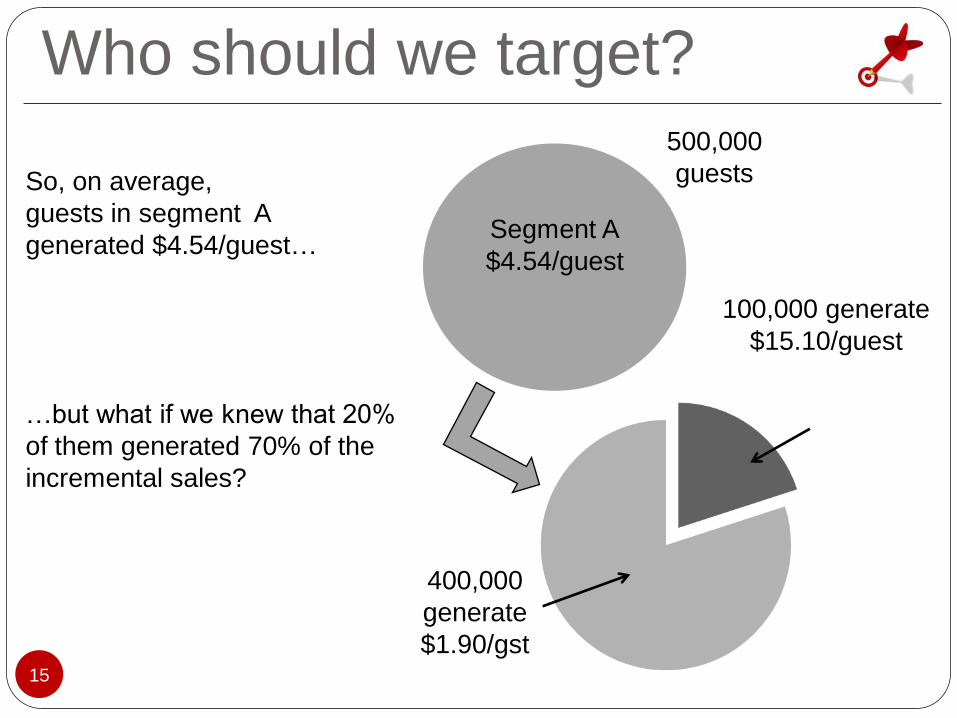
Segment A
$4.54/guest
500,000
guests
100,000 generate
$15.10/guest
400,000
generate
$1.90/gst
So, on average,
guests in segment A
generated $4.54/guest…
…but what if we knew that 20%
of them generated 70% of the
incremental sales?
Models currently used in
direct mail campaigns
16

Using predictive models in campaigns
17
At Target, we have hundreds of models that are scored each month and used in campaign selection
– Response/Conversion models predict whether a guest is likely to purchase a product that the guest has/hasn’t purchased before(e.g. Should we give Andrew a cookie offer?)
– Payout models predict how much a guest will spend on a category(e.g. Will Andrew spend over $50 on Home next month?)
– Demographic-inference models predict whether or not a guest has a particular demographic attribute or lifestage segment(e.g. Does Andrew have 0-12 month year old in his household?)
– Redemption models predict whether a guest is likely to redeem a coupon (e.g. Will Andrew redeem the coupon for $1 off laundry detergent?)
– Incremental sales models predict the incremental sales that a guest will generate if he or she receives a marketing contact
(e.g. If I send Andrew the grocery coupon book, will he spend incrementally, and if so, how much?)

The difficulty building ISMs
18
Incremental sales models (ISMs) are difficult to build because we don’t know incremental sales at a guest level
– We know incremental sales at a total campaign or segment level
To build a model you have to have look in the past for known responses. In our database, we can find:
– Guests that have shopped the category
– Mothers with a 0-12 month old baby
– Guests that have redeemed a TargetMail coupon
So how do we build an ISM? We don’t know incremental sales for each guest!
Incremental sales modeling
methodologies investigated
19

ISM methodologies
20
Six primary methods were investigated:
1. Modeled business-rule proxy
2. Likelihood to shop ISM
3. Expected spend ISM
4. Two-stage spend ISM
5. Coupon redemption model
6. “Specialized” decision tree
Model difference between Test $/gst and Control $/gst

Method 1: Modeled business-rule proxy
21
In this method, we first estimate incremental sales for each guest(proxy). Then, a predictive model is built using the outcome as the dependent variable.
A few business-rule proxies investigated
1. [guest promo $/day – guest pre $/day]
2. Proxy (1) with seasonal adjustments
3. Weighted estimate with change in spend and trips
Guest Pre $/day Promo $/day Incr $
A $1.25 $1.45 $0.20
B $2.60 $1.25 -$1.35
C $7.35 $0.45 -$6.90
First step is to
estimate the
dependent
variable
22
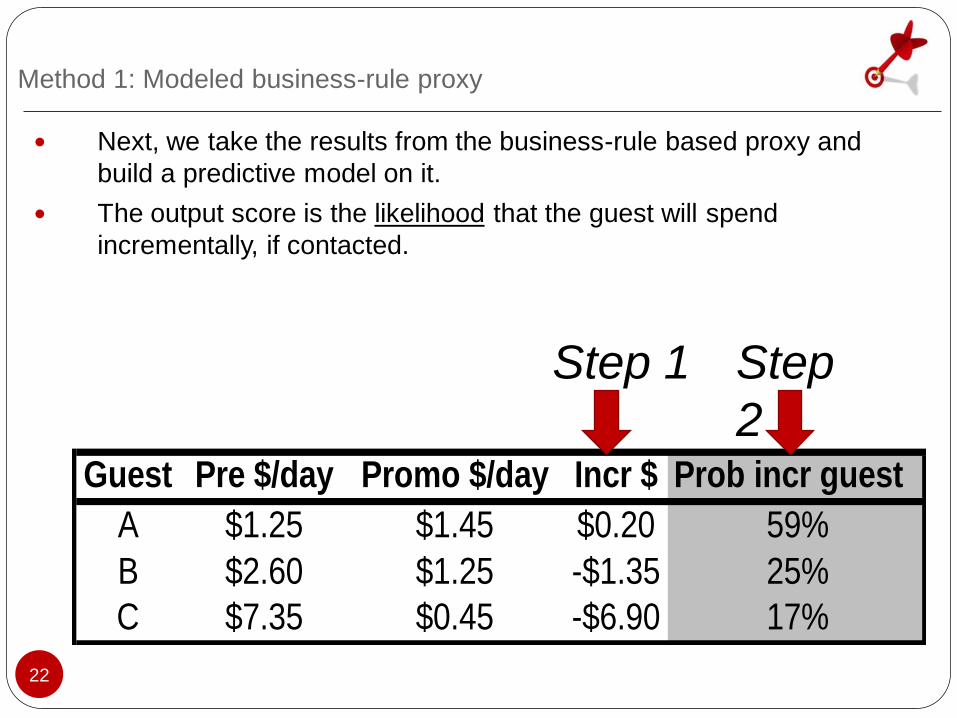
Next, we take the results from the business-rule based proxy and
build a predictive model on it.
The output score is the likelihood that the guest will spend
incrementally, if contacted.
Method 1: Modeled business-rule proxy
from Method 2
Guest Pre $/day Promo $/day Incr $ Prob incr guest
A $1.25 $1.45 $0.20 59%
B $2.60 $1.25 -$1.35 25%
C $7.35 $0.45 -$6.90 17%
from Method 1
Step 1 Step
2

Method 2: Likelihood to shop ISM
23
In this methodology, we try to identify guests that
are significantly more likely to shop Target if
contacted
Methodology1. Build one model on TEST guests to predict likelihood that
guest will shop Target, then build another model for
CONTROL guests
2. Score every guest using both models
3. (TEST score - CONTROL score) = incremental likelihood
to shop, given guest receives a contactGuest P(shop | TEST) P(shop | CONTROL) Incr P(shop | contact)
A 80% 78% 2%
B 52% 52% 0%
C 68% 35% 33%
Method 3: Expected spend ISM
24
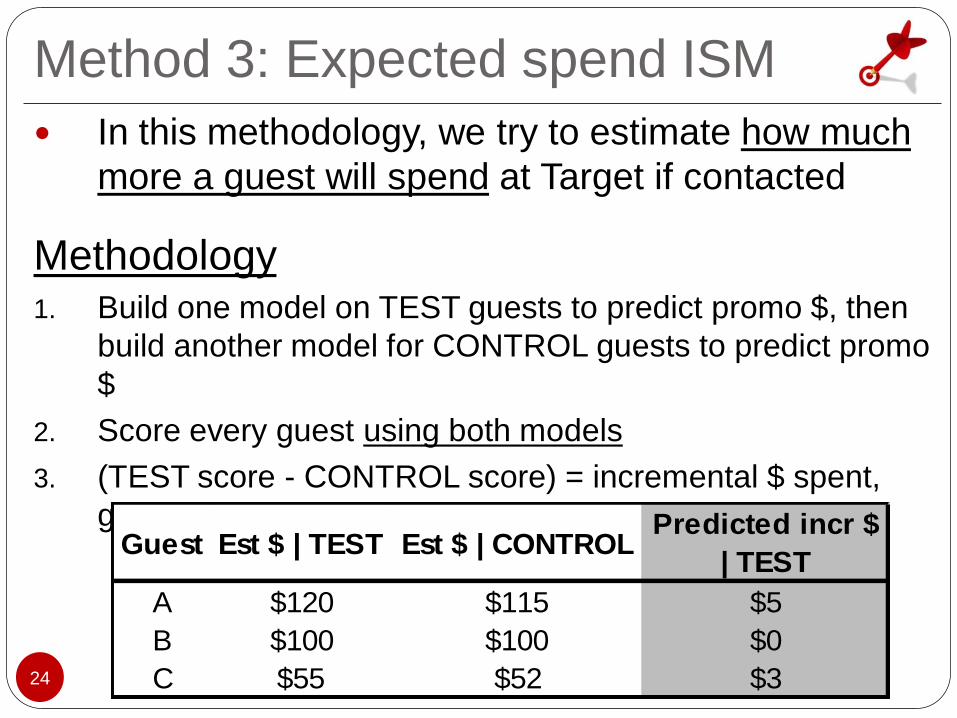
In this methodology, we try to estimate how much
more a guest will spend at Target if contacted
Methodology1. Build one model on TEST guests to predict promo $, then
build another model for CONTROL guests to predict promo
$
2. Score every guest using both models
3. (TEST score - CONTROL score) = incremental $ spent,
given guest receives a contactGuest Est $ | TEST Est $ | CONTROL
Predicted incr $
| TEST
A $120 $115 $5
B $100 $100 $0
C $55 $52 $3

Method 4: Two-stage spend ISM
25
In this methodology, we use the results from the expected spend ISM
(method 3), and then we build a model on these results to come up
with one final model
Methodology
1. Perform all steps in method (3)
2. Use resulting estimated guest-level incremental sales as the
dependent variable to build one final model
Guest Est $ | TEST Est $ | CONTROL Est incr $ | TEST Model (incr $ | TEST)
A $120 $115 $5 $4.52
B $100 $100 $0 -$0.32
C $55 $52 $3 $2.57

Method 5: Likelihood to redeem coupon
26
In this methodology, we build a model to determine the likelihood a
guest will redeem a coupon included in mail piece and see if this
correlates with incremental sales.
Methodology
1. Build a model on TEST guests to estimate the likelihood that the
guest will redeem the coupon incentive included in the direct mail.
2. Check to see if guest segments with high coupon redemption
scores also have high incremental sales.
Guest Redeemed coupon? P(redeem coupon)
A Yes 80%
B No 12%
C Yes 68%

Method 5: Likelihood to redeem coupon
27
While we were able to build fairly accurate
models to predict likely coupon redeemers,
high redemption likelihood did not correlate
with high incremental salesBecause of
these
results, we
did not
pursue this
methodolog
y further
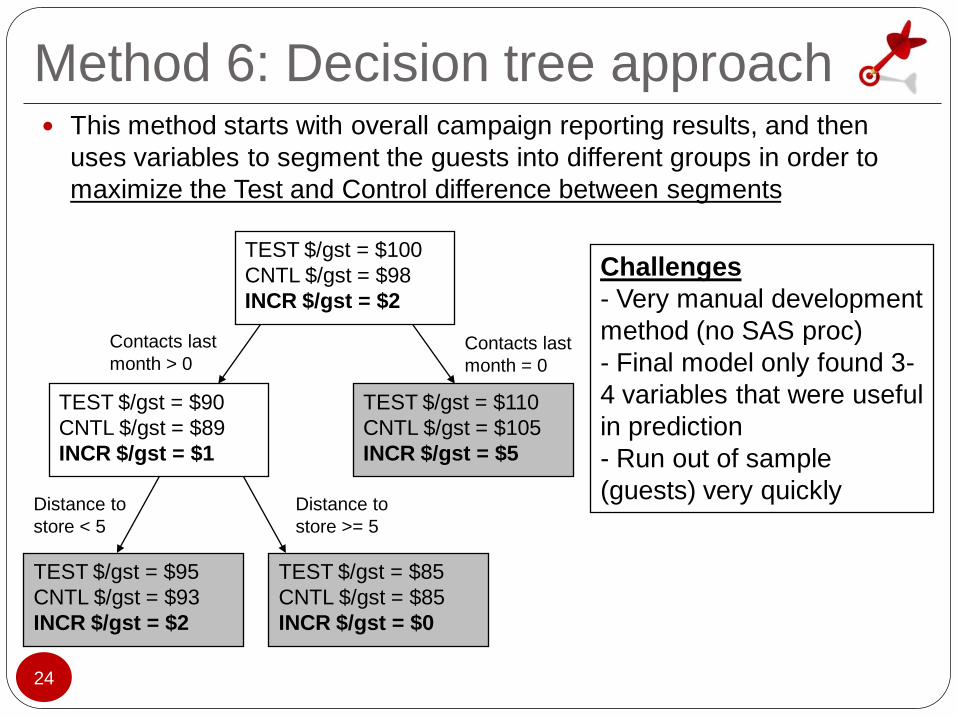
This method starts with overall campaign reporting results, and then
uses variables to segment the guests into different groups in order to
maximize the Test and Control difference between segments
TEST $/gst = $100
CNTL $/gst = $98
INCR $/gst = $2
TEST $/gst = $90
CNTL $/gst = $89
INCR $/gst = $1
TEST $/gst = $110
CNTL $/gst = $105
INCR $/gst = $5
Contacts last
month > 0 Contacts last
month = 0
TEST $/gst = $85
CNTL $/gst = $85
INCR $/gst = $0
TEST $/gst = $95
CNTL $/gst = $93
INCR $/gst = $2
Distance to
store < 5
Distance to
store >= 5
Challenges
- Very manual development
method (no SAS proc)
- Final model only found 3-
4 variables that were useful
in prediction
- Run out of sample
(guests) very quickly
Method 6: Decision tree approach
24

Because of the manual nature of model development and other
aforementioned challenges, we did not pursue this methodology further
TEST $/gst = $100
CNTL $/gst = $98
INCR $/gst = $2
TEST $/gst = $90
CNTL $/gst = $89
INCR $/gst = $1
TEST $/gst = $110
CNTL $/gst = $105
INCR $/gst = $5
Contacts last
month > 0 Contacts last
month = 0
TEST $/gst = $85
CNTL $/gst = $85
INCR $/gst = $0
TEST $/gst = $95
CNTL $/gst = $93
INCR $/gst = $2
Distance to
store < 5
Distance to
store >= 5
Method 6: Decision tree approach
Had to manually determine,
evaluate, and iterate what
variables to split on and at
what cut-off points to use
Oftentimes, our guest counts
in TEST or CONTROL got
too small after growing the
tree more than 2-3 levels
deep25
Model development and
selection
30

Data available
31
Modeling data sets were developed based on data from completed
direct mail campaigns
Generally speaking, each campaign had about 1MM test guests and
100-500K control guests
- In addition, we had guest “randoms”
(no selection criteria applied) of 75K test and control guests
Our database allows us to associate a large percentage of in-
store sales, nearly all of
online sales, and a fraction of online “cookie” browse behavior to
our guests

Data available
32
In-store and online purchase RFM
In-store and online $, units, and trips for total store/site and 50+
product categories (summarized over different time periods)
Online browse information
General online categories browsed and frequency in previous month
Demographics / other guest info
Age, income, children in HH, distance to nearest store, active Target
proprietary card, multi-channel guest, coupon redemption history, etc.
Guest contact history
Number of coupons redeemed and average incentive values of direct
mail, POS marketing, and email contacts received in last 0-3 months

Model development tools
33
Our analytics team used SQL, SAS Enterprise Guide, and SAS
Enterprise Miner to extract and prepare the data, create
transformations, and develop our predictive models
In general, we used regression, logistic regression, and decision
trees to build our incremental sales models

Selecting the best model
34
Models were built on a train sample and
cross-validated on a validation sample
– Later, models were validated on a similar “out of sample” direct
mail campaign to see if results were consistent
–
Model success was generally judged on lift metrics
Train
Out-
sample
validatio
n
In-
sample
validatio
n
June Grocery Mailer July Grocery Mailer
GOOD!
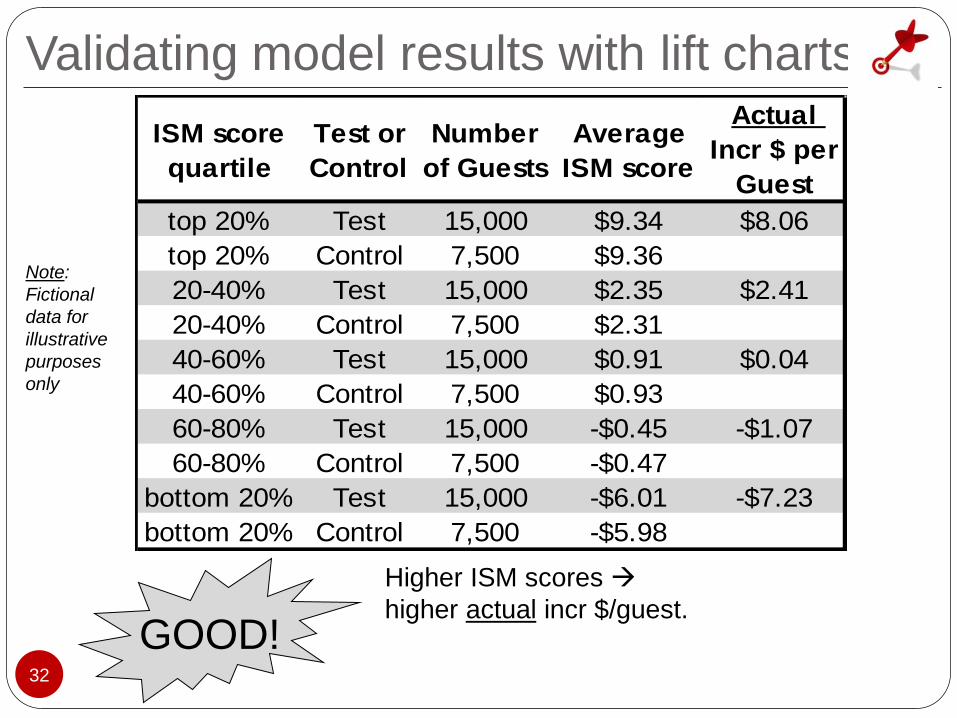
Validating model results with lift charts
Higher ISM scores
higher actual incr $/guest.
ISM score
quartile
Test or
Control
Number
of Guests
Average
ISM score
Actual
Incr $ per
Guest
top 20% Test 15,000 $9.34 $8.06
top 20% Control 7,500 $9.36
20-40% Test 15,000 $2.35 $2.41
20-40% Control 7,500 $2.31
40-60% Test 15,000 $0.91 $0.04
40-60% Control 7,500 $0.93
60-80% Test 15,000 -$0.45 -$1.07
60-80% Control 7,500 -$0.47
bottom 20% Test 15,000 -$6.01 -$7.23
bottom 20% Control 7,500 -$5.98
32
Note:
Fictional
data for
illustrative
purposes
only

BAD!
Validating model results with lift charts
ISM score
quartile
Test or
Control
Number
of Guests
Average
ISM score
Actual
Incr $ per
Guest
top 20% Test 15,000 $9.34 $1.01
top 20% Control 7,500 $9.36
20-40% Test 15,000 $2.35 -$1.84
20-40% Control 7,500 $2.31
40-60% Test 15,000 $0.91 $0.95
40-60% Control 7,500 $0.93
60-80% Test 15,000 -$0.45 $6.31
60-80% Control 7,500 -$0.47
bottom 20% Test 15,000 -$6.01 -$1.22
bottom 20% Control 7,500 -$5.98
33
Note:
Fictional
data for
illustrative
purposes
only
Higher ISM scores
higher actual incr $/guest.

Model Results
37

Model results
38
• Lift charts built on in-sample validation for
more than 10 direct mail campaigns showed the resulting trends
(lift chart results ranked best to worst)
1. Two-stage ISM
2. Likelihood to shop ISM
3. Estimated spend ISM
4. Modeled business-rule proxy

39
• For in-sample results, the Two-stage ISM and Likelihood to Shop
ISM generally showed:
– Training sample: Fairly consistent rank ordering of the deciles
and poor prediction of actual incremental sales values by decile
– Validation sample: Somewhat consistent rank ordering of the
deciles and poor prediction of actual incremental sales
• However, out-of-sample validation results were generally poor
– Out-of sample validation was performed by applying the same
model to a similar direct mail campaign during a different time
period to see if results would still hold
Model results

Grocery direct mail: TRAINING
40
• Rank ordering of INCR
$/guest isn’t perfect, but
directionally OK
• More negatives in lower
deciles, higher values in the
top deciles
• Surprising results in the 61-
70th percentile
Score rank
Average
score
INCR
P(shop)
Average
INCR
$/guest
Top 10% 77% $6.85
11-20% 70% $2.63
21-30% 66% $4.78
31-40% 61% $0.58
41-50% 53% -$0.64
51-60% 43% -$0.85
61-70% 37% $4.51
71-80% 33% -$0.40
81-90% 29% -$5.64
Bottom 10% 20% -$1.70
Results for "random" segment
(0-12 month store purchasers)
Note: Results are fictional, but are directionally
consistent with actual results
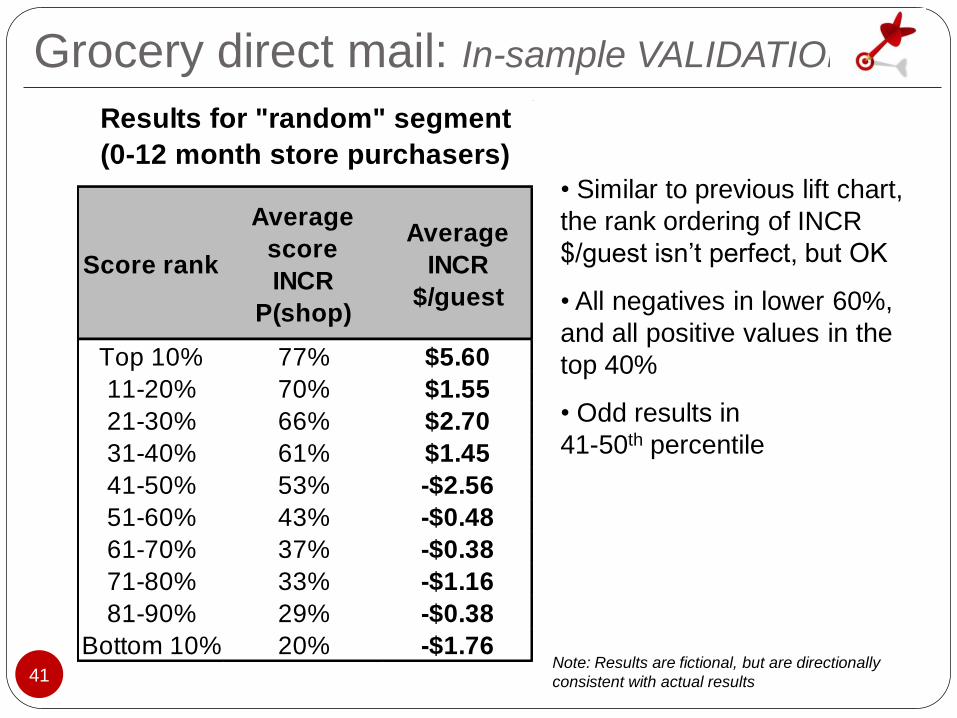
Grocery direct mail: In-sample VALIDATION
41
• Similar to previous lift chart,
the rank ordering of INCR
$/guest isn’t perfect, but OK
• All negatives in lower 60%,
and all positive values in the
top 40%
• Odd results in
41-50th percentile
Score rank
Average
score
INCR
P(shop)
Average
INCR
$/guest
Top 10% 77% $5.60
11-20% 70% $1.55
21-30% 66% $2.70
31-40% 61% $1.45
41-50% 53% -$2.56
51-60% 43% -$0.48
61-70% 37% -$0.38
71-80% 33% -$1.16
81-90% 29% -$0.38
Bottom 10% 20% -$1.76
Results for "random" segment
(0-12 month store purchasers)
Note: Results are fictional, but are directionally
consistent with actual results

Grocery direct mail: Out-of-sample
VALIDATION
42
Score rank
Average
score
INCR
P(shop)
Average
INCR
$/guest
Top 10% 75% $1.60
11-20% 68% -$0.69
21-30% 67% -$3.65
31-40% 62% -$0.07
41-50% 53% -$0.26
51-60% 46% -$0.22
61-70% 34% $0.26
71-80% 27% $0.78
81-90% 19% $1.43
Bottom 10% 20% $1.45
Results for "random" segment
(0-12 month store purchasers) • Results significantly worse
than previous
in-sample lift charts
• While the top 10% performs
well, the model does not hold
rank order
• Because of these results,
we are unwilling to use the
model for actual guest
selection
Note: Results are fictional, but are directionally
consistent with actual results

Hypotheses:
Why our modeling didn’t
work
43

Hypotheses
44
Data availability: We don’t have the right data.
– Economic indicators (e.g. consumer confidence index)
– Share of wallet (e.g. % of grocery $ spent at Target)
– Attitudinal information (e.g. price-sensitive guest)
Modeling methodology: We’re not using the right method.
– Key assumptions are being overlooked
– Continue work on developing the “decision tree” method
Problem too complex: Cannot predict with any more accuracy.
– Target already has very successful segmentation and customization
results, so even with more data and a robust methodology, perhaps
we can’t do any better than we are doing today
Questions?
45
Appendix
46

How we design campaigns
47
The marketing team gives the campaign execution team guest selection criteria for each of the segments
After determining which guests fit the criteria, a random sample of guests is placed into a MAIL (i.e. test) segment, and another in a NO MAIL (i.e. control) segment
Guests with
children who
spent at least
$100 on school
supplies
(5MM guests)
Random
sample
Random
sample
(100K guests)
Not to scale
NO MAIL(50K guests)

Model development
48
The team tried several variations on modeling techniques as well as
variable transformations:
1. Building segmented models (e.g. high spenders vs. low)
2. Using de-seasonalized independent and dependent variables
3. Inference models for variables with missing values
4. Modeled on variations of the target variable
- Promo period $ spent
- Guest shopped in promo period (Yes / No)
- Percentiles of promo period $ spent
- Transformations of promo period $ spent (log, sqrt)
- Two-stage modeling: P(shopping) * estimated $ spent

Influential variables in ISMs
49
Predictor variables commonly found in our incremental sales models:• 0-12 month guest spend and trips to Target stores• Whether or not a guest shops online at Target.com• Spend, trip, or browse variables to related product categories
(e.g. Essentials/grocery spend for TargetMail campaigns)• Change in guest spend and/or trips 0-6 vs. 7-12 months• Days since last purchase date, i.e. recency• Number of coupons redeemed in past 0-12 months• RedCard holder status and Target.com online shopper status• Tender type used in transactions• Occasionally, a demographic variable (e.g. guest age) or a
contact history variable (e.g. number of POS offers last month)