challenges of obtaining valid particle size data in inkjet inks
TRANSCRIPT

Challenges of Obtaining Valid Particle Size Data in Inkjet Inks
Application of DLS to UV/EB Cure Coatings Jeremy Powers and Kristine Eisemon
Plasticolors Inc. Ashtabula, Ohio USA
Abstract
For digital inkjet inks, particle size analysis is important to ensure proper jetting of the ink through the printer head and is an indicator of color development and transparency. The measurement of particle size of pigments in the nanometer range, such as those used in inkjet inks, brings with it a number of challenges. In this paper, the authors briefly review particle size measurement methodologies and will specifically address the challenges faced by formulators and analysts when making these measurements. In order to obtain meaningful information, one must understand the measurement principles and limitations of the methodology selected, the criticality of sample preparation, and understand the measurement parameters and variables and how they can affect the results. Examples will be used to illustrate the potential impact of many of these variables and recommendations will be offered to assist formulators and analysts collect valid data from which meaningful information can be drawn. Introduction
The relationship of pigment particle size to coatings performance and appearance is well understood by those in the industry. The pigment chemistry affects light absorption, which dictates color, and often times must be made compatible with the coating or ink. In some cases, the pigment chemistry can also affect the rate of reaction for reactive coatings and inks. Physical attributes of pigments play a role in defining some of the properties of a finished coating or ink. The attributes of dispersed particles have been summarized by Himics and Pineiro.
The following properties are dependent on particle size: • Flocculation • Hue/Tint Strength • Hiding/Transparency • Gloss/Flatting and Film Appearance • Viscosity • Stability • Weather Resistance 1
In terms of UV/EB cure inks, the pigment particle size will affect the manner in which an ink
flows through an inkjet printer head. The pigment particle size can also affect the filtration flow rate and filter cartridge demand when filtering the final ink system. As a result, nano-sized pigment dispersions are in demand for many UV/EB cure coatings and inks manufacturing facilities. These manufacturers rely on high performance requirements and tight specifications from pigment dispersions, both chemically and physically.

Manufacturers of UV/EB coatings and inks apply particle size analysis as a measurement of pigment dispersion quality. Accurate measurement of particle size is important in order to understand and resolve certain failure modes related to inks and coatings. The reliability of those results depends on the selection of appropriate equipment based on the particle size range and application. Each measurement technique has its own merits and limitations concerning the quantitative principles involved. For dispersions containing large pigment particles (>20 microns), where distribution data is not necessary, a Hegman grind gauge is used to determine the largest particle size. In the range of 1-20 microns, or where distribution data is needed, low angle light scattering (LALS) techniques are used to measure particle size distribution. Dispersions with particles below 1 micron are measured by dynamic light scattering (DLS) as the optimal light scattering technique for particle size measurement2.
The Hegman grind gauge is commonly used in manufacturing as a pass/fail test. It provides no
information about pigment particle size distribution, but will indicate the approximate largest particle size in the dispersion. During the milling process, coatings and inks are often tested by Hegman grind to monitor overall progress toward the dispersion end-point. Once the particles become sufficiently small, particle size distribution data becomes much more useful in measuring dispersion quality.
Many analysts choose LALS instruments due to the broad range of particles sizes they can measure, which range from about 20 nanometers to 3000 microns. LALS instruments are best suited for measuring Fraunhofer scattering. Fraunhofer scattering is the forward scattering component of Mie scattering theory and dominates for particles larger than about 1 micron. The Fraunhofer scattering component will not be herein described further, as pigment particles for most ink applications are less than 1 micron. For particles less than 1 micron, Mie scattering theory is applied to calculate particle size distribution using back scattered and forward scattered light. Among the assumptions in Mie theory are that the particles are spherical and the refractive index of the particle is known. In general, light from a source interacts with particles and scatters the light at different angles (Figure 1)3.
Figure 1
For a given scatter angle, the intensity of the light is higher for large particles than for small
particles, allowing for particles sizes to be distinguished from one another by light intensity. Additionally, the larger the scatter angle, the lower the light intensity. This means that as particles get smaller, the scatter angle becomes greater and the light intensity diminishes, making it difficult to distinguish size differences among a population of small particles. Beckman Coulter reports that in LALS, “the weak scattering signal from particles below 1 micron in size present difficulties in measuring the maxima or minima at high angles” as shown in Figure 24.
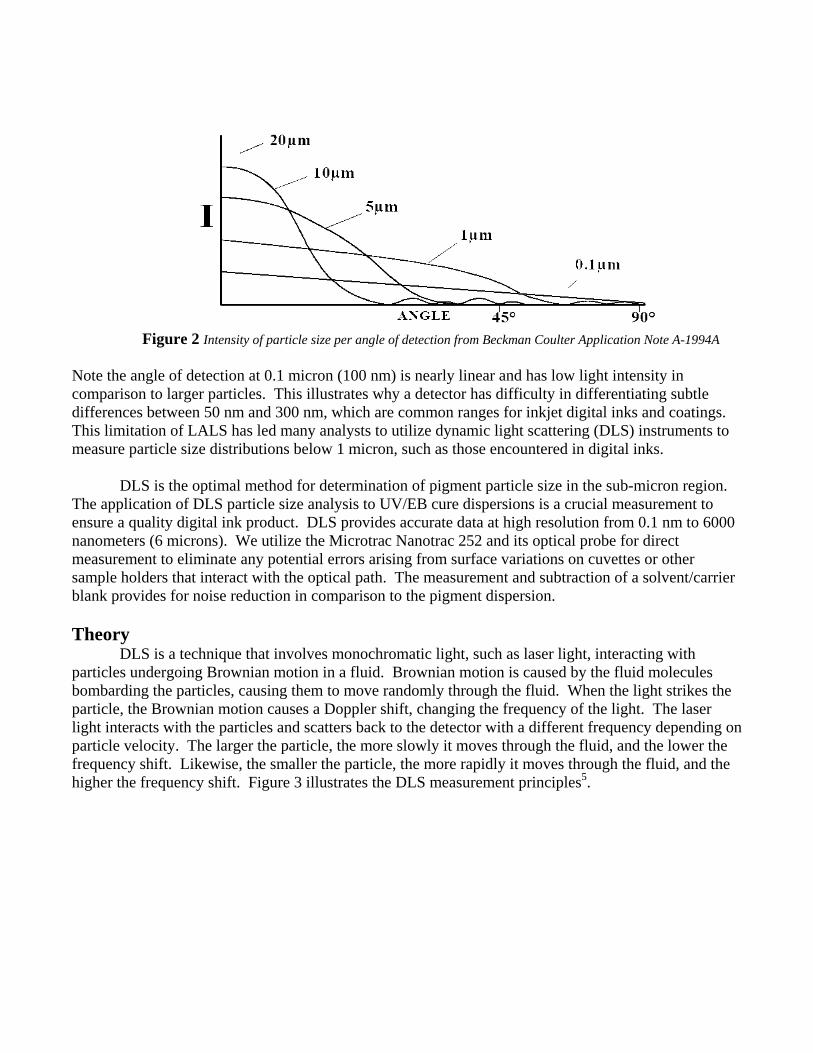
Figure 2 Intensity of particle size per angle of detection from Beckman Coulter Application Note A-1994A
Note the acomparison to larger particles. This illustrates why a detector has difficulty in differentiating subtle
tings. to
n region. he application of DLS particle size analysis to UV/EB cure dispersions is a crucial measurement to
ensure
/carrier
DLS is a technique that involves monochromatic light, such as laser light, interacting with ndergoing Brownian motion in a fluid. Brownian motion is caused by the fluid molecules
bombar s the
e
ngle of detection at 0.1 micron (100 nm) is nearly linear and has low light intensity in
differences between 50 nm and 300 nm, which are common ranges for inkjet digital inks and coaThis limitation of LALS has led many analysts to utilize dynamic light scattering (DLS) instruments measure particle size distributions below 1 micron, such as those encountered in digital inks.
DLS is the optimal method for determination of pigment particle size in the sub-microT
a quality digital ink product. DLS provides accurate data at high resolution from 0.1 nm to 6000 nanometers (6 microns). We utilize the Microtrac Nanotrac 252 and its optical probe for direct measurement to eliminate any potential errors arising from surface variations on cuvettes or other sample holders that interact with the optical path. The measurement and subtraction of a solventblank provides for noise reduction in comparison to the pigment dispersion. Theory
particles uding the particles, causing them to move randomly through the fluid. When the light strike
particle, the Brownian motion causes a Doppler shift, changing the frequency of the light. The laser light interacts with the particles and scatters back to the detector with a different frequency depending onparticle velocity. The larger the particle, the more slowly it moves through the fluid, and the lower thfrequency shift. Likewise, the smaller the particle, the more rapidly it moves through the fluid, and the higher the frequency shift. Figure 3 illustrates the DLS measurement principles5.

Figure 3
While the particle velocity ultimately determines the particle size distribution, the temperature
and viscosity of the fluid will influence the particle velocity and in turn can skew the particle size distribution data if not taken under consideration. The dependence of the particle size distribution on these parameters is given by the Stokes-Einstein equation;
Where D is the diffusion constant (measure of Brownian motion), kB is the Boltzmann constant, T is temperature, a is the radius of the particle, and η is the viscosity of the neat fluid. Temperature is proportional to particle radius and viscosity is inversely proportional to particle radius. Having incorrect values for either temperature or viscosity parameters will result in inaccurate data acquisition.
A DLS instrument uses a reference signal for comparison to the Doppler shifted light in order to
determine the amount of shift and calculate the velocity and resulting particle size. There are two possible optical configurations for the reference signal, named heterodyne and homodyne. In the heterodyne configuration, the detector uses a portion of the light source as a reference without interaction with the sample at the interface of the suspension and the probe tip. The light directed to the detector acts as a stable reference point or baseline for the scattered and shifted light from each particle6. The interference of the reflected and shifted light allows for removal of unwanted frequencies of light and noise. The signals that remain are the lower Doppler shifted light frequencies, which relate to the size of the pigment particles6. The homodyne configuration incorporates shifted light from other randomly scattered particles as a reference compared to randomly scattered particles that the detector collects. Both configurations use the Doppler shift of the frequency or wavelength to determine particle size; however the heterodyne configuration results in higher signal strength and a reference that is not frequency shifted. Application
There are a few important considerations in performing an accurate and precise particle size analysis on UV cure dispersions using DLS. As in any analysis, the sample analyzed must be representative of the bulk dispersion. A non-representative sample can lead to unexpected or inconsistent results. A priori knowledge of the sample is important before sample preparation, analysis, and interpretation begin. The following parameters should be considered when evaluating the validity of particle size distribution results. Any uncertainty in these parameters, such as pigment dispersion

grind, carrier viscosity, pigment concentration, pigment shape, and refractive index can undermine the credibility of the results.
Once a measurement system and configuration is chosen, techniques related to sample
preparation, analysis, and data interpretation should be considered. For DLS measurements, it is important to ensure the integrity of Brownian motion and not introduce conditions or variables which might alter or skew the Doppler shift measurements. The easiest of these variables to control is the temperature. Most DLS instruments measure temperature of the sample during analysis. Another variable is fluid viscosity, which can be measured for each solvent or carrier and considered in the calculation of particle size for dispersion. Hegman Grind value
Most DLS particle size analyzers have an upper detection limit of approximately 6-10 microns. Particles ~5 microns and higher tend to settle in a low viscosity dispersion and should not be evaluated by DLS. Settling is not a random motion and particles detected while settling will skew the particle size distribution. Large particles cause solvent drag while settling which pull the smaller particles in a downward direction. This is an ordered motion and causes an incorrect result and can lead to false data interpretation. DLS results are not valid if large particles are at the bottom of the sample during data collection. Settled particles are not detected, making the size distribution appear much smaller than it actually is. Generally, dispersions that do not show particles on the 8.0 Hegman gauge are suitable for DLS analysis. However, the reciprocal is not true. Particle size analysis cannot provide Hegman grind data. For example, Figure 4 is the particle size distribution of a carbon black dispersion as measured by the Horiba LA-910 LALS.
Figure 4 HORIBA LA-910 LALS result Plasticolors, Inc.
Note that the distribution indicates that the largest particle detected is approximately 2.9 microns with no particles detected at 5, 10, or 20 microns. These LALS results indicate that the particle size range of the above material is within the measurement range of a DLS instrument.

Figure 5 depicts a Hegman gauge containing a drawdown of the same dispersion measured on the HORIBA LA-910 LALS from Figure 4. The Hegman grind of the dispersion is approximately 3 ns. The largest particle detected on gauge is about 60 microns. The LA-910 LALS results do not reveal particles above 4 microns when the dispersion obviously contains particles at 60 microns via the Hegman grind gauge. This discrepancy is due to the particles not being present in a statistically significant quantity for detection in the LALS instrument. All light scattering instruments typically do not detect the true largest pigment particle present. They will indicate the largest particle that is frequent enough to register on the detector. Even though a light scattering instrument measurement detects particle size 100% below one micron, the dispersion could potentially contain particles above one micron. Accordingly, analysts report light scattering particle size distribution results in terms of detection. Particle size distribution data cannot be collected from a Hegman gauge and the light scattering particle size analyzers cannot determine Hegman grind.
Figure 5 Hegman Grind Gauge Carrier or diluting solvent viscosity
The viscosity of the fluid used during DLS analysis is an important consideration when measuring particle size. The fluid used during analysis could be the carrier fluid for the dispersion or a diluting solvent for the entire dispersion. The viscosity of the fluid directly relates to the particle size via the Stokes-Einstein equation and entering the correct viscosity of the fluid in the software is critical to obtaining an accurate particle size distribution.
Most DLS instrument manufacturers advertise the ability of their instruments to measure highly
concentrated dispersions. If the particles in the dispersions are pigments, highly concentrated samples generally lead to viscous (>50 cps) materials in terms of UV/EB cure ink dispersions. When considering analysis, one must remain aware of the principles of DLS measurement: Brownian motion of the particle is dependent upon the viscosity of the fluid. Therefore, high viscosity and highly concentrated dispersions pose a problem to Brownian motion and the velocity of particles. Particles move slower in high viscosity fluids, so differences in the velocity of particles become less and will fall out of the range of detection for DLS instruments. Also, particle-particle interactions in highly concentrated material can retard Brownian motion and create multi-scattering signals that are not indicative of the pigment particle velocity and size.
Figures 6a and 6b compare a concentrated pigment dispersion sample to the same dispersion
diluted for particle size distribution analysis on the Nanotrac DLS instrument.
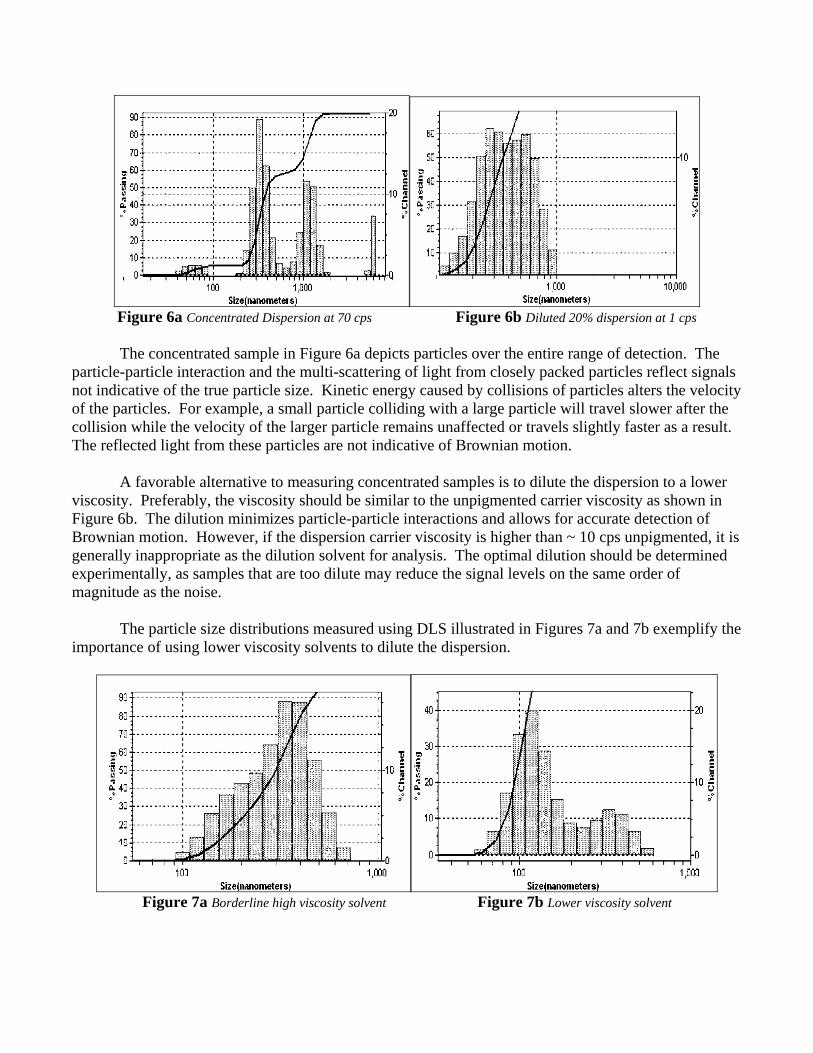
Figure 6a Concentrated Dispersion at 70 cps Figure 6b Diluted 20% dispersion at 1 cps
The concentrated sample in Figure 6a depicts particles over the entire range of detection. The
particle-particle interaction and the multi-scattering of light from closely packed particles reflect signals not indicative of the true particle size. Kinetic energy caused by collisions of particles alters the velocity of the particles. For example, a small particle colliding with a large particle will travel slower after the collision while the velocity of the larger particle remains unaffected or travels slightly faster as a result. The reflected light from these particles are not indicative of Brownian motion.
A favorable alternative to measuring concentrated samples is to dilute the dispersion to a lower
viscosity. Preferably, the viscosity should be similar to the unpigmented carrier viscosity as shown in Figure 6b. The dilution minimizes particle-particle interactions and allows for accurate detection of Brownian motion. However, if the dispersion carrier viscosity is higher than ~ 10 cps unpigmented, it is generally inappropriate as the dilution solvent for analysis. The optimal dilution should be determined experimentally, as samples that are too dilute may reduce the signal levels on the same order of magnitude as the noise.
The particle size distributions measured using DLS illustrated in Figures 7a and 7b exemplify the
importance of using lower viscosity solvents to dilute the dispersion.
Figure 7a Borderline high viscosity solvent Figure 7b Lower viscosity solvent
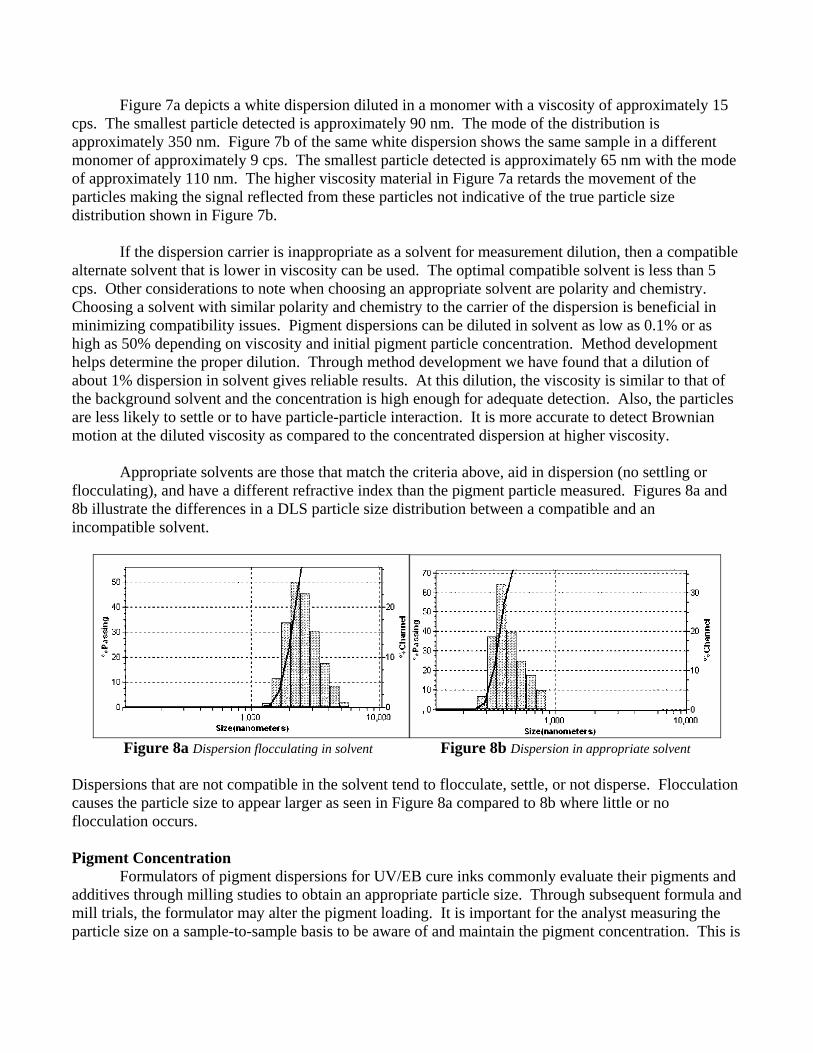
Figure 7a depicts a white dispersion diluted in a monomer with a viscosity of approximately 15 cps. The smallest particle detected is approximately 90 nm. The mode of the distribution is approximately 350 nm. Figure 7b of the same white dispersion shows the same sample in a different monomer of approximately 9 cps. The smallest particle detected is approximately 65 nm with the mode of approximately 110 nm. The higher viscosity material in Figure 7a retards the movement of the particles making the signal reflected from these particles not indicative of the true particle size distribution shown in Figure 7b.
If the dispersion carrier is inappropriate as a solvent for measurement dilution, then a compatible alternate solvent that is lower in viscosity can be used. The optimal compatible solvent is less than 5 cps. Other considerations to note when choosing an appropriate solvent are polarity and chemistry. Choosing a solvent with similar polarity and chemistry to the carrier of the dispersion is beneficial in minimizing compatibility issues. Pigment dispersions can be diluted in solvent as low as 0.1% or as high as 50% depending on viscosity and initial pigment particle concentration. Method development helps determine the proper dilution. Through method development we have found that a dilution of about 1% dispersion in solvent gives reliable results. At this dilution, the viscosity is similar to that of the background solvent and the concentration is high enough for adequate detection. Also, the particles are less likely to settle or to have particle-particle interaction. It is more accurate to detect Brownian motion at the diluted viscosity as compared to the concentrated dispersion at higher viscosity.
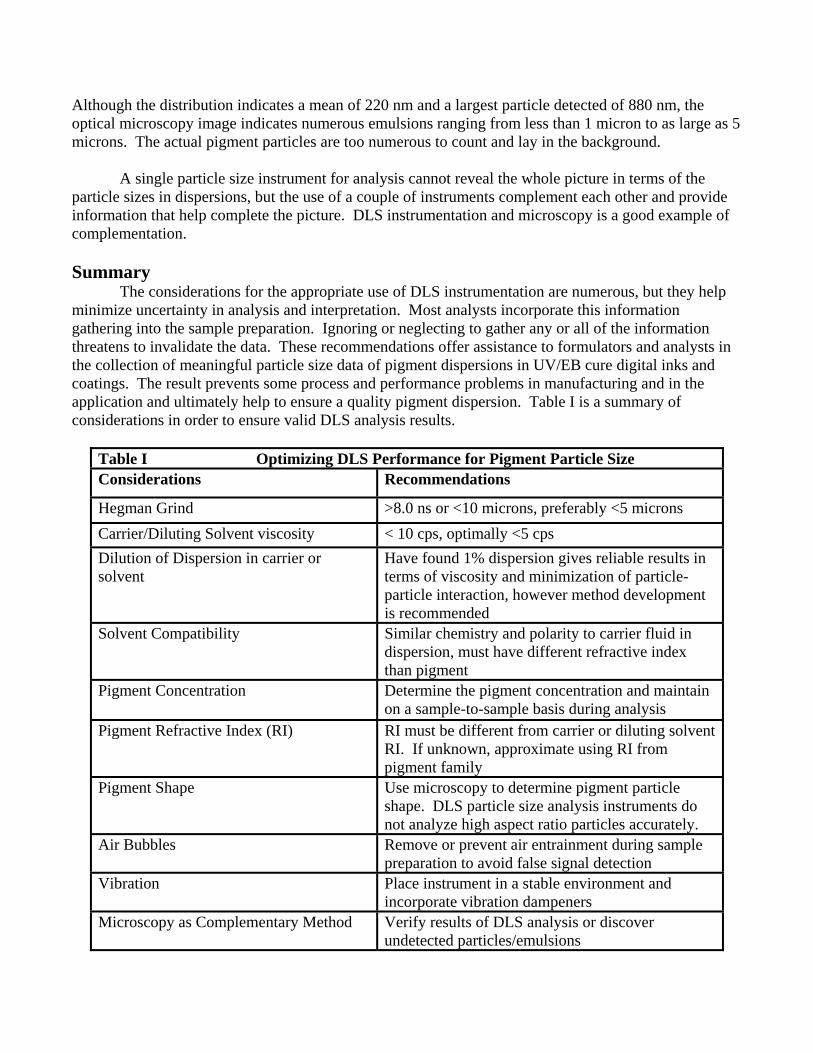
Appropriate solvents are those that match the criteria above, aid in dispersion (no settling or
flocculating), and have a different refractive index than the pigment particle measured. Figures 8a and 8b illustrate the differences in a DLS particle size distribution between a compatible and an incompatible solvent.
Figure 8a Dispersion flocculating in solvent Figure 8b Dispersion in appropriate solvent
Dispersions that are not compatible in the solvent tend to flocculate, settle, or not disperse. Flocculation causes the particle size to appear larger as seen in Figure 8a compared to 8b where little or no flocculation occurs. Pigment Concentration Formulators of pigment dispersions for UV/EB cure inks commonly evaluate their pigments and additives through milling studies to obtain an appropriate particle size. Through subsequent formula and mill trials, the formulator may alter the pigment loading. It is important for the analyst measuring the particle size on a sample-to-sample basis to be aware of and maintain the pigment concentration. This is

especially important when correlating data from different mill times to track the largest and smallest particle detected. An increase or a decrease in pigment concentration could make the largest particle more or less frequent for detection which could alter the distribution. It is also important to maintain a consistent pigment concentration during measurement when observing and comparing consecutive milling samples for additive studies. In additive studies, the additive may lose effectiveness with the reduction in particle size. The DLS instrument detects this phenomenon when maintaining the pigment concentration on a sample-to-sample basis. Unawareness of the pigment concentration frequently leads to errors in comparative sample data interpretations. Pigment chemistry, refractive index, and shape
The manner in which a particle interacts with light is dependent upon the refractive index of that particle and its shape. A common pitfall in DLS analysis is underestimating the role of refractive index of the pigment particle and its effect in the data calculations. Suppliers of developmental pigments may not provide or have data on the refractive index. In this case, the pigment chemistry is important in terms of approximating the refractive index for the pigment particle of interest. A refractive index from the same pigment chemistry family or similar pigment is usually a good approximation for the refractive index of the pigment particle analyzed. The imaginary component of the refractive index for the pigment usually does not play a role in DLS particle size analysis for two reasons. First, the light reflected is much higher in intensity than the light refracted or internally reflected and sent back to the detector. Secondly, the majority of pigment particles are not completely spherical or translucent making the absorption extinction coefficient infinite and the imaginary component unity.
The actual particle shape, determined by microscopy, is important when dealing with unexpected
or inconsistent distributions, possibly caused by high aspect ratios in a pigment particle shape. DLS instruments, as well as all light scattering techniques, assume for calculations that the particles analyzed are spherical. DLS instruments form particle size distributions based on this assumption. Therefore, one must consider the shape of the pigment particle when analyzing particle size data. Light scattering analysis is not appropriate for particles with extremely high aspect ratios.
Air Bubbles and Vibration
A common challenge in DLS analysis is the minimization of air entrapment in the sample and vibration during the measurements. Bubbles present in a sample, whether it is in a capillary tube, cuvette, bath, or probe, cause false signal reflection that lead to an incorrect particle size distribution. Avoiding the incorporation of air bubbles during mixing and dispensing of the sample or dilution is critical since these air bubbles will reflect light. Some samples contain bubbles inherently making deaeration necessary before analysis.
Vibration alters the Brownian motion of dispersions because it adds kinetic energy to the system
not related to temperature or viscosity. Anything that alters the random motion of the particles does not present an accurate depiction of particle size. Figure 9a below exemplifies the effect of lab bench vibration on a DLS particle size distribution result. Figure 9b depicts DLS particle size distribution of the same material without the vibration.

Figure 9a Vibration effect Figure 9b Without vibration
The distributions above illustrate the dramatic effect that vibration can have on measuring
particle size using DLS. When installing a DLS instrument in a lab, it is important to find a location that is away from doorways, foot traffic, air vents, etc. Also, granite slabs, vibration tables, or other types of dampeners which minimize vibration are important to an instrument configuration. Verification Using Microscopy Regardless of the type of pigment particle size analysis technique, the analyst should ultimately verify the dispersion using a secondary method such as microscopy. A verification method which complements the particle size distribution analysis is important in determining the limits of any instrument. Verification methods include but are not limited to: optical microscopy, TEM, TOF, photo-acoustic spectroscopy, or SEM. Verification of DLS is necessary because materials with similar refractive indices as the carrier will not reflect as well and will go undetected in light scattering instruments.
As an example, DLS instruments may not detect solid acrylics or micro-emulsions if their
refractive index is similar to the carrier or they are not frequent enough in comparison to the pigment particles. Figures 10a and 10b display a particle size distribution result of a pigment dispersion sample in the early milling stages for a UV inkjet system compared to the microscopy.
Figure 10a PSA results of a Red dispersion Figure 10b Microscopy of same dispersion
Although the distribution indicates a mean of 220 nm and a largest particle detected of 880 nm, the optical microscopy image indicates numerous emulsions ranging from less than 1 micron to as large as 5 microns. The actual pigment particles are too numerous to count and lay in the background.
A single particle size instrument for analysis cannot reveal the whole picture in terms of the
particle sizes in dispersions, but the use of a couple of instruments complement each other and provide information that help complete the picture. DLS instrumentation and microscopy is a good example of complementation. Summary
The considerations for the appropriate use of DLS instrumentation are numerous, but they help minimize uncertainty in analysis and interpretation. Most analysts incorporate this information gathering into the sample preparation. Ignoring or neglecting to gather any or all of the information threatens to invalidate the data. These recommendations offer assistance to formulators and analysts in the collection of meaningful particle size data of pigment dispersions in UV/EB cure digital inks and coatings. The result prevents some process and performance problems in manufacturing and in the application and ultimately help to ensure a quality pigment dispersion. Table I is a summary of considerations in order to ensure valid DLS analysis results.
Table I Optimizing DLS Performance for Pigment Particle Size Considerations Recommendations
Hegman Grind >8.0 ns or <10 microns, preferably <5 microns Carrier/Diluting Solvent viscosity < 10 cps, optimally <5 cps Dilution of Dispersion in carrier or solvent
Have found 1% dispersion gives reliable results in terms of viscosity and minimization of particle-particle interaction, however method development is recommended
Solvent Compatibility Similar chemistry and polarity to carrier fluid in dispersion, must have different refractive index than pigment
Pigment Concentration Determine the pigment concentration and maintain on a sample-to-sample basis during analysis
Pigment Refractive Index (RI) RI must be different from carrier or diluting solvent RI. If unknown, approximate using RI from pigment family
Pigment Shape Use microscopy to determine pigment particle shape. DLS particle size analysis instruments do not analyze high aspect ratio particles accurately.
Air Bubbles Remove or prevent air entrainment during sample preparation to avoid false signal detection
Vibration Place instrument in a stable environment and incorporate vibration dampeners
Microscopy as Complementary Method Verify results of DLS analysis or discover undetected particles/emulsions

Acknowledgements The authors wish to thank Microtrac’s Dr. Phil Plantz for his assistance and availability for questions. We also thank Mike Pohl for the permission to use the images and information from Horiba. Finally, the authors are indebted to several colleagues at Plasticolors, Inc for their input and support of this project. The Microtrac Nanotrac 252 generated all images of particle size distributions unless otherwise noted. References 1 Dr. Richard Himics and Ramon Pineiro Daniel Products Co. Inc., “The Importance of Particle Size in Liquid Coatings”, Gardner Publications, Inc, copyright 1997-2007 2 Weiner PhD, Bruce, “A Guide to Choosing a Particle Sizer”, Brookhaven Instruments Corporation, Holtsville, NY 3 http://www.horibalab.com 4 Beckman Coulter, “Using Laser Diffraction Analysis in Pigment Sizing”, Application Note A-1994A 5 http://www.microtrac.com 6 Freud PhD, Paul J., “Nanoparticle Sizing. Dynamic Light Scattering Analysis in the Frequency Spectrum Mode”, Application Note SL-AN-14 Rev A, Microtrac Inc, 2004