challenges to the classical approach po.018 to uncertainty
TRANSCRIPT
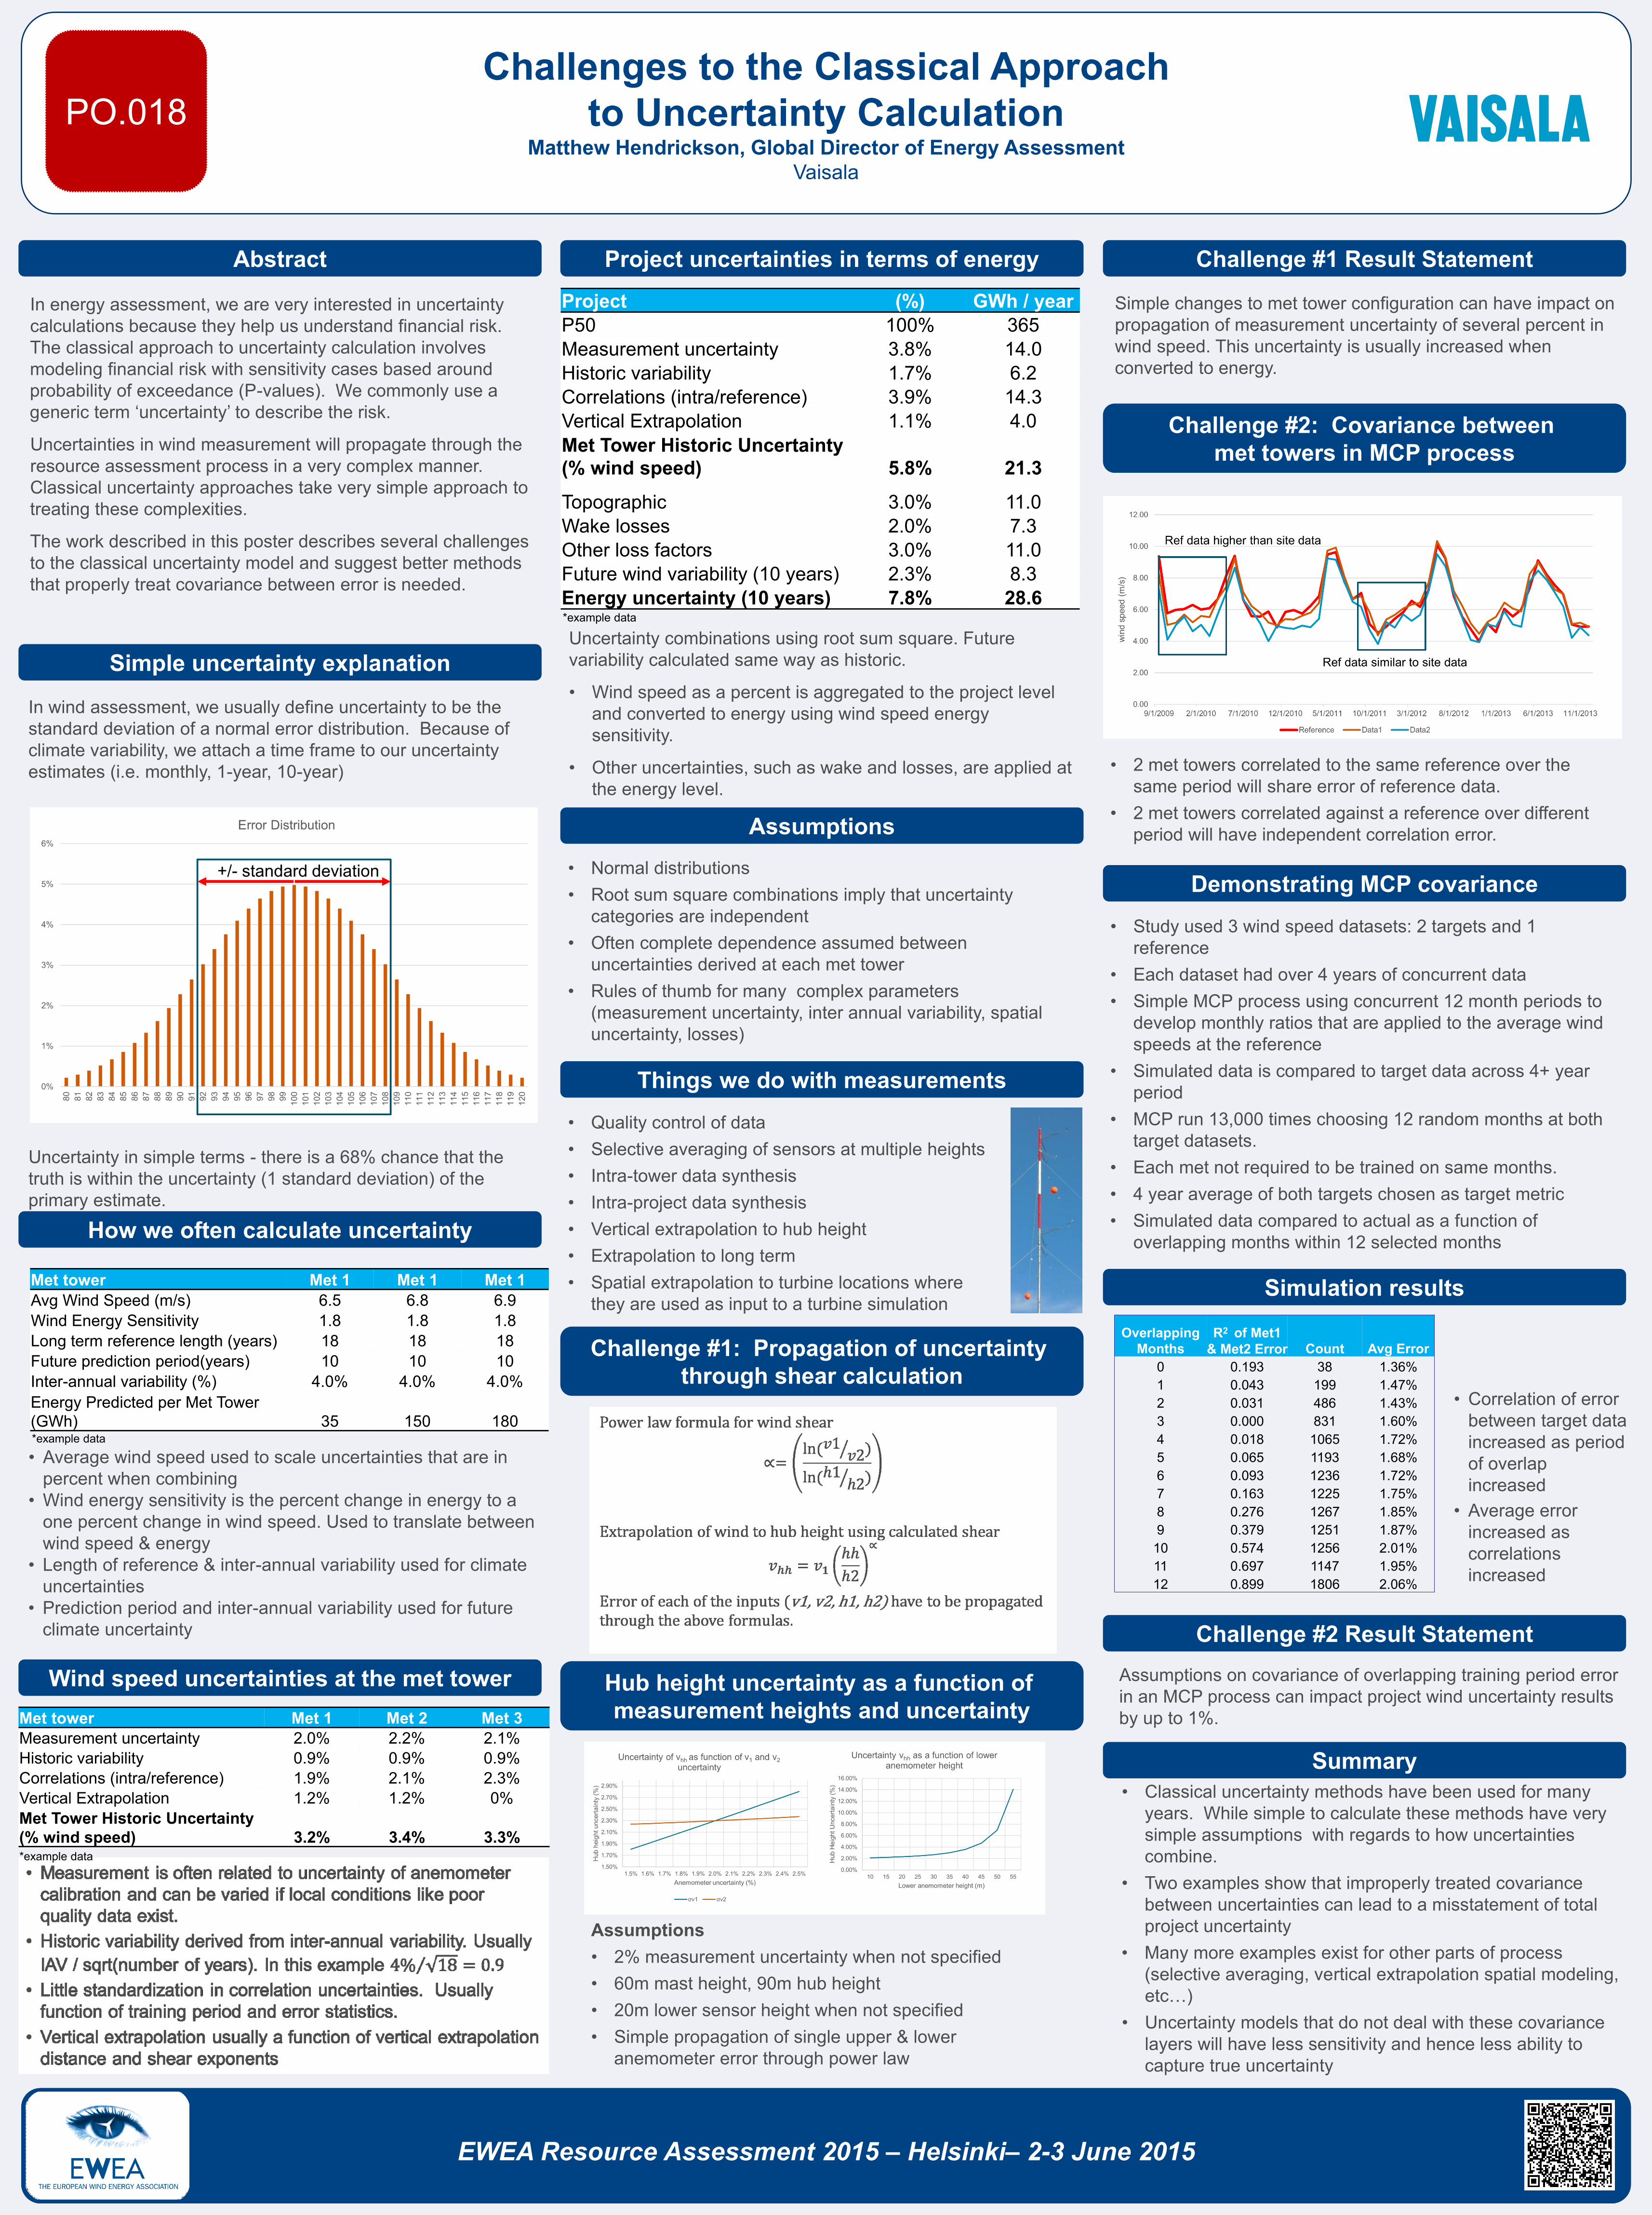
In wind assessment, we usually define uncertainty to be the standard deviation of a normal error distribution. Because of climate variability, we attach a time frame to our uncertainty estimates (i.e. monthly, 1-year, 10-year)
In energy assessment, we are very interested in uncertainty calculations because they help us understand financial risk. The classical approach to uncertainty calculation involves modeling financial risk with sensitivity cases based around probability of exceedance (P-values). We commonly use a generic term ‘uncertainty’ to describe the risk.
Uncertainties in wind measurement will propagate through the resource assessment process in a very complex manner. Classical uncertainty approaches take very simple approach to treating these complexities.
The work described in this poster describes several challenges to the classical uncertainty model and suggest better methods that properly treat covariance between error is needed.
Abstract Project uncertainties in terms of energy Challenge #1 Result Statement
Simple uncertainty explanation
Simulation results
Challenges to the Classical Approachto Uncertainty Calculation
Matthew Hendrickson, Global Director of Energy AssessmentVaisala
PO.018
EWEA Resource Assessment 2015 – Helsinki– 2-3 June 2015EWEA Resource Assessment 2015 – Helsinki– 2-3 June 2015
Uncertainty in simple terms - there is a 68% chance that the truth is within the uncertainty (1 standard deviation) of the primary estimate.
How we often calculate uncertainty
Met tower Met 1 Met 1 Met 1Avg Wind Speed (m/s) 6.5 6.8 6.9Wind Energy Sensitivity 1.8 1.8 1.8Long term reference length (years) 18 18 18Future prediction period(years) 10 10 10Inter-annual variability (%) 4.0% 4.0% 4.0%Energy Predicted per Met Tower (GWh) 35 150 180
• Average wind speed used to scale uncertainties that are in percent when combining
• Wind energy sensitivity is the percent change in energy to a one percent change in wind speed. Used to translate between wind speed & energy
• Length of reference & inter-annual variability used for climate uncertainties
• Prediction period and inter-annual variability used for future climate uncertainty
Wind speed uncertainties at the met towerMet tower Met 1 Met 2 Met 3Measurement uncertainty 2.0% 2.2% 2.1%Historic variability 0.9% 0.9% 0.9%Correlations (intra/reference) 1.9% 2.1% 2.3%Vertical Extrapolation 1.2% 1.2% 0%Met Tower Historic Uncertainty (% wind speed) 3.2% 3.4% 3.3%
Project (%) GWh / yearP50 100% 365Measurement uncertainty 3.8% 14.0Historic variability 1.7% 6.2Correlations (intra/reference) 3.9% 14.3Vertical Extrapolation 1.1% 4.0Met Tower Historic Uncertainty (% wind speed) 5.8% 21.3
Topographic 3.0% 11.0Wake losses 2.0% 7.3Other loss factors 3.0% 11.0Future wind variability (10 years) 2.3% 8.3Energy uncertainty (10 years) 7.8% 28.6
Uncertainty combinations using root sum square. Future variability calculated same way as historic.
• Wind speed as a percent is aggregated to the project level and converted to energy using wind speed energy sensitivity.
• Other uncertainties, such as wake and losses, are applied at the energy level.
Assumptions• Normal distributions• Root sum square combinations imply that uncertainty
categories are independent• Often complete dependence assumed between
uncertainties derived at each met tower• Rules of thumb for many complex parameters
(measurement uncertainty, inter annual variability, spatial uncertainty, losses)
Things we do with measurements
• Quality control of data• Selective averaging of sensors at multiple heights• Intra-tower data synthesis• Intra-project data synthesis• Vertical extrapolation to hub height• Extrapolation to long term• Spatial extrapolation to turbine locations where
they are used as input to a turbine simulation
Challenge #1: Propagation of uncertainty through shear calculation
Hub height uncertainty as a function of measurement heights and uncertainty
Assumptions• 2% measurement uncertainty when not specified• 60m mast height, 90m hub height• 20m lower sensor height when not specified• Simple propagation of single upper & lower
anemometer error through power law
Simple changes to met tower configuration can have impact on propagation of measurement uncertainty of several percent in wind speed. This uncertainty is usually increased when converted to energy.
Challenge #2: Covariance between met towers in MCP process
• 2 met towers correlated to the same reference over the same period will share error of reference data.
• 2 met towers correlated against a reference over different period will have independent correlation error.
Demonstrating MCP covariance
• Study used 3 wind speed datasets: 2 targets and 1 reference
• Each dataset had over 4 years of concurrent data• Simple MCP process using concurrent 12 month periods to
develop monthly ratios that are applied to the average wind speeds at the reference
• Simulated data is compared to target data across 4+ year period
• MCP run 13,000 times choosing 12 random months at both target datasets.
• Each met not required to be trained on same months.• 4 year average of both targets chosen as target metric• Simulated data compared to actual as a function of
overlapping months within 12 selected months
Overlapping Months
R2 of Met1 & Met2 Error Count Avg Error
0 0.193 38 1.36%1 0.043 199 1.47%2 0.031 486 1.43%3 0.000 831 1.60%4 0.018 1065 1.72%5 0.065 1193 1.68%6 0.093 1236 1.72%7 0.163 1225 1.75%8 0.276 1267 1.85%9 0.379 1251 1.87%10 0.574 1256 2.01%11 0.697 1147 1.95%12 0.899 1806 2.06%
• Correlation of error between target data increased as period of overlap increased
• Average error increased as correlations increased
Challenge #2 Result StatementAssumptions on covariance of overlapping training period error in an MCP process can impact project wind uncertainty results by up to 1%.
• Classical uncertainty methods have been used for many years. While simple to calculate these methods have very simple assumptions with regards to how uncertainties combine.
• Two examples show that improperly treated covariance between uncertainties can lead to a misstatement of total project uncertainty
• Many more examples exist for other parts of process (selective averaging, vertical extrapolation spatial modeling, etc…)
• Uncertainty models that do not deal with these covariance layers will have less sensitivity and hence less ability to capture true uncertainty
Summary
*example data
*example data
*example data