challenges & trends in public sector it operations: united ...€¦ · challenges & trends...
TRANSCRIPT
Challenges & Trends in Public Sector IT Operations: United States
DevOps fuels optimism despite declining confidence
Ponemon Institute© Research Report
Independently conducted by Ponemon Institute Sponsored by Splunk Publication Date: July 2017

Ponemon Institute© Research Report Page 1
Challenges & Trends in Public Sector IT Operations: United States DevOps fuels optimism despite declining confidence
Ponemon Institute, July 2017
Part 1. Introduction Public sector organizations are feeling the pains of digital transformation. Faced with modernization, data center upgrades and continuous cloud-first initiatives, this transformation of the IT environment is making it a challenge to deliver services, comply with service level agreements (SLAs), meet citizens’ expectations and achieve organizational missions. The evidence is clear from a research study conducted by the Ponemon Institute and sponsored by Splunk of 1,227 decision makers and operations staff across federal, state and local governments, higher education and federal systems integrators and aerospace and defense industries.1 Challenges & Trends in Public Sector IT Operations: the United States reveals that digital transformation is well underway with budgets shifting from traditional on premise investments to more cloud and agile development paradigms. This shift in the IT environment, while being embraced, has led to an overall loss of confidence among public sector organizations. This sentiment is shared across all segments of the public sector and is evidenced in respondents’ lack of confidence in their organizations’ ability to accomplish the following: ! Ensure performance and availability of systems to meet SLAs consistently ! Handle the scale and complexity of IT operations ! Ensure efficiency of operations ! Migrate workloads to the cloud ! Manage data center upgrades Research findings explain the reasons for the loss of confidence. These include siloed IT systems and technologies and an inability to integrate those systems, according to 72 percent of respondents. Respondents also cite the lack of end-to-end visibility (73 percent of respondents) and complexity and diversity of technologies and systems (66 percent of respondents) among the biggest challenges to service delivery along with a dearth of skills, expertise and resources to effectively accomplish their jobs. Even with monitoring and data analytics in place, these tools are disconnected from each other and most respondents believe they are ineffective at helping quickly pinpoint issues and determine root cause (78 percent of respondents) because they do not offer end-to-end visibility. Respondents also say that a lack of collaboration across teams and a lack of data fidelity and context are challenges to timely issue resolutions. Such challenges also affect organizations’ ability to quickly and efficiently respond to system outages and interruptions. On average, it takes 44 hours and 12.5 staff members to restore the IT system to operational status following a system outage or interruption. Despite the loss of confidence, respondents do see a silver lining in the transformation of their IT operations. According to respondents, the move to DevOps (development and operations) is making it easier to deliver quality services on time and within budget. To support the transformation, organizations are shifting spending from on premise to cloud computing, DevOps and new technologies. Respondents also recognize that machine learning capabilities (25 percent) and better network visibility across the entire organization (29 percent) can improve their organizations’ IT
1 A parallel study was conducted with a sample of organizations in the United Kingdom.

Ponemon Institute© Research Report Page 2
operations. Respondents are also increasingly aware of the types of data available and how such data can be used across operational silos to reduce risks to their organizations. Following are key findings from this research Confidence in current IT operations is lower than it was 12 months ago. The primary reasons for this change are the inability to ensure performance and availability of systems to meet SLAs consistently, the inability to handle the scale and complexity of IT operations and the inability to ensure efficiency. The confidence gap seems to stem from lacks in tools, skills, and resources. Respondents believe that the most severe threats and risks to carrying out their duties arise from a lack of end-to-end visibility of systems and operations (73 percent), lack of skills and expertise (71 percent), and lack of sufficient resources (70 percent). Visibility and machine learning are seen as critical to improving IT operations. Out of a list of five options of the most effective way to strengthen IT operations, 29 percent of respondents believe that better network visibility would be most effective and 25 percent of respondents believe that machine learning capabilities would be most effective. Spending on cloud and DevOps will grow significantly while on-premise spending dwindles. About half of the respondents say that spending on both cloud operations (47 percent) and DevOps (45 percent) will grow over the next year, while only 29 percent say that on-premise spending would do the same. Alerts still remain too numerous and erroneous, and current event monitoring tools are not solving the problem. More than half of respondents say they still receive too many alerts (54 percent) and that those alerts generate too many false positives (55 percent). More than three-fourths (78 percent) of respondents are unsure or do not think that their current crop of analytics and monitoring tools are helping them pinpoint problems and determine root causes because they lack end-to-end visibility. The challenges and risks described in this research result in inefficient response to system outages and interruptions. According to 67 percent of respondents, their organizations lack a consistent and formal IT outage response process. On average, it takes 44 hours and 12.5 staff members to restore the IT system to operational status following a system outage and interruption. Will IT and security converge? More than two-thirds of respondents (72 percent) do not believe or are unsure if their security and IT operations will converge in the future. Is it possible to use the same data sets across the organization to solve problems? Sixty-four percent of respondents are unsure or don’t think the data sets they are using can solve multiple challenges such as IT troubleshooting, service monitoring, security and business/mission analytics. Similarly, 62 percent of respondents are doubtful the same data can be used throughout the organization.
Ponemon Institute© Research Report Page 3
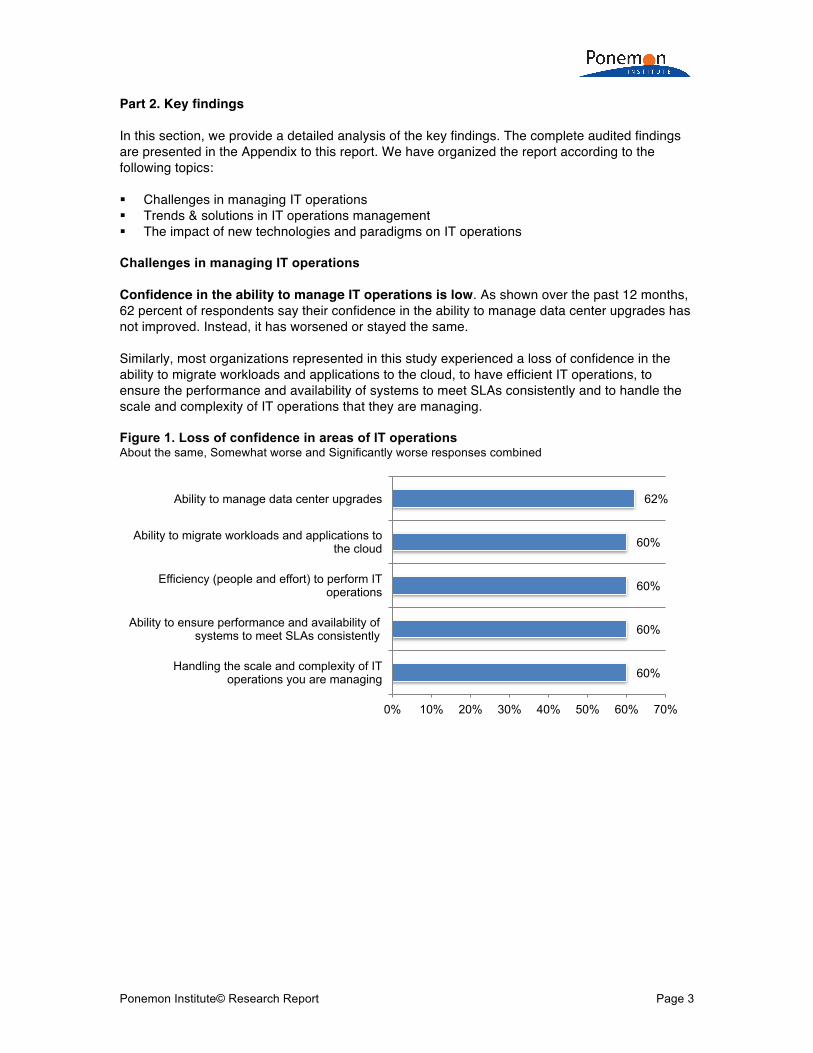
Part 2. Key findings In this section, we provide a detailed analysis of the key findings. The complete audited findings are presented in the Appendix to this report. We have organized the report according to the following topics: ! Challenges in managing IT operations ! Trends & solutions in IT operations management ! The impact of new technologies and paradigms on IT operations Challenges in managing IT operations Confidence in the ability to manage IT operations is low. As shown over the past 12 months, 62 percent of respondents say their confidence in the ability to manage data center upgrades has not improved. Instead, it has worsened or stayed the same. Similarly, most organizations represented in this study experienced a loss of confidence in the ability to migrate workloads and applications to the cloud, to have efficient IT operations, to ensure the performance and availability of systems to meet SLAs consistently and to handle the scale and complexity of IT operations that they are managing. Figure 1. Loss of confidence in areas of IT operations About the same, Somewhat worse and Significantly worse responses combined
60%
60%
60%
60%
62%
0% 10% 20% 30% 40% 50% 60% 70%
Handling the scale and complexity of IT operations you are managing
Ability to ensure performance and availability of systems to meet SLAs consistently
Efficiency (people and effort) to perform IT operations
Ability to migrate workloads and applications to the cloud
Ability to manage data center upgrades
Ponemon Institute© Research Report Page 4
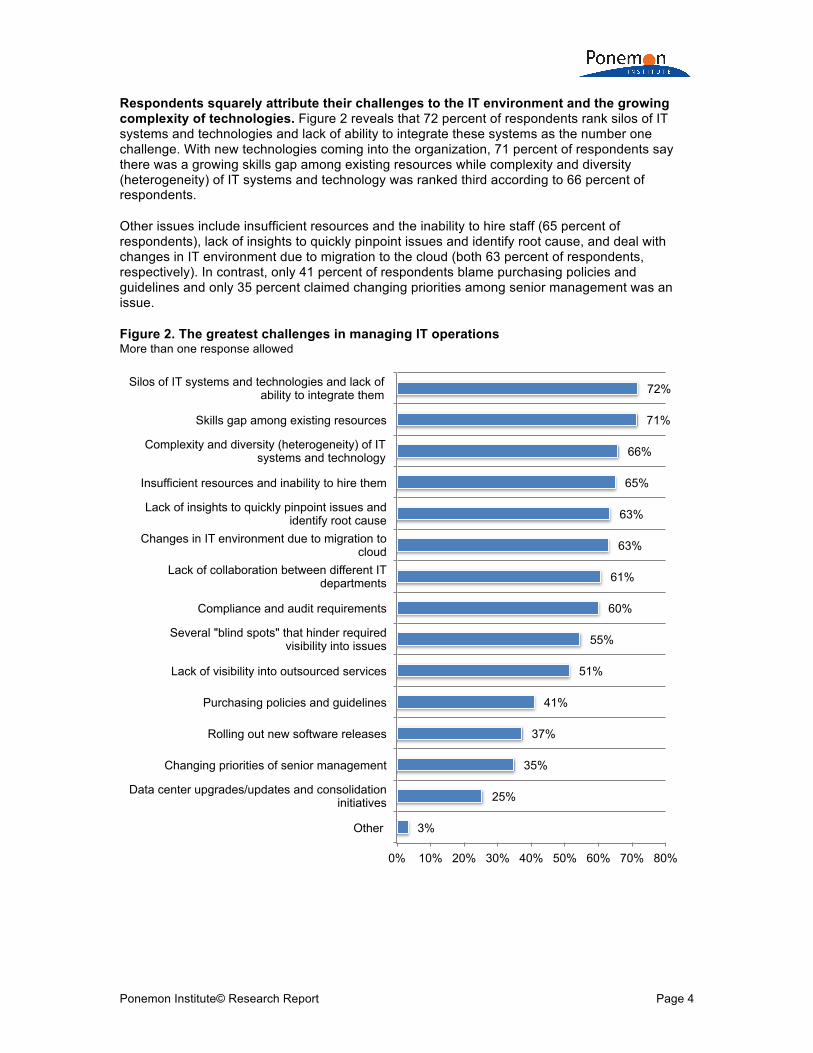
Respondents squarely attribute their challenges to the IT environment and the growing complexity of technologies. Figure 2 reveals that 72 percent of respondents rank silos of IT systems and technologies and lack of ability to integrate these systems as the number one challenge. With new technologies coming into the organization, 71 percent of respondents say there was a growing skills gap among existing resources while complexity and diversity (heterogeneity) of IT systems and technology was ranked third according to 66 percent of respondents.
Other issues include insufficient resources and the inability to hire staff (65 percent of respondents), lack of insights to quickly pinpoint issues and identify root cause, and deal with changes in IT environment due to migration to the cloud (both 63 percent of respondents, respectively). In contrast, only 41 percent of respondents blame purchasing policies and guidelines and only 35 percent claimed changing priorities among senior management was an issue.
Figure 2. The greatest challenges in managing IT operations More than one response allowed
3%
25%
35%
37%
41%
51%
55%
60%
61%
63%
63%
65%
66%
71%
72%
0% 10% 20% 30% 40% 50% 60% 70% 80%
Other
Data center upgrades/updates and consolidation initiatives
Changing priorities of senior management
Rolling out new software releases
Purchasing policies and guidelines
Lack of visibility into outsourced services
Several "blind spots" that hinder required visibility into issues
Compliance and audit requirements
Lack of collaboration between different IT departments
Changes in IT environment due to migration to cloud
Lack of insights to quickly pinpoint issues and identify root cause
Insufficient resources and inability to hire them
Complexity and diversity (heterogeneity) of IT systems and technology
Skills gap among existing resources
Silos of IT systems and technologies and lack of ability to integrate them

Ponemon Institute© Research Report Page 5
Digital transformation combined with the challenges described above make the management of IT operations difficult. If an interruption to IT systems or loss of service occurred, 70 percent of respondents say they are unsure or do not believe their organization has the ability to determine the root cause of the problem quickly (within minutes). This directly affects mean time to respond (MTTR) and organizations’ ability to deliver on SLAs and meet citizen and mission expectations. Seventy-six percent of respondents say that they do not have or are unsure if they have end-to-end visibility across IT systems and can foresee issues before they impact them.
The inability to integrate IT systems and technologies systems (silos) is exasperating the situation. Fifty-three of respondents claim that they are either unsure or do not believe they could pinpoint problems in the event of a loss of service. As a result, 38 percent of respondents (100-62 percent) say there is a lot of finger pointing and “war room” scenarios between teams when an interruption occurs.
Figure 3. The impact of an interruption or loss of service to IT systems Unsure, Disagree and Strongly disagree responses combined
The challenges and risks described in this research result in inefficient response to system outages and interruptions. According to 67 percent of respondents, their organizations lack a consistent and formal IT outage response process. On average, as shown in Table 1, it takes 44 hours and 12.5 staff members to restore the IT system to operational status following a system outage and interruption.
Table 1. Average time to restore operations Calculus
Extrapolated hours spent by IT and IT security personnel 44
Average number of personnel involved in the restoration of operations 12.5
Average number of staff hours 550
53%
62%
70%
76%
0% 10% 20% 30% 40% 50% 60% 70% 80%
We do not have the ability to pinpoint problems because our systems are managed in silos
There is a lot of finger pointing and "war room" scenarios between teams
We have the ability to determine the root cause of the problem quickly (within minutes)
We have end-to-end visibility across IT systems and can foresee issues before they impact us

Ponemon Institute© Research Report Page 6
This firefighting mode has consequences, as shown in Figure 4. These include preventing staff from performing critical tasks (71 percent of respondents) and having IT staff called away from more strategic initiatives (66 percent of respondents).
Figure 4. What are the consequences of system outages and interruptions? More than one response allowed
13%
41%
49%
66%
71%
0% 10% 20% 30% 40% 50% 60% 70% 80%
Other
Reputational damage to organization via negative press and social media
Citizen facing or mission critical services unable to operate
IT staff called away from more strategic activities
Employees unable to perform critical tasks

Ponemon Institute© Research Report Page 7
Lack of visibility and expertise are risks to managing IT operations or application development. Figure 5 presents various risks to the organization. Seventy-three percent of respondents say risks are due to the lack of real-time end-to-end visibility into systems and operations; 71 percent say risks stem from a lack of skills and expertise, and in a similar vein, 70 percent of respondents said risks stem from not having the budget and.
Other top risks identified by respondents are the lack of coordination and collaboration between IT personnel in different departments (68 percent of respondents), and a lack of a consistent and formal IT outage response process (67 percent of respondents).
Figure 5. The biggest risks in managing IT operations or application development More than one response allowed
6%
28%
40%
45%
51%
61%
61%
65%
67%
68%
70%
71%
73%
0% 10% 20% 30% 40% 50% 60% 70% 80%
Other
Contractual limitations/constraints
Negligent or malicious insiders/employees/contractors
Influx of new technologies and devices (IoT, mobile)
Migration to cloud
Lack of integration between IT systems and application
Sophistication and increase in cyber attacks
Continued maintenance of legacy systems
Lack of a consistent and formal IT outage response process
Lack of coordination and collaboration between IT personnel in different departments
Insufficient IT resources (budget/personnel)
Lack of skills and expertise
Lack of real-time end-to-end visibility into systems and operations across the organization

Ponemon Institute© Research Report Page 8
Enterprise visibility is the number one solution for a stronger and better managed IT operation. Respondents were asked to choose the number one thing that could be done to achieve stronger and more effective IT operations. As Figure 6 shows, 29 percent of respondents say it is better visibility across the entire organization and 25 percent of respondents say it is machine learning capabilities.
Figure 6. What is the most effective way to strengthen IT operations? One choice allowed
7%
13%
24%
25%
29%
0% 5% 10% 15% 20% 25% 30% 35%
Better employee training to improve IT management/deployment
Better automation of IT management/maintenance
Better enforcement of current policies and regulations
Machine learning capabilities
Better network visibility across entire organization

Ponemon Institute© Research Report Page 9
Trends & solutions in IT operations management Organizations are looking to data and event monitoring tools to help them solve issues, but progress is slow. The greatest challenge, according to participants in this research, is the inability to integrate IT systems and technologies because of silos. To address this challenge, 47 percent of respondents say their organizations have siloed monitoring solutions across their IT infrastructure to provide alerts and notify them of potential issues, as shown in Figure 7.
However, the quality of information to diagnose and respond to issues is less than optimal: 54 percent of respondents say their organizations are inundated with too many alerts. Another 55 percent of respondents say despite having an event management solution there are too many false positives. Only 22 percent of respondents say their analytic tools provide end-to-end visibility to quickly pinpoint issues and determine the root cause.
Figure 7. The state of monitoring solutions Please change second bar to 55% Strongly agree and Agree responses combined
22%
45%
47%
54%
55%
0% 10% 20% 30% 40% 50% 60%
Our analytic tools give us end-to-end monitoring and visibility to quickly pinpoint issues and
determine root causes
We rely on event management solutions to aggregate alerts across our systems
We have siloed monitoring solutions across our IT infrastructure to provide alerts and notify us of
potential issues
We aggregate our events but are still inundated with too many alerts
We have an event management solution but often experience too many false positives

Ponemon Institute© Research Report Page 10
It is clear that data is not optimally harnessed. According to Figure 8, while 74 percent of respondents say there is a reluctance or lack of collaboration to share data among various teams, 69 percent of respondents stated that they do not have enough context or fidelity to understand the full picture. Another 61 percent of respondents say they are not sure what data is relevant for problems that arise.
Figure 8. Problems when using data to diagnose IT issues and determine root cause More than one response allowed
43%
49%
55%
55%
61%
69%
74%
0% 10% 20% 30% 40% 50% 60% 70% 80%
Mostly analysis of historical data and so difficult to troubleshoot in real-time
No capability to ingest real-time data
Data ingestion and normalization is cumbersome and tedious
Data is in different formats and types (difficult to normalize)
Not sure what data is relevant for problems that arise
Not enough context or fidelity to understand the full picture
Reluctance or lack of collaboration and data sharing among various teams
Ponemon Institute© Research Report Page 11
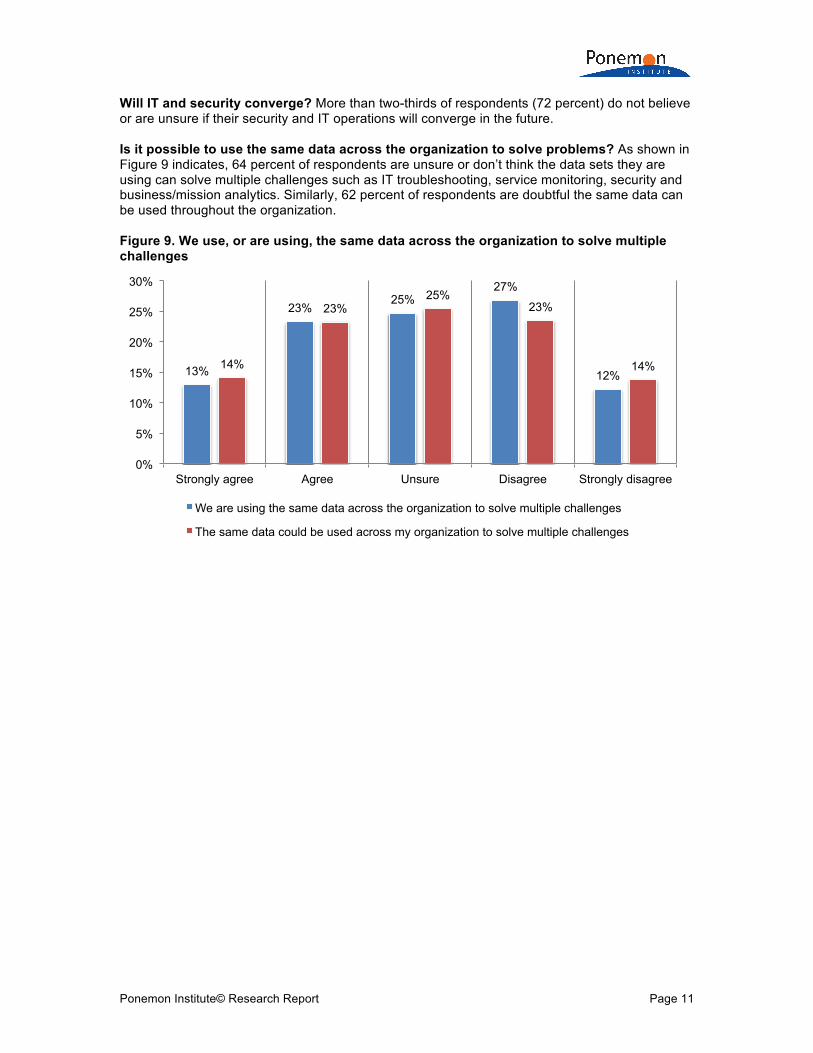
Will IT and security converge? More than two-thirds of respondents (72 percent) do not believe or are unsure if their security and IT operations will converge in the future. Is it possible to use the same data across the organization to solve problems? As shown in Figure 9 indicates, 64 percent of respondents are unsure or don’t think the data sets they are using can solve multiple challenges such as IT troubleshooting, service monitoring, security and business/mission analytics. Similarly, 62 percent of respondents are doubtful the same data can be used throughout the organization. Figure 9. We use, or are using, the same data across the organization to solve multiple challenges
13%
23% 25%
27%
12% 14%
23% 25%
23%
14%
0%
5%
10%
15%
20%
25%
30%
Strongly agree Agree Unsure Disagree Strongly disagree
We are using the same data across the organization to solve multiple challenges
The same data could be used across my organization to solve multiple challenges
Ponemon Institute© Research Report Page 12
The impact of new technologies and paradigms on IT operations Adoption of DevOps methodologies and approaches grows. With new technologies and paradigms making their way into organizations, the survey addressed respondents’ sentiments about these changes and their impact on IT operations.
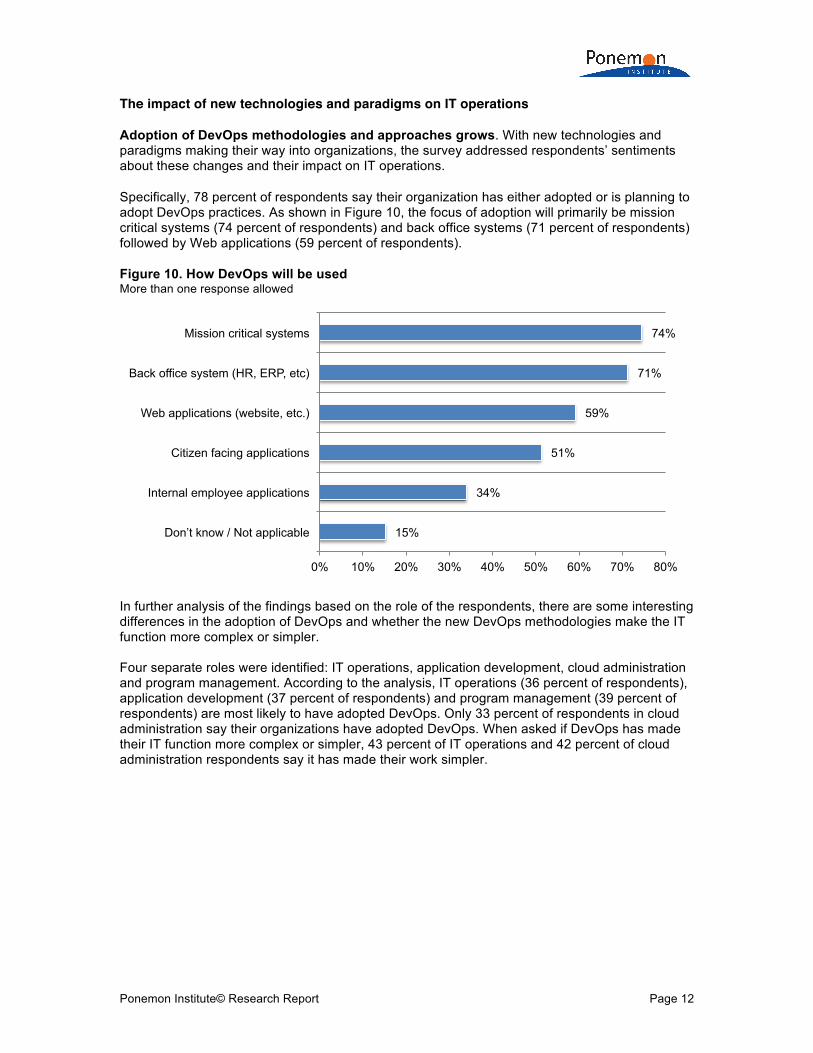
Specifically, 78 percent of respondents say their organization has either adopted or is planning to adopt DevOps practices. As shown in Figure 10, the focus of adoption will primarily be mission critical systems (74 percent of respondents) and back office systems (71 percent of respondents) followed by Web applications (59 percent of respondents).
Figure 10. How DevOps will be used More than one response allowed
In further analysis of the findings based on the role of the respondents, there are some interesting differences in the adoption of DevOps and whether the new DevOps methodologies make the IT function more complex or simpler. Four separate roles were identified: IT operations, application development, cloud administration and program management. According to the analysis, IT operations (36 percent of respondents), application development (37 percent of respondents) and program management (39 percent of respondents) are most likely to have adopted DevOps. Only 33 percent of respondents in cloud administration say their organizations have adopted DevOps. When asked if DevOps has made their IT function more complex or simpler, 43 percent of IT operations and 42 percent of cloud administration respondents say it has made their work simpler.
15%
34%
51%
59%
71%
74%
0% 10% 20% 30% 40% 50% 60% 70% 80%
Don’t know / Not applicable
Internal employee applications
Citizen facing applications
Web applications (website, etc.)
Back office system (HR, ERP, etc)
Mission critical systems
Ponemon Institute© Research Report Page 13
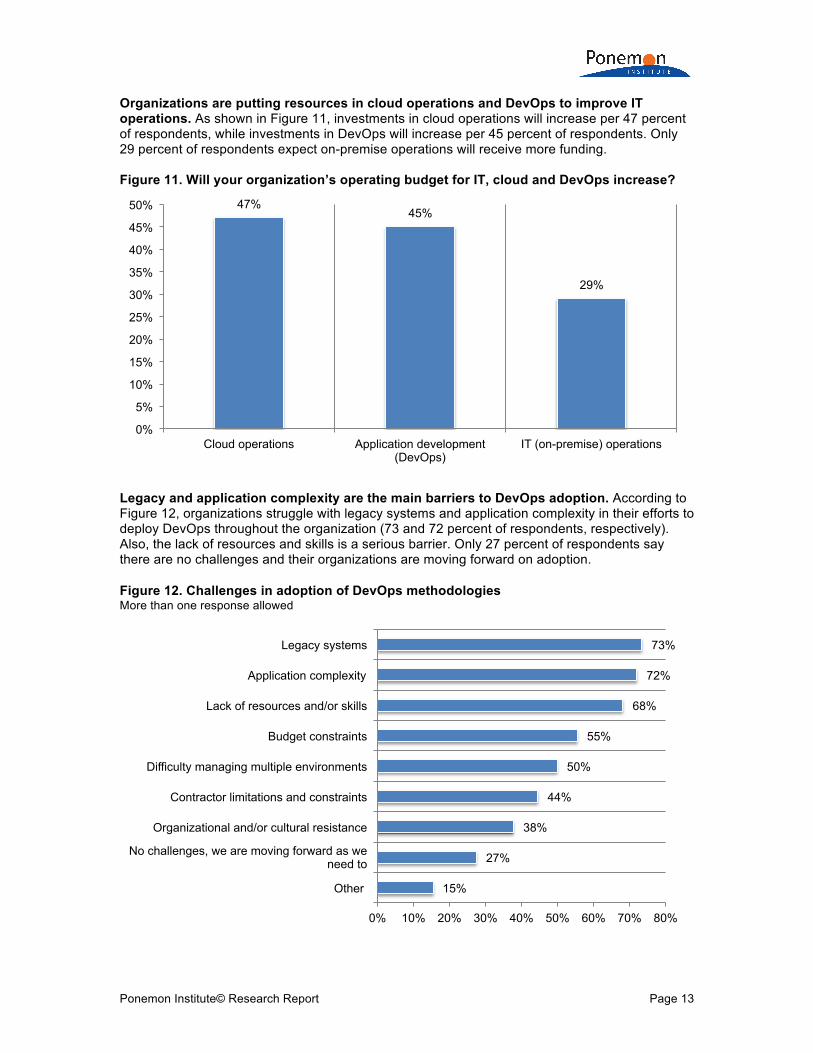
Organizations are putting resources in cloud operations and DevOps to improve IT operations. As shown in Figure 11, investments in cloud operations will increase per 47 percent of respondents, while investments in DevOps will increase per 45 percent of respondents. Only 29 percent of respondents expect on-premise operations will receive more funding. Figure 11. Will your organization’s operating budget for IT, cloud and DevOps increase?
Legacy and application complexity are the main barriers to DevOps adoption. According to Figure 12, organizations struggle with legacy systems and application complexity in their efforts to deploy DevOps throughout the organization (73 and 72 percent of respondents, respectively). Also, the lack of resources and skills is a serious barrier. Only 27 percent of respondents say there are no challenges and their organizations are moving forward on adoption.
Figure 12. Challenges in adoption of DevOps methodologies More than one response allowed
47% 45%
29%
0%
5%
10%
15%
20%
25%
30%
35%
40%
45%
50%
Cloud operations Application development (DevOps)
IT (on-premise) operations
15%
27%
38%
44%
50%
55%
68%
72%
73%
0% 10% 20% 30% 40% 50% 60% 70% 80%
Other
No challenges, we are moving forward as we need to
Organizational and/or cultural resistance
Contractor limitations and constraints
Difficulty managing multiple environments
Budget constraints
Lack of resources and/or skills
Application complexity
Legacy systems
Ponemon Institute© Research Report Page 14
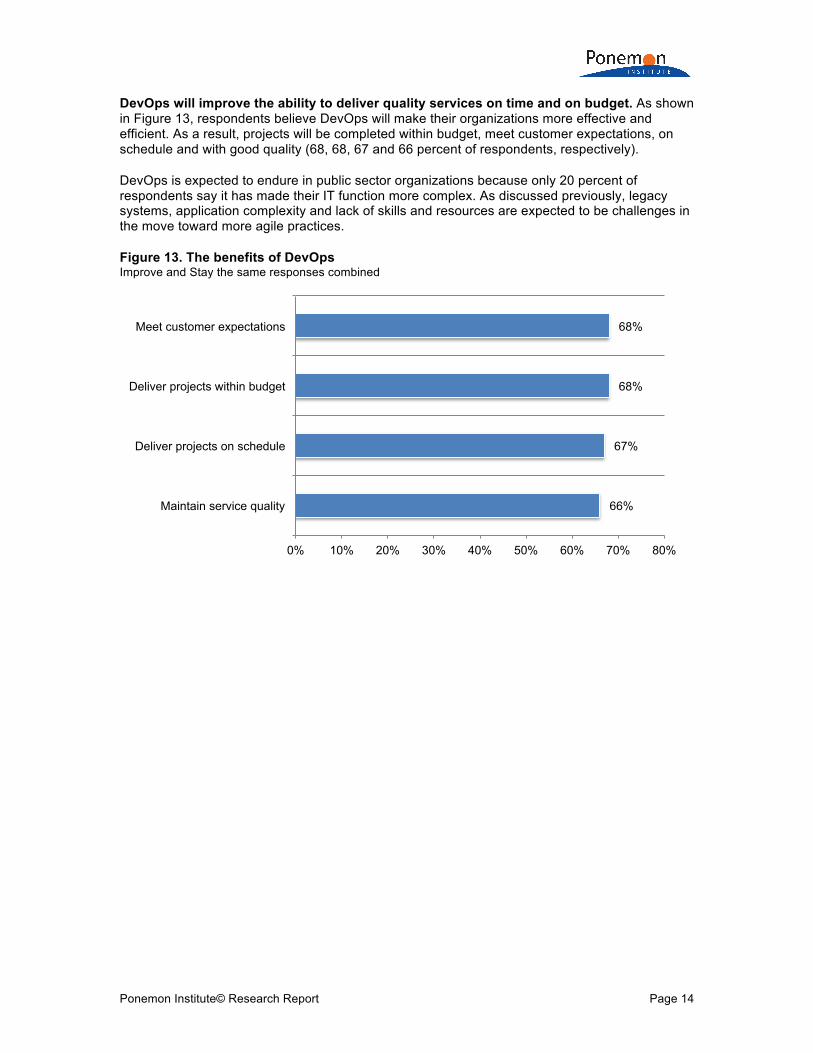
DevOps will improve the ability to deliver quality services on time and on budget. As shown in Figure 13, respondents believe DevOps will make their organizations more effective and efficient. As a result, projects will be completed within budget, meet customer expectations, on schedule and with good quality (68, 68, 67 and 66 percent of respondents, respectively).
DevOps is expected to endure in public sector organizations because only 20 percent of respondents say it has made their IT function more complex. As discussed previously, legacy systems, application complexity and lack of skills and resources are expected to be challenges in the move toward more agile practices.
Figure 13. The benefits of DevOps Improve and Stay the same responses combined
66%
67%
68%
68%
0% 10% 20% 30% 40% 50% 60% 70% 80%
Maintain service quality
Deliver projects on schedule
Deliver projects within budget
Meet customer expectations

Ponemon Institute© Research Report Page 15
In contrast to DevOps, new IT technology paradigms, such as the cloud, makes IT operations more complex. The first cloud initiatives started at the turn of the decade in government agencies and organizations are well in the throes of this transformation. This move could be attributed to the shift in IT and the challenges faced by organizations.
In fact, 45 percent of respondents claim that the move to cloud has made their IT function more complex. As shown in Figure 14, the top concerns with organizations’ migration to cloud platforms/solutions are: application performance and availability (76 percent of respondents), inability to monitor and troubleshoot applications (72 percent of respondents) and lack of visibility across workloads (67 percent of respondents).
Figure 14. The biggest concerns with cloud migration More than one response allowed
16%
36%
39%
39%
46%
49%
59%
64%
67%
72%
76%
0% 10% 20% 30% 40% 50% 60% 70% 80%
Other
Cloud vendors’ inability to provide SLA monitoring in near real-time
Limited customization to suit our needs
Contract limitations
Data security/privacy
Compliance/regulations
Inability to correlate data and events across on-premises and cloud
Cost
Lack of visibility across workloads
Inability to monitor and troubleshoot applications
Application performance and availability

Ponemon Institute© Research Report Page 16
Part 3. Methods & Limitations A sampling frame of 32,001 experienced IT professionals located in the United States was selected as participants for this survey. From this sampling frame, we captured 1,394 returns of which 167 were rejected for reliability issues. Our final sample consisted of 1,227 knowledgeable decision makers and operations staff from federal, state and local governments, higher education, and federal system integrators (including aerospace and defense contractors). This resulted in an overall response rate of 3.8 percent response, as shown in Table 2. Table 2. Sample response Freq Pct% Total sampling frame 32,001 100% Total returns 1,394 4.4% Rejected or screened surveys 167 0.5% Final sample 1,227 3.8%
Pie Chart 1 summarizes how familiar respondents in our study are with the state of IT operations within their organization. As can be seen, 29 percent of respondents are very familiar, 55 percent are familiar and 17 percent are somewhat familiar with the state of their organization’s IT operations. Pie Chart 1. Familiarity with the state of IT operations within the organization
As shown in Pie Chart 2, more than half (59 percent) of respondents are from organizations with a full-time headcount of more than 5,000 employees. Pie Chart 2. Full-time headcount of the organization
29%
55%
17%
Very familiar
Familiar
Somewhat familiar
7%
16%
17%
17%
19%
23% 100 to 500
501 to 1,000
1,001 to 5,000
5,001 to 10,000
10,001 to 25,000
More thn 25,000

Ponemon Institute© Research Report Page 17
Pie Chart 3 reveals that 36 percent of respondents have the job title of director or manager of IT or cloud ops, 32 percent of respondents are staff or specialists, 19 percent are VPs of IT or cloud ops and 14 percent are CIOs or CTOs. Pie Chart 3. Primary job title within the organization
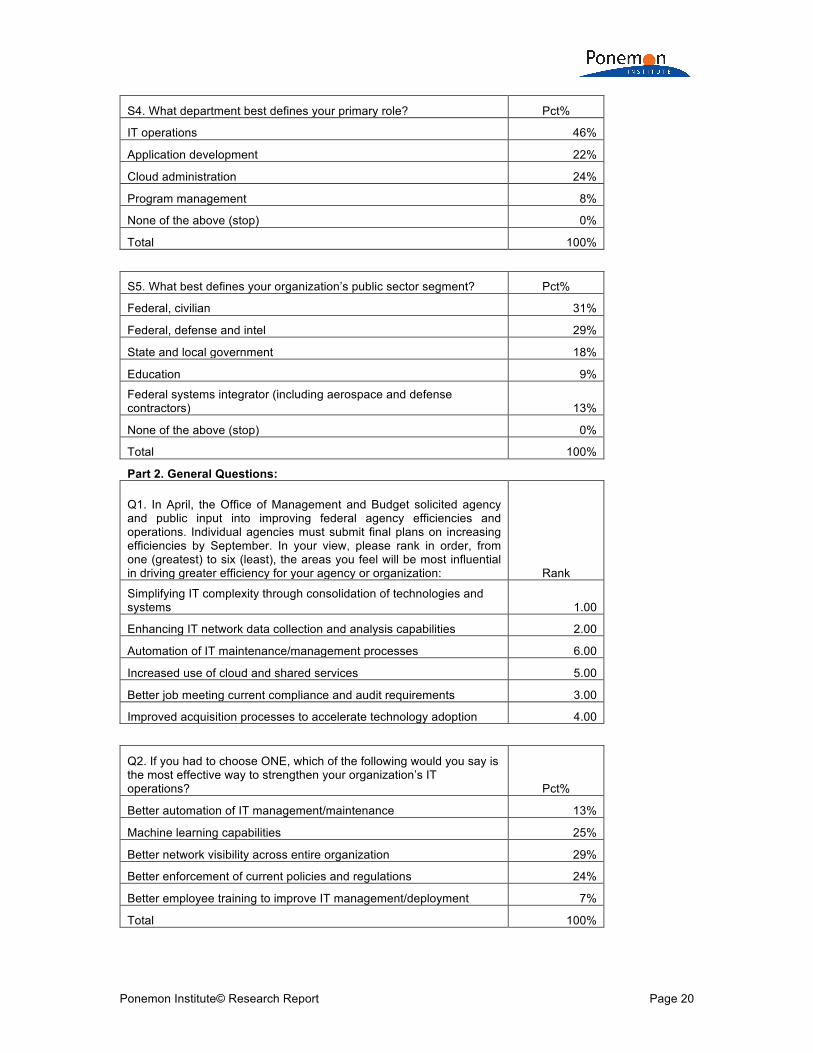
As Pie Chart 4 indicates, almost half of respondents (46 percent) reported their primary role as within IT operations. This is followed by cloud administration (24 percent of respondents), application development (22 percent of respondents) and program management (8 percent of respondents). Pie Chart 4. Primary role within the organization
36%
32%
19%
14%
Director or manager of IT or cloud ops
Staff or specialists
VP of IT or cloud ops
CIO / CTO
46%
24%
22%
8%
IT operations
Cloud administration
Application development
Program management

Ponemon Institute© Research Report Page 18
Pie Chart 5 reports the public sector segment of respondents’ organizations. This chart identifies federal, civilian (31 percent) as the largest segment, followed by federal, defense and intel (29 percent) and state and local government (18 percent). Pie Chart 5. Public sector segment
Part 4. Caveats to This Study There are inherent limitations to survey research that need to be carefully considered before drawing inferences from findings. The following items are specific limitations that are germane to most Web-based surveys. ! Non-response bias: The current findings are based on a sample of survey returns. We sent
surveys to a representative sample of individuals, resulting in a large number of usable returned responses. Despite non-response tests, it is always possible that individuals who did not participate are substantially different in terms of underlying beliefs from those who completed the instrument.
! Sampling-frame bias: The accuracy is based on contact information and the degree to which
the list is representative of individuals who are IT professionals within their organization. We also acknowledge that the results may be biased by external events such as media coverage. Finally, because we used a Web-based collection method, it is possible that non-Web responses by mailed survey or telephone call would result in a different pattern of findings.
! Self-reported results: The quality of survey research is based on the integrity of confidential
responses received from subjects. While certain checks and balances can be incorporated into the survey process, there is always the possibility that a subject did not provide a truthful response.
31%
29%
18%
13%
9%
Federal, civilian
Federal, defense and intel
State and local government
Federal systems integrator (including aerospace and defense contractors) Education

Ponemon Institute© Research Report Page 19
Appendix: Detailed Survey Results
The following tables provide the frequency or percentage frequency of responses to all survey questions contained in this study. All survey responses were captured from April 17 to May 22, 2017.
Survey response Freq Pct%
Total sampling frame 32,001 100.0%
Rejected surveys 167 0.5%
Final sample 1,227 3.8%
Part 1. Screening S1. How familiar are you with the state of IT operations within your
organization? Pct%
Very familiar 29%
Familiar 55%
Somewhat familiar 17%
Not familiar (stop) 0%
Total 100%
S2. What is the full-time headcount of your organization? Pct%
Less than 100 (stop) 0%
100 to 500 7%
501 to 1,000 16%
1,001 to 5,000 17%
5,001 to 10,000 17%
10,001 to 25,000 19%
More than 25,000 23%
Total 100%
S3. What best defines your job title? Pct%
CIO / CTO 14%
VP of IT or cloud ops 19%
Director or manager of IT or cloud ops 36%
Staff or specialists 32%
Total 100%
Ponemon Institute© Research Report Page 20
S4. What department best defines your primary role? Pct%
IT operations 46%
Application development 22%
Cloud administration 24%
Program management 8%
None of the above (stop) 0%
Total 100%
S5. What best defines your organization’s public sector segment? Pct%
Federal, civilian 31%
Federal, defense and intel 29%
State and local government 18%
Education 9%
Federal systems integrator (including aerospace and defense contractors) 13%
None of the above (stop) 0%
Total 100%
Part 2. General Questions:
Q1. In April, the Office of Management and Budget solicited agency and public input into improving federal agency efficiencies and operations. Individual agencies must submit final plans on increasing efficiencies by September. In your view, please rank in order, from one (greatest) to six (least), the areas you feel will be most influential in driving greater efficiency for your agency or organization: Rank
Simplifying IT complexity through consolidation of technologies and systems 1.00
Enhancing IT network data collection and analysis capabilities 2.00
Automation of IT maintenance/management processes 6.00
Increased use of cloud and shared services 5.00
Better job meeting current compliance and audit requirements 3.00
Improved acquisition processes to accelerate technology adoption 4.00
Q2. If you had to choose ONE, which of the following would you say is the most effective way to strengthen your organization’s IT operations? Pct%
Better automation of IT management/maintenance 13%
Machine learning capabilities 25%
Better network visibility across entire organization 29%
Better enforcement of current policies and regulations 24%
Better employee training to improve IT management/deployment 7%
Total 100%

Ponemon Institute© Research Report Page 21
Q3. How has your confidence changed in the following areas of IT Operations over the last 12 months?
Q3a. Handling the scale and complexity of IT operations you are managing Pct%
Significantly better 15%
Somewhat better 25%
About the same 25%
Somewhat worse 26%
Significantly worse 9%
Total 100%
Q3b. Skills Gap – people have the right skills to “get the job done” Pct%
Significantly better 12%
Somewhat better 25%
About the same 27%
Somewhat worse 27%
Significantly worse 8%
Total 100%
Q3c. Ability to ensure performance and availability of systems to meet SLAs consistently Pct%
Significantly better 14%
Somewhat better 26%
About the same 27%
Somewhat worse 23%
Significantly worse 10%
Total 100%
Q3d. Ability to quickly pinpoint root-cause and source of failure Pct%
Significantly better 14%
Somewhat better 27%
About the same 27%
Somewhat worse 23%
Significantly worse 8%
Total 100%
Ponemon Institute© Research Report Page 22
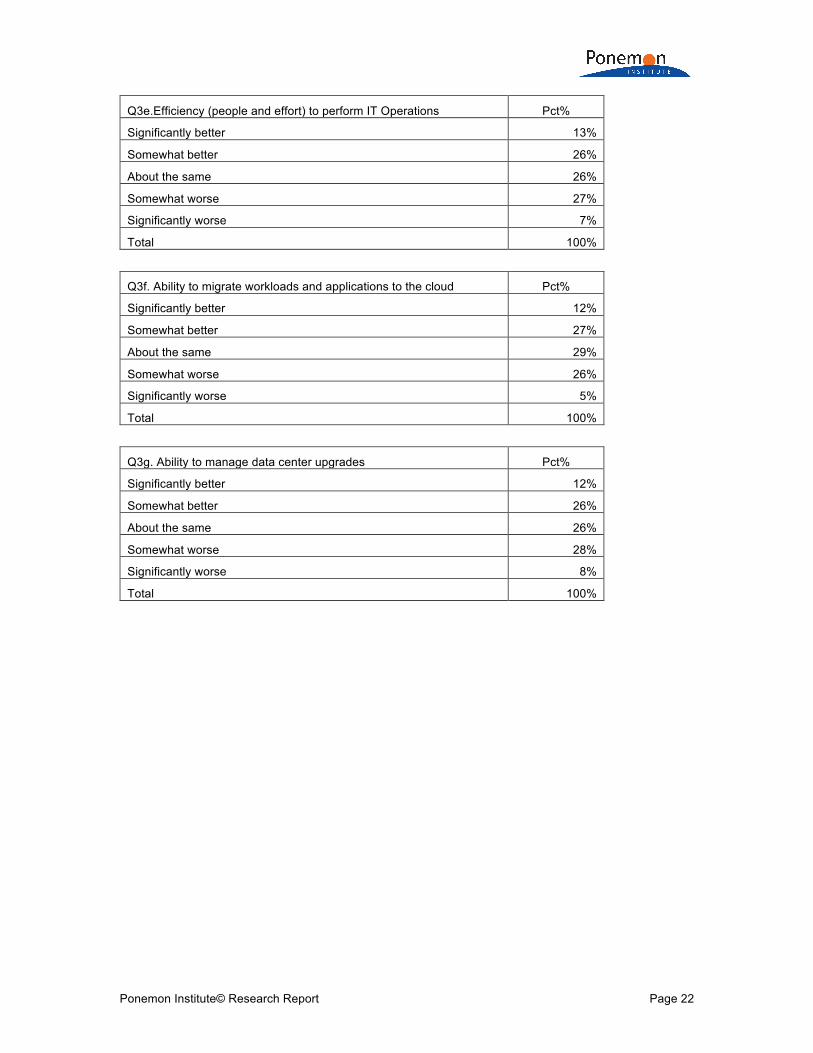
Q3e.Efficiency (people and effort) to perform IT Operations Pct%
Significantly better 13%
Somewhat better 26%
About the same 26%
Somewhat worse 27%
Significantly worse 7%
Total 100%
Q3f. Ability to migrate workloads and applications to the cloud Pct%
Significantly better 12%
Somewhat better 27%
About the same 29%
Somewhat worse 26%
Significantly worse 5%
Total 100%
Q3g. Ability to manage data center upgrades Pct%
Significantly better 12%
Somewhat better 26%
About the same 26%
Somewhat worse 28%
Significantly worse 8%
Total 100%
Ponemon Institute© Research Report Page 23
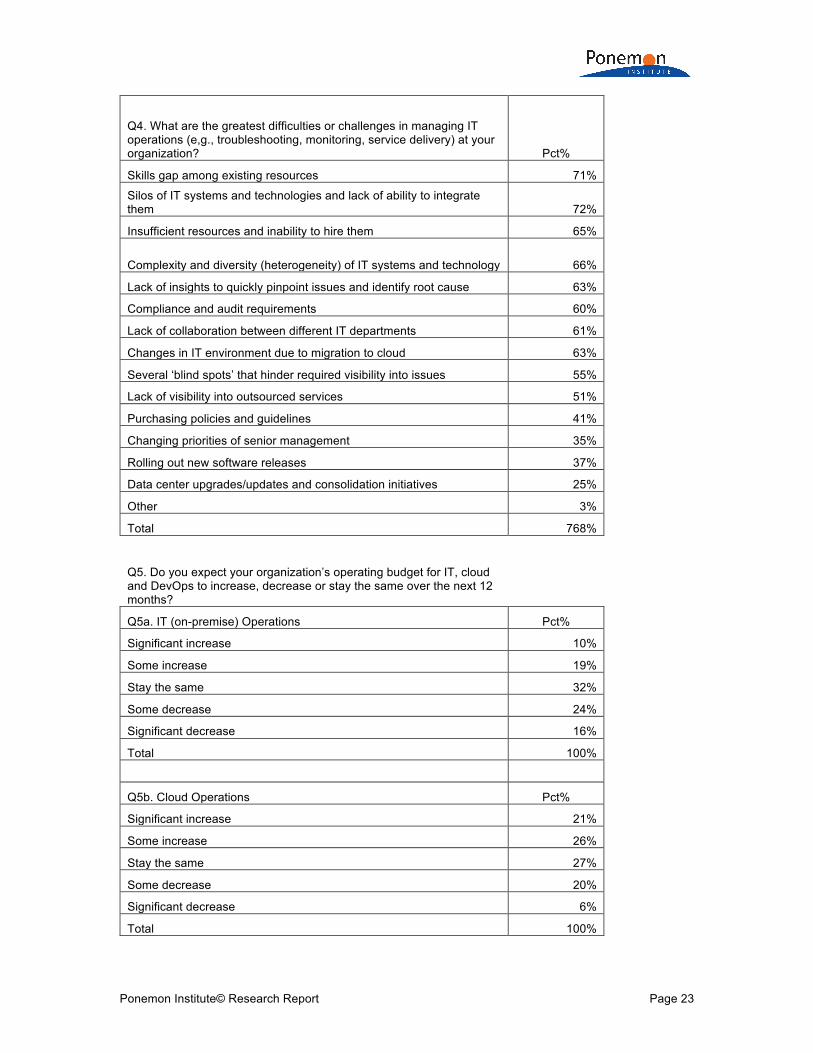
Q4. What are the greatest difficulties or challenges in managing IT operations (e,g., troubleshooting, monitoring, service delivery) at your organization? Pct%
Skills gap among existing resources 71%
Silos of IT systems and technologies and lack of ability to integrate them 72%
Insufficient resources and inability to hire them 65%
Complexity and diversity (heterogeneity) of IT systems and technology 66%
Lack of insights to quickly pinpoint issues and identify root cause 63%
Compliance and audit requirements 60%
Lack of collaboration between different IT departments 61%
Changes in IT environment due to migration to cloud 63%
Several ‘blind spots’ that hinder required visibility into issues 55%
Lack of visibility into outsourced services 51%
Purchasing policies and guidelines 41%
Changing priorities of senior management 35%
Rolling out new software releases 37%
Data center upgrades/updates and consolidation initiatives 25%
Other 3%
Total 768%
Q5. Do you expect your organization’s operating budget for IT, cloud and DevOps to increase, decrease or stay the same over the next 12 months?
Q5a. IT (on-premise) Operations Pct%
Significant increase 10%
Some increase 19%
Stay the same 32%
Some decrease 24%
Significant decrease 16%
Total 100%
Q5b. Cloud Operations Pct%
Significant increase 21%
Some increase 26%
Stay the same 27%
Some decrease 20%
Significant decrease 6%
Total 100%
Ponemon Institute© Research Report Page 24
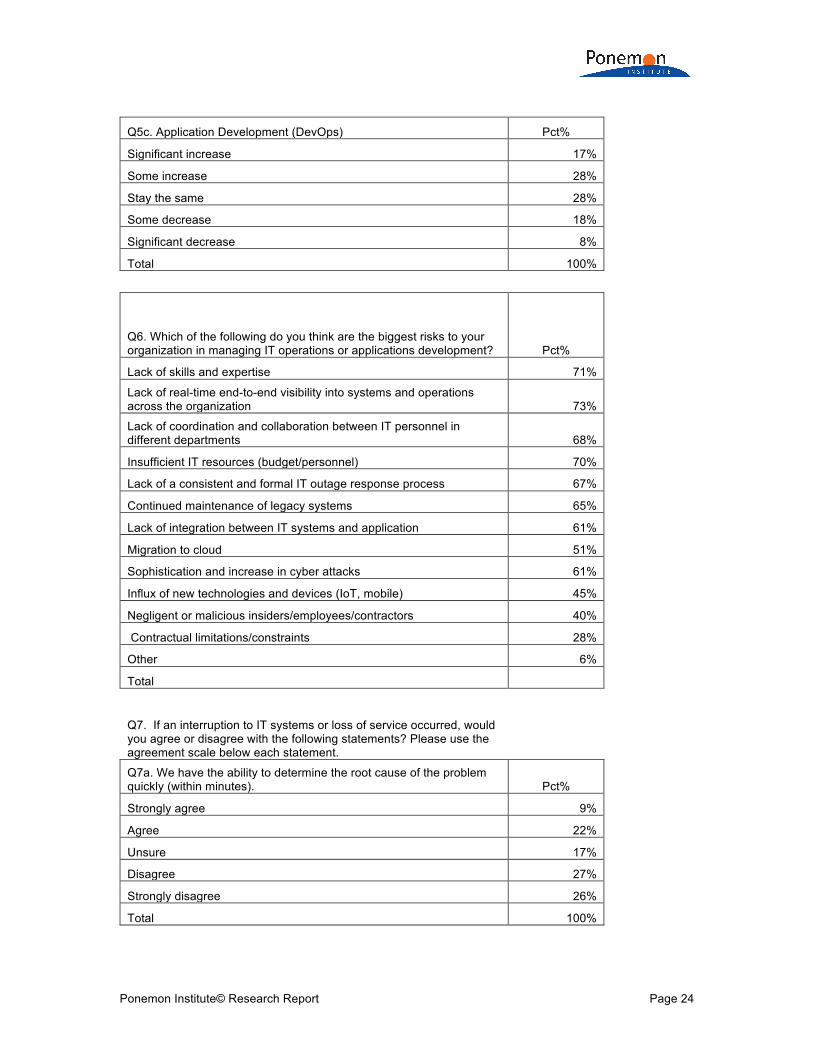
Q5c. Application Development (DevOps) Pct%
Significant increase 17%
Some increase 28%
Stay the same 28%
Some decrease 18%
Significant decrease 8%
Total 100%
Q6. Which of the following do you think are the biggest risks to your organization in managing IT operations or applications development? Pct%
Lack of skills and expertise 71%
Lack of real-time end-to-end visibility into systems and operations across the organization 73%
Lack of coordination and collaboration between IT personnel in different departments 68%
Insufficient IT resources (budget/personnel) 70%
Lack of a consistent and formal IT outage response process 67%
Continued maintenance of legacy systems 65%
Lack of integration between IT systems and application 61%
Migration to cloud 51%
Sophistication and increase in cyber attacks 61%
Influx of new technologies and devices (IoT, mobile) 45%
Negligent or malicious insiders/employees/contractors 40%
Contractual limitations/constraints 28%
Other 6%
Total
Q7. If an interruption to IT systems or loss of service occurred, would you agree or disagree with the following statements? Please use the agreement scale below each statement.
Q7a. We have the ability to determine the root cause of the problem quickly (within minutes). Pct%
Strongly agree 9%
Agree 22%
Unsure 17%
Disagree 27%
Strongly disagree 26%
Total 100%

Ponemon Institute© Research Report Page 25
Q7b. We have end-to-end visibility across IT systems and can foresee issues before they impact us. Pct%
Strongly agree 9%
Agree 17%
Unsure 18%
Disagree 31%
Strongly disagree 26%
Total 100%
Q7c. We have documented processes and procedures to follow. Pct%
Strongly agree 13%
Agree 36%
Unsure 28%
Disagree 14%
Strongly disagree 9%
Total 100%
Q7d. We do not have the ability to pinpoint problems because our systems are managed in silos. Pct%
Strongly agree 21%
Agree 26%
Unsure 28%
Disagree 15%
Strongly disagree 10%
Total 100%
Q7e. We gather information from various systems manually and try to understand what the issue is. Pct%
Strongly agree 21%
Agree 25%
Unsure 26%
Disagree 16%
Strongly disagree 12%
Total 100%

Ponemon Institute© Research Report Page 26
Q7f. Our troubleshooting is manual and ad-hoc. Pct%
Strongly agree 12%
Agree 24%
Unsure 25%
Disagree 25%
Strongly disagree 14%
Total 100%
Q7g.There is a lot of finger pointing and ‘war room’ scenarios between teams. Pct%
Strongly agree 22%
Agree 26%
Unsure 21%
Disagree 27%
Strongly disagree 4%
Total 100%
Part 3. Questions about DevOps adoption and trends Q8. Is your organization adopting or planning to adopt DevOps
methodologies? Pct%
Yes, we have adopted DevOps 36%
We are planning to adopt DevOps 42% No, we neither have adopted nor plan to adopt DevOps (proceed to
Q.15) 23%
Total 100%
Q9. What type of projects are you planning to develop using a DevOps approach? Please select all that apply. Pct%
Back office system (HR, ERP, etc) 71%
Mission critical systems 74%
Web applications (website, etc.) 59%
Citizen facing applications 51%
Internal employee applications 34%
Don’t know / Not applicable 15%
Total

Ponemon Institute© Research Report Page 27
Q10. Do deployment of new DevOps methodologies make your IT function more complex or simpler? Pct%
It has made my function more complex 20%
It has made my function simpler 41%
Unsure / Don’t know 36%
Not applicable 3%
Total 100%
Q11. Which one of the following statements best defines the use of DevOps methodologies within your organization today? Pct%
We plan to adopt DevOps methodologies once we determine their fit to our mission/business goals 10%
The contractor determines the DevOps methodologies we use 23%
We use DevOps in specific instances or in small proof of concept projects 25%
DevOps is widely adopted across the organization 20%
Other 20%
Don’t know 2%
Total 100%
Q12. What challenges do you face or anticipate in your move to adopt DevOps methodologies? Please select all that apply. Pct%
Legacy systems 73%
Lack of resources and/or skills 68%
Application complexity 72%
Budget constraints 55%
Difficulty managing multiple environments 50%
Contractor limitations and constraints 44%
Organizational and/or cultural resistance 38%
No challenges, we are moving forward as we need to 27%
Other 15%
Total

Ponemon Institute© Research Report Page 28
Q13. Which of the following DevOps technologies is your organization using? Please select all that apply. Pct%
Jenkins 44%
Puppet 45%
Chef 39%
Ant 33%
Maven 30%
ZooKeeper 38%
Clover 33%
Ansile 25%
Docker 23%
Other 8%
Total
Q14. How will implementing DevOps impact your organization’s ability to deliver new quality services on time and on budget change from today?
Q14a. Deliver projects on schedule Pct%
Improve 35%
Stay the same 32%
Worsen 16%
Unsure 17%
Total 100%
Q14b. Deliver projects within budget Pct%
Improve 32%
Stay the same 36%
Worsen 16%
Unsure 16%
Total 100%
Q14c. Maintain service quality Pct%
Improve 22%
Stay the same 44%
Worsen 17%
Unsure 16%
Total 100%

Ponemon Institute© Research Report Page 29
Q14d. Meet customer expectations Pct%
Improve 26%
Stay the same 42%
Worsen 15%
Unsure 17%
Total 100%
Part 4. Questions on Cloud adoption and trends Q15. What type of mission critical applications have you migrated to
the cloud or plan to migrate to the cloud? Pct%
Development environments 75%
Test environments 74%
Back office system (HR, ERP, etc) 67%
E-Mail 72%
Web applications 58%
Citizen facing applications 47%
Internal employee applications 38%
Don’t know / Not applicable 18%
Total
Q16. Do new IT technology paradigms for the Cloud make your IT function more complex or more simple? Pct%
It has made my function more complex 45%
It has made my function simpler 29%
Unsure / Don’t know 15%
Not applicable 11%
Total 100%

Ponemon Institute© Research Report Page 30
Q17. As your organization migrates to cloud platforms/solutions, what are your biggest concerns? Pct%
Application performance and availability 76%
Inability to monitor and troubleshoot applications 72%
Lack of visibility across workloads 67%
Cost 64%
Inability to correlate data and events across on-premises and Cloud 59%
Compliance/regulations 49%
Data security/privacy 46%
Contract Limitations 39%
Cloud vendors’ inability to provide SLA monitoring in near real-time 36%
Limited customization to suit our needs 39%
Other 16%
Total
Monitoring and visibility across silos
Q18. When using data to diagnose IT issues and determine root cause, what problems have you experienced? Please select all that apply. Pct%
Not enough context or fidelity to understand the full picture 69%
Reluctance or Lack of collaboration and data sharing among various teams 74%
Not sure what data is relevant for problems that arise 61%
Data is in different formats and types (difficult to normalize) 55%
No capability to ingest real-time data 49%
Data ingestion and normalization is cumbersome and tedious 55%
Mostly analysis of historical data and so difficult to troubleshoot in real-time 43%
Total
Q19. In consideration of your current monitoring solutions, do you agree or disagree with each one of the following statements? Please use the agreement scale provided below each statement.
Q19a. We have siloed monitoring solutions across our IT infrastructure to provide alerts and notify us of potential issues. Pct%
Strongly agree 24%
Agree 23%
Unsure 31%
Disagree 15%
Strongly disagree 8%
Total 100%

Ponemon Institute© Research Report Page 31
Q19b. We rely on event management solutions to aggregate alerts across our systems. Pct%
Strongly agree 23%
Agree 22%
Unsure 32%
Disagree 16%
Strongly disagree 8%
Total 100%
Q19c. We aggregate our events but are still inundated with too many alerts. Pct%
Strongly agree 22%
Agree 32%
Unsure 22%
Disagree 15%
Strongly disagree 9%
Total 100%
Q19d. We have an event management solution but often experience too many false positives. Pct%
Strongly agree 22%
Agree 33%
Unsure 22%
Disagree 17%
Strongly disagree 7%
Total 100%
Q19e. Our analytic tools give us end-to-end monitoring and visibility to quickly pinpoint issues and determine root causes. Pct%
Strongly agree 7%
Agree 15%
Unsure 33%
Disagree 33%
Strongly disagree 12%
Total 100%

Ponemon Institute© Research Report Page 32
Q20a. How long did it take your staff, on average, to restore the system to operational status following your last three system outages/interruptions? Pct%
Less than 1 hour 5%
1 to 2 hours 9%
2 to 8 hours 15%
1 to 2 days 32%
2 to 5 days 20%
1 to 2 weeks 9%
2 to 4 weeks 6%
More than 1 month 4%
Total 100%
Q20b. How many staff, on an average, were involved in the trouble shooting process? Pct%
Less than 2 7%
2 to 5 17%
6 to 10 23%
11 to 15 20%
16 to 20 12%
21 to 25 11%
More than 25 10%
Total 100%
Q20c. Which of the following have you experienced as a result of system outages/interruptions in the past year? Pct%
Other 13%
Reputational damage to organization via negative press and social media 41%
Citizen facing or mission critical services unable to operate 49%
IT staff called away from more strategic activities 66%
Employees unable to perform critical tasks 71%
Total
Q21a. Do you expect to see security and IT operations converge? Pct%
Yes 28%
No (proceed to Q.22) 56%
Unsure (proceed to Q.22) 16%
Total 100%

Ponemon Institute© Research Report Page 33
Q21b. If yes, what is the timeframe (your best guess is welcome)? Pct%
Security and IT operations have already converged 12%
Less than 1 year 27%
1 to 3 years 29%
3 to 5 years 23%
More than 5 years 8%
Total 100%
Q22. Thinking about the data you have across your organization, please answer the following:
Q22a. I believe the same data can be used across my organization to solve multiple challenges – such as IT troubleshooting, service monitoring, security, business/mission analytics Pct%
Strongly agree 14%
Agree 23%
Unsure 25%
Disagree 23%
Strongly disagree 14%
Total 100%
Q22b. Today, we are already using the same data across the organization to solve multiple challenges such as IT troubleshooting, service monitoring, security, business/mission analytics Pct%
Strongly agree 13%
Agree 23%
Unsure 25%
Disagree 27%
Strongly disagree 12%
Total 100%

Ponemon Institute© Research Report Page 34
For more information about this study, please contact Ponemon Institute by sending an email to [email protected] or calling us at 1.800.887.3118.
Ponemon Institute
Advancing Responsible Information Management Ponemon Institute is dedicated to independent research and education that advances responsible information and privacy management practices within business and government. Our mission is to conduct high quality, empirical studies on critical issues affecting the management and security of sensitive information about people and organizations. We uphold strict data confidentiality, privacy and ethical research standards. We do not collect any personally identifiable information from individuals (or company identifiable information in our business research). Furthermore, we have strict quality standards to ensure that subjects are not asked extraneous, irrelevant or improper questions.