chalmers university of technology - slu.se
TRANSCRIPT

Annika EnejderAssociate Professor, group leader of Molecular Microscopy Develops microscopy techniques (CARS, SRS, SHG, and Raman)where inherent molecular vibrations are probed to 3D images
Chalmers University of Technology
Juris KiskisPhD student in the Group of Molecular microscopy Juris works on combining non-linear optical microscopy with scanningprobe microscopy to achieve molecular specific nano-scale imaging. Thegoal is to study the formation of beta-amyloid aggregates and the roleof lipids in neurodegenerative disorders without the need for stainingand at spatial resolutions significantly higher than that achieved byoptical microscopy alone.

1

2

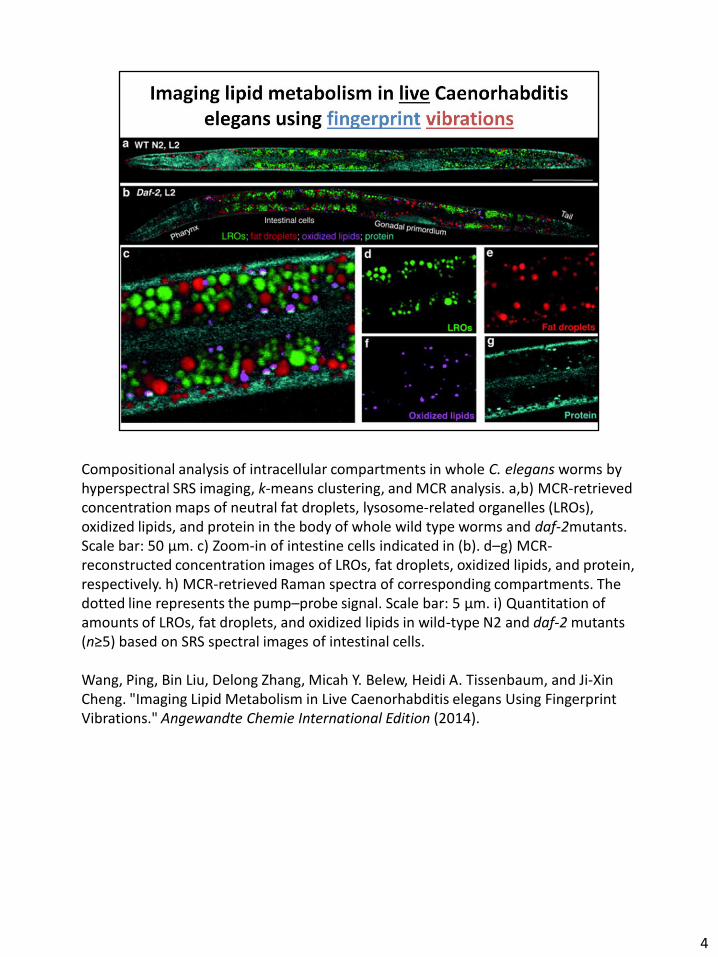
Compositional analysis of intracellular compartments in whole C. elegans worms by hyperspectral SRS imaging, k-means clustering, and MCR analysis. a,b) MCR-retrieved concentration maps of neutral fat droplets, lysosome-related organelles (LROs), oxidized lipids, and protein in the body of whole wild type worms and daf-2mutants. Scale bar: 50 μm. c) Zoom-in of intestine cells indicated in (b). d–g) MCR-reconstructed concentration images of LROs, fat droplets, oxidized lipids, and protein, respectively. h) MCR-retrieved Raman spectra of corresponding compartments. The dotted line represents the pump–probe signal. Scale bar: 5 μm. i) Quantitation of amounts of LROs, fat droplets, and oxidized lipids in wild-type N2 and daf-2 mutants (n≥5) based on SRS spectral images of intestinal cells. Wang, Ping, Bin Liu, Delong Zhang, Micah Y. Belew, Heidi A. Tissenbaum, and Ji-‐Xin Cheng. "Imaging Lipid Metabolism in Live Caenorhabditis elegans Using Fingerprint Vibrations." Angewandte Chemie International Edition (2014).
3
Compositional analysis of intracellular compartments in whole C. elegans worms by hyperspectral SRS imaging, k-means clustering, and MCR analysis. a,b) MCR-retrieved concentration maps of neutral fat droplets, lysosome-related organelles (LROs), oxidized lipids, and protein in the body of whole wild type worms and daf-2mutants. Scale bar: 50 μm. c) Zoom-in of intestine cells indicated in (b). d–g) MCR-reconstructed concentration images of LROs, fat droplets, oxidized lipids, and protein, respectively. h) MCR-retrieved Raman spectra of corresponding compartments. The dotted line represents the pump–probe signal. Scale bar: 5 μm. i) Quantitation of amounts of LROs, fat droplets, and oxidized lipids in wild-type N2 and daf-2 mutants (n≥5) based on SRS spectral images of intestinal cells. Wang, Ping, Bin Liu, Delong Zhang, Micah Y. Belew, Heidi A. Tissenbaum, and Ji-‐Xin Cheng. "Imaging Lipid Metabolism in Live Caenorhabditis elegans Using Fingerprint Vibrations." Angewandte Chemie International Edition (2014).
4

5
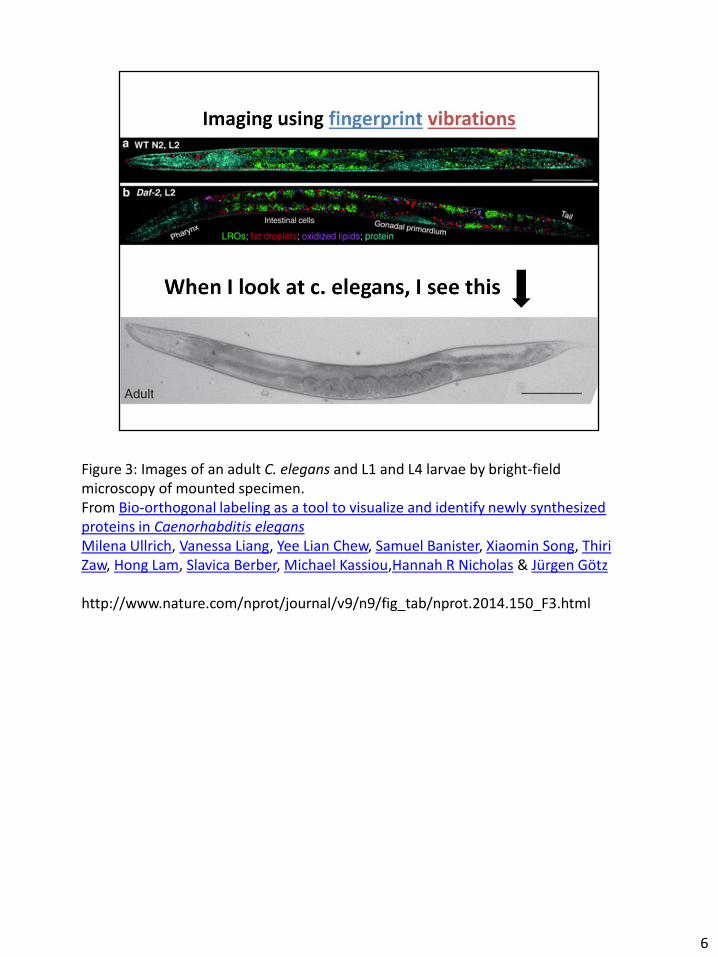
Figure 3: Images of an adult C. elegans and L1 and L4 larvae by bright-field microscopy of mounted specimen. From Bio-orthogonal labeling as a tool to visualize and identify newly synthesized proteins in Caenorhabditis elegans Milena Ullrich, Vanessa Liang, Yee Lian Chew, Samuel Banister, Xiaomin Song, Thiri Zaw, Hong Lam, Slavica Berber, Michael Kassiou,Hannah R Nicholas & Jürgen Götz http://www.nature.com/nprot/journal/v9/n9/fig_tab/nprot.2014.150_F3.html
6

Man with microscope http://www.blatner.com/adam/consctransf/historyofmedicine/1-intro/lecture1.html
7

Leeuwenhoek microscope http://kaushalgrade10optics.wikispaces.com/Light+Microscope+Historical+Application
8

9

http://www.olympusmicro.com/micd/anatomy/micdbrightfield.html
10

Micrograph of a placenta from astillbirth due to maternal malaria. H&E stain. Red blood cells are anuclear; blue/black staining in bright red structures (red blood cells) indicate foreign nuclei from the parasites. http://commons.wikimedia.org/wiki/File:Maternal_malaria_placenta_-_cropped_-_very_high_mag.jpg
11

Micrograph of a placenta from astillbirth due to maternal malaria. H&E stain. Red blood cells are anuclear; blue/black staining in bright red structures (red blood cells) indicate foreign nuclei from the parasites. http://commons.wikimedia.org/wiki/File:Maternal_malaria_placenta_-_cropped_-_very_high_mag.jpg
12

Drosophila embryo immunostained for Tropomyosin, Pax 3/7, and anti-HRP. All nuclei shown in gray (DAPI). Courtesy of Marine Biological Laboratory, Woods Hole, MA https://www.zeiss.com/microscopy/en_de/products/confocal-microscopes/lsm-700-laser-scanning-microscopy.html
13

Drosophila embryo immunostained for Tropomyosin, Pax 3/7, and anti-HRP. All nuclei shown in gray (DAPI). Courtesy of Marine Biological Laboratory, Woods Hole, MA https://www.zeiss.com/microscopy/en_de/products/confocal-microscopes/lsm-700-laser-scanning-microscopy.html
14
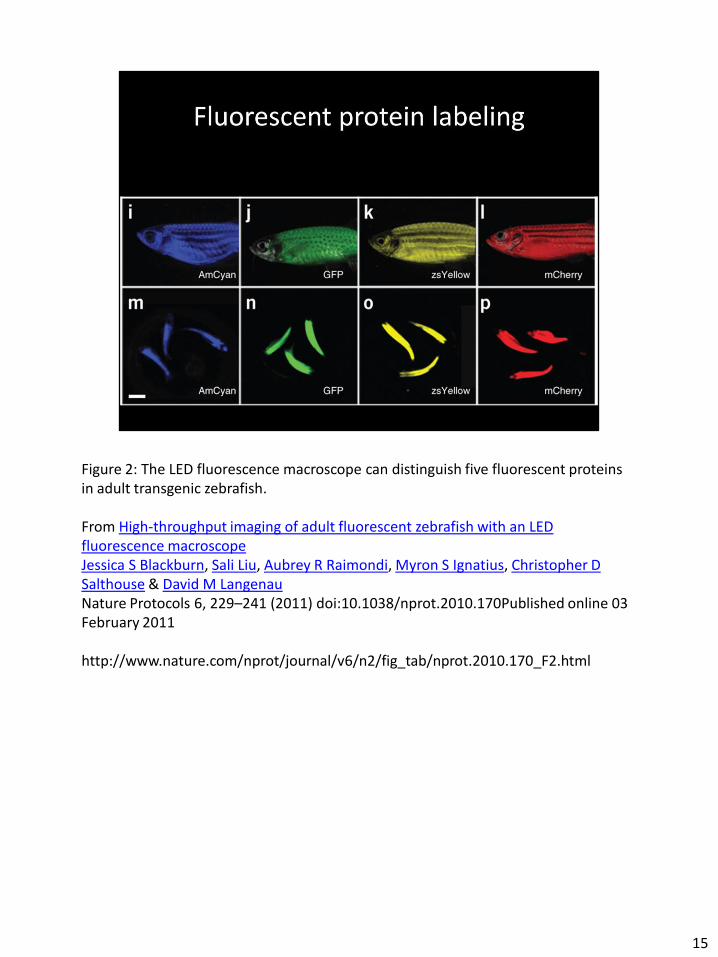
Figure 2: The LED fluorescence macroscope can distinguish five fluorescent proteins in adult transgenic zebrafish. From High-throughput imaging of adult fluorescent zebrafish with an LED fluorescence macroscope Jessica S Blackburn, Sali Liu, Aubrey R Raimondi, Myron S Ignatius, Christopher D Salthouse & David M Langenau Nature Protocols 6, 229–241 (2011) doi:10.1038/nprot.2010.170Published online 03 February 2011 http://www.nature.com/nprot/journal/v6/n2/fig_tab/nprot.2010.170_F2.html
15

Figure 2: The LED fluorescence macroscope can distinguish five fluorescent proteins in adult transgenic zebrafish. From High-throughput imaging of adult fluorescent zebrafish with an LED fluorescence macroscope Jessica S Blackburn, Sali Liu, Aubrey R Raimondi, Myron S Ignatius, Christopher D Salthouse & David M Langenau Nature Protocols 6, 229–241 (2011) doi:10.1038/nprot.2010.170Published online 03 February 2011 http://www.nature.com/nprot/journal/v6/n2/fig_tab/nprot.2010.170_F2.html
16

17

18

19

20

21

https://en.wikipedia.org/wiki/Molecular_vibration
22

https://en.wikipedia.org/wiki/Molecular_vibration
23

24

25

26

27

28

29
30
31

32

33

https://commons.wikimedia.org/wiki/File:Absorption_spectrum_of_liquid_water.png#mediaviewer/File:Absorption_spectrum_of_liquid_water.png
34

https://commons.wikimedia.org/wiki/File:Absorption_spectrum_of_liquid_water.png#mediaviewer/File:Absorption_spectrum_of_liquid_water.png
35

36

37

38

39
40

http://www.analyticalspectroscopy.net/ap4-6.htm
41

42

43

44

45
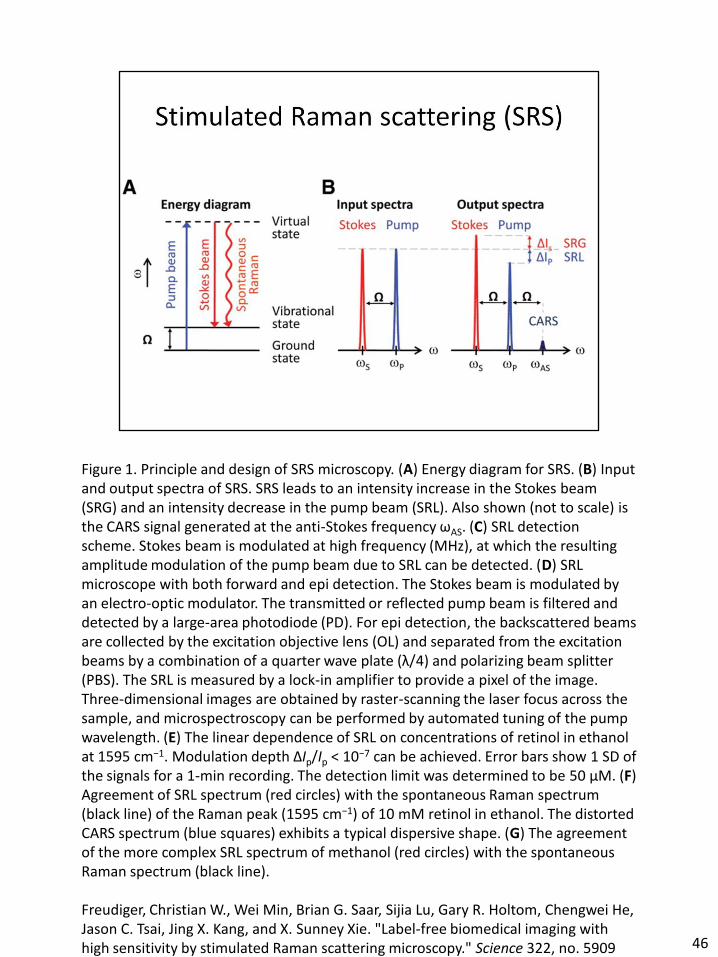
Figure 1. Principle and design of SRS microscopy. (A) Energy diagram for SRS. (B) Input and output spectra of SRS. SRS leads to an intensity increase in the Stokes beam (SRG) and an intensity decrease in the pump beam (SRL). Also shown (not to scale) is the CARS signal generated at the anti-Stokes frequency ωAS. (C) SRL detection scheme. Stokes beam is modulated at high frequency (MHz), at which the resulting amplitude modulation of the pump beam due to SRL can be detected. (D) SRL microscope with both forward and epi detection. The Stokes beam is modulated by an electro-optic modulator. The transmitted or reflected pump beam is filtered and detected by a large-area photodiode (PD). For epi detection, the backscattered beams are collected by the excitation objective lens (OL) and separated from the excitation beams by a combination of a quarter wave plate (λ/4) and polarizing beam splitter (PBS). The SRL is measured by a lock-in amplifier to provide a pixel of the image. Three-dimensional images are obtained by raster-scanning the laser focus across the sample, and microspectroscopy can be performed by automated tuning of the pump wavelength. (E) The linear dependence of SRL on concentrations of retinol in ethanol at 1595 cm−1. Modulation depth ΔIp/Ip < 10−7 can be achieved. Error bars show 1 SD of the signals for a 1-min recording. The detection limit was determined to be 50 µM. (F) Agreement of SRL spectrum (red circles) with the spontaneous Raman spectrum (black line) of the Raman peak (1595 cm−1) of 10 mM retinol in ethanol. The distorted CARS spectrum (blue squares) exhibits a typical dispersive shape. (G) The agreement of the more complex SRL spectrum of methanol (red circles) with the spontaneous Raman spectrum (black line). Freudiger, Christian W., Wei Min, Brian G. Saar, Sijia Lu, Gary R. Holtom, Chengwei He, Jason C. Tsai, Jing X. Kang, and X. Sunney Xie. "Label-free biomedical imaging with high sensitivity by stimulated Raman scattering microscopy." Science 322, no. 5909 (2008): 1857-1861.
46

47

48

49

50
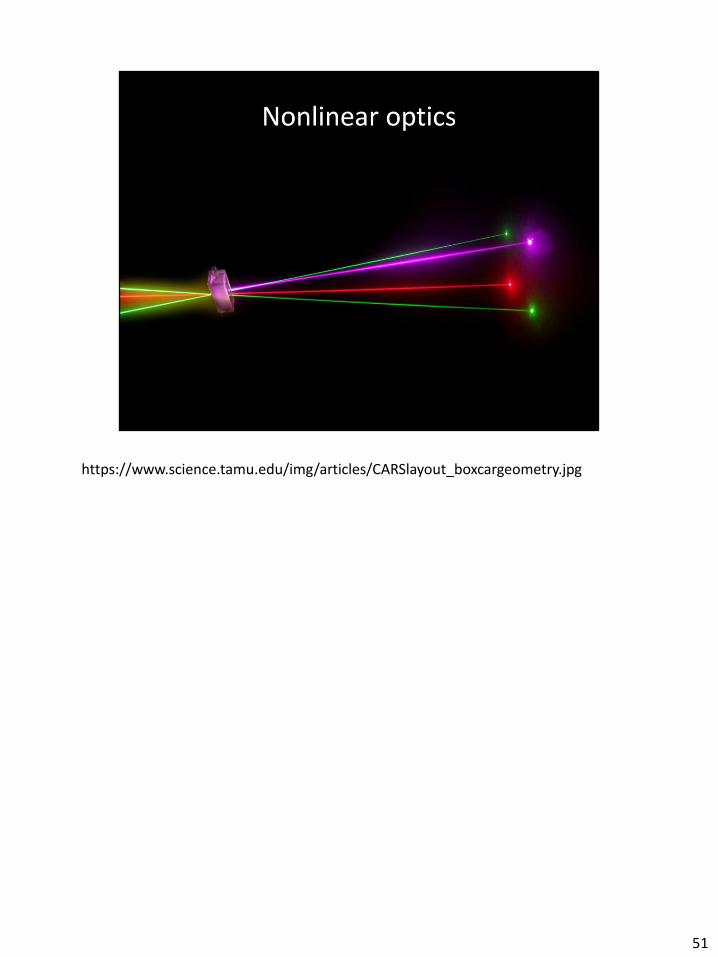
https://www.science.tamu.edu/img/articles/CARSlayout_boxcargeometry.jpg
51
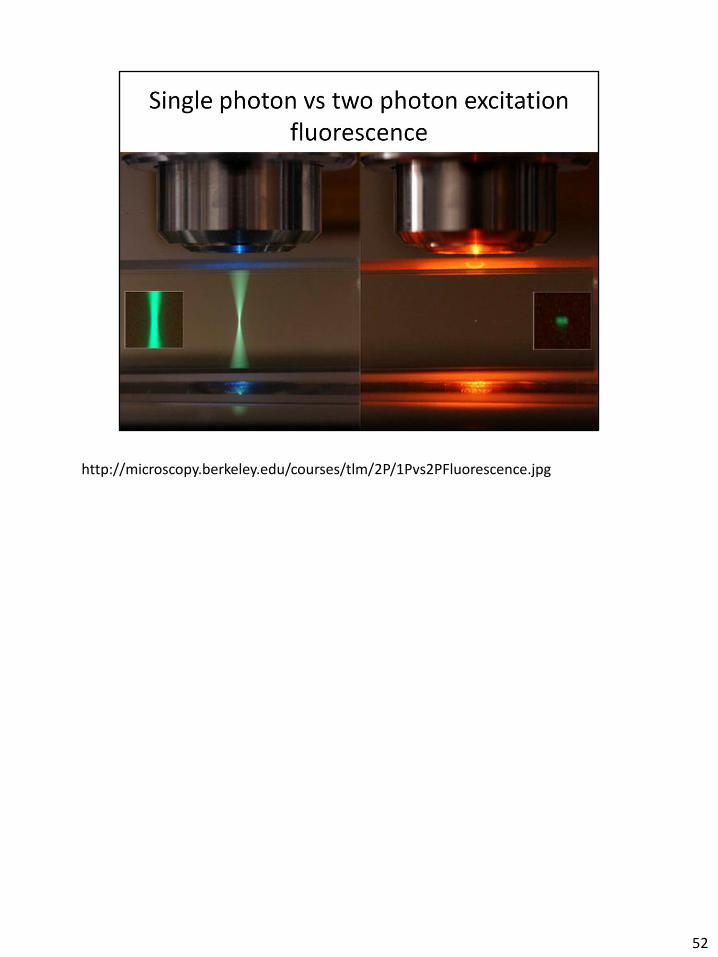
http://microscopy.berkeley.edu/courses/tlm/2P/1Pvs2PFluorescence.jpg
52

Figure 1. Energy diagrams of NLO modalities. Solid lines represent electronic and vibrational states of molecules, dashed lines are virtual states. The straight arrows are excitation beams, the wavy arrows are output signal beams. The gray arrows represent relaxation in electronically excited states. ω1 and ω2 are two beams available in CARS microscope. ωp = ω1 and ωs = ω2 in CARS and SRS level diagram. Here SRG is shown as an example for SRS. ωp = ω1 and ωpr = ω2 in level diagrams for pump-probe and photothermal modalities. Ω is a frequency of vibrational transition between vibrational ground state v=0 and vibrationally excited state v=1. ω1 and ω2 are pump and Stokes beams from the laser sources, respectively. ω3 is a long wavelength beam for THG and 3PL modalities available on optical parametric oscillator based laser systems for CARS microscope. ΔT is temperature change due to excitation. n1 and n2 are refractive indexes of material before and after excitation, respectively. Yue, Shuhua, Mikhail N. Slipchenko, and J-‐X. Cheng. "Multimodal nonlinear optical microscopy." Laser & photonics reviews 5.4 (2011): 496-512.
53

Figure 2. Multimodal NLO microscope. ω1 and ω2 are pump and Stokes beams used for CARS and two-beam modalities, respectively. ω3 is a longer wavelength (lower frequency) beam available in OPO based laser systems (ω1 > ω2 > ω3). OM is an optical modulator, SU is a scanning mirror unit. DM is an exchangeable dichroic mirror. The inset shows the connections between electronic components for phase sensitive heterodyne detection. Lock-in is a lock-in amplifier, PD is a photodiode, PC is a computer, FG is a function generator. The blue colored components are used for modalities with homodyne type of detection. The light blue color represents components required for modalities with heterodyne detection. The spectrometer is a part of compound Raman modality. Yue, Shuhua, Mikhail N. Slipchenko, and J-‐X. Cheng. "Multimodal nonlinear optical microscopy." Laser & photonics reviews 5.4 (2011): 496-512.
54

Figure 1. Principle and design of SRS microscopy. (A) Energy diagram for SRS. (B) Input and output spectra of SRS. SRS leads to an intensity increase in the Stokes beam (SRG) and an intensity decrease in the pump beam (SRL). Also shown (not to scale) is the CARS signal generated at the anti-Stokes frequency ωAS. (C) SRL detection scheme. Stokes beam is modulated at high frequency (MHz), at which the resulting amplitude modulation of the pump beam due to SRL can be detected. (D) SRL microscope with both forward and epi detection. The Stokes beam is modulated by an electro-optic modulator. The transmitted or reflected pump beam is filtered and detected by a large-area photodiode (PD). For epi detection, the backscattered beams are collected by the excitation objective lens (OL) and separated from the excitation beams by a combination of a quarter wave plate (λ/4) and polarizing beam splitter (PBS). The SRL is measured by a lock-in amplifier to provide a pixel of the image. Three-dimensional images are obtained by raster-scanning the laser focus across the sample, and microspectroscopy can be performed by automated tuning of the pump wavelength. (E) The linear dependence of SRL on concentrations of retinol in ethanol at 1595 cm−1. Modulation depth ΔIp/Ip < 10−7 can be achieved. Error bars show 1 SD of the signals for a 1-min recording. The detection limit was determined to be 50 µM. (F) Agreement of SRL spectrum (red circles) with the spontaneous Raman spectrum (black line) of the Raman peak (1595 cm−1) of 10 mM retinol in ethanol. The distorted CARS spectrum (blue squares) exhibits a typical dispersive shape. (G) The agreement of the more complex SRL spectrum of methanol (red circles) with the spontaneous Raman spectrum (black line). Freudiger, Christian W., Wei Min, Brian G. Saar, Sijia Lu, Gary R. Holtom, Chengwei He, Jason C. Tsai, Jing X. Kang, and X. Sunney Xie. "Label-free biomedical imaging with high sensitivity by stimulated Raman scattering microscopy." Science 322, no. 5909 (2008): 1857-1861.
55

56

Figure 3. RNAi screening of new fat storage regulatory genes based on in vivo lipid quantification using label-free SRS microscopy. (a–c) Fat was visualized by SRS in the wild-type worm (a), the daf-2(e1370) mutant (b) and the transgenic worm intestinally overexpressing the K04A8.5 lipase (c) under same imaging conditions. (d) Quantification of fat content by SRS (n = 5 worms) and thin-layer chromatography–gas chromatography (TLC/GC) (n = 5 × 10³ worms). (e) SRS signal increase compared to the control for genes that resulted in a fat content increase of more than 25% when inactivated by RNAi (P < 0.0001, n = 5 worms). Control, worms fed with bacteria containing empty vectors. All the experiments were performed twice independently. Results from one experiment are shown. (f) Normal fat accumulation as observed in the RNAi hypersensitive strain, nre-1(hd20)lin-15b(hd126), fed with empty vector–containing bacteria (control). (g–i) SRS images of three candidate worms. Scale bars, 50 μm. Error bars, s.d. Wang, Meng C., et al. "RNAi screening for fat regulatory genes with SRS microscopy." Nature methods 8.2 (2011): 135-138.
57

Figure 7. Two fungicides azoxystrobin (az) and chlorothalonil (chl) applied to maize leaves. (A) SRL and spontaneous Raman of azoxystrobin and chlorothalonil showing the C N peak, N.B. the peak is slightly different between the 2 chemicals (2225 cm−1 for Azoxystrobin and 2234 cm−1 for chlorothalonil). (B) SRL Image of a mixture of AZ and CHL showing that we are chemically specific between the 2 AIs (here red is AZ imaged at 2225 cm−1 and blue is CHL imaged at 2234 cm−1). (C) Chlorothalonil applied to a maize leaf (blue = SRL at 2234 cm−1 from the C N bond, green = SRL at 2930 cm−1 from the CH3 vibrations). (D) Azoxystrobin applied to a maize leaf (red = SRL at 2225 cm−1 from the C N bond, green = SRL at 2930 cm−1 from the CH3 vibrations) (note that in this section the azoxystrobin crystals appear yellow/orange as contrast from both the CH bonds (green) and CN bond (red) has been combined. Mansfield, Jessica C., et al. "Label-free chemically specific imaging in planta with stimulated Raman scattering microscopy." Analytical chemistry 85.10 (2013): 5055-5063.
58

Figure 7. Two fungicides azoxystrobin (az) and chlorothalonil (chl) applied to maize leaves. (A) SRL and spontaneous Raman of azoxystrobin and chlorothalonil showing the C N peak, N.B. the peak is slightly different between the 2 chemicals (2225 cm−1 for Azoxystrobin and 2234 cm−1 for chlorothalonil). (B) SRL Image of a mixture of AZ and CHL showing that we are chemically specific between the 2 AIs (here red is AZ imaged at 2225 cm−1 and blue is CHL imaged at 2234 cm−1). (C) Chlorothalonil applied to a maize leaf (blue = SRL at 2234 cm−1 from the C N bond, green = SRL at 2930 cm−1 from the CH3 vibrations). (D) Azoxystrobin applied to a maize leaf (red = SRL at 2225 cm−1 from the C N bond, green = SRL at 2930 cm−1 from the CH3 vibrations) (note that in this section the azoxystrobin crystals appear yellow/orange as contrast from both the CH bonds (green) and CN bond (red) has been combined. Mansfield, Jessica C., et al. "Label-free chemically specific imaging in planta with stimulated Raman scattering microscopy." Analytical chemistry 85.10 (2013): 5055-5063.
59

Figure 8. Deuterated glyphosate application with formulation onto maize leaves. (A) Spontaneous Raman spectrum of deuterated and nondeuterated glyphosate showing the peaks generated in the silent region by deuteration (inset shows the hydrogen atoms within the molecule which have been replaced with deuterium). (B) SRG spectra of the C−D peaks in the deuterated glyphosate. (C) Deuterated gylphosate crystals on a maize leaf (red = glyphosate, green = cell walls (TPF)). (D) Spontaneous Raman spectrum of glyphosate formulation showing a very strong peak at 2850 cm−1 corresponding to CH vibrations in aliphatic chains. (E) Imaging deuterated glyphosate (2164 cm−1) and formulation (2850 cm−1) applied to leaves in the merged image blue = 2850 cm−1 and red = 2164 cm−1. Mansfield, Jessica C., et al. "Label-free chemically specific imaging in planta with stimulated Raman scattering microscopy." Analytical chemistry 85.10 (2013): 5055-5063.
60

Figure 8. Deuterated glyphosate application with formulation onto maize leaves. (A) Spontaneous Raman spectrum of deuterated and nondeuterated glyphosate showing the peaks generated in the silent region by deuteration (inset shows the hydrogen atoms within the molecule which have been replaced with deuterium). (B) SRG spectra of the C−D peaks in the deuterated glyphosate. (C) Deuterated gylphosate crystals on a maize leaf (red = glyphosate, green = cell walls (TPF)). (D) Spontaneous Raman spectrum of glyphosate formulation showing a very strong peak at 2850 cm−1 corresponding to CH vibrations in aliphatic chains. (E) Imaging deuterated glyphosate (2164 cm−1) and formulation (2850 cm−1) applied to leaves in the merged image blue = 2850 cm−1 and red = 2164 cm−1. Mansfield, Jessica C., et al. "Label-free chemically specific imaging in planta with stimulated Raman scattering microscopy." Analytical chemistry 85.10 (2013): 5055-5063.
61
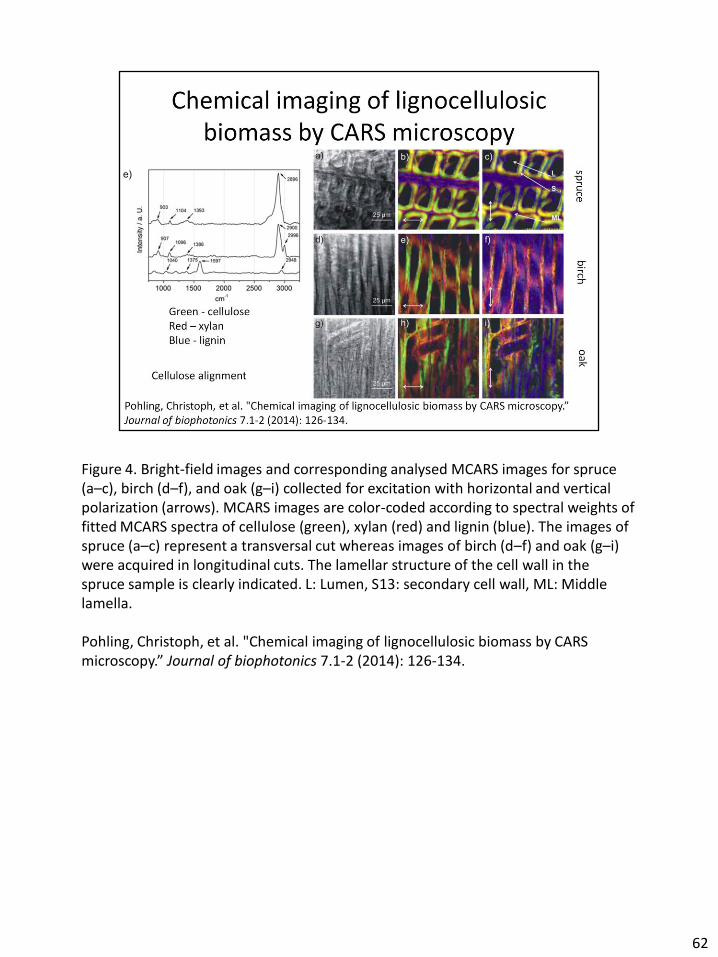
Figure 4. Bright-field images and corresponding analysed MCARS images for spruce (a–c), birch (d–f), and oak (g–i) collected for excitation with horizontal and vertical polarization (arrows). MCARS images are color-coded according to spectral weights of fitted MCARS spectra of cellulose (green), xylan (red) and lignin (blue). The images of spruce (a–c) represent a transversal cut whereas images of birch (d–f) and oak (g–i) were acquired in longitudinal cuts. The lamellar structure of the cell wall in the spruce sample is clearly indicated. L: Lumen, S13: secondary cell wall, ML: Middle lamella. Pohling, Christoph, et al. "Chemical imaging of lignocellulosic biomass by CARS microscopy.” Journal of biophotonics 7.1-‐2 (2014): 126-134.
62

Figure 2. Imaging of lignin and cellulose with SRS microscopy. a) SRS image at 1600 cm1 of another vascular bundle in the same sample as in Figure 1, showing the lignin distribution with a red intensity grade. b) SRS image of the same vascular bundle as in (a), showing the cellulose distribution at 1100 cm1 with a green intensity grade. Both (a) and (b) are 10241024-pixel images obtained with a 50 ms pixel dwell time. These images can be acquired simultaneously using the two-color SRS instrument (see Experimental Section). c) Ratio of the lignin divided by the cellulose signal at higher magnification, obtained from the region surrounded by the dotted line in (a) and (b). Saar, Brian G., et al. "Label-‐Free, Real-‐Time Monitoring of Biomass Processing with Stimulated Raman Scattering Microscopy." Angewandte Chemie International Edition 49.32 (2010): 5476-5479.
63

Figure 3. Real-time SRS imaging of a delignification reaction in corn stover. All images were taken in the same vascular bundle. a) Lignin signal at 1600 cm1 before the start of the reaction. b) The cellulose signal at 1100 cm1 before the start of the reaction. c) Lignin signal after a 53 min time course of acid chlorite treatment, showing significant reduction (more than eightfold) compared to (a). d) Cellulose signal after treatment, which remains roughly the same as in (b). e) False-color heat map of the reaction rate constant obtained by fitting the time series of the lignin decay in the reaction to a single exponential. The initial and final points are shown in images (a) and (c). The rate-constant [s1] color scale is shown in the bottom left corner. f–i) Representative time traces (red dots) and single exponential fits (blue lines) from four locations labeled as green spots in (e), representing a phloem element (f), vessel (g), fiber (h), and background with no plant cell wall (i) in the corn stover sample. The image in part (e) consists of 256256 pixels, each of which has an associated single exponential decay fit to obtain the rate constant. Acquisition time: about 8 s/frame; spatial resolution: 900 nm (limited by the sampling of the images). Scale bars: 40 micrometers. Saar, Brian G., et al. "Label-‐Free, Real-‐Time Monitoring of Biomass Processing with Stimulated Raman Scattering Microscopy." Angewandte Chemie International Edition 49.32 (2010): 5476-5479.
64

65

66

67

68

69

70

71