chamber quantification and evaluation of systolic...
TRANSCRIPT

©2016 MFMER | slide-1
Mayo Clinic Department of Cardiovascular Diseases
Mayo Clinic Echocardiography Review Course for Boards and Recertification
Chamber Quantification and Evaluation of Systolic Function
Hector I. Michelena, FACC, FASEAssociate Professor of Medicine
ACC Latin AmericaOctober, 2016
©2016 MFMER | slide-2
Disclosures
• No relevant financial disclosures
©2016 MFMER | slide-3
Overview
• Assessment of LV size
• Assessment of LV function
• Assessment of LV mass and geometry
©2016 MFMER | slide-4
J Am Soc Echocardiogr 2015;28:1-39

©2016 MFMER | slide-5
Nishimura RA et al. J Am Coll Cardiol. 2014;63(22):e57-e185.
Yancy CW et al. J Am Coll Cardiol. 2013;62(16):e147-e239.
©2016 MFMER | slide-6
Assessment of LV Size
©2016 MFMER | slide-7
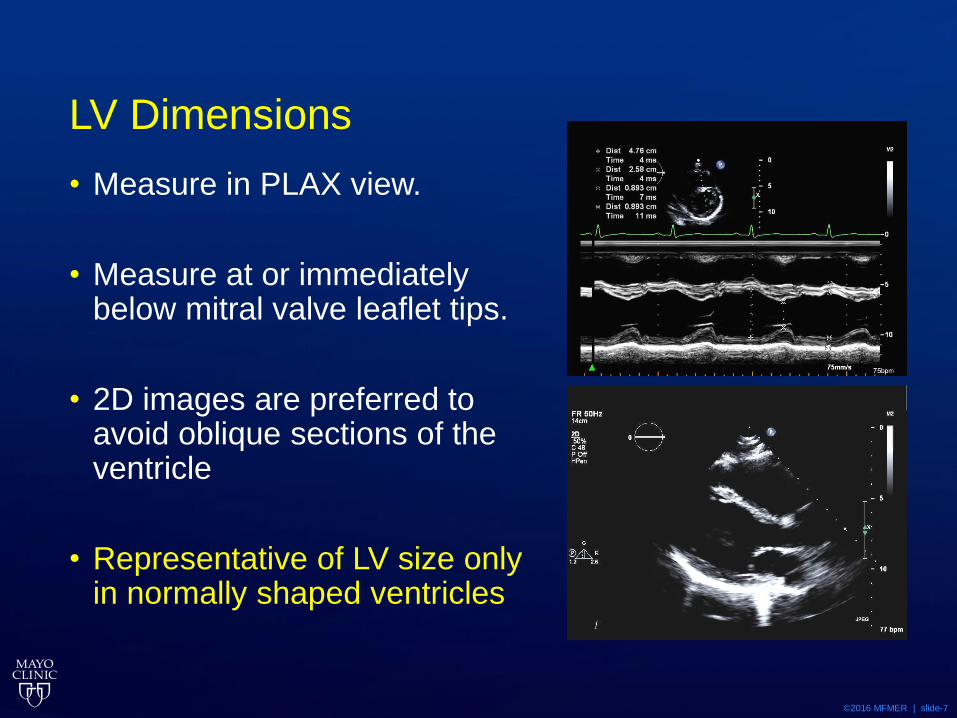
LV Dimensions
• Measure in PLAX view.
• Measure at or immediately below mitral valve leaflet tips.
• 2D images are preferred to avoid oblique sections of the ventricle
• Representative of LV size only in normally shaped ventricles

©2016 MFMER | slide-8
LV Volumes
• Calculation of LV volumes from linear dimensions is no longer recommended.
• May be inaccurate due to assumption of a fixed geometric LV shape which does not apply in a variety of pathologies.

©2016 MFMER | slide-9
LV Volumes
• Should routinely be assessed by using the biplane method of disks summation technique.
• Should be measured from apical 4- and 2-chamber views.
• Avoiding foreshortening and aim to maximize LV areas

©2016 MFMER | slide-10
Tips
• Avoiding foreshortening
• LV lengths should be comparable between views
• Exclude trabeculationsand papillary muscle 𝑙
𝑙

©2016 MFMER | slide-11

©2016 MFMER | slide-12
Contrast Echocardiography
• Should be used when two or more contiguous LV segments are poorly visualized in apical views.
• Contrast-enhanced images may provide larger volumes than unenhanced images.
©2016 MFMER | slide-13
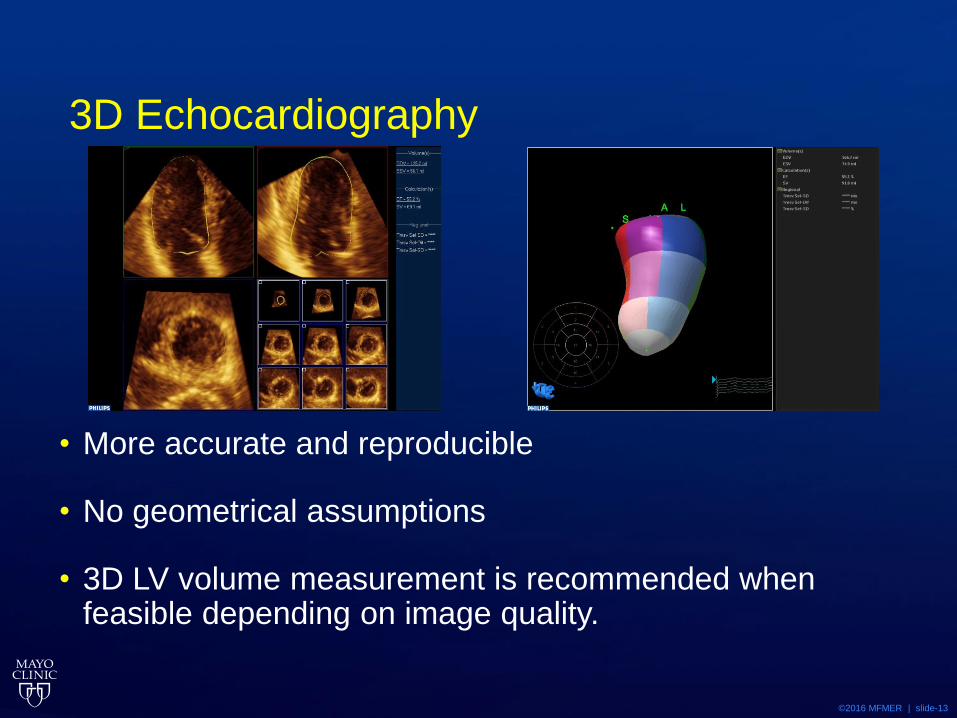
3D Echocardiography
• More accurate and reproducible
• No geometrical assumptions
• 3D LV volume measurement is recommended when feasible depending on image quality.

©2016 MFMER | slide-14
Assessment of LV Volumes by Echo
Jenkins C et al. Left ventricular volume measurement with echocardiography: a comparison of left
ventricular opacification, three-dimensional echocardiography, or both with magnetic resonance
imaging. Eur Heart J. 2009;30:98-106.

©2016 MFMER | slide-15
Interpretation of LV size
Lang RM et al. Recommendations for Cardiac Chamber Quantification by Echocardiography in Adults:
An Update from the American Society of Echocardiography and the European Association of
Cardiovascular Imaging. J Am Soc Echocardiogr 2015;28:1-39.

©2016 MFMER | slide-16
©2016 MFMER | slide-17

©2016 MFMER | slide-18
©2016 MFMER | slide-19

©2016 MFMER | slide-20
Rvol MR 105 cc/beat
2D LVEDD 54 mm
2D LVESD 40 mm
Volumetric LVEF 54%
LA index 75 cc/m2
Biplane LV EDD Vol 225 cc
Biplane LV EDD Vol/index 137 cc/m2

©2016 MFMER | slide-21
Assessment of LV Function

©2016 MFMER | slide-22
Methods
• Fractional Shortening
• Ejection Fraction
• Stroke Volume
• Global Longitudinal Strain
• Regional Wall Motion Analysis

©2016 MFMER | slide-23
LVEF: Modified Quinones Method
LVEFcalc =𝐿𝑉𝐸𝐷𝐷2− 𝐿𝑉𝐸𝑆𝐷2
𝐿𝑉𝐸𝐷𝐷2
EF = LVEFcalc + [(1 – LVEFcalc )(%∆L)]
Where apical factor (%∆L) is :15 Normal
5 Hypokinetic
0 Akinetic
-5 Dyskinetic
-10 Aneurysmal

©2016 MFMER | slide-24
©2016 MFMER | slide-25
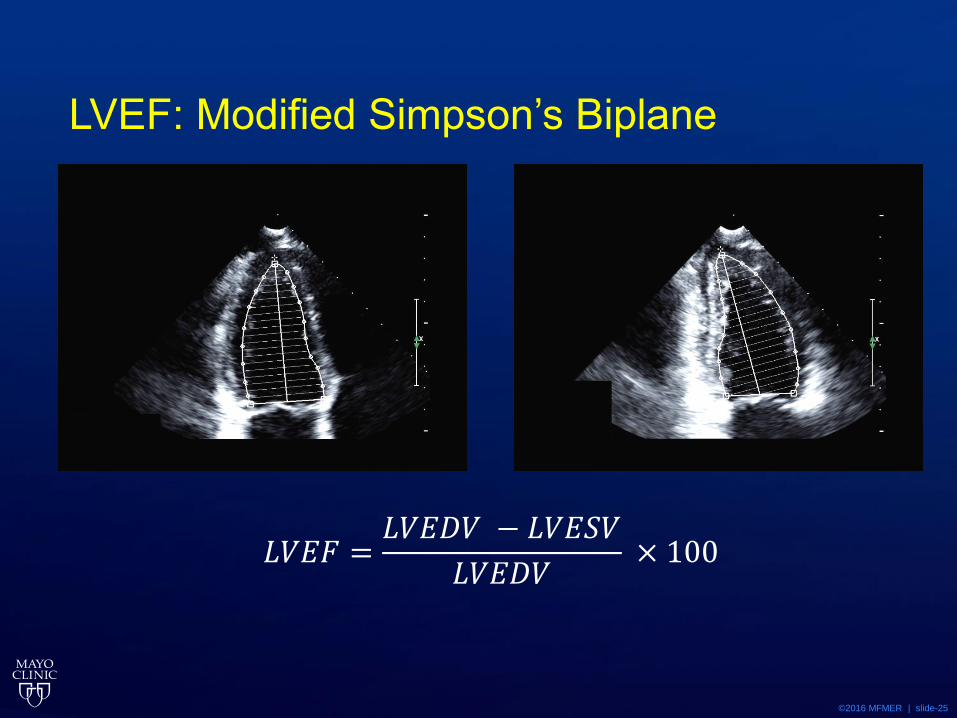
LVEF: Modified Simpson’s Biplane
𝐿𝑉𝐸𝐹 =𝐿𝑉𝐸𝐷𝑉 − 𝐿𝑉𝐸𝑆𝑉
𝐿𝑉𝐸𝐷𝑉× 100
©2016 MFMER | slide-26
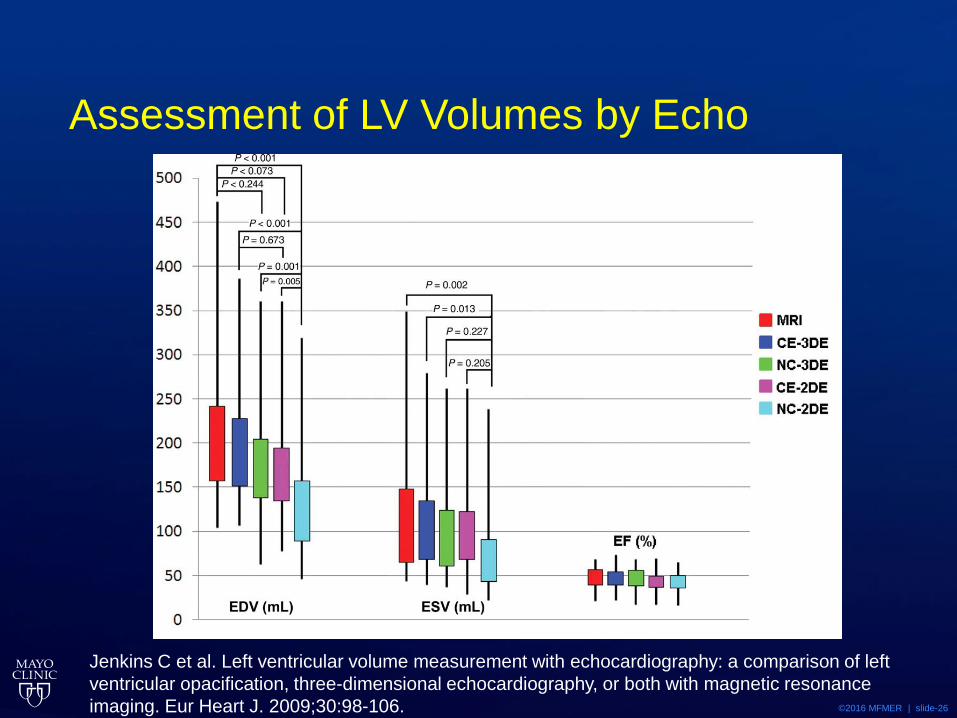
Assessment of LV Volumes by Echo
Jenkins C et al. Left ventricular volume measurement with echocardiography: a comparison of left
ventricular opacification, three-dimensional echocardiography, or both with magnetic resonance
imaging. Eur Heart J. 2009;30:98-106.
©2016 MFMER | slide-27
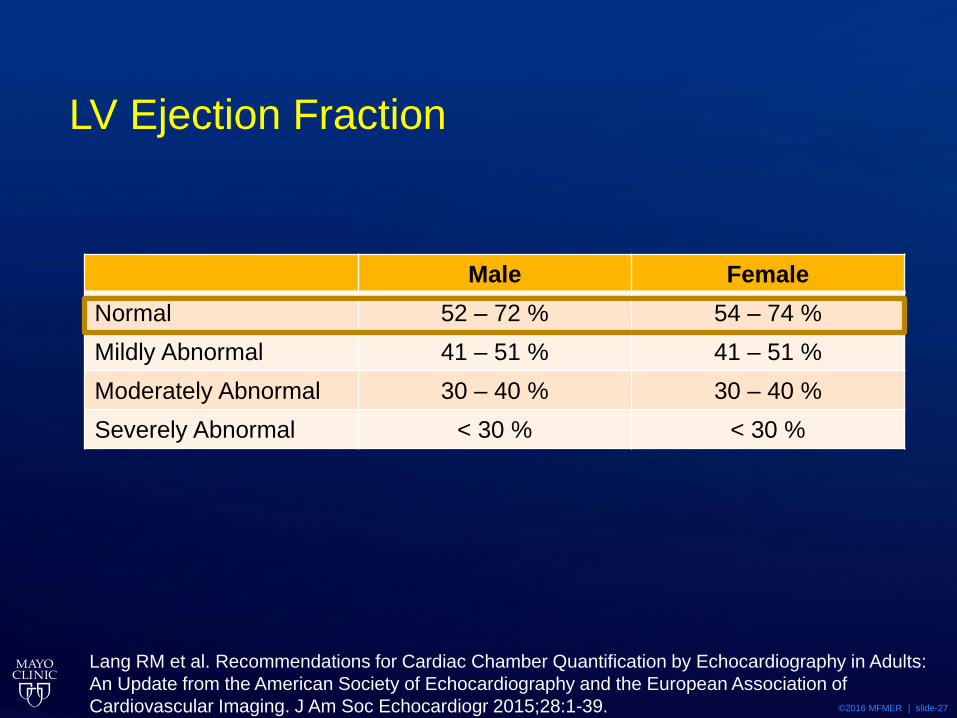
LV Ejection Fraction
Male Female
Normal 52 – 72 % 54 – 74 %
Mildly Abnormal 41 – 51 % 41 – 51 %
Moderately Abnormal 30 – 40 % 30 – 40 %
Severely Abnormal < 30 % < 30 %
Lang RM et al. Recommendations for Cardiac Chamber Quantification by Echocardiography in Adults:
An Update from the American Society of Echocardiography and the European Association of
Cardiovascular Imaging. J Am Soc Echocardiogr 2015;28:1-39.
©2016 MFMER | slide-28
Assessment of LV Mass and Geometry

©2016 MFMER | slide-29
Question
• 64 year old white female presents with a 16 year history of hypertension, she initially was managed with diuretics alone but has been managed with two drug therapy with ACE inhibitor and diuretics for the last 7 years.

©2016 MFMER | slide-30
Question
• She describes NYHA class II DOE, no orthopnea or PND. Denies chest pain or other cardiac symptoms.
• Exam
• 165cm 82 Kg
• BP 137/81 HR 67
• Lungs Clear
• CV soft S1 paradoxically split S2, 1/6 holosystolic blowing murmur at apex
• No Edema

©2016 MFMER | slide-31

©2016 MFMER | slide-32
Question
• Echocardiogram demonstrates enlarged left ventricle with global hypokinesis, LVEF 23%, Moderate mitral regurgitation
• LVEDD 79mm LVESD 74 mm
• Septal wall 9 mm Posterior wall 9 mm
• LV Mass 121 gm/m2

©2016 MFMER | slide-33
Question
• Which best describes the remodeling of the left ventricle
1. Concentric remodelling
2. Normal geometry
3. Concentric hypertrophy
4. Eccentric hypertrophy
©2016 MFMER | slide-34
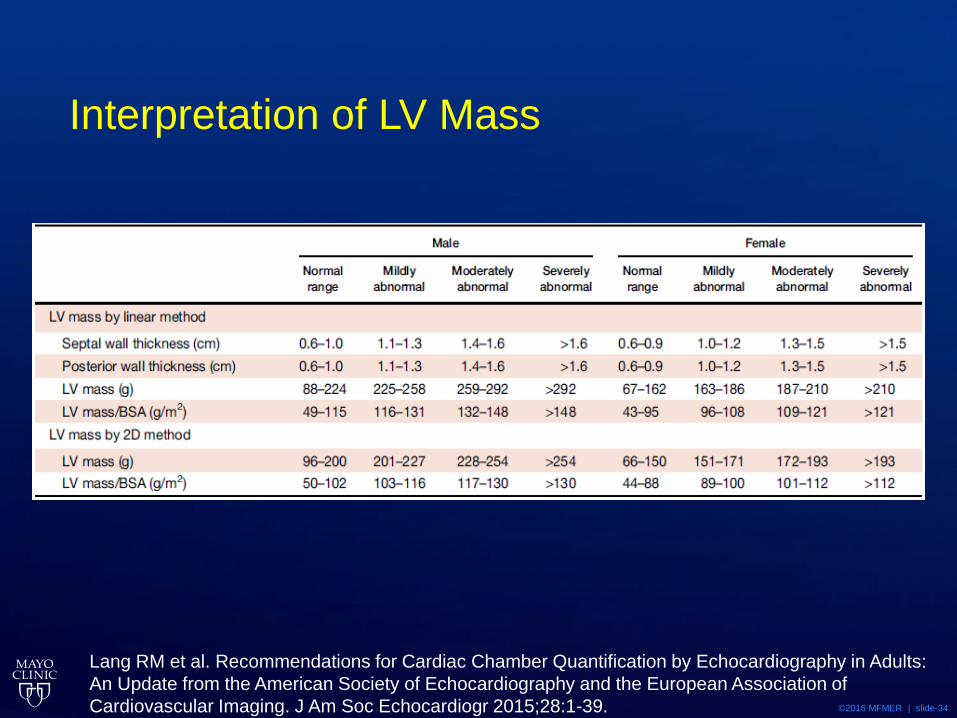
Interpretation of LV Mass
Lang RM et al. Recommendations for Cardiac Chamber Quantification by Echocardiography in Adults:
An Update from the American Society of Echocardiography and the European Association of
Cardiovascular Imaging. J Am Soc Echocardiogr 2015;28:1-39.
©2016 MFMER | slide-35
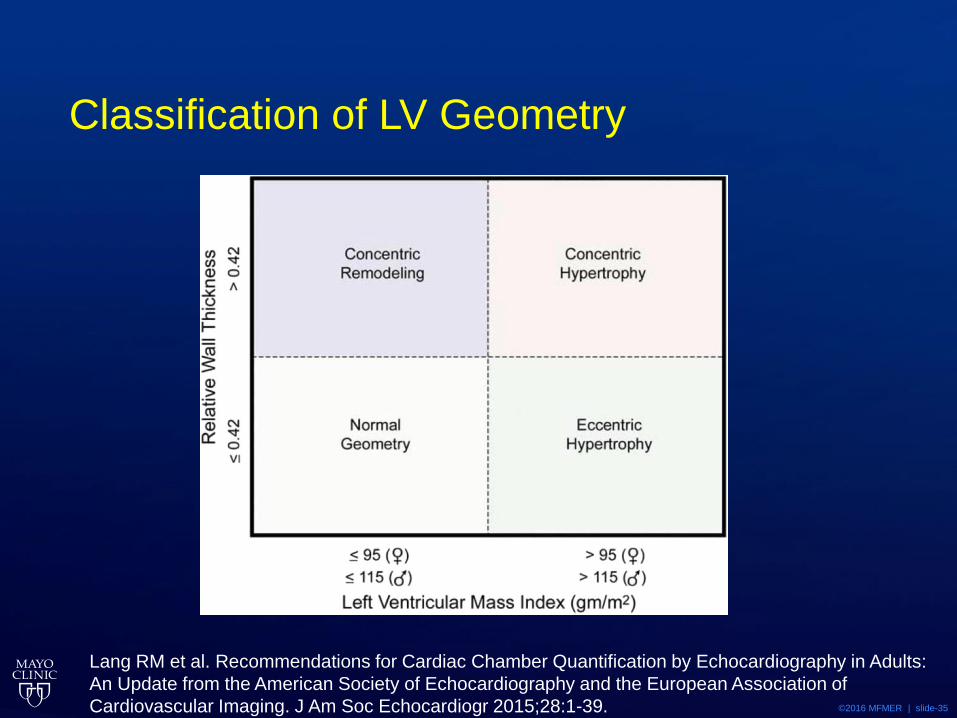
Classification of LV Geometry
Lang RM et al. Recommendations for Cardiac Chamber Quantification by Echocardiography in Adults:
An Update from the American Society of Echocardiography and the European Association of
Cardiovascular Imaging. J Am Soc Echocardiogr 2015;28:1-39.
©2016 MFMER | slide-36
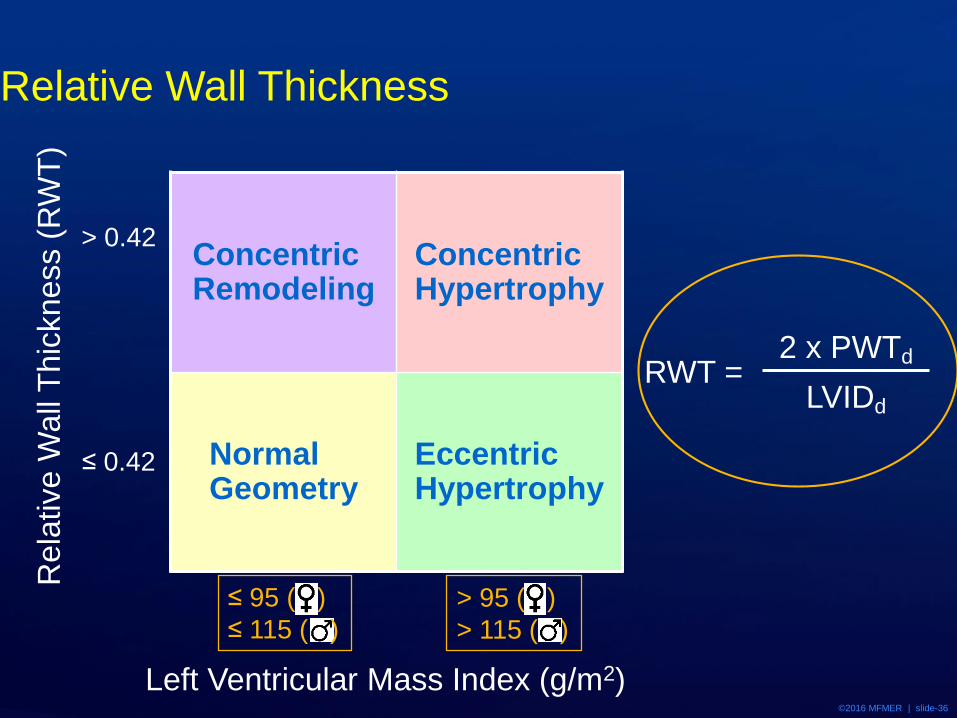
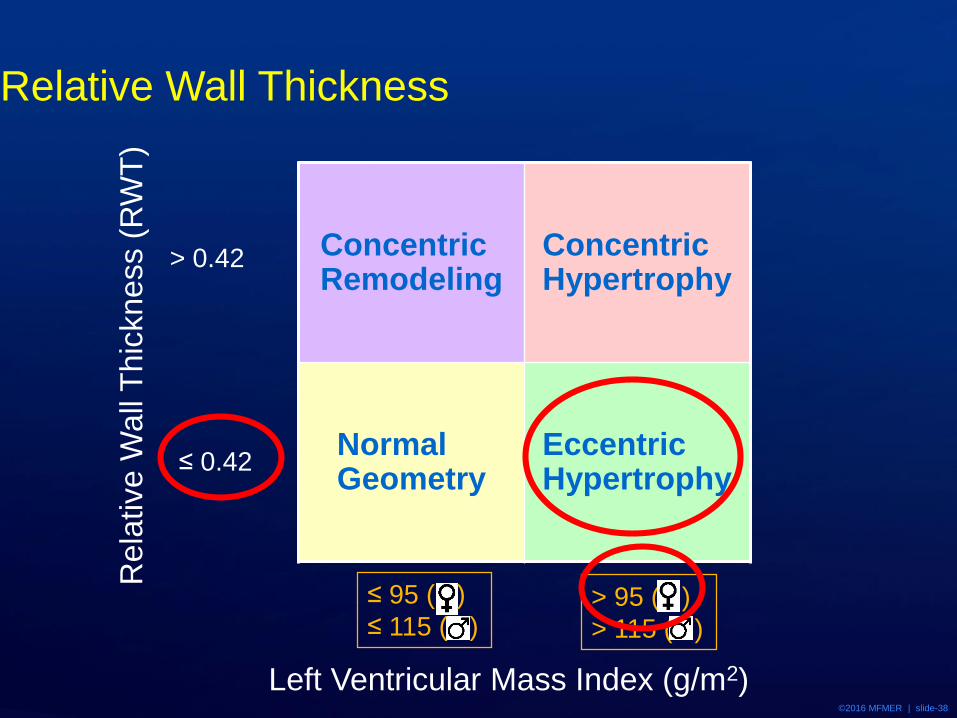
Relative Wall Thickness
Concentric Remodeling
Concentric Hypertrophy
NormalGeometry
Eccentric Hypertrophy
Left Ventricular Mass Index (g/m2)
≤ 95 ( )
≤ 115 ( )
> 95 ( )
> 115 ( )
Rela
tive W
all
Thic
kness (
RW
T)
> 0.42
≤ 0.42
RWT = 2 x PWTd
LVIDd
©2016 MFMER | slide-37
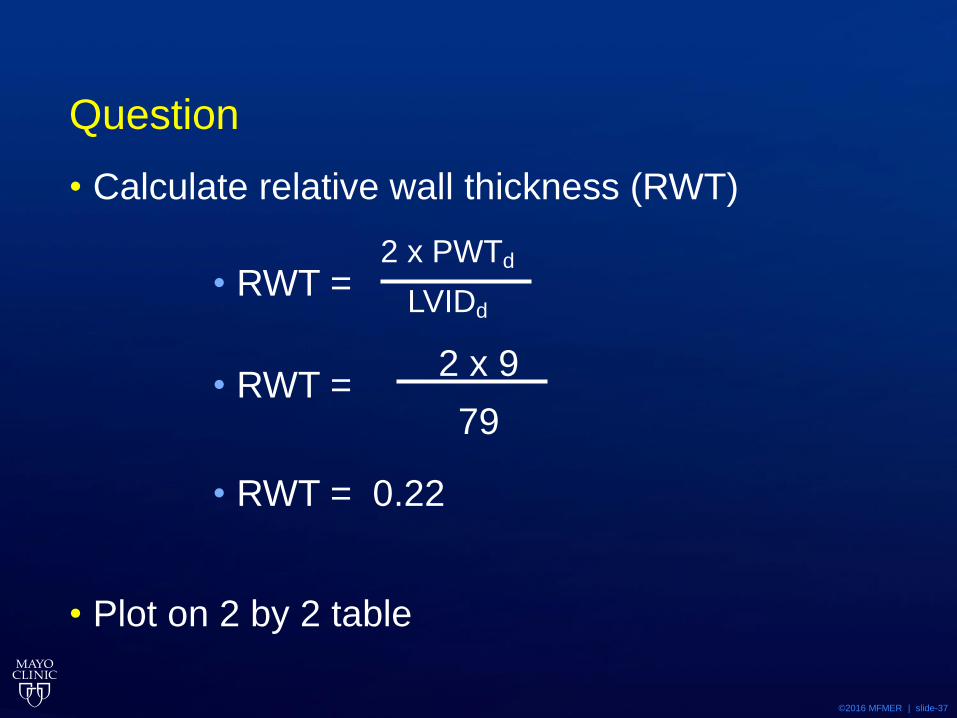
Question
• Calculate relative wall thickness (RWT)
• RWT =
• RWT =
• RWT = 0.22
• Plot on 2 by 2 table
2 x PWTd
LVIDd
2 x 9
79
©2016 MFMER | slide-38
Relative Wall Thickness
Concentric Remodeling
Concentric Hypertrophy
NormalGeometry
Eccentric Hypertrophy
Left Ventricular Mass Index (g/m2)
≤ 95 ( )
≤ 115 ( )> 95 ( )
> 115 ( )
Rela
tive W
all
Thic
kness (
RW
T)
> 0.42
≤ 0.42

©2016 MFMER | slide-39
Question
• Which best describes the remodeling of the left ventricle
1. Concentric remodelling
2. Normal geometry
3. Concentric hypertrophy
4. Eccentric hypertrophy
©2016 MFMER | slide-40
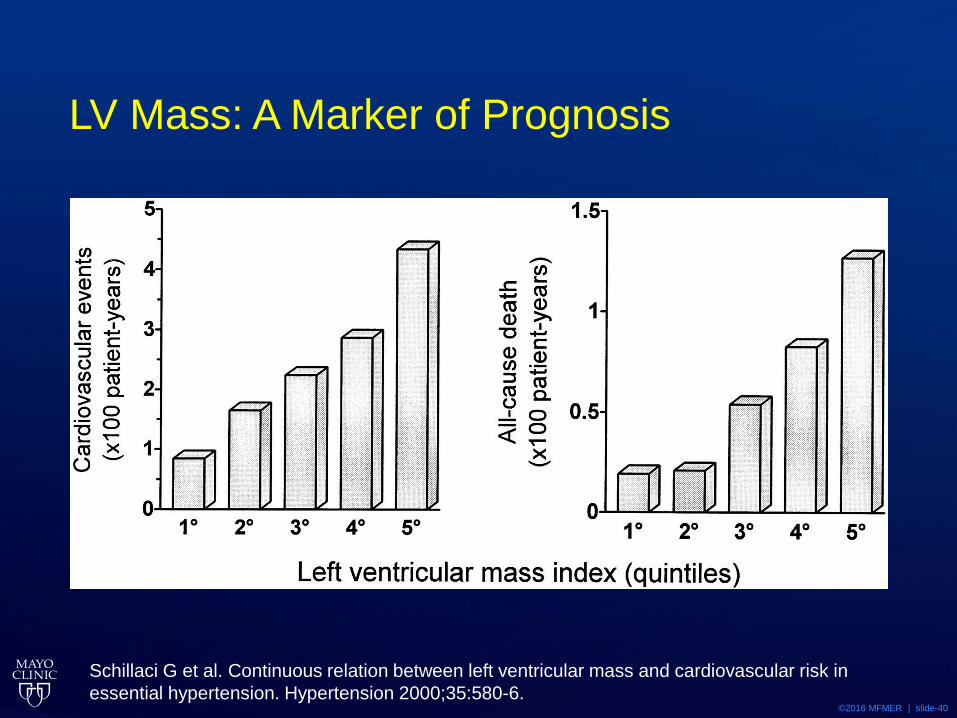
Schillaci G et al. Continuous relation between left ventricular mass and cardiovascular risk in
essential hypertension. Hypertension 2000;35:580-6.
LV Mass: A Marker of Prognosis
©2016 MFMER | slide-41

©2016 MFMER | slide-42
LV Geometry: Clinical Implications
All Cause Mortality Cardiovascular Events
Verma A et al. Prognostic implications of left ventricular mass and geometry following myocardial
infarction: the VALIANT (VALsartan In Acute myocardial iNfarcTion) Echocardiographic Study. JACC
Cardiovasc Imaging 2008;1:582-91.

©2016 MFMER | slide-43
Questions & Discussion