champaign park district champaign, illinois · 2014-11-03 · financial section of this report....
TRANSCRIPT

CHAMPAIGN PARK DISTRICT
Champaign, Illinois
Comprehensive Annual Financial Report
For the Year Ended
April 30, 2014
Prepared By: Finance and Administration Department
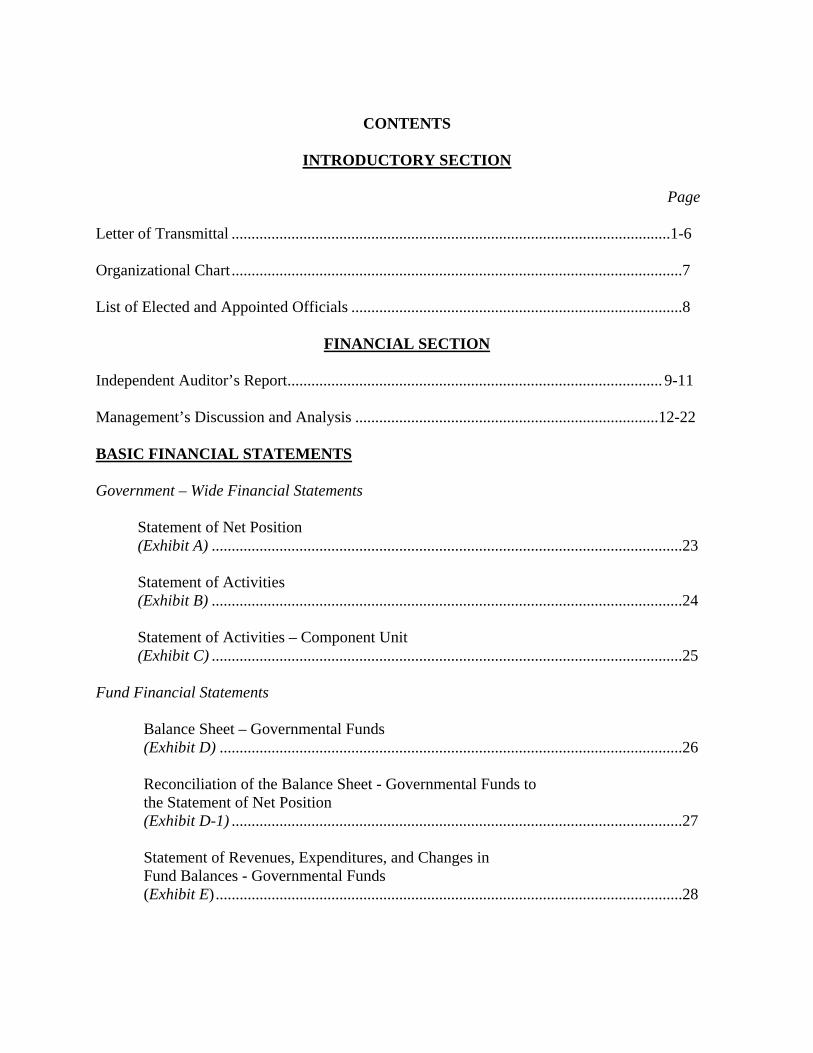
CONTENTS
INTRODUCTORY SECTION
Page Letter of Transmittal ..............................................................................................................1-6 Organizational Chart .................................................................................................................7 List of Elected and Appointed Officials ...................................................................................8
FINANCIAL SECTION Independent Auditor’s Report .............................................................................................. 9-11 Management’s Discussion and Analysis ............................................................................12-22 BASIC FINANCIAL STATEMENTS Government – Wide Financial Statements Statement of Net Position (Exhibit A) ......................................................................................................................23 Statement of Activities (Exhibit B) ......................................................................................................................24 Statement of Activities – Component Unit (Exhibit C) ......................................................................................................................25 Fund Financial Statements Balance Sheet – Governmental Funds (Exhibit D) ....................................................................................................................26 Reconciliation of the Balance Sheet - Governmental Funds to the Statement of Net Position (Exhibit D-1) .................................................................................................................27 Statement of Revenues, Expenditures, and Changes in Fund Balances - Governmental Funds (Exhibit E) .....................................................................................................................28

Reconciliation of the Statement of Revenues, Expenditures, and Changes in Fund Balances – Governmental Funds to the Statement of Activities (Exhibit E-1)..................................................................................................................29 Statement of Revenues, Expenditures, and Changes in Fund Balance – Actual (Budgetary Basis) Versus Budget: General Fund (Exhibit F) .....................................................................................................................30 Recreation Fund (Exhibit G) ....................................................................................................................31 Museum Fund (Exhibit H) ...................................................................................................................32 Special Recreation Fund (Exhibit I) …………………………………………………………………………….33 Statement of Fiduciary Net Position (Exhibit J)......................................................................................................................34 Notes to Financial Statements .............................................................................................35-70 REQUIRED SUPPLEMENTARY INFORMATION Schedule of Funding Progress (Unaudited) ..............................................................................71 COMBINING AND INDIVIDUAL FUND FINANCIAL STATEMENTS AND SUPPLEMENTARY INFORMATION Combining Financial Statements Combining Balance Sheet – Non-Major Governmental Funds (Schedule 1) ..................................................................................................................72 Combining Statement of Revenues, Expenditures, and Changes in Fund Balances - Non-Major Governmental Funds (Schedule 2) ..................................................................................................................73

Individual Fund Financial Statements
Schedule of Revenues, Expenditures, and Changes in Fund Balance – Actual (Budgetary Basis) Versus Budget:
Special Revenue Funds
Liability Insurance Fund
(Schedule 3) ......................................................................................................74
Illinois Municipal Retirement Fund (Schedule 4) ......................................................................................................75
Audit Fund (Schedule 5) ......................................................................................................76
Social Security Fund (Schedule 6) ......................................................................................................77
Police Protection Fund (Schedule 7) ......................................................................................................78
Special Donation Fund (Schedule 8) ......................................................................................................79
Debt Service Fund
Bond Amortization /Debt Service Fund (Schedule 9) ......................................................................................................80
Capital Projects Fund
Paving and Lighting Fund (Schedule 10) ....................................................................................................81
Capital Improvements and Repair Fund (Schedule 11) ....................................................................................................82 Land Acquisition Fund (Schedule 12) ....................................................................................................83
Bond Proceeds Fund
(Schedule 13) ....................................................................................................84

Permanent Fund
Working Cash Fund (Schedule 14) ....................................................................................................85 Fiduciary Fund
Statement of Changes in Assets and Liabilities – Fiduciary (Agency) Fund - Activity and Affiliates Fund (Schedule 15) ....................................................................................................86
STATISTICAL SECTION Statistical Section Introduction .................................................................................................87 Net Position by Component (Schedule 16) ............................................................................................................................88 Changes in Net Position (Schedule 17) ............................................................................................................................89 Fund Balances of Governmental Funds (Schedule 18) ............................................................................................................................90 Changes in Fund Balances of Governmental Funds (Schedule 19) ............................................................................................................................91 Assessed and Estimated Actual Value of Taxable Property (Schedule 20) ............................................................................................................................92 Property Tax Rates – Direct and Overlapping Governments (Schedule 21) ............................................................................................................................93 Principal Property Taxpayers (Schedule 22) ............................................................................................................................94 Property Tax Levies and Collections (Schedule 23) ............................................................................................................................95 Ratio of Outstanding Debt by Type (Schedule 24) ............................................................................................................................96 Ratio of Net General Bonded Debt Outstanding (Schedule 25) ............................................................................................................................97

Direct and Overlapping Governmental Activities Debt (Schedule 26) ............................................................................................................................98 Computation of Legal Debt Margin (Schedule 27) ............................................................................................................................99 Schedule of Revenue Supported Bond Coverage (Schedule 28) ............................................................................................................................100 Demographic and Economic Statistics (Schedule 29) ............................................................................................................................101 Principal Employers (Schedule 30) ............................................................................................................................102 Number of District Employees by Function (Schedule 31) ............................................................................................................................103 Operating Indicators by Function (Schedule 32) ............................................................................................................................104 Capital Asset Statistics by Function (Schedule 33) ............................................................................................................................105

INTRODUCTORY SECTION
Letter of Transmittal

September 8, 2014 Board of Commissioners Champaign Park District We are pleased to submit the Comprehensive Annual Financial Report (CAFR) of the Champaign Park District for the fiscal year ended April 30, 2014. The State of Illinois requires each local government to issue an annual report on its financial position prepared in accordance with generally accepted accounting principles (GAAP) and audited in accordance with generally accepted auditing standards by a firm of licensed certified public accountants. This report is based on management’s goal to present a complete financial picture of the operations and financial position of the Champaign Park District. Consequently, management accepts full responsibility for the fairness, accuracy and completeness of all of the information presented in this report. To provide a reasonable basis for making these representations, the management of the District has established and maintained a comprehensive internal control framework that is designed to protect the District’s assets from loss, theft or misuse, to assure transactions are properly executed and recorded with management’s authorization and to compile sufficient information for the District’s financial statements. The District’s system of internal control is supported by written policies and procedures and periodically reviewed, evaluated and modified to meet current needs. Internal accounting controls are designed to provide reasonable, but not absolute, assurance that the financial statements will be free from material misstatement. The concept of reasonable assurance recognizes that the cost of internal controls should not exceed the benefits likely to be derived from the controls. It is management’s belief that the District’s system of internal controls adequately safeguards assets, provides a reasonable assurance of proper recording of transactions and that these financial statements are complete and reliable in all material respects. The District’s financial statements have been audited by the firm of Martin, Hood, Friese and Associates, LLC licensed certified public accountants. The independent audit estimates made by management, and evaluating the overall financial statement presentation. Based upon the audit,
- 1 -

- 2 -
the independent auditor concluded that there was a reasonable basis for rendering an unqualified opinion that the District’s financial statements for the fiscal year ended April 30, 2013 are fairly presented in conformity with GAAP. The independent auditor’s report is presented in the financial section of this report. provides reasonable assurance that the financial statements of the District for the fiscal year ended April 30, 2014 are free of material misstatement. The audit involved examining selected records to support amounts and disclosures in the financial statements, assessing the accounting principles applied and significant estimates made by management, and evaluating the overall financial statement presentation. Based upon the audit, the independent auditor concluded that there was a reasonable basis for rendering an unmodified opinion that the District’s financial statements for the fiscal year ended April 30, 2014 are fairly presented in conformity with GAAP. The independent auditor’s report is presented in the financial section of this report beginning on page 9. GAAP requires that management provide a narrative introduction, overview and analysis to accompany the basic financial statements in the form of Management’s Discussion and Analysis (MD&A). This letter of transmittal is designed to complement MD&A and should be read in conjunction with it. The District’s MD&A can be found immediately following the report of the independent auditor. Profile of the Champaign Park District The Champaign Park District was organized in November 1911. The Park District was established as a separate unit of local government in 1955 by a public referendum. The District is a municipal corporation under the Statutes of the State of Illinois. The District operates under a Board-Executive Director form of government. The five member Board of Commissioners is elected to six year, uncompensated, terms in biennial elections. The Executive Director and the department heads who serve under his supervision are responsible for carrying out the policies, procedures and ordinances of the District. The District’s boundaries are nearly coterminous with the City of Champaign and cover over 20 square miles. The 2010 special census lists the City’s population as 81,055. The District is composed of over 62 parks, trails and facilities covering nearly 689 acres. The District’s strategic plan identified the District’s vision to consistently exceed community expectations. The mission of the District is to enhance our community’s quality of life through positive experiences in parks, recreation, and cultural arts. In 1999, the District received the Illinois Association of Park Districts and the Illinois Park and Recreations’ Distinguished Park and Agency award. To earn this distinction, a park district is evaluated in six separate categories which range from mandatory and legal requirements to desired standards for park districts that the two associations have set. In 2011 the District was re-evaluated and maintained this distinguished distinction. Only 38 other park districts from over 350 agencies in the state of Illinois have obtained the distinguished designation.

- 3 -
Financial Planning The annual budget serves as the foundation for the District’s financial planning and control. In May, a proposed budget is submitted by staff to the Board of Commissioners for review and approval. The budget includes proposed expenditures and the means for financing them for the fiscal year beginning May 1. Before the budget can be officially approved, state law requires a public hearing on the proposed budget. By state law, the budget must be officially approved by the Board of Commissioners by the end of the first quarter of the new fiscal year. The appropriated budget is prepared by fund, department, program activity and by line item classification. Budgetary control is employed as a management control device during the year through an internal reporting process. The process includes verification of appropriation amounts prior to expenditures and a monthly review of all account totals compared with appropriations. Contracts greater than or equal to $20,000 must have the Board of Commissioner’s approval. The Board reviews monthly, all expenditures and financial statements and is updated on line item accounts which may go over appropriated amounts and need a transfer. Transfers are generally within the same fund and are simply movement from one line item account that is under budget to another line item account that will exceed its appropriated amount. Transfers between lines within the same fund may be made throughout the year without Board approval and are then approved by the Board near the end of the fiscal year. Transfers between line items between different funds are approved as part of the monthly Treasurer’s Report and Detailed Bill Listing which is approved by the Board. A new Budget and Appropriation Ordinance is required if the total appropriation for a fund is exceeded. The Board of Commissioners may amend the Budget and Appropriation Ordinance, but it must be done in accordance with the same procedures followed in adopting the original ordinance. Local Economy The information presented in the financial statements is perhaps best understood when it is considered from the broader perspective of the specific environment within which the District operates. The Champaign Park District is located in east-central Illinois, one of the most stable economic environments, with one of the lowest unemployment rates, in the state. A major reason for this stability is that the University of Illinois is located in Champaign and its neighbor City of Urbana. The University provides over 10,500 jobs to the community. The large number of University employees residing in the District contributes greatly to the District’s program and property tax revenues. Also, the District’s commercial base is rather diverse which tends to minimize the overall effects of economic swings. The commercial base of the District is mainly divided between healthcare, retail, food, service, real estate and high technology industries. In recent years the District’s boundaries have expanded by both residential growth and retail and commercial growth. The residential growth has mainly expanded the boundaries to the west with some new growth planned to the north and west. The retail and commercial growth has been mainly north with expansion also taking place in downtown Champaign. During recent years, the District completed the largest annexation in its history, annexing in over 600 acres.

- 4 -
Much of this new annexation contains single family housing increased the District’s assessed valuation by over 15% in 2005. Due to the economic conditions, the assessed valuation has declined approximately 2.7% over the last 5 years. For 2014, the assessed value decreased 1.67%, the largest increase in the last 5 years. In general, an increase in the assessed valuation helps offset the property tax cap limits imposed by the Property Tax Extension Limitation Law. This law limits the increase in the District’s annual property tax levy to the lesser of 5% or the increase in the national Consumer Price Index plus any new or improved property in the District. For the fiscal year 2013/2014 the increase in the Index was set at 1.6%. Property Taxes account for nearly 79% of the District’s operating revenues. If tax caps were not in place, and if the District taxed at their maximum allowable rate, then the District could have received nearly $249,900 more in property tax revenue overall. The District does not receive any state or local income tax revenue, though it does receive a share of Personal Property Replacement Tax, which is collected and distributed by the State of Illinois Department of Revenue. Major Initiatives The District’s capital improvement program is reviewed and revised annually. The Board of Commissioners and the staff update the five year plan in the second half of the prior year. During the annual budget process, staff review and reprioritize the capital program in order to best meet the District’s maintenance, development and land acquisition goals as they fit in the current year’s budget. The District continues to issue general obligation bonds to help finance various capital and major repair projects. The District issued $1,068,000 of bonds in November, 2013. The District also refunded the outstanding 2005 Alternate Revenue General Obligation Bonds which financed the construction of the Sholem Aquatic Center. The District has completed or is in the process of completing the following projects. Sunset Ridge Park (formerly known as Boulder Ridge Park) – This project was completed and grant billing finalized during fiscal year 2014. The grant reimbursement of approximately $379,000 was received in fiscal year 2015. Virginia Theatre - The completion of the Virginia Theatre renovations continued as a focus of the District’s capital plan in Fiscal Year 2014. The District completed the $5 million project from the prior year, as well as updated the projection room, and added a new digital projector. The District received notification in fiscal year 2015 of a $750,000 grant to assist with updating the sound and lighting and is scheduled to be completed in December 2015. Leonhard Recreation Center – Due in part to the receipt of a $2.5 million PARC grant in Fiscal Year 2012, the District worked and completed the $5.9 million dollar recreation center at the end of fiscal year 2014. The facility held its grand opening to the public in May 2014. Douglass Park Development – The District received a $300,000 grant to assist with the redevelopment of Douglass Park. As such, the fiscal year 2015 capital budget includes $1,000,000 for the completion of this project. Some of the amenities include additional pathways, spray ground feature, playground equipment and poured in place surfacing, exercise nodes throughout the new paths, as well as shade structures and lighting.

- 5 -
Sholem Aquatic Center – Installation of a new water play feature was completed before the start of the 2014 pool season. Debt Administration The District can issue debt to provide financing, and pay the costs associated with, the acquisition, and improvement of long-term assets and/or to make the annual debt payment on the alternative revenue bonds. It is not used to finance the District’s regular operating expenditures. The District’s primary objectives in debt management are to keep the level of indebtedness within available resources and within the total debt and payment limits established by state statutes and tax cap legislation. The legal debt limit for the District is 2.875% ($43,231,920) of the assessed valuation for total debt issued and .575% ($8,646,384) for non-referendum general obligation bonds. The District is well within these established limits. Currently, the District has $1,068,000 of non-referendum general obligation debt maturing in November 2014 and $4,970,000 of alternate revenue bonds. In Fiscal Year 2014, Moody’s Investor’s Services, Inc. gave the District an Aa3 rating citing the District’s healthy regional economy and tax base, sound financial operations supported by growing reserves and manageable debt as the main reasons for the high rating. Impact of Financial Policies on Financial Statements Many governmental entities are facing financial hardship, with increased costs outpacing revenue growth. Increases in employee compensation are soaring because of the increases in health insurance costs. The investment performance last year for the pension plans was very positive, and the District saw a decrease in the annual contribution rate for 2014 from 11.12% to 10.56%. Fortunately, the Park District updated its fund balance policy in Fall 2010 to maintain a 120-day reserve balance in the main funds. These reserve levels are monitored to ensure that they are maintained, and the District has not fallen below these levels since the policy was updated. The District invests cash that is temporarily idle in the Illinois Funds Investment Pool, the Illinois Park District Liquid Asset Fund, the Illinois Municipal Investment Fund, and certificate of deposits and money market index funds at local institutions. The District has adopted, and follows, an investment policy based on the standards recommended by the Treasurer of the State of Illinois. Due to the slow recovery from the recession, protection of principle is of prime importance with all invested funds. Additional information on the District’s cash management policies and details of the District’s investments can be found on Notes 1d, 1e, and 5 of the Notes to the Financial Statements. The District is a member of the Park District Risk Management Agency (PDRMA) which was organized by state park districts in Illinois in accordance with the terms of an intergovernmental cooperative agreement. The purpose of PDRMA is to obtain insurance coverage as a single insurable unit for the member park districts for coverage in

- 6 -
excess of self-insurance units and to administer the payment of self-insurance claims. Currently, over 140 park districts throughout the State of Illinois belong to PDRMA. Additional information on the District’s risk management activity can be found in Note 18 of the Notes to the Financial Statements.
The District participates in the Illinois Municipal Retirement Fund which is a multiple-employer public employee retirement system that acts as a common investment and administrative agent for local governments in Illinois. All employees who meet certain minimum hourly standards must participate by contributing 4.5% of their annual salary which is set by state statute. The District contributes the remaining amounts necessary to fund the system, using the actuarial basis specified by the statute. The District contributed 11.12% of salaries of covered employees during calendar year 2013 and 10.56% in 2014. Additional information on the District’s pension arrangement and activity can be found in Note 17 of the Notes to the Financial Statements.
Awards and Acknowledgments
The Government Finance Officers Association of the United States and Canada (GFOA) awarded a Certificate of Achievement for Excellence in Financial Reporting to the Champaign Park District for its comprehensive annual financial report for the fiscal year ended April 30, 2013. This was the eighteenth consecutive year that the District has received this award. In order to be awarded a Certificate of Achievement, the District must publish an easily readable and efficiently organized comprehensive annual financial report. This report must satisfy both generally accepted accounting principles and applicable legal requirements.
A Certificate of Achievement is valid for a period of one year only. We believe that our current CAFR continues to conform to the Certificate of Achievement program requirements, and we are submitting it to the GFOA to determine the eligibility for another certificate.
The preparation of this report has been made possible due to contributions from many individuals of the Administration and Finance Department. We would like to express our appreciation to everyone who assisted and contributed to the report. Credit must also be given to the Board of Commissioners for their support in maintaining the highest standards of professionalism in the management of the District’s finances.
Respectfully submitted,
Andrea N. Wallace, CPA Director of Finance


Residents of Champaign
Board of Commissioners
Executive Director
Treasurer Attorney
Director of HR, IT and
Risk
Director of Recreation
and Marketing Director of Finance
Director of Operations
and Planning
Assistant Finance
Director
Accounting Clerk
Accounts Payable
Clerk
BSW
Bresnan Center
Douglass Park
Coordinator II
Programs ManagerCUSR DirectorFacilities and Events
Manager
Virginia Theatre
DirectorCultural Art Manager
Facility Coordinator
Cultural Arts
Coordinator
BSW
Springer Center
Adult/Senior
Coordinator
Youth and Teen
Coordinator
Sports/Fitness
Coordinator
Douglass Park
Coordinator II
Receptionist I
Douglass Center
Youth Programs
Coordinator
Sports and Aquatics
Coordinator
Sports and Fitness
Coordinator
BSW
Leonhard Center
Tennis Professional
Virginia Theatre
Coordinator
Administrative Assistant
and Reservations
Horticulture SupervisorGrounds SupervisorMaintenance
Supervisor
Grounds Worker I
Special Project
Worker
Grounds
Worker I Special Project
Specialist
Grounds Specialist
Arbor Specialist
Sports Field
Worker
Horticulture
Specialist
Horticulture
Specialist
Horticulture
Specialist
Horticulture
Worker I
Trade Specialist
HVAC/Electrical
Maintenance Worker II
– Pools
Trade Specialist
Plumbing/Electrical
Trade Specialist
Mechanic
Maintenance Worker II
Trade Specialist
Carpentry
Champaign Park District
Organization Chart
Full-Time and Regular Part-Time
FY 14-15
BSW
Virginia Theatre
Grounds Worker II
Special Events/
Volunteer
Coordinator
Updated: September 8, 2014
Receptionist –
Bresnan Center
Technology Manager
Risk ManagerMarketing Manager
Graphic Designer
Department Head
Manager/Supervisor
Other Full-Time Staff
Natural Areas
Coordinator
Regular Part-Time
Staff
Fabricator
Trash/Recycling
Worker
Accounting
Assistant
Receptionist –
Leonhard Center
Preschool Director
Dance Arts Director
Adult & Senior
Program Coordinator
Receptionist Box Office Manager
Technical Manager
Director of Cultural Arts
Assistant to the Executive
Director
Administrative Specialist
Administrative
Assistant
Grounds Worker I
Development Director
HR Clerk
Special Projects
Supervisor
Park Planner II
Park Planner I
Lead Park Planner/
Landscape Architect
- 7 -

- 8 -
List of Elected and Appointed Officials
President .........................................................................................................Joseph A. Petry Vice President ................................................................................................Alvin Griggs Commissioner ................................................................................................Jane L. Solon Commissioner ................................................................................................Barbara J. Kuhl Commissioner ................................................................................................Tim McMahon Attorney .........................................................................................................Guy C. Hall Treasurer ........................................................................................................Gary G. Wackerlin Assistant to Executive Director/Secretary ....................................................Cindy Harvey Executive Director/Assistant Secretary .........................................................Joe DeLuce Director of Finance ........................................................................................Andrea Wallace Director of Cultural Arts ...............................................................................Jameel Jones Director of Recreation ....................................................................................Megan Kuhlenschmidt Director of Human Resources ........................................................................Tammy Hoggatt Director of Operations and Planning .............................................................Kevin Crump

2507 South Neil St.Champaign, Illinois 61820Phone 217.351.2000Fax 217.351.7726
CERTIFIED PUBLIC ACCOUNTANTS AND CONSULTANTS
www. mhfa.net
- 9 -
INDEPENDENT AUDITOR’S REPORT
Board of Commissioners Champaign Park District Champaign, Illinois
We have audited the accompanying financial statements of the governmental activities, the
discretely presented component unit, each major fund, and the aggregate remaining fund information of the Champaign Park District (the District), as of and for the year ended April 30, 2014, and the related notes to the financial statements, which collectively comprise the District’s basic financial statements as listed in the table of contents. Management’s Responsibility for the Financial Statements
Management is responsible for the preparation and fair presentation of these financial statements in accordance with accounting principles generally accepted in the United States of America; this includes the design, implementation, and maintenance of internal control relevant to the preparation and fair presentation of financial statements that are free from material misstatement, whether due to fraud or error. Auditor’s Responsibility
Our responsibility is to express opinions on these financial statements based on our audit. We conducted our audit in accordance with auditing standards generally accepted in the United States of America. Those standards require that we plan and perform the audit to obtain reasonable assurance about whether the financial statements are free from material misstatement.
An audit involves performing procedures to obtain audit evidence about the amounts and
disclosures in the financial statements. The procedures selected depend on the auditor’s judgment, including the assessment of the risks of material misstatement of the financial statements, whether due to fraud or error. In making those risk assessments, the auditor considers internal control relevant to the entity’s preparation and fair presentation of the financial statements in order to design audit procedures that are appropriate in the circumstances, but not for the purpose of expressing an opinion on the effectiveness of the entity’s internal control. Accordingly, we express no such opinion. An audit also includes evaluating the appropriateness of accounting policies used and the reasonableness of significant accounting estimates made by management, as well as evaluating the overall presentation of the financial statements.

- 10 -
We believe that the audit evidence we have obtained is sufficient and appropriate to provide a basis for our audit opinions. Opinions
In our opinion, the financial statements referred to above present fairly, in all material respects, the respective financial position of the governmental activities, the discretely presented component unit, each major fund, and the aggregate remaining fund information of the Champaign Park District as of April 30, 2014, and the respective changes in financial position and the respective budgetary comparison for the General Fund and Major Special Revenue Funds for the year then ended in accordance with accounting principles generally accepted in the United States of America. Other Matters Required Supplementary Information
Accounting principles generally accepted in the United States of America require that the
management’s discussion and analysis and schedule of funding progress on pages 12 through 22 and page 71, respectively, be presented to supplement the basic financial statements. Such information, although not a part of the basic financial statements, is required by the Governmental Accounting Standards Board, who considers it to be an essential part of financial reporting for placing the basic financial statements in an appropriate operational, economic, or historical context. We have applied certain limited procedures to the required supplementary information in accordance with auditing standards generally accepted in the United States of America, which consisted of inquiries of management about the methods of preparing the information and comparing the information for consistency with management’s responses to our inquiries, the basic financial statements, and other knowledge we obtained during our audit of the basic financial statements. We do not express an opinion or provide any assurance on the information because the limited procedures do not provide us with sufficient evidence to express an opinion or provide any assurance. Other Information
Our audit was conducted for the purpose of forming opinions on the financial statements that
collectively comprise the Champaign Park District’s basic financial statements. The introductory section, combining and individual major and non-major fund financial statements, and statistical section are presented for purposes of additional analysis and are not a required part of the basic financial statements.
The combining and individual major and non-major fund financial statements (Schedules 1
through 15) are the responsibility of management and were derived from and relate directly to the underlying accounting and other records used to prepare the basic financial statements. Such information has been subjected to the auditing procedures applied in the audit of the basic financial statements and certain additional procedures, including comparing and reconciling such information

- 11 -
directly to the underlying accounting and other records used to prepare the basic financial statements or to the basic financial statements themselves, and other additional procedures in accordance with auditing standards generally accepted in the United States of America. In our opinion, the combining and individual major and non-major fund financial statements are fairly stated in all material respects in relation to the basic financial statements as a whole.
The introductory and statistical sections have not been subjected to the auditing procedures
applied in the audit of the basic financial statements and, accordingly, we do not express an opinion or provide any assurance on them.
Champaign, Illinois September 08, 2014

- 12 -
Champaign Park District Management’s Discussion and Analysis
April 30, 2014 ________________________________________________________________________
Management’s Discussion and Analysis provides an overview of the Champaign Park District’s financial activities for the fiscal year ended April 30, 2014. Please read it in conjunction with the transmittal letter and the District’s financial statements which begin on page 23. Financial Highlights
The assets of the Champaign Park District exceeded its liabilities at the close of the most recent fiscal year by $52,116,454 (net position).
As of the close of the current fiscal year, the District’s governmental funds reported
combined ending fund balances of $14,378,282. Not including an amount for Non-spendable, the actual amount of Fund Balance totals $14,107,805.
Revenues totaled $16,324,806 for the District’s governmental funds. Total expenditures
were over this total by $1,636,018. At the end of the current fiscal year, unassigned fund balance for the General Fund was
$6,471,136, or 126.5% of total General Fund expenditures. The District’s total long term debt increased by $57,517 during the current fiscal year. In
July 2013, the District refunded the 2005 alternate revenue bonds, thus resulting in an overall long-term savings on interest. This net increase for the current fiscal year is a result of the unamortized bond premiums as further explained in footnote 11 on page 52.
Overview of the Financial Statements This discussion and analysis is intended to serve as an introduction to the Champaign Park District’s basic financial statements. The Champaign Park District’s basic financial statements comprise three components: 1) government-wide financial statements, 2) fund financial statements, and 3) notes to the financial statements. This report also contains supplementary information in addition to the basic financial statements themselves. Government-Wide Financial Statements. The government-wide financial statements are designed to provide readers with a broad overview of the Champaign Park District’s finances, in a manner similar to a private-sector business. The government-wide financial statements of the District include not only the Champaign Park District itself (known as the primary government), but also a legally separate nonprofit organization, the Champaign Parks Foundation, which is exclusively dedicated to supporting the District. The financial information for this component unit is reported separately from the financial information presented in the primary government.

- 13 -
The statement of net position presents information on all of the Champaign Park District’s assets and liabilities, with the difference between the two reported as net position. Over time, increases or decreases in net position may serve as a useful indicator of whether the financial position of the Champaign Park District is improving or deteriorating.
The statement of net position presents information showing how the government’s net position changed during the most recent fiscal year. All changes in net position are reported as soon as the underlying event giving rise to the change occurs, regardless of the timing of related cash flows. Thus, revenues and expenses are reported in this statement for some items that will only result in cash flows in future fiscal periods (e.g., uncollected taxes and earned but unused vacation leave).
Starting in fiscal year 2008, the activities of the Champaign Parks Foundation are included in the audit, which is reflected in the Component Unit reference in the financial statements. The governmental activities of the Champaign Park District include general government, recreational and cultural opportunities and land and park development. The government-wide financial statements can be found on pages 23 through 25 of this report. Fund Financial Statements. A fund is a grouping of related accounts that is used to maintain control over resources that have been segregated for specific activities or objectives. The Champaign Park District, like other state and local governments, uses fund accounting to ensure and demonstrate compliance with finance-related legal requirements. All of the funds of the Champaign Park District can be divided into two categories: governmental funds and fiduciary funds. Governmental Funds. Governmental funds are used to account for essentially the same functions reported as governmental activities in the government-wide financial statements. However, unlike government-wide financial statements, governmental fund financial statements focus on near-term inflows and outflows of spendable resources, as well as on balances of spendable resources available at the end of the fiscal year. Such information may be useful in evaluating a government’s near-term financing requirements. Because the focus of governmental funds is narrower than that of the government-wide financial statements, it is useful to compare the information presented for governmental funds with similar information presented for governmental activities in the government-wide financial statements. By doing so, readers may better understand the long-term impact of the government’s near-term financing decisions. Both the governmental fund balance sheet and the governmental fund statement of revenues, expenditures, and changes in fund balances provide a reconciliation to facilitate this comparison between governmental funds and governmental activities. The Champaign Park District maintains sixteen individual governmental funds. Information is presented separately in the governmental fund balance sheet and in the governmental fund statement of revenues, expenditures, and changes in fund balances for the General Fund, Recreation Fund, Museum Fund, Special Recreation Fund, and the Bond Proceeds Fund, all of which are considered to be major funds.

- 14 -
The Champaign Park District adopts an annual appropriated budget for all of its funds. A budgetary comparison statement has been provided for the funds to demonstrate compliance with this budget. The basic governmental fund financial statements can be found on pages 26, 28 and 30 through 33 of this report. Proprietary Funds. The Champaign Park District maintains no proprietary funds (also called Enterprise Funds). Enterprise Funds are presented as business-type activities in the government-wide financial statements. In fiscal year 2006, there was an active proprietary fund regarding the tennis center operations, but in fiscal year 2007 and beyond, the tennis center operations were included in the Recreation Fund and there is no longer a proprietary fund. Fiduciary Funds. Fiduciary funds are used to account for resources held for the benefit of parties outside the government. Fiduciary funds are not reflected in the government-wide financial statements because the resources of those funds are not available to support the Champaign Park District’s own programs. The Champaign Park District maintains one fiduciary fund. The Activity Fund is used to account for money held in trust for groups affiliated with but not controlled by the Park District. The accounting used for fiduciary funds is much like that used for proprietary funds. The basic fiduciary fund financial statement can be found on page 34 of this report. Notes to the Financial Statements. The notes provide additional information that is essential to a full understanding of the data provided in the government-wide and fund financial statements. The notes to the financial statements can be found on pages 35-70 of this report. Other Information. In addition to the basic financial statements and accompanying notes, this report also presents certain required supplementary information. The required supplementary information includes information concerning the Champaign Park District’s progress in funding its obligation to provide pension benefits to its employees. The other supplementary schedules contain combined financial information and budget to actual comparisons for non-major funds, information about the legal debt margin calculations and assessed valuations, tax rates, taxes extended and collected information about the property tax funding system. Required supplementary and other supplementary information can be found on page 71 and pages 72-105 of this report. Government-Wide Financial Analysis As noted earlier, net position may serve over time as a useful indicator of a government’s financial position. In the case of the Champaign Park District, assets exceeded liabilities by $52,116,454 at the close of the most recent fiscal year. The largest portion of the Champaign Park District’s net position (68 percent) reflects its investment in capital assets (e.g., land, land improvements, buildings, machinery, and equipment); less any related debt used to acquire those assets that is still outstanding. The Champaign Park District uses these capital assets to provide services to citizens; consequently, these assets are not available for future spending. Although the Champaign Park District’s investment in its capital assets is reported net of related debt, it should be noted that the resources needed to repay this debt must be provided from other sources, since the capital assets themselves cannot be used to liquidate these liabilities.

- 15 -
The following table reflects the condensed Statement of Net Position.
Champaign Park District’s Net Position (in thousands)
GovernmentalActivities
2014 2013
Current and Other Assets 18,949.9$ 19,661.8$ Capital Assets 41,247.8 35,313.3
Total Assets 60,197.7 54,975.1
Deferred Outflow of Resources 223.4 -
Long-Term Liabilities 5,345.4 5,287.9 Other Liabilities 2,959.3 3,054.4
Total Liabilities 8,304.7 8,342.3
Net PositionNet Investment in
Capital Assets 35,442.8 30,293.3 Restricted 2,771.0 3,332.7 Unresticted 13,902.6 13,006.8
Total Net Position 52,116.4$ 46,632.8$
The District implemented GASB Statement No. 65 as noted in footnote 1 on page 35. As a result of this change, combined with the refunding of the 2005 alternate revenue bonds in July 2013, the Deferred Outflows of Resources was created for the current fiscal year. Information related to the refunding of the bond series can be found in footnote 11 beginning on page 52. The unrestricted net position ($13,902,641) may be used to meet the government’s ongoing obligations to citizens, creditors, as well as future planned capital projects. At the end of the current fiscal year, the District is able to report positive balances in all three categories of net position for its governmental activities. Regarding the following Change in Net Position Table, the Net Position of the District increased $5,483,632 in the fiscal year, mostly due to the funds invested in capital projects over the last 12 months, including the work at the Virginia Theatre, and most recently the completion of the new Leonhard Recreation Center which was completed in April 2014. The following table summarizes the revenues and expenses of the District’s activities:

- 16 -
Champaign Park District’s Change in Net Position (in thousands)
GovernmentalActivities
2014 2013Revenues:
Program RevenuesCharges for Services 2,393.7$ 2,297.0$ Oper. Grants and Contr. 143.3 87.2 Capital Grants and Contr. 2,695.8 1,383.4
General RevenuesProperty Taxes 11,531.6 10,788.1 Interest Income 17.2 40.7 Intergovernmental 275.0 262.4 Special Receipts 188.6 224.2 Other 68.0 64.6
Total Revenues 17,313.2 15,147.6 Expenses:
Culture and Recreation 11,651.1 9,907.6 Interest on Debt 178.5 226.5
Total Expenses 11,829.6 10,134.1 Change in Net Position 5,483.6 5,013.6 Beginning Net Position 46,632.8 41,619.2 Ending Net Position 52,116.4$ 46,632.8$
Revenues: Revenues for the District are generated from a number of different sources and for the most part are dependent on different financial factors. The majority of revenue is derived from property taxes, as illustrated in the chart below. Property Taxes, which account for 79% of the District’s operating revenue, or 66.6% of overall fiscal year 2014 revenues and are a stable source of revenues, not dependent on economic trends and fluctuations. The District’s charges for services come mainly from, but is not limited to, the District’s recreation and cultural programs, including sports, cultural arts, membership fees and facility rentals, and the Virginia Theatre events.

- 17 -
Overall, revenues were 14.3% ($2,165,572) higher than the prior year. General revenues were 6.2% ($700,387) higher due to an increase in the property tax revenues. The increase in property taxes for Revenue Year (RY) 14, payable in Fiscal Year (FY) 15, which are partially recognized in FY 14 on Exhibit B, increased partly due to the refunding of the 2005 bonds. The District previously filed the debt service abatement based on the original 2005 bond issue. Since these bonds were refunded for a savings, the excess abatement was added to the District’s debt service revenues for RYs 14 and 15. The additional increase related to normal CPI increase of 1.5% as well as new construction and recovered enterprise zone assessed values coming back on the tax rolls for RY15, both of which are excluded from tax caps. Charges for services increased as the major construction project started in the prior year at the Virginia Theatre was completed and therefore the theatre was open for the majority of the fiscal year. Capital Grant revenue in FY 13 was $1,383,000 and in FY 14 the amount reflected was $2,695,833. The District received a $2.5 million capital grant for the construction of the new Leonhard Recreation Center during the current fiscal year. This project was complete as of the end of the year, therefore the entire grant revenue was recognized in Exhibit B. Expenses: Total expenses for FY 14 increased 16.8% ($1,695,546) over the prior year. While the District experienced a savings in interest on debt of 21% ($47,972), personnel costs increased 8.2% ($454,636) mostly due to normal annual merit increase and health insurance premium increases. Contractual services increased 32.5% (449,320) partially due to the Virginia Theatre being opened after construction for nearly the entire fiscal year, as well as increased professional fees related to ongoing as well as future planning and capital projects. The remaining increase relates to non-capital assets purchased to furnish the new recreation center that fell below the capitalization thresholds of the District, and therefore were expensed in the current year. Personnel Costs (Salary, Wages and Fringe Benefits) historically account for approximately 50% of the District’s total expenses, which is within the industry norm, and this year the percentage is at the high end (50.5%), which is down in comparison with the prior year. A breakdown by classification of expenses follows.

- 18 -
Financial Analysis of the Government’s Funds As noted earlier, the Champaign Park District uses fund accounting to ensure and demonstrate compliance with finance-related legal requirements. Governmental Funds. The focus of the Champaign Park District’s governmental funds is to provide information on near-term inflows, outflows, and balances of spendable resources. Such information is useful in assessing the Champaign Park District’s financing requirements. In particular, unassigned fund balance may serve as a useful measure of a government’s net resources available for spending at the end of the fiscal year. As of the end of the current fiscal year, the Champaign Park District’s governmental funds reported combined ending fund balances of $14,378,282. A portion of this amount, $5,333,894, constitutes unassigned fund balance, which is available for spending at the government’s discretion. Not including non-spendable amounts the actual amount of Fund Balance totals $14,107,805. The total combined fund balance for the fiscal year ended April 30, 2014 is $1.4 million less than the prior year due to using excess reserves for the construction costs for the new recreation center rather than issuing additional debt for the project, which is mostly reflected in the Recreation Fund. The General fund is the main operating fund of the Champaign Park District. At the end
of the current fiscal year, total fund balance was $6,473,440 and is mostly unassigned. The unassigned fund balance represents 126.5% of total General Fund expenditures (including both operating and capital expenditures), and is an increase over the prior year of $328,136 due to actual expenditures coming in under the total estimated budget.
- 19 -
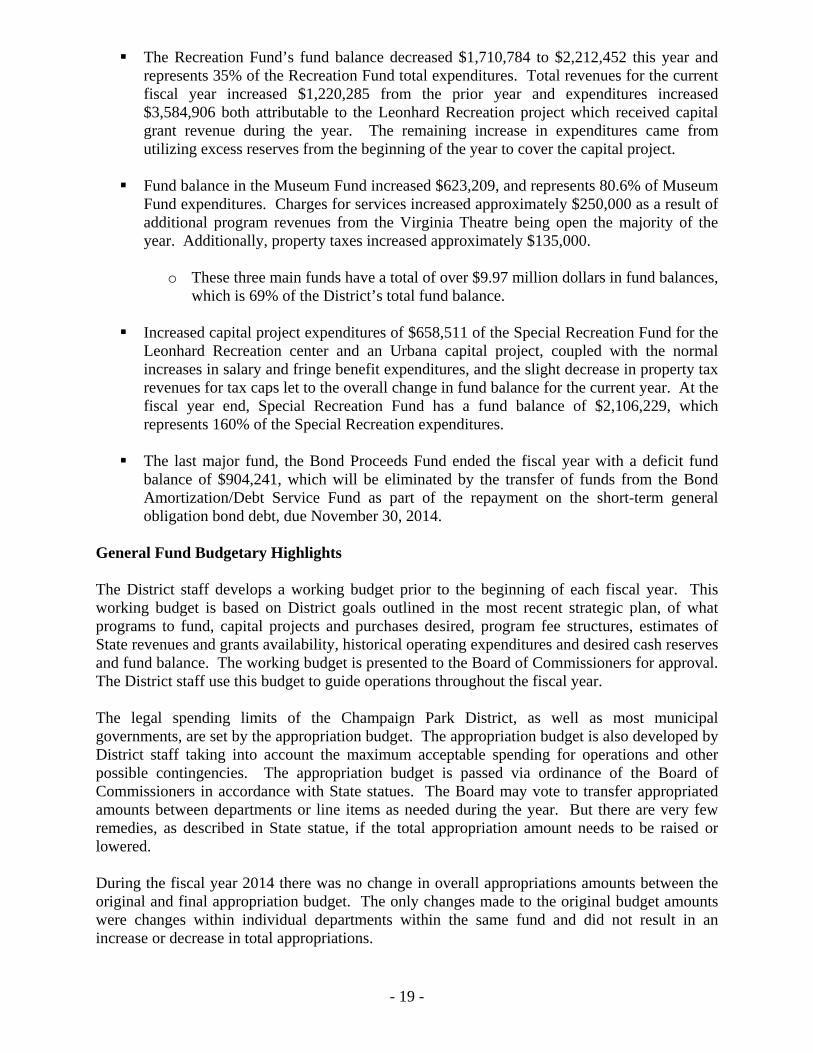
The Recreation Fund’s fund balance decreased $1,710,784 to $2,212,452 this year and represents 35% of the Recreation Fund total expenditures. Total revenues for the current fiscal year increased $1,220,285 from the prior year and expenditures increased $3,584,906 both attributable to the Leonhard Recreation project which received capital grant revenue during the year. The remaining increase in expenditures came from utilizing excess reserves from the beginning of the year to cover the capital project.
Fund balance in the Museum Fund increased $623,209, and represents 80.6% of Museum
Fund expenditures. Charges for services increased approximately $250,000 as a result of additional program revenues from the Virginia Theatre being open the majority of the year. Additionally, property taxes increased approximately $135,000.
o These three main funds have a total of over $9.97 million dollars in fund balances,
which is 69% of the District’s total fund balance. Increased capital project expenditures of $658,511 of the Special Recreation Fund for the
Leonhard Recreation center and an Urbana capital project, coupled with the normal increases in salary and fringe benefit expenditures, and the slight decrease in property tax revenues for tax caps let to the overall change in fund balance for the current year. At the fiscal year end, Special Recreation Fund has a fund balance of $2,106,229, which represents 160% of the Special Recreation expenditures.
The last major fund, the Bond Proceeds Fund ended the fiscal year with a deficit fund balance of $904,241, which will be eliminated by the transfer of funds from the Bond Amortization/Debt Service Fund as part of the repayment on the short-term general obligation bond debt, due November 30, 2014.
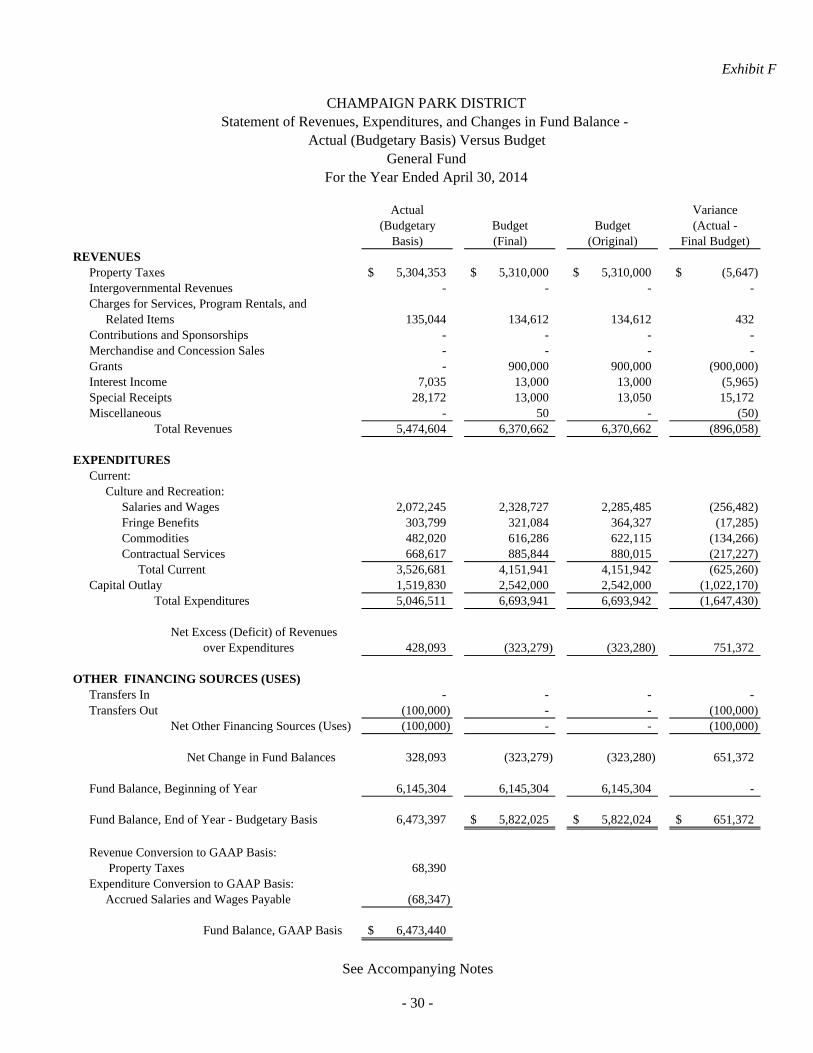
General Fund Budgetary Highlights The District staff develops a working budget prior to the beginning of each fiscal year. This working budget is based on District goals outlined in the most recent strategic plan, of what programs to fund, capital projects and purchases desired, program fee structures, estimates of State revenues and grants availability, historical operating expenditures and desired cash reserves and fund balance. The working budget is presented to the Board of Commissioners for approval. The District staff use this budget to guide operations throughout the fiscal year. The legal spending limits of the Champaign Park District, as well as most municipal governments, are set by the appropriation budget. The appropriation budget is also developed by District staff taking into account the maximum acceptable spending for operations and other possible contingencies. The appropriation budget is passed via ordinance of the Board of Commissioners in accordance with State statues. The Board may vote to transfer appropriated amounts between departments or line items as needed during the year. But there are very few remedies, as described in State statue, if the total appropriation amount needs to be raised or lowered. During the fiscal year 2014 there was no change in overall appropriations amounts between the original and final appropriation budget. The only changes made to the original budget amounts were changes within individual departments within the same fund and did not result in an increase or decrease in total appropriations.

- 20 -
In the General Fund, the District spent $1.6 million below the total $6.7 million budgeted. Salaries and wages in the General Fund were $256,482 under budget as a result of budgeting for part-time positions for the maximum time expected, as well as vacancies in full-time positions that occurred throughout the year. Commodities were $134,266 under budget and contractual services were $217,227 under budget due to conservative budgeting and spending practices. There were no major changes in department structure from the prior year related to the General Fund. Capital Expenditures ended up $1,022,170 under budget which reflects spending 59.8% of the total capital budget. The majority of the $1,519,830 spent in capital was for the new recreation center. Capital Asset and Debt Administration Capital Assets. The Champaign Park District’s investment in capital assets for its governmental activities as of April 30, 2014 amounts to $41,247,799 (net of accumulated depreciation). This investment in capital assets includes land, land improvements, playground equipment, buildings and systems, and machinery and equipment. The following Comparative Statement of Capital Assets, net of depreciation shows the change in assets for the governmental activities.
Comparative Statement of Capital Assets
Governmental
Activities
2014 2013Land 7,840,578$ 7,840,578$ Buildings & Improvements 32,076,513 26,634,974 Equipment 1,330,708 837,791
41,247,799 35,313,343
Buildings and Improvements increased approximately $6.6 million before depreciation due to the addition of a new recreation center, along with improvements to the Kaufman Lake road, and projects at the Virginia Theatre that were completed during the current fiscal year. Equipment also increased as playground features and equipment was purchased for not only the new recreation center, but some parks. Capital expenditures in 2015 are budgeted for over $3.8 million, which is a decrease of over $5.5 million from the amount budgeted for capital in FY 2014. The capital projects which are due to be completed in FY 2015 include the redevelopment of Douglass Park ($1,000,000), along with multiple playground replacements and replacements of vehicles and equipment. Furthermore, the installation of lighting and sound at the Virginia Theatre ($750,000) will be completed before December 2015, and the Kaufman Lake North Roadway project ($200,000) was finalized in early FY 2015. Additional information on the Champaign Park District’s capital assets can be found in Note 9 in the Notes to Financial Statements of this report. Long-Term Debt. At the end of the current fiscal year, the Champaign Park District had long-term debt outstanding of $5,345,406, including $4,970,000 of alternate revenue debt with a 12 year payback schedule with the second payment on the 2013 Series, along with the final payment on the 2005 series, both due December 2014. In addition, the District has $213,090 of compensated absences payable and unamortized bond premiums of $102,918.

- 21 -
The Champaign Park District’s total debt increased by $57,515 (1.1%) during the current fiscal year, mainly due to the net effect of refunding the 2005 alternate revenue bonds. Additional information on the District’s long-term debt can be found in Notes 10 and 11 in the Notes to Financial Statements of this report. Economic Factors and Next Year’s Budgets and Rates The equalized assessed value (EAV) of taxable property in the District for 2013 levy year was $1,503,718,963 which represents one-third market value. Residential and commercial properties make up nearly 99% of the EAV for the 2013 levy year. The assessed value decreased 1.67% in this last year. With the exception of this year, in the past 5 years the District’s assessed valuation has decreased at a rate of less than 1% per year. Because of the decrease in the equalized assessed valuation, the tax rate has actually increased for the third year in a row. In a good economy, the assessed valuation increases each year which has helped to offset the property tax cap limits imposed by the Property Tax Extension Limitation Law. This law limits the increase in the District’s annual property tax levy to the lesser of 5% or the increase in the national Consumer Price Index plus any new or improved property within the District boundaries. Property Taxes account for 79% of the District’s operating revenues. The District does not receive any state or local sales tax revenues. The focus for budget year 2014/2015 centers on the priorities contained in the District’s strategic plan along with ensuring that with the current economic conditions, we are fiscally prudent in projecting revenue and that budgeted expenses are conservative. The intent of the budget is to maintain our current level of standard and service while taking a critical look at existing services in regard to trends, redundancy, efficiencies, and cost. Much of the budget focus will be on the continued improvements to the facilities and equipment of the District, as well as the planned redevelopment of Douglass Park and securing funding for the Spalding Park conceptual design. It should be noted that the targeted minimum reserve goals (120-day) have been reached in the operating funds, other than the Museum Fund. The operating and capital budgets will be tight in the next few years, especially considering the current economic situation. Operating costs such as health benefits, fuel and utility costs and program supplies are projected to increase much more than the average rate of inflation, especially with the recent changes to health care reform. The District was fortunate in that the increase for fiscal year 2015 plan year was much less than the national average, however that may not be so for the next plan renewal. Additionally, the effect of the required minimum wage increase will be felt in the operating budgets. Based on preliminary calculations, it is estimated this change would result in an increase of approximately $300,000, including payroll taxes. The capital program will be limited this coming year, as well as future years, as a portion of the bond proceeds that were formerly used for capital purchases must now be used for the debt payment on the alternate revenue bonds that were issued to fund the construction of the new aquatic center. The other alternative is to set aside excess reserves for future major capital projects, which would require board approval. There are currently no known contingencies that would force a major change in the District’s budgeting, spending, or taxation.

- 22 -
Requests for Information This financial report is designed to provide a general overview of the Champaign Park District’s finances for all those with an interest in the government’s finances. Questions concerning any of the information provided in this report or requests for additional financial information should be addressed to the Director of Finance, Champaign Park District, 706 Kenwood Road, Champaign IL 61821.

PrimaryGovernment
Governmental ComponentActivities Unit
ASSETSCash and Cash Equivalents 10,830,344$ 604,824$ Cash and Cash Equivalents - Restricted 233,001 - Receivables:
Accounts Receivable 116,281 - Intergovernmental 45,388 - Property Taxes 6,039,899 - Grants Receivable 1,664,508 - Promises to Give - 10,000
Prepaid Expenses 20,477 - Capital Assets, Not Being Depreciated 7,840,578 - Capital Assets, Net of Accumulated Depreciation 33,407,221 -
Total Assets 60,197,697 614,824
DEFERRED OUTFLOWS OF RESOURCESDeferred Charge on Refunding 223,456 -
LIABILITIES
Accrued Salaries 284,752 - Accounts Payable 1,169,448 72,032
Accrued Interest 54,975 -
Unearned Revenue 382,118 -
Short-Term Bond Payable 1,068,000 -
Non-Current Liabilities:Due Within One Year 607,739 - Due in More Than One Year 4,737,667 -
Total Liabilities 8,304,699 72,032
NET POSITIONNet Investment in Capital Assets 35,442,800 - Restricted For:
Unspent Tax Levy Allocations 1,328,789 - Capital Projects 359,787 - Debt Service 766,124 - Donor Restricted Purposes 66,313 462,456Other (Non-Expendable) 250,000 -
Unrestricted 13,902,641 80,336
Total Net Position 52,116,454$ 542,792$
- 23 -
Exhibit A
CHAMPAIGN PARK DISTRICTStatement of Net Position
April 30, 2014
See Accompanying Notes

Exhibit B
Net (Expense)Revenues and
Change inNet Position
Operating CapitalCharges Grants and Grants and Governmental
Expenses for Services Contributions Contributions ActivitiesGovernmental Activities:
Culture and Recreation (11,651,125)$ 2,393,696$ 143,307$ 2,695,833$ (6,418,289)$ Interest on Debt (178,502) - - - (178,502)
Total Governmental Activities (11,829,627)$ 2,393,696$ 143,307$ 2,695,833$ (6,596,791)
General Revenues:Property Taxes 11,531,594 Corporate Personal Property Replacement Tax 275,043 Special Receipts 188,633 Interest Income 17,195 Other 67,958 Total General Revenues 12,080,423
Change in Net Position 5,483,632
Net Position - Beginning of Year 46,632,822
Net Position - End of Year 52,116,454$
- 24-
Program Revenues
CHAMPAIGN PARK DISTRICTStatement of Activities
For the Year Ended April 30, 2014
See Accompanying Notes

Temporarily PermanentlyUnrestricted Restricted Restricted Total
Support and RevenueContributions -$ 137,254$ -$ 137,254$ Contributions - In-Kind 64,337 - - 64,337 Grants - - - - Interest and Dividends 2,373 - - 2,373 Net Assets Released from Restrictions 174,540 (174,540) - -
Total Support and Revenue 241,250 (37,286) - 203,964
ExpensesProgram Services 182,683 - - 182,683 Supporting Services:
Management and General 38,624 - - 38,624 Fund Raising 56,117 - - 56,117
Total Supporting Services 94,741 - - 94,741 Total Expenses 277,424 - - 277,424
Change in Net Assets (36,174) (37,286) - (73,460)
Net Assets, Beginning of Year, As Originally Reported 116,510 499,742 - 616,252
Prior Period Adjustment - (68,119) 68,119 -
Net Assets, Beginning of Year, As Restated 116,510 431,623 68,119 616,252
Net Assets, End of Year 80,336$ 394,337$ 68,119$ 542,792$
- 25 -
Exhibit C
CHAMPAIGN PARK DISTRICTStatement of Activities - Component Unit
For the Year Ended April 30, 2014
See Accompanying Notes

All Other Special Bond (Non-Major) Total
General Recreation Museum Recreation Proceeds Governmental GovernmentalFund Fund Fund Fund Fund Funds Funds
Cash and Cash Equivalents 4,403,743$ 1,749,040$ 946,422$ 1,829,926$ -$ 1,901,213$ 10,830,344$ Cash and Cash Equivalents - Restricted - - - - 233,001 - 233,001 Receivables:
Accounts Receivable - - - - - 116,281 116,281 Intergovernmental - - - - - 45,388 45,388 Property Taxes 5,218,735 1,797,249 1,205,126 596,598 - 2,584,758 11,402,466
Prepaid Items 2,304 11,437 6,405 331 - - 20,477 Total Assets 9,624,782$ 3,557,726$ 2,157,953$ 2,426,855$ 233,001$ 4,647,640$ 22,647,957$
LIABILITIES, DEFERRED INFLOWS OF RESOURCES, AND FUND BALANCESLIABILITIES
Accrued Salaries Payable 132,149$ 61,263$ 42,631$ 12,256$ -$ 36,453$ 284,752$ Accounts Payable 556,114 172,123 204,492 21,763 66,452 148,504 1,169,448 Accrued Interest - - - - 2,790 - 2,790 Bonds Payable - - - - 1,068,000 - 1,068,000 Unearned Revenue 8,804 266,529 57,846 5,899 - 43,040 382,118
Total Liabilities 697,067 499,915 304,969 39,918 1,137,242 227,997 2,907,108
DEFERRED INFLOWS OF RESOURCESUnavailable Revenue - Property Taxes 2,454,275 845,359 566,711 280,708 - 1,215,514 5,362,567
FUND BALANCESNon-Spendable:
Prepaid Items 2,304 11,437 6,405 331 - - 20,477 Permanent Fund - - - - - 250,000 250,000
Restricted - - - - 233,001 2,754,014 2,987,015 Committed - - - - - 200,115 200,115 Assigned - 2,201,015 1,279,868 2,105,898 - - 5,586,781 Unassigned 6,471,136 - - - (1,137,242) - 5,333,894
Total Fund Balances 6,473,440 2,212,452 1,286,273 2,106,229 (904,241) 3,204,129 14,378,282 Total Liabilities, Deferred Inflows of Resources, and Fund Balances 9,624,782$ 3,557,726$ 2,157,953$ 2,426,855$ 233,001$ 4,647,640$ 22,647,957$
CHAMPAIGN PARK DISTRICT
- 26 -
April 30, 2014Governmental Funds
Balance Sheet
Exhibit D
ASSETS
Major Funds
See Accompanying Notes

Total Fund Balance, Governmental Funds 14,378,282$
Grants Receivable from Other Governments 1,664,508
Property Taxes Receivable Not Earned and Not Received (5,362,567)
Capital Assets, Net of Depreciation Used in Governmental Activities 41,247,799
Accrued Interest on Long-Term Debt (52,185)
Unavailable Revenue for Property Taxes Not Received 5,362,567
Net Pension Obligation (59,398)
Bonds Payable (4,970,000)
Unamortized Premium on Bonds (102,918)
Deferred Outflow of Resources - Deferred Charge on Refunding 223,456
Accrued Compensated Absences Related to Governmental Activities (213,090)
Net Position of Governmental Activities 52,116,454$
Exhibit D-1
- 27 -
CHAMPAIGN PARK DISTRICTReconciliation of the Balance Sheet - Governmental Funds
to the Statement of Net PositionApril 30, 2014
See Accompanying Notes

Special Bond All Other TotalGeneral Recreation Museum Recreation Proceeds (Non-Major) Governmental
Fund Fund Fund Fund Fund Governmental Funds FundsREVENUES
Property Taxes 5,372,743$ 1,782,509$ 1,163,111$ 820,901$ -$ 2,392,330$ 11,531,594$ Intergovernmental Revenues - - - - - 275,043 275,043 Charges for Services, Program Rentals, and Related Items 135,044 1,375,564 607,291 100,302 - 1,272 2,219,473 Contributions and Sponsorships - 3,450 45,661 - - 81,515 130,626 Merchandise and Concession Sales - 107,043 67,180 - - - 174,223 Grants - 1,251,000 259,005 2,656 - 207,400 1,720,061 Interest Income 7,035 3,944 808 2,338 91 2,979 17,195 Special Receipts 28,172 10,410 29,552 4,218 - 116,281 188,633 Miscellaneous - 21,735 46,223 - - - 67,958
Total Revenues 5,542,994 4,555,655 2,218,831 930,415 91 3,076,820 16,324,806
EXPENDITURESCurrent:
Culture and Recreation:Salaries and Wages 2,140,592 1,451,818 730,584 333,397 - 46,127 4,702,518 Fringe Benefits 303,799 117,834 59,717 68,617 - 711,845 1,261,812 Commodities 482,020 600,497 226,074 35,814 - 17,360 1,361,765 Contractual Services 668,617 261,714 489,203 127,434 3,597 282,037 1,832,602
Total Current 3,595,028 2,431,863 1,505,578 565,262 3,597 1,057,369 9,158,697 Capital Outlay 1,519,830 3,834,576 90,044 751,012 660,422 1,287,389 8,143,273 Debt Service:
Principal - - - - 375,000 - 375,000 Interest and Fees - - - - 190,575 - 190,575 Bond Issuance Costs - - - - 93,279 - 93,279
Total Expenditures 5,114,858 6,266,439 1,595,622 1,316,274 1,322,873 2,344,758 17,960,824 Net Excess (Deficit) of Revenues Over Expenditures 428,136 (1,710,784) 623,209 (385,859) (1,322,782) 732,062 (1,636,018)
OTHER FINANCING SOURCES (USES)Transfers In - - - - 1,060,660 100,000 1,160,660 Transfers Out (100,000) - - - - (1,060,660) (1,160,660) Issuance of Refunding Bonds - - - - 4,670,000 - 4,670,000 Payment to Refunded Bond Escrow Agent - - - - (4,589,738) - (4,589,738) Premium on Refunding Bonds Issued - - - - 110,958 - 110,958
Net Other Financing Sources (Uses) (100,000) - - - 1,251,880 (960,660) 191,220
NET CHANGE IN FUND BALANCES 328,136 (1,710,784) 623,209 (385,859) (70,902) (228,598) (1,444,798)
FUND BALANCE, BEGINNING OF YEAR 6,145,304 3,923,236 663,064 2,492,088 (833,339) 3,432,727 15,823,080
FUND BALANCE, END OF YEAR 6,473,440$ 2,212,452$ 1,286,273$ 2,106,229$ (904,241)$ 3,204,129$ 14,378,282$
- 28 -
Governmental Funds
CHAMPAIGN PARK DISTRICTStatement of Revenues, Expenditures, and Changes in Fund Balances
For the Year Ended April 30, 2014
Exhibit E
Major Funds
See Accompanying Notes

Net Change in Fund Balances, Total Governmental Funds (1,444,798)$
Accrued Grant Revenue Change from Beginning of Year 802,720
Contributed Capital Assets Do Not Provide or UtilizeCurrent Financial Resources 185,733
Remove Expenditures for Capital Assets 7,292,396
Loss on Disposal of Capital Assets (64,157)
Include Depreciation Expense (1 479 516)
Governmental Funds to the Statement of ActivitiesFor the Year Ended April 30, 2014
Exhibit E-1
CHAMPAIGN PARK DISTRICTReconciliation of the Statement of
Revenues, Expenditures, and Changes in Fund Balances -
Include Depreciation Expense (1,479,516)
Remove Expenditure for Bond Payment 375,000
Accrued Interest on Long Term Debt Change from Beginning of Year 25,315
Activity Related to Debt RefundingRemove Payment to Refunded Bond Escrow Agent 4,589,738 Remove Issuance of Refunding Bonds Other Financial Resources (4,670,000) Remove Premium on Refunding Bonds Issued Other Financial Resources (110,958) Amortization of Premium on Bonds and Deferred Outflow
of Resources - Deferred Charge on Refunding (13,242)
Accrued Compensated Absences Change from Beginning of Year (4,599)
Change in Net Position of Governmental Activities 5,483,632$
- 29 -
See Accompanying Notes
Actual Variance(Budgetary Budget Budget (Actual -
Basis) (Final) (Original) Final Budget)REVENUES
Property Taxes 5,304,353$ 5,310,000$ 5,310,000$ (5,647)$ Intergovernmental Revenues - - - - Charges for Services, Program Rentals, and
Related Items 135,044 134,612 134,612 432 Contributions and Sponsorships - - - - Merchandise and Concession Sales - - - - Grants - 900,000 900,000 (900,000) Interest Income 7,035 13,000 13,000 (5,965) Special Receipts 28,172 13,000 13,050 15,172 Miscellaneous - 50 - (50)
Total Revenues 5,474,604 6,370,662 6,370,662 (896,058)
EXPENDITURESCurrent:
Culture and Recreation:Salaries and Wages 2,072,245 2,328,727 2,285,485 (256,482) Fringe Benefits 303,799 321,084 364,327 (17,285) Commodities 482,020 616,286 622,115 (134,266) Contractual Services 668,617 885,844 880,015 (217,227)
Total Current 3,526,681 4,151,941 4,151,942 (625,260) Capital Outlay 1,519,830 2,542,000 2,542,000 (1,022,170)
Total Expenditures 5,046,511 6,693,941 6,693,942 (1,647,430)
Net Excess (Deficit) of Revenuesover Expenditures 428,093 (323,279) (323,280) 751,372
OTHER FINANCING SOURCES (USES)Transfers In - - - - Transfers Out (100,000) - - (100,000)
Net Other Financing Sources (Uses) (100,000) - - (100,000)
Net Change in Fund Balances 328,093 (323,279) (323,280) 651,372
Fund Balance, Beginning of Year 6,145,304 6,145,304 6,145,304 -
Fund Balance, End of Year - Budgetary Basis 6,473,397 5,822,025$ 5,822,024$ 651,372$
Revenue Conversion to GAAP Basis: Property Taxes 68,390
Expenditure Conversion to GAAP Basis:Accrued Salaries and Wages Payable (68,347)
Fund Balance, GAAP Basis 6,473,440$
Exhibit F
- 30 -
CHAMPAIGN PARK DISTRICTStatement of Revenues, Expenditures, and Changes in Fund Balance -
Actual (Budgetary Basis) Versus BudgetGeneral Fund
For the Year Ended April 30, 2014
See Accompanying Notes

Actual Variance(Budgetary Budget Budget (Actual -
Basis) (Final) (Original) Final Budget)
REVENUESProperty Taxes 1,689,748$ 1,690,000$ 1,690,000$ (252)$ Intergovernmental Revenues - - - - Charges for Services, Program Rentals and
Related Items 1,375,564 1,590,372 1,590,372 (214,808) Contributions and Sponsorships 3,450 3,950 3,950 (500) Merchandise and Concession Sales 107,043 150,160 150,160 (43,117) Grants 1,251,000 1,631,000 1,630,000 (380,000) Interest Income 3,944 3,000 3,000 944 Special Receipts 10,410 8,930 9,930 1,480 Miscellaneous 21,735 17,110 17,110 4,625
Total Revenues 4,462,894 5,094,522 5,094,522 (631,628)
EXPENDITURESCurrent:
Culture and Recreation:Salaries and Wages 1,426,106 1,644,307 1,643,618 (218,201) Fringe Benefits 117,834 130,600 148,300 (12,766) Commodities 600,497 751,752 778,171 (151,255) Contractual Services 261,714 370,369 327,840 (108,655)
Total Current 2,406,151 2,897,028 2,897,929 (490,877)
Capital Outlay 3,834,576 4,158,000 4,158,000 (323,424)
Total Expenditures 6,240,727 7,055,028 7,055,929 (814,301)
Net Excess (Deficit) of Revenues
over Expenditures (1,777,833) (1,960,506) (1,961,407) 182,673
OTHER FINANCING SOURCES (USES)
Transfers In - - - -
Transfers Out - - - -
Net Other Financing Sources (Uses): - - - -
Net Change in Fund Balances (1,777,833) (1,960,506) (1,961,407) 182,673
Fund Balance, Beginning of Year 3,923,236 3,923,236 3,923,236 -
Fund Balance, End of Year - Budgetary Basis 2,145,403 1,962,730$ 1,961,829$ 182,673$
Revenue Conversion to GAAP Basis:Property Taxes 92,761
Expenditure Conversion to GAAP Basis:Accrued Salaries and Wages Payable (25,712)
Fund Balance, GAAP Basis 2,212,452$
Recreation FundFor the Year Ended April 30, 2014
- 31 -
Exhibit G
CHAMPAIGN PARK DISTRICTStatement of Revenues, Expenditures, and Changes in Fund Balance -
Actual (Budgetary Basis) Versus Budget
See Accompanying Notes

Actual Variance(Budgetary Budget Budget (Actual -
Basis) (Final) (Original) Final Budget)REVENUES
Property Taxes 1,067,847$ 1,031,000$ 1,031,000$ 36,847$ Intergovernmental Revenues - - - - Charges for Services, Program Rentals, and
Related Items 607,291 833,558 833,558 (226,267) Contributions and Sponsorships 45,661 39,025 39,025 6,636 Merchandise and Concession Sales 67,180 76,250 76,250 (9,070) Grants 259,005 258,950 258,950 55 Interest Income 808 3,000 3,000 (2,192) Special Receipts 29,552 27,185 27,185 2,367 Miscellaneous 46,223 95,350 95,350 (49,127)
Total Revenues 2,123,567 2,364,318 2,364,318 (240,751)
EXPENDITURESCurrent:
Culture and Recreation:Salaries and Wages 712,869 742,906 712,380 (30,037) Fringe Benefits 59,717 68,745 78,105 (9,028) Commodities 226,074 228,662 248,066 (2,588)
Contractual Services 489,203 619,383 621,346 (130,180) Total Current 1,487,863 1,659,696 1,659,897 (171,833)
Capital Outlay 90,044 90,200 90,000 (156) Total Expenditures 1,577,907 1,749,896 1,749,897 (171,989)
Net Excess (Deficit) of Revenuesover Expenditures 545,660 614,422 614,421 (68,762)
OTHER FINANCING SOURCES (USES)Transfers In - - - -
Transfers Out - - - -
Net Other Financing Sources (Uses): - - - -
Net Change in Fund Balances 545,660 614,422 614,421 (68,762)
Fund Balance, Beginning of Year 663,064 663,064 663,064 -
Fund Balance, End of Year - Budgetary Basis 1,208,724 1,277,486$ 1,277,485$ (68,762)$
Revenue Conversion to GAAP Basis:Property Taxes 95,264
Expenditure Conversion to GAAP Basis:Accrued Salaries and Wages Payable (17,715)
Fund Balance, GAAP Basis 1,286,273$
Museum FundFor the Year Ended April 30, 2014
- 32 -
Exhibit H
CHAMPAIGN PARK DISTRICTStatement of Revenues, Expenditures, and Changes in Fund Balance -
Actual (Budgetary Basis) Versus Budget
See Accompanying Notes

Actual Variance(Budgetary Budget Budget (Actual -
Basis) (Final) (Original) Final Budget)REVENUES
Property Taxes 813,219$ 836,210$ 836,210$ (22,991)$ Intergovernmental Revenue - - - -Charges for Services, Program Rentals, and
Related Items 100,302 104,625 104,625 (4,323) Contributions and Sponsorships - - - -Merchandise and Concession Sales - - - -Grants 2,656 - - 2,656 Interest Income 2,338 4,000 4,000 (1,662) Special Receipts 4,218 4,167 4,167 51 Miscellaneous - - - -
Total Revenues 922,733 949,002 949,002 (26,269)
EXPENDITURESCurrent:
Culture and Recreation:Salaries and Wages 328,254 375,201 377,451 (46,947) Fringe Benefits 68,617 77,550 77,550 (8,933) Commodities 35,814 97,194 47,599 (61,380)
Contractual Services 127,434 102,784 90,229 24,650 Total Current 560 119 652 729 592 829 (92 610)
Exhibit I
Special Recreation FundFor the Year Ended April 30, 2014
CHAMPAIGN PARK DISTRICTSchedule of Revenues, Expenditures, and Changes in Fund Balance -
Actual (Budgetary Basis) Versus Budget
Total Current 560,119 652,729 592,829 (92,610)
Capital Outlay 751,012 1,331,333 1,391,333 (580,321) Total Expenditures 1,311,131 1,984,062 1,984,162 (672,931)
Net Excess (Deficit) of Revenuesover Expenditures (388,398) (1,035,060) (1,035,160) 646,662
OTHER FINANCING SOURCES (USES)Transfers In - - - -
Transfers Out - - - -
Net Other Financing Sources (Uses) - - - -
Net Change in Fund Balances (388,398) (1,035,060) (1,035,160) 646,662
Fund Balance, Beginning of Year 2,492,088 2,492,088 2,492,088 -
Fund Balance, End of Year - Budgetary Basis 2,103,690 1,457,028$ 1,456,928$ 646,662$
Revenue Conversion to GAAP Basis: Property Taxes 7,682
Expenditure Conversion to GAAP Basis:Accrued Salaries and Wages Payable (5,143)
Fund Balance, GAAP Basis 2,106,229$
- 33 -
See Accompanying Notes

Agency FundASSETSCurrent Assets:
Cash and Cash Equivalents 56,701$
LIABILITIESCurrent Liabilities:
Accounts Payable 5,998 Due to Affiliated Agencies 50,703
Total Liabilities 56,701
NET POSITION -$
Exhibit J
- 34 -
Fiduciary Fund
April 30, 2014
CHAMPAIGN PARK DISTRICT
Statement of Fiduciary Net Position
See Accompanying Notes

- 35 -
CHAMPAIGN PARK DISTRICT Notes to Financial Statements
April 30, 2014 1. Summary of Significant Accounting Policies
The financial statements of the Champaign Park District (the District) are prepared in accordance with accounting principles generally accepted in the United States of America (GAAP). The Government Accounting Standards Board (GASB) is responsible for establishing GAAP for state and local governments. GAAP includes all relevant GASB pronouncements plus other sources of accounting and financial reporting guidance noted in GASB Statement 55, The Hierarchy of GAAP for State and Local Governments. For the year ended April 30, 2014, the District implemented GASB Statement Number 65, Items Previously Reported as Assets and Liabilities. This standard had no quantitative impact on the financial reporting for the District for the year ended April 30, 2014. a. Financial Reporting Entity
The District was organized in November 1911 and was established as a separate unit of local government in 1955. The District is a municipal corporation which operates under the statutes of the State of Illinois. It is governed by a five member Board of Commissioners elected to six-year terms in biennial public elections. The District is composed of over 90 parks and facilities designed to help meet the leisure needs of the people in the Champaign, Illinois area.
The definition of what constitutes the entity of the District is based on the guidelines
set forth in GASB Statement Number 14, as amended by GASB Statement 61. The primary government of the District consists of the funds presented herein as governmental funds, a debt service fund, capital project funds, a permanent fund, and an agency fund.
According to GASB Statement Number 14, as amended by Statement Number 61, a legally separate organization should be included as a component unit of the primary government if the primary government is financially accountable for the legally separate organization. Financial accountability is determined as follows:
1. The organization is fiscally dependent on the primary government and there is
a potential for the organization to provide specific financial benefits to, or impose specific financial burdens on, the primary government, or

- 36 -
2. The primary government appoints a voting majority of the organization’s governing body, and:
It is able to impose its will on the organization, or
There is a potential for the organization to provide specific financial benefits
to, or impose specific financial burdens on, the primary government
As required by accounting principles generally accepted in the United States of America, these financial statements present the financial reporting entity of the District, including the Champaign Parks Foundation (the Foundation), a discretely presented component unit. The Foundation is a discretely presented component unit because the resources received and held by the Foundation are entirely for the direct benefit of the District, the District has the ability to access those resources, and those resources are significant to the District. The assets, liabilities, net assets, revenue, and expenses of the Foundation are included in the basic financial statements presented in Exhibits A and C. There are no other entities for which the nature and significance of their relationship with the District are such that exclusion would cause the District’s financial statements to be materially misstated or incomplete. The Foundation issues publicly available financial statements, which may be obtained by contacting the Champaign Parks Foundation, 706 Kenwood Road, Champaign, Illinois 61821-4112. Related organizations for which the Commissioners appoint a voting majority of the governing body, but for which the District is not financially accountable, are not included in the reporting entity. Jointly governed organizations are those for which the District does not have an on-going financial interest or responsibility. Jointly governed organizations are not included in the reporting entity.
b. Basic Financial Statements Government-Wide Financial Statements
The Statement of Net Position and Statement of Activities display information about the District as a whole. They include all funds of the District and the discretely presented component unit, except the District’s Agency Fund. The Statement of Net Position and the Statement of Activities include the governmental activities and the discretely presented component unit. Governmental activities generally are financed through taxes, intergovernmental revenues, and other non-exchange revenues.

- 37 -
Internal balances and activities within the District’s funds are eliminated in the government-wide financial statements. Activities between the District’s primary government and the discretely presented component unit are not eliminated. The government-wide financial statements are reported using the economic resources measurement focus and accrual basis of accounting (as described in Note 1.c). Fund Financial Statements
Fund financial statements of the District are organized into funds, each of which is considered to be a separate accounting entity. Each fund is accounted for by providing a separate set of self-balancing accounts that constitutes its assets, liabilities, fund equity, revenue, and expenditures/expenses. The District’s funds are organized into two major categories: governmental and fiduciary funds. An emphasis is placed on major funds within the governmental category. A fund is considered major if it is the primary operating fund of the District or meets the following criteria:
1. Total assets plus deferred outflows of resources, liabilities plus deferred inflows
of resources, revenue, or expenditures/expenses of that individual governmental fund are at least 10 percent of the corresponding total for all funds of that category or type
2. Total assets plus deferred outflows of resources, liabilities plus deferred inflows
of resources, revenue, or expenditures/expenses of the individual governmental fund are at least 5 percent of the corresponding total for all governmental funds combined
Governmental fund financial statements are reported using the current financial resources measurement focus and the modified accrual basis of accounting (as described in 1.c). The fiduciary fund financial statement is reported on the accrual basis of accounting (as described in Note 1.c). The fund types of the District are described below: Governmental Funds The focus of the governmental funds’ measurement (in the fund financial statements) is upon determination of financial position and changes in financial position (sources, uses, and balances of financial resources) rather than upon net income. The following is a description of the governmental funds of the District: General Fund - The General Fund is the primary operating fund of the District and is always classified as a major fund. It is used to account for all activities except those legally or administratively required to be accounted for in other funds.

- 38 -
Special Revenue Funds - Special Revenue Funds are used to account for the proceeds of the specific revenue sources that are restricted or committed to expenditures for specified purposes other than debt service or capital projects. The reporting entity of the District includes the following special revenue funds: Major Special Revenue Funds
Recreation Fund - Property taxes levied for this fund, along with fees from participants, provide the funds necessary to pay for recreational programs. Museum Fund - Property taxes levied for this fund along with fees from patrons provide the funds to acquire, maintain, improve, and operate the museum facilities and programs including activities related to the cultural arts, nature, zoos, and arts and crafts. Special Recreation Fund - Property taxes levied for this fund along with fees from participants provide the funds necessary to pay for recreational activities for the handicapped, which is a cooperative program with the Urbana Park District.
Non-Major Special Revenue Funds Liability Insurance Fund - Property taxes levied for this fund provide the funds necessary to pay the premiums for District insurance and a portion of the administrative and risk management services needed to secure and implement these insurance coverages. Insurance includes, but is not limited to, general liability, umbrella liability, fire and extended coverage, burglary, theft, employee and commissioner bonds, worker’s compensation, unemployment compensation, and insurance on District vehicles and equipment. Premiums on health and life insurance are not paid from this fund.
Illinois Municipal Retirement Fund (IMRF) Fund - State law requires all permanent employees of the District to participate in a mandatory retirement plan through payroll deduction, and the District as an employer also makes contributions to the State plan. The property taxes levied for this fund are used to pay the employer contribution to the plan.
Audit Fund - Property taxes levied for this fund are used to pay the expense of the state-mandated independent annual audit of the District’s financial statements. Social Security Fund - District employees make mandatory contributions to the Social Security System as a payroll withholding, and the District as employer makes matching contributions. Property taxes levied for this fund are used to pay the employer contributions. Police Protection Fund - Property taxes levied for this fund are used to pay for the contracted police services provided by the City of Champaign.

- 39 -
Special Donation Fund - Is funded by donations from individuals and organizations, which are restricted as to use as specified by the donor. Debt Service Funds - Debt Service Funds are used to account for and report financial resources that are restricted, committed, or assigned to expenditures for principal and interest. The reporting entity includes one debt service fund, which is the Bond Amortization/Debt Service Fund. This is a non-major governmental fund. Capital Projects Funds - Capital Projects Funds are used to account for and report financials resources that are restricted, committed, or assigned to expenditures for capital outlays, including the acquisition or construction of capital facilities and other capital assets. The reporting entity includes the following capital projects funds: Major Capital Projects Fund
Bond Proceeds Fund - This fund accounts for the money generated by the sale of general obligation bonds and the related disbursement of the funds for the repayment of long-term debt and capital projects as listed in the bond ordinance.
Non-Major Capital Projects Funds
Paving and Lighting Fund - Property taxes levied for this fund are used to pay for the construction, maintenance, and lighting of streets, roadways, bike paths, sidewalks, and parking lots within the parks and facilities maintained by the District. Capital Improvements and Repair Fund - Intergovernmental revenues, special receipts and transfers from other District funds are used to pay for capital improvement and repair projects not funded by other District funds. Land Acquisition Fund - Intergovernmental revenues, special receipts and transfers from other District funds are used to pay for land purchases not funded by other District funds.
Permanent Funds - Permanent Funds are used to report resources that are legally restricted to the extent that only earnings, and not principal, may be used to support the District’s programs. The District has one permanent fund, the Working Cash Fund, which is a non-major fund.

- 40 -
Fiduciary Funds
Fiduciary funds are used to report assets held by the District in a trustee or agency capacity for others and therefore cannot be used to support the District’s own programs. The District has one fiduciary fund, the Activity and Affiliates Fund, which provides administration for the funds from recreation centers, senior citizen programs, adopt-a-park groups, and District co-sponsored affiliate programs.
c. Basis of Accounting
Accrual Both governmental activities in the government-wide financial statements and the fiduciary fund financial statement are presented on the accrual basis of accounting. Revenue is recognized when earned and expenses are recognized when incurred. Property taxes are recognized as revenues in the year for which they are levied. Grants and similar items are recognized as revenue as soon as all eligibility requirements imposed by the provider have been met. Modified Accrual
The governmental fund financial statements are presented on the modified accrual basis of accounting. Under the modified accrual basis of accounting, revenue is recognized when it becomes both measurable and available. Revenue is considered to be available when they are collectible within the current period or soon enough thereafter to pay liabilities of the current period. The District considers receipts within 60 days of year-end to be available. Expenditures generally are recognized under the modified accrual basis of accounting when the related liability is incurred. The exception to this general rule is that principal and interest on general obligation long-term debt, if any, is recognized when payment is due.
Property taxes, corporate personal property replacement tax, and grants are considered
to be susceptible to accrual and so have been recognized as revenue of the current fiscal period. All other revenue items are considered to be measured and available only when cash is received by the District.
d. Cash and Cash Equivalents Cash and Cash Equivalents includes deposits at financial institutions, non-negotiable
certificates of deposit, and funds held in money market mutual funds or similar pooled investments such as the Illinois Park District Liquid Assets Fund, the Illinois Funds, and the Illinois Metropolitan Investment Fund.

- 41 -
e. Investments
Under Illinois law (30 ILCS 235/2), the District may invest excess funds in interest bearing deposits at federally insured banks and savings and loans, commercial paper, short term discount obligations of the Federal National Mortgage Association, and securities issued by the U.S. Treasury or other federal agencies. At April 30, 2014, the District’s primary government has no investments.
f. Receivables Receivables are reported at the estimated net realizable amounts from third-party
payers and others for services rendered. Receivables are stated at the amount management expects to collect on outstanding balances.
g. Interfund Balances
Short-term receivables and payables between funds are reported as due from and due to other funds, respectively. Non-current amounts are reported as advances to/from other funds. In governmental funds, advances to other funds as well as other long-term receivables are offset by non-spendable fund balance because they do not represent expendable, available financial resources.
h. Prepaid Expenditures/Expenses
Prepaid expenditures/expenses such as for insurance or service contracts are deferred and expended/expensed over the term when the services are received.
i. Capital Assets
Capital assets purchased for use in governmental activities are recorded as expenditures in governmental funds at the time of purchase. Governmental capital assets are reported in the government-wide financial statements offset by accumulated depreciation. Capital assets are valued at actual or estimated historical cost while donated capital assets are valued at their fair market value on the date donated. Equipment valued at or above $10,000, buildings and improvements valued at or above $20,000, land improvements and infrastructure valued at or above $20,000, and land of any value are capitalized. Assets that appreciate in value are capitalized if valued at more than $10,000. Depreciation is calculated on all assets other than land and assets that appreciate in value using the straight-line method, mid-month convention with the following estimated useful lives:

- 42 -
Building Improvements 15New Construction 40Land Improvements 15Computers and Office Equipment 5Infrastructure:
Roads and Paved Surfaces 15Bridges 50
Furniture 7Other Equipment 5MajorAppliances 7Park and Recreation Features 12Playground Equipment 12Vehicles 5
Years
j. Deferred Outflows/Inflows of Resources
The financial statement element, deferred outflows of resources, represents a consumption of net position that applies to a future period(s) and so will not be recognized as an outflow of resources (expense/expenditure) until then. The District has only one item that qualifies for reporting in this category as of April 30, 2014. The item, deferred charge on refunding, is reported in the Statement of Net Position. The amount represents the excess of cash paid to the refunded bond escrow agent over the amount of refunded principal payments. The amount is deferred and recognized as an outflow of resources (expense) over the shorter of the remaining life of the refunded debt or the life of the refunding debt.
The financial statement element, deferred inflows of resources, represents an acquisition of net position that applies to a future period(s) and so will not be recognized as an inflow of resources (revenue) until that time. The District has only one type of item that qualifies for reporting in this category at April 30, 2014, which arises only under the modified accrual basis of accounting. Accordingly, the item, unavailable revenue, is reported only in the governmental funds balance sheet. The governmental funds report unavailable revenue from property taxes. This amount is deferred and recognized as an inflow of resources (revenue) in the period that the property taxes become available.
k. Restricted Net Position
Assets that are not available to finance general operations of the District are reported as restricted on the statement of net position. The District’s policy is to apply restricted resources first when an expense is incurred for a purpose for which restricted and unrestricted net position is available.

- 43 -
l. Fund Balance Fund balances are classified as follows: Non-Spendable – Amounts that cannot be spent either because they are not in a spendable form or because they are legally or contractually required to be maintained intact Restricted – Amounts that can be spent only for specific purposes because of the District Charter, state or federal laws, or externally imposed conditions by grantors or creditors Committed – Amounts that can be used only for specific purposes determined by a formal resolution of the District Board of Commissioners Assigned – Amounts that are constrained by the Board of Commissioners’ intent to be used for specific purposes but are neither restricted nor committed Intent is expressed by (a) the Board of Commissioners itself or (b) a body or official to which the Board of Commissioners has delegated the authority to assign amounts to be used for specific purposes. The District’s highest level of decision-making authority is the Board of Commissioners, which is authorized to assign amounts to a specific purpose through its appropriations power. Unassigned – All amounts not included in other spendable classifications When an expenditure is incurred for purposes for which both restricted and unrestricted (committed, assigned, or unassigned) fund balance is available, the District considers restricted funds to have been spent first. When an expenditure is incurred for which committed, assigned, or unassigned fund balances are available, the District considers amounts to have been spent first out of committed funds, then assigned funds, and finally unassigned funds, as needed, unless the Board of Commissioners has provided otherwise in its commitment or assignment actions.

- 44 -
m. Program Revenues
Program Revenues on the statement of activities include the following: Governmental Activities Charges for Services Fees paid by the public for the use of District facilities, District
Programs, and miscellaneous food and beverage vending
Operating Grants Funding used to support education programsand Contributions
Capital Grants Funding used to construct facilities and develop properties ownedand Contributions by the District
n. Compensated Absences It is the District’s policy to permit employees to accumulate earned but unused
vacation and sick pay benefits. There is no liability for unpaid accumulated sick leave since the District does not have a policy to pay sick leave amounts when employees separate from service with the District. All vacation pay is accrued when incurred in the government-wide financial statements. A liability for these amounts is reported in the governmental funds only if they have matured, for example, as a result of employee resignations or retirements.
o. In-Kind Contributions Contributions of facilities and services are recognized by the District if the benefit
received (a) creates or enhances non-financial assets or (b) requires specialized skills, provided by individuals possessing those skills and would typically need to be purchased by the District if not provided by donation.
The District has various agreements with local media companies that provide
publicity for the District’s events in return for recognition at the District’s events and in District publications. The District does not record in-kind contribution revenue or expense related to these agreements.
p. Estimates
The preparation of financial statements in conformity with accounting principles generally accepted in the United States of America requires management to make estimates and assumptions that affect certain reported amounts and disclosures. Accordingly, actual results could differ from those estimates.

- 45 -
2. Reconciliation of Fund Statements to Government-Wide Statements
A reconciliation is provided with the balance sheet - governmental funds (Exhibit D-1) to explain the differences between total fund balances in the balance sheet - governmental funds and net position for governmental activities on the government-wide statement of net position. The major differences are due to: a. Grants receivable from other governments for which funds were received subsequent
to 60 days after fiscal year end
b. Property taxes receivable and an equivalent unavailable revenue for 50 percent of the 2013 tax levy, which will be received and recorded as revenue in the next fiscal year
c. The value of capital assets, which are not reported in governmental funds
d. Accrued interest on debt, which will be paid during the second half of the next fiscal year
e. The value of long term liabilities, including premiums on bond issues, which are not reported in governmental funds
f. Unamortized deferred charge on refunding A reconciliation is provided with the statement of revenues, expenditures and changes in fund balances - governmental funds (Exhibit E-1) to explain the difference between the change in fund balances in the governmental funds and the change in net position for governmental activities on the government-wide statement of activities. The major differences are due to: a. The change in accrued grant revenue does not impact governmental fund revenue,
while it impacts revenue on the statement of activities.
b. Capital outlay expenditures are not reported in the statement of activities, while depreciation expense and gains/losses on disposal of capital assets are not reported in governmental funds.
c. Bond proceeds are not revenue and bond payments (including bond refunding
payments) are not expenses on the Statement of Activities and the change in accrued interest on bonds does not impact governmental fund expenditure.
d. The change in accrued compensated absences is not a governmental fund expenditure, while it is an expense on the statement of activities.

- 46 -
3. Budgets and Budgetary Basis of Accounting a. Budgetary Process
A proposed budget and appropriations ordinance is developed and made available for public hearing at least 30 days prior to final approval. Upon approval, the Board of Commissioners of the District legally enacts an annual operating budget through passage of an ordinance. The appropriations ordinance is prepared by fund, expenditure object (i.e. salary and wages), and expenditure sub-object (i.e. salary and wages – full time personnel).
b. Legal Level of Budgetary Control
The budget is prepared by fund, department, program activity, object, and sub-object. The District’s management may make transfers of budgeted amounts up to and including the department level. The legal level of budgetary control (i.e., the level at which expenditures may not legally exceed appropriations) is the fund level. The budgetary expenditure comparisons in the basic financial statements are presented at the fund level with summarizations at the object level (i.e., salary and wages, fringe benefits, commodities, and contractual services). The IMRF Fund exceeded its working budget expenditures by $11,031 and the Activity and Affiliates Fund exceeded its working and appropriated budget expenditures by $8,361, for the year ended April 30, 2014; however, the IMRF Fund did not exceed its appropriated budget.
c. Amendments to the Budget
Throughout the year, the Board can make amendments within each fund, not to exceed an aggregate of 10 percent of the total appropriated amount of that fund. Likewise, after the first six months of the fiscal year have elapsed, the Board may, by two-thirds vote, transfer from any appropriation item, its anticipated unexpended funds to any other item of appropriation. The budgeted financial statements represented in this report reflect the final budget authorization. All budget appropriations including project budgets lapse at the end of each fiscal year.
d. Budgetary Basis of Accounting
Formal budgetary accounting is employed as a management control for all funds of the District, and legal budgets are adopted for the general fund, special revenue funds, capital projects funds, debt service funds, and trust and agency funds. Budgets are adopted on a modified cash basis, which is a comprehensive basis of accounting other than GAAP.
e. Encumbrances
Encumbrance accounting is not used by the District.

- 47 -
4. Reconciliation of Budgetary to GAAP Basis
The budgetary comparison statements are prepared on the modified cash basis, which is a comprehensive basis of accounting other than GAAP. Each budgetary statement has a reconciliation at the bottom of the statement showing the items needed to convert from the budgetary to the GAAP basis. The reconciling items include property tax conversions, accrued salaries and wages payable, and accrued interest expense.
5. Deposits and Investments Cash – Restricted At April 30, 2014, the District’s governmental activities hold $233,001 of cash and cash equivalents restricted for capital projects. Custodial Credit Risk – Bank Deposits Custodial credit risk is the risk that in the event of a bank failure, the District’s deposits may not be returned to it. The District’s investment policy addresses custodial credit risk by requiring that all deposits in excess of federal depository insurance are to be collateralized by a pledge of securities from the depository bank at 110 percent of the uninsured amount. At April 30, 2014, $102,331 of the District’s bank deposits of $3,693,168, which reconciled to a book balance of $3,540,286, was exposed to custodial credit risk. The $102,331 balance exposed to custodial credit risk was collateralized by securities pledged by Central Illinois Bank held in the District’s name. The pledged securities had a market value of $480,695. Credit Risk and Interest Rate Risk – External Investment Pools Credit risk is the risk that the issuer of a bond or note security will not repay the principal or pay the interest due on the debt. Interest rate risk is the risk that a change in the market rate of interest for a category of debt securities will negatively impact the market value of a debt security. The credit risk of investments is addressed by the District’s investment policy by limiting investments to: 1) debt issued by the U.S. Government and its direct agencies, 2) short-term obligations of U.S. corporations with assets exceeding $500,000,000, credit ratings within the three highest levels of two standard rating services, and maturities no later than 180 days from purchase, and 3) money market mutual funds registered under the Investment Company Act of 1940. Interest rate risk is not directly addressed by the District’s investment policy other than the policy’s general guidelines to “remain sufficiently liquid” and “achieve market yields”. At April 30, 2014, the District held a total $4,796,362 in the Illinois Funds Money Market Fund, which reconciled to a book value of $4,914,114. The fair value of the District’s position in this fund is equal to the value of the District’s fund shares. The

- 48 -
portfolio is regulated by oversight of the Treasurer of the State of Illinois and private rating agencies. The portfolio has AAAm ratings from Standard and Poor’s. The assets of the fund are mainly invested in securities issued by the United States government or agencies related to the United States. Assets of the fund not invested in United States government securities are fully collateralized by pledged securities. The time to maturity of the investments in this external investment pool averages less than one year. At April 30, 2014, the District held $1,392,944 in the Illinois Park District Liquid Asset Fund. The fair value of the District’s position in the Illinois Park District Liquid Asset Fund is equal to the value of the District’s fund shares. The Illinois Park District Liquid Asset Fund is regulated by private rating agencies. The fund has AAAm rating from Standard and Poor’s. The assets of this fund are mainly invested in securities issued by the United States government or agencies related to the United States. Generally, assets not invested in United States government securities are fully collateralized by pledged securities. The time to maturity of the investments in this external investment pool averages less than one year. At April 30, 2014, the District held $513,197 in the Illinois Metropolitan Investment Fund (IMET) 1-3 Year Fund and $759,505 in the IMET Convenience Fund. These funds are regulated by private rating agencies. The IMET 1-3 Year Fund has a floating net asset value based on the value of the portfolio’s securities. The fund has Aaa/MR1 rating from Moody’s Investors Service. The assets of this fund are invested exclusively in securities issued by or guaranteed by the United States Treasury. The time to maturity of the investments in this external investment pool averages one to three years. The fair value of the District’s position in the IMET Convenience Fund is equal to the value of the District’s fund shares. The IMET Convenience Fund is not rated by the nationally recognized statistical rating organizations. The assets of the IMET Convenience Fund are invested in fully collateralized certificates of deposit. Generally, assets not invested in certificates of deposit are fully collateralized by pledged securities. The time to maturity of the investments in this external investment pool averages less than one year.
6. Property Tax Cycle
a. Assessments
Property is assessed by elected township assessors at one-third the market value as of January 1 each year. This is the date, called the lien date, on which property taxes “attach” to the property. The township assessors’ books are turned into the County Supervisor of Assessments by April 15. The Board of Review, a three-member panel appointed by the County Board, takes action on assessment complaints and applies individual township multipliers to those townships, which are not assessed at one-third. This process equalizes the average ratio of assessments to market value among townships. The Illinois Department of Revenue analyzes the work of the Board of Review and may assign a countywide multiplier to bring the entire County’s ratio into line with other counties throughout the state.

- 49 -
b. Taxpayer Appeals
Taxpayers may file a complaint with the Board of Review if they believe assessments are too high and may make further appeal to the state Property Tax Appeals Board. However, tax levies are determined by local governments not by assessors.
c. Property Tax Levies
Fifty percent of the calendar 2012 levy passed in November 2012 and 50 percent of the calendar 2013 levy passed in November 2013, less allowances, related to fiscal year 2014. Both levies were adopted within the Illinois statutory deadline (the third Tuesday in December). Property tax levies are reported as receivables, net of an allowance for uncollectible amounts, in the year in which they are adopted. Property tax distributions received within 60 days of the end of the fiscal year are recognized in that fiscal year as revenue in the governmental funds. The balance is unavailable revenue to the next fiscal year for the governmental funds and eliminated for the governmental activities. Fiscal year 2014 property tax revenue on the statement of activities consists of 50 percent of the calendar 2012 levy and fifty percent of the calendar 2013 levy, less allowances, however, for fiscal year 2014 the property tax revenue on the statement of activities (on the accrual basis) and the property tax revenue on the statement of revenue, expenditures, and changes in fund balances (on the modified accrual basis) have been left as equal as actual revenue recognition differences are immaterial.
d. Tax Bills
Illinois statutes require the payment of property taxes in two installments due June 1 and September 1 and require that tax bills be mailed 30 days prior to the first installment. Property tax bills mailed in 2014 were based on equalized assessed value as of January 1, 2013 and on tax levies set in November 2013.
e. Tax Distributions
The County Treasurer is also the County Collector and is in charge of collecting and distributing property taxes. The Collector generally distributes taxes to the taxing bodies shortly after taxes are paid. The County may not keep tax receipts on behalf of other units of local government beyond thirty days. In 2013, all property taxes were distributed by November 2013. Interest earned on taxes before distribution goes to the local governments.

- 50 -
7. Property Taxes Receivable
Property taxes receivable for the governmental funds consists of property taxes levied in 2013, for which a legal claim exists in 2014. The revenue associated with the 2013 levy is recognized in the governmental funds if received within the 60 day period following the fiscal year end. The property taxes received beyond the 60 day period are deferred until the fiscal year ending April 30, 2015. A summary of property taxes receivable by fund type at April 30, 2014 is shown below:
Property Property Taxes UnavailableTaxes Levied Receivable Revenue
General 5,261,513$ 5,218,735$ 2,454,275$ Recreation 1,811,981 1,797,249 845,359 Museum 1,215,005 1,205,126 566,711 Special Recreation 601,488 596,598 280,708 Non-Major
Special Revenue 1,081,175 1,072,384 504,035 Debt Service 1,449,585 1,437,799 676,169 Capital Projects 75,186 74,575 35,310
Total 11,495,933$ 11,402,466$ 5,362,567$
Fund Type
Based on past collection experience, the District has applied an allowance for doubtful collections against the property tax receivable of $93,467 at April 30, 2014.
8. Unearned Revenue
Unearned revenue for governmental activities on the statement of net position and for governmental funds on the balance sheet – governmental funds consists of the following at April 30, 2014: Unearned Program Fees 339,518$ Unearned Grant Revenue 42,600
Total 382,118$

- 51 -
9. Capital Assets
The following is a summary of the changes in capital assets of the governmental activitiesfor the fiscal year ended April 30, 2014:
April 30, April 30,2013 Additions Deductions 2014
Being Depreciated:Buildings and Improvements 41,224,007$ 6,686,744$ (74,156)$ 47,836,595$ Equipment 4,251,369 791,385 (78,927) 4,963,827
Not Being Depreciated:
Land 7,840,578 - - 7,840,578
Total 53,315,954$ 7,478,129$ (153,083)$ 60,641,000$
Accumulated Depreciation:Infrastructure 7,297,082$ 765,292$ (9,999)$ 8,052,375$ Building Improvements 7,291,951 - - 7,291,951 Land Improvements - 415,756 - 415,756
Equipment 3,413,578 298,468 (78,927) 3,633,119 Total 18,002,611$ 1,479,516$ (88,926)$ 19,393,201$
Current Year depreciation expense was charged to the following function:Culture and Recreation 1,479,516$
Capital Assets
The additions total of $7,478,129 includes $103,333 of capital assets provided by the Champaign Parks Foundation.

- 52 -
10. Changes in Long–Term Debt
The following is a summary of changes in the District’s long-term debt of the governmental activities for the year ended April 30, 2014:
April 30, April 30, Due Within2013 Issued Retired 2014 One Year
Alternate Revenue
Bonds 5,020,000$ 4,670,000$ 4,720,000$ 4,970,000$ 385,000$ Accrued
CompensatedAbsences 208,491 4,599 - 213,090 213,090
Net PensionObligation 59,398 - - 59,398 -
UnamortizedBond Premiums - 110,958 8,040 102,918 9,649
Total Long-Term Debt 5,287,889$ 4,785,557$ 4,728,040$ 5,345,406$ 607,739$
The entire balance of compensated absences at April 30, 2014 has been presented as due within one year as management believes the actual amount that will be used within the next fiscal year will not be significantly lower than this amount based on past usage patterns. In fiscal year 2014 and prior years, accrued compensated absences have been liquidated by the following funds: General, Recreation, Museum, Liability Insurance, and Special Recreation. The net pension obligation will be liquidated by the Illinois Municipal Retirement Fund.
11. Alternate Revenue Bonds
Series 2005 Bonds On September 1, 2005, the District issued $6,950,000 of general obligation bonds (alternative revenue source) to defray the costs associated with the District’s aquatic center. The registrar and paying agent is J.P. Morgan Trust Company for this bond issue, which is known as the General Obligation Bond (Alternate Revenue Source), Series 2005. These bonds were scheduled to mature serially on December 15 of each of the calendar years 2006 to 2024 in amounts ranging from $190,000 to $525,000 and bearing interest ranging from 3.8 percent to 4.5 percent payable December 15 annually, but bonds maturing on and after December 15, 2015 were advance refunded on July 2, 2013. These bonds are to be repaid from the revenue generated by the District’s aquatic center, which is included in the activities of the Recreation Fund. However, the bond ordinance created an annual tax levy sufficient to repay the principal and

- 53 -
interest through 2024 if the revenue of the aquatic center is insufficient to repay the debt. This levy was abated for fiscal year 2014. The District is currently using funds from the annual general obligation bond issue to repay the principal and interest. Aggregate future principal maturities and interest payments required on these bonds are as follows at April 30, 2014.
Principal Interest Total345,000$ 13,110$ 358,110$
Fiscal Year EndedApril 30
2015
The District has pledged future revenue from the Sholem Aquatic Center as a source of funding for the repayment of these bonds. Principal and interest on the bonds are payable through 2014 and it is management’s intention to use funds from the annual general obligation bond issue to make all debt payments rather than the pledged revenue. Annual principal and interest on the bonds would require an amount less than the expected revenue from the operation of the Sholem Aquatic Center. Principal and interest paid for fiscal year 2014 was $454,761. The Sholem Aquatic Center’s revenue totaled $370,012 for fiscal year 2014. The proceeds from the general obligation bond issued in fiscal year 2014 was $1,068,000. At April 30, 2014, pledged future revenue totaled $358,110, which was the amount of the remaining principal and interest on the bonds. Series 2013 Bonds On July 2, 2013, the District issued $4,670,000 of general obligation bonds (alternate revenue source). The proceeds of the bond issue were used to advance refund $4,345,000 of the Series 2005 bonds, which were scheduled to mature on and after December 15, 2015. These bonds mature serially on December 15 of each of the calendar years 2013 to 2024 in amounts ranging from $45,000 to $525,000 and bear interest ranging from 2.0 percent to 3.0 percent payable June 15 and December 15 annually. Bonds maturing on and after December 15, 2022 are subject to early redemption as of December 15, 2021 at the District’s discretion. These bonds are to be repaid from the revenue generated by the District’s aquatic center, which is included in the activities of the Recreation Fund. However, the bond ordinance created an annual tax levy sufficient to repay the principal and interest through 2024 if the revenue of the aquatic center is insufficient to repay the debt. This levy was abated for fiscal year 2014. The District is currently using funds from the annual general obligation bond issue to repay the principal and interest.

- 54 -
Aggregate future principal maturities and interest payments required on these bonds are as follows:
Principal Interest Total40,000$ 126,050$ 166,050$
400,000 125,250 525,250 410,000 117,250 527,250 420,000 109,050 529,050 435,000 100,650 535,650
2,395,000 299,550 2,694,550 525,000 15,750 540,750
4,625,000$ 893,550$ 5,518,550$ Total
20182019
2020-20242025
Fiscal Year EndedApril 30
201520162017
The District has pledged future revenue from the Sholem Aquatic Center as a source of funding for the repayment of these bonds. Principal and interest on the bonds are payable through 2024 and it is management’s intention to use funds from the annual general obligation bond issue to make all debt payments rather than the pledged revenue. Annual principal and interest on the bonds would require an amount greater than the expected revenue from the operation of the Sholem Aquatic Center; however, the debt service will utilize approximately 50 percent of the proceeds of the general obligation bond issued. Principal and interest paid for fiscal year 2014 was $102,480. The Sholem Aquatic Center’s revenue totaled $370,012 for fiscal year 2014. The proceeds from the general obligation bond issued in fiscal year 2014 was $1,068,000. At April 30, 2014, pledged future revenues totaled $5,518,550, which was the amount of the remaining principal and interest on the bonds. The 2013 bond ordinance calls for a funded reserve to pay principal and interest. The bond fund reserve requires the next principal and interest payment amounts to be set aside by each December 1, but requires no specific monthly set aside amount before that date. At April 30, 2014, the required balance in this reserve was $0 and $0 was held in the reserve. The advance refunding was done in order to reduce debt payments. The refunding decreased the District’s total debt service payments by approximately $144,000. The transaction resulted in an economic gain (difference between the present value of the debt service on the old and the new bonds) of approximately $120,000.
A deposit of $4,686,539 was placed into an irrevocable trust with an escrow agent to provide for future debt service payments on the advance refunded 2005 bonds. As a result, the bonds are considered to be defeased, and the related liability for the bonds has been removed from the District's liabilities.

- 55 -
The advance refunding transaction resulted in an expense of $244,738, which equals the amount placed in escrow less the carrying amount of the defeased bonds including accrued interest to the date of redemption. This expense has been capitalized on the statement of net position as a deferred outflow of resources deferred charge on refunding.
12. General Obligation Bond
On December 2, 2013, the District issued $1,068,000 of general obligation bonds (limited tax) to defray the costs associated with various capital projects and for paying the principal and interest on the District’s alternate revenue bonds. The registrar and paying agent is Busey Bank for this bond issue, which is known as the General Obligation (Limited Tax) Park Bond, Series 2013. These bonds mature November 30, 2014 and bear interest of 0.64 percent. The bond principal of $1,068,000 and interest of $6,797 will be paid from property taxes levied specifically for this bond repayment. The following is a summary of changes in the District’s short-term debt of the governmental activities for the year ended April 30, 2014:
April 30, April 30,2013 Issued Retired 2014
General ObligationBonds 1,051,000$ 1,068,000$ 1,051,000$ 1,068,000$
13. Legal Debt Margin
At April 30, 2014, the estimated legal debt margin was determined as follows: Assessed Valuation (Tax Year 2013) 1,503,718,963$
Statutory Debt Limitation (2.875 Percent of 43,231,920$ Assessed Valuation)
Total General Obligation Bond Indebtednessat April 30, 2014 (1,068,000)
Legal Debt Margin 42,163,920$

- 56 -
14. Restricted Net Position
At April 30, 2014, the District has restricted net position that is restricted due to enabling legislation as follows: Tax Levy Allocations for:
IMRF Expenditures 324,816$ Audit Expenditures 24,651 Social Security Expenditures 435,597 Liability Insurance Expenditures 498,985 Police Protection Expenditures 44,740
Total 1,328,789$
15. Non-Spendable, Restricted, Committed, Assigned, and Deficit Fund Balances
a. Non-Spendable, Restricted, Committed, and Assigned
In the fund financial statements, governmental funds report non-spendable, restrictions of, commitments of, and assignments of fund balances for amounts that are not available for appropriation, are restricted by outside parties for use for a specific purpose, are committed for a specific purpose by an action of the Board of Commissioners, or are assigned by the Board of Commissioners’ intent to be used for specific purposes but are neither restricted nor committed, respectively. Intent is expressed by (a) the Board of Commissioners itself or (b) a body or official to which the Board of Commissioners has delegated the authority to assign amounts to be used for specific purposes. As of April 30, 2014, such fund balances are composed of the following:

- 57 -
Other Major Non-Major TotalGeneral Governmental Governmental Governmental
Fund Funds Funds FundsNon-Spendable:
Prepaid Items 2,304$ 18,173$ -$ 20,477$ Permanent Fund - - 250,000 250,000
2,304 18,173 250,000 270,477 Restricted:
Tax LevyExpenditures - - 1,328,789 1,328,789
Capital Projects - 233,001 592,788 825,789 Debt Service - - 766,124 766,124 Scholarships - - 66,313 66,313
- 233,001 2,754,014 2,987,015 Committed:
Land Acquisition - - 200,115 200,115
Assigned:Culture and
Recreation - 3,480,883 - 3,480,883 Special Recreation - 2,105,898 - 2,105,898
- 5,586,781 - 5,586,781 Total 2,304$ 5,837,955$ 3,204,129$ 9,044,388$
b. Deficit Fund Equity
As of April 30, 2014, the Bond Proceeds Fund had a deficit fund balance of
$904,241. This deficit will be eliminated in fiscal year 2015 by the transfer of funds from the Bond Amortization/Debt Service Fund as part of the repayment of the short-term bond debt.
16. Interfund Receivables, Payables, and Transfers
There are no interfund receivables or payables as of April 30, 2014. Interfund transfers made during the year ended April 30, 2014 are summarized below:
Transfers In Transfers OutBond Proceeds Fund 1,060,660$ -$ Land Acquisition Fund 100,000 - Bond Amortization/Debt Service Fund - 1,060,660 General Fund - 100,000
Total 1,160,660$ 1,160,660$

- 58 -
The transfer from the Bond Amortization/Debt Service Fund into the Bond Proceeds Fund was related to the redemption payment and related interest of the 2012 G. O. bond. The transfer from the General Fund to the Land Acquisition Fund was to support that fund’s future capital projects as deemed appropriate by the Board of Commissioners.
17. Defined Benefit Pension Plan
Plan Description - The District’s defined benefit pension plan for regular employees provides retirement and disability benefits, post retirement increases, and death benefits to plan members and beneficiaries. The District’s plan is affiliated with the Illinois Municipal Retirement Fund (IMRF), an agent multiple-employer plan. Benefit provisions are established by statute and may only be changed by the General Assembly of the State of Illinois. IMRF issues a publicly available financial report that includes financial statements and required supplementary information. That report may be obtained on-line at www.imrf.org. Funding Policy - As set by statute, the District’s Regular Plan members are required to contribute 4.50 percent of their annual covered salary. The statute requires employers to contribute the amount necessary, in addition to member contributions, to finance the retirement coverage of its own employees. The employer annual required contribution rate for calendar year 2013 was 11.12 percent. The District also contributes for disability benefits, death benefits, and supplemental retirement benefits, all of which are pooled at the IMRF level. Contribution rates for disability and death benefits are set by the IMRF Board of Trustees, while the supplemental retirement benefits rate is set by statute. Annual Pension Cost - For fiscal year 2014, the District’s annual pension cost was $351,766 for the Regular Plan. The District’s actual contribution for fiscal year 2014 was $351,766. Through April 30, 2014, the District’s net pension obligation was $59,398. The net pension obligation is recorded as an accrued pension liability in the non-current liabilities on the government-wide statement of net position as of April 30, 2014.
Three-Year Trend Information for the Regular Plan
Annual Percentage
Fiscal Pension Cost of APC Net PensionYear Ending (APC) Contributed Obligation
4/30/14 351,766$ 100% 59,398$ 4/30/13 322,367 100% 59,398 4/30/12 324,176 97% 59,398

- 59 -
The net pension liability for the District is as follows: Annual Required Contribution (ARC) 347,311$ Interest on the NPO 2,970 Adjustment to the ARC 1,485 Annual Pension Cost 351,766 Actual Contribution 351,766 Increase to the NPO - Beginning of Year NPO 59,398 End of Year NPO 59,398$
The required contribution for 2013 was determined as part of the December 31, 2011, actuarial valuation using the entry age normal actuarial cost method. The actuarial assumptions at December 31, 2011, included (a) 7.5 percent investment rate of return (net of administrative and direct investment expenses), (b) projected salary increases of 4.0 percent a year, attributable to inflation, (c) additional projected salary increases ranging from 0.4 percent to 10.0 percent per year depending on age and service, attributable to seniority/merit, and (d) post retirement benefit increases of 3.0 percent annually. The actuarial value of the District’s Regular Plan assets was determined using techniques that spread the effects of short-term volatility in the market value of investments over a five-year period with a 20.0 percent corridor between the actuarial and market value of assets. The District’s Regular Plan’s unfunded actuarial accrued liability at December 31, 2011 is being amortized as a level percentage of projected payroll on an open 30 year basis. Funded Status and Funding Progress - As of December 31, 2013, the most recent actuarial valuation date, the Regular Plan was 90.22 percent funded. The actuarial accrued liability for benefits was $8,785,937 and the actuarial value of assets was $7,926,789, resulting in an underfunded actuarial accrued liability (UAAL) of $859,148. The covered payroll for calendar year 2013 (annual payroll of active employees covered by the Plan) was $3,152,212 and the ratio of UAAL to the covered payroll was 27 percent. The schedule of funding progress, presented as required supplementary information following the notes to the financial statements, presents multiyear trend information about whether the actuarial value of plan assets is increasing or decreasing over time relative to the actuarial accrued liability for benefits. The District provides no other postemployment benefits to employees.

- 60 -
18. Joint Risk Management Pool
The District is exposed to various risks related to torts; theft of, damage to, and destruction of assets; errors and omissions; injuries to employees; and net income losses. Since May 1, 1993, the District has been a member of the Park District Risk Management Agency (PDRMA) Property/Casualty Program. PDRMA is a public entity risk pool consisting of park districts, forest preserve districts, special recreation associations and certain nonprofit organizations serving the needs of public entities formed in accordance with the terms of an intergovernmental cooperative agreement among its members. The following table is a summary of the property/casualty coverage in effect for the period January 1, 2013 through January 1, 2014.
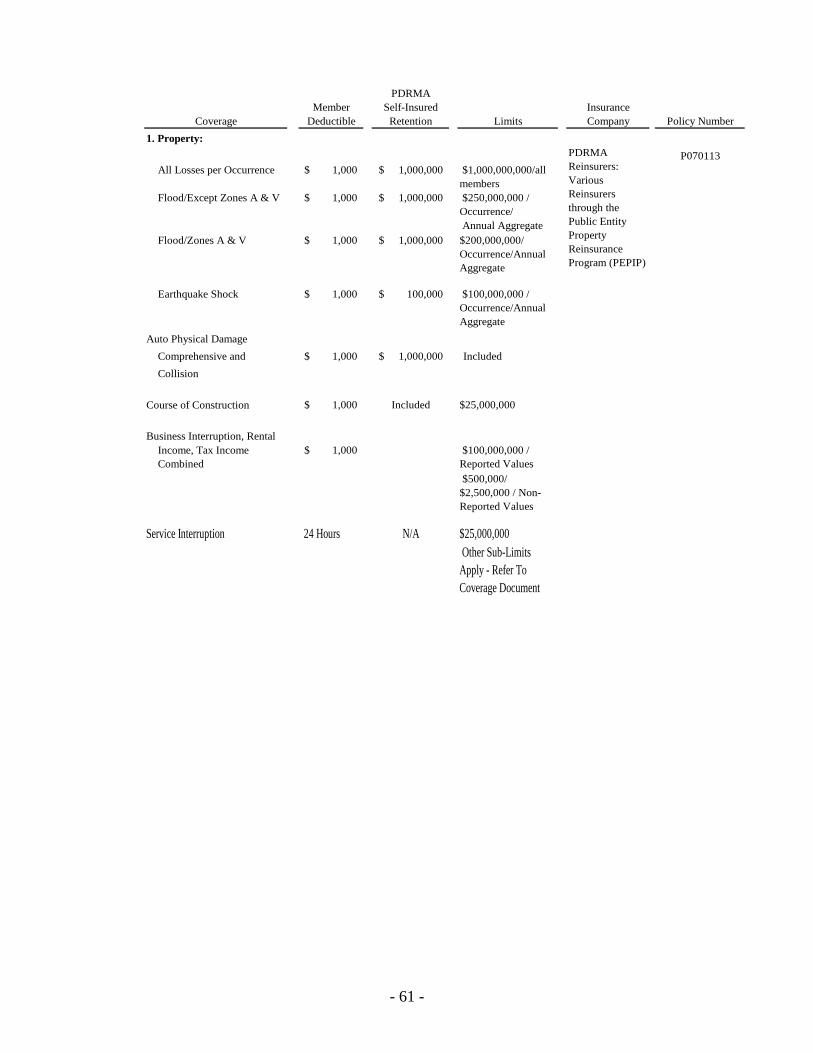
- 61 -
PDRMAMember Self-Insured Insurance
Deductible Retention Limits Company Policy Number
P070113All Losses per Occurrence 1,000$ 1,000,000$ $1,000,000,000/all
members Flood/Except Zones A & V 1,000$ 1,000,000$ $250,000,000 /
Occurrence/ Annual Aggregate
Flood/Zones A & V 1,000$ 1,000,000$
Earthquake Shock 1,000$ 100,000$ $100,000,000 / Occurrence/Annual Aggregate
Auto Physical Damage
Comprehensive and 1,000$ 1,000,000$ Included
Collision
1,000$ Included $25,000,000
Business Interruption, Rental1,000$ $100,000,000 /
Reported Values
$500,000/ $2,500,000 / Non-Reported Values
PDRMA Reinsurers: Various Reinsurers through the Public Entity Property Reinsurance Program (PEPIP)
Income, Tax Income Combined
$200,000,000/ Occurrence/Annual Aggregate
Coverage
1. Property:
Course of Construction
Service Interruption 24 Hours N/A $25,000,000 Other Sub-Limits Apply - Refer To Coverage Document

- 62 -
PDRMAMember Self-Insured Insurance
Deductible Retention Limits Company Policy NumberBoiler and MachineryProperty Damage 1,000$ 9,000$ $100,000,000
Equipment Breakdown
Travelers Indemnity Co. of Illinois
BME10525L478
Property Damage - Included
Business Income 48 Hours N/A IncludedOther Sub-Limits Apply - Refer To Coverage Document
Fidelity and Crime 1,000$ 24,000$ National Union
Seasonal Employees 1,000$ 9,000$ 01-770-96-51
Blanket Bond 1,000$ 24,000$
2. Workers Compensation:Employer's Liability N/A 500,000$ Statutory
500,000$ WC010114
3. Liability:General None 500,000$
L010114
GEM-0003-
Auto Liability None 500,000$ $21,500,000 / Occurrence
B14001
Employment Practices None 500,000$
Public Officials' Liability None 500,000$ $21,500,000 / Occurrence
Law Enforcement Liability None 500,000$ $21,500,000 / Occurrence
Uninsured/UnderinsuredMotorists None 500,000$ $1,000,000/Occurrence 8090020
4. Pollution LiabilityLiability - Third Party None 25,000$ $5,000,000 /
Occurrence XL Environmental Insurance
PEC 2535804
Property - First Party 1,000$ 24,000$ $30,000,000 3 yr. General Aggregate
Coverage
$1,000,000 / Occurrence
$2,000,000 / Occurrence
Fire Insurance Co.
$2,000,000 / Occurrence
GEM-0003-B14001
$3,500,000 Employers Liability
$21,500,000 / Occurrence
$21,500,000 / Occurrence
PDRMA Government Entities Mutual (GEM)
PDRMA Reinsurers: GEM/Great American/ Starr Indemnity and Liability Co.

- 63 -
PDRMAMember Self-Insured Insurance
Deductible Retention Limits Company Policy NumberCoverage5. Outbreak Expense 24 Hours N/A $15,000 per day Great American
$1,000,000 aggregate policy limit
6. Information Security
None 100,000$ C121280
None 100,000$ $500,000 / Occurrence / Annual Aggregate
AFB 2623/623 through the
PEPIP program
Regulatory Defense & Penalties
None 100,000$ $2,000,000 / Occurrence / Annual Aggregate
Website Media Content Liability
None 100,000$ $2,000,000 / Occurrence / Annual Aggregate
Cyber Extortion None 100,000$ $2,000,000 / Occurrence / Annual Aggregate
Data Protection & Business Interruption
1,000$ 100,000$ $2,000,000 / Occurrence / Annual Aggregate
First Party Business Interruption
8 hours 100,000$ $25,000 hourly sublimit/ $25,000 forensic expense/ $100,000 dependent business interruption
7. Volunteer Medical None 5,000$ $5,000 medical expense Self-insuredAccident and AD&D excess of any
other collectible insurance
8. Underground Storage None N/A $10,000, follows Illinois Self-insuredTank Liability Leaking Underground
Tank Fund
9. Unemployment N/A N/A Statutory Member-fundedCompensation
Privacy Notification Costs
Information Security & Privacy Liability
$2,000,000 / Occurrence / Annual Aggregate
Beasley Lloyds Syndicate
and Privacy Insurance with Electronic Media Liability Coverage

- 64 -
Losses exceeding the per-occurrence, self-insured, and reinsurance limit would be the responsibility of the District. During the year ended April 30, 2014, there were no significant reductions in coverage. Also, there have been no settlement amounts that have exceeded insurance coverage in the past three years. As a member of PDRMA’s Property/Casualty Program, the District is represented on the Property/Casualty Program Council and the Membership Assembly and is entitled to one vote on each. The relationship between the District and PDRMA is governed by a contract and by-laws that have been adopted by resolution of the District’s governing body. The District is contractually obligated to make all annual and supplementary contributions to PDRMA, to report claims on a timely basis, cooperate with PDRMA, its claims administrator and attorneys in claims investigation and settlement, and to follow risk management procedures as outlined by PDRMA. Members have a contractual obligation to fund any deficit of PDRMA attributable to a membership year during which they were a member. PDRMA is responsible for administering the self-insurance program and purchasing excess insurance according to the direction of the Program Council. PDRMA also provides its members with risk management services, including the defense of and settlement of claims, and establishes reasonable and necessary loss reduction and prevention procedures to be followed by the members. The following represents a summary of PDRMA’s balance sheet at December 31, 2013 and the statement of revenues and expenses for the period ending December 31, 2013. The District’s portion of the overall equity of the pool is 0.777 percent or $313,100. Assets 60,509,769$
Liabilities 20,225,423$
Member Balances 40,284,346$
Revenues 20,737,466$
Expenditures 17,177,774$
Since 97 percent of PDRMA’s liabilities are reserves for losses and loss adjustment expenses, which are based on an actuarial estimate of the ultimate losses incurred, the Member Balances are adjusted annually as more recent loss information becomes available.

- 65 -
19. Contingent Liabilities
The District participates in a number of state and federally assisted programs. Under the terms of the programs, periodic audits are required, and certain costs may be questioned as not being appropriate expenditures under the terms of these programs. Such audits could lead to reimbursements to grantor agencies. Based on prior experience, the District believes examinations would not result in any material disallowed costs for grant revenue recorded in these financial statements or from prior years. In the normal course of events, the District makes various commitments and incurs certain contingent liabilities that are not reflected in the accompanying financial statements. Additionally, various legal proceedings are pending against the District. Management believes that the aggregate liability, if any, resulting from these will not be material after insurance coverage.
20. Subsequent Events and Future Commitments
Through the date of the Independent Auditor’s Report, the District has various construction projects in progress or pending with commitments totaling approximately $1,841,000. These commitments are expected to be paid in fiscal year 2015 using funds from the General Fund ($119,000), Recreation Fund ($448,000), Bond Proceeds Fund ($226,000), Capital Improvements and Repair Fund ($423,000), Paving and Lighting Fund ($292,000), and the Special Recreation Fund ($333,000). The District has a contract for the purchase of electricity through June 2016. The contract contains set rates for kilowatt hours and calls for base consumption quantities. Total payments under the contract during fiscal year 2014 totaled approximately $167,000.
21. Discretely Presented Component Unit
The following notes are provided for the District’s component unit, Champaign Parks Foundation: A. Nature of Foundation
Champaign Parks Foundation (the Foundation) is a nonprofit corporation organized under the laws of the State of Illinois to develop philanthropic support for the Champaign Park District (the District). The Foundation is considered a component unit of the District under the accounting standards followed by the District; however, the Foundation is a separate legal entity. The Foundation’s only program relates to the support of the operational and capital needs of the District that lack adequate funding through the District’s available resources.
The Foundation’s major sources of revenue and support are contributions from donors, grants, and interest income.
- 66 -
B. Summary of Significant Accounting Policies
Following is a summary of the significant accounting policies of the Foundation:
a. The Foundation’s financial statements have been prepared in accordance with accounting principles generally accepted in the United States of America. Net assets of the Foundation and changes therein are classified and reported as follows:
Unrestricted Net Assets – Net assets that are not subject to donor-
imposed stipulations
Temporarily Restricted Net Assets – Net assets subject to donor-imposed stipulations that may or will be met, either by actions of the Board of Directors and/or passage of time. When a restriction expires, temporarily restricted net assets are reclassified to unrestricted net assets and reported in the statement of activities as net assets released from restrictions.
Permanently Restricted Net Assets – Net assets subject to donor-
imposed stipulations that must be maintained permanently by the Foundation. Generally, the donors of these assets permit the Foundation to use all or part of the income earned for general or specific purposes.
b. Cash and cash equivalents consist of deposits in checking accounts,
money market accounts, and certificates of deposit with maturities less than three months. These certificates of deposit are carried at cost.
c. Contributions of facilities are capitalized if the appraised value of the
property exceeds the Foundation’s capitalization threshold of $5,000. Contributed services are reported as contribution revenue and as assets or expenses only if the services create or enhance a non-financial asset (for example, property and equipment) or:
Would typically need to be purchased by the Foundation if the
services had not been provided by contribution
Require specialized skills
Are provided by individuals with those skills d. Promises to give consist of unconditional promises to give to the
Foundation. The carrying amount of promises to give may be reduced by a valuation allowance based on management’s assessment of the collectability of specific pledge balances. Management has provided no allowance for uncollectible promises to give based upon management’s assessment of the collectability of the existing specific promises to give.

- 67 -
e. Grants receivable results from grants for which support has been recognized but funds from the grantor have not been received before April 30, 2014. Grants receivable are stated at the amount management expects to collect from the balances outstanding at year-end. Management has provided no allowance for uncollectible grants receivable based upon management’s assessment of the collectability of the existing specific grants receivable.
f. The Foundation is exempt from federal income taxes under Section
501(c)(3) of the Internal Revenue Code.
g. The costs of providing the various programs and other activities have been summarized on a functional basis in the statement of activities. Accordingly, certain costs have been allocated among the programs and supporting services benefited.
h. As of April 30, 2014, the federal and Illinois tax filings that fall within the
applicable statutes of limitation remain open for review by tax authorities.
i. The Foundation’s management has reviewed subsequent events from April 30, 2014 to August 11, 2014, which is the date the financial statements were available to be issued.
j. The preparation of financial statements in conformity with accounting
principles generally accepted in the United States of America requires management to make estimates and assumptions that affect certain reported amounts and disclosures. Accordingly, actual results could differ from those estimates.

- 68 -
C. Cash and Cash Equivalents
Cash and cash equivalents consist of the following at April 30:
2014 2013Cash 163,085$ 41,341$ Money Market 85,906 85,785 Certificates of Deposit 355,833 457,773
Total 604,824$ 584,899$
D. Temporarily Restricted Net Assets
Temporarily restricted net assets are available for the following purposes at April 30:
2014 2013
Virginia Theatre Restoration 118,682$ 105,309$ West Side Park Sculptures 57,867 62,136 Memorial Tree 29,152 28,165 CUSR 26,344 20,064 William Wagner Trust 18,356 18,356 Carragher Trust - Virginia Theatre Restoration 17,564 12,616 West Side Park 16,853 16,853 Prairie Farm 15,652 13,345 Amdocs Project 14,445 14,445 Meditation Gardens 11,481 11,481 Leonhard Recreation Center 10,732 - Scholarships 5,576 11,961 Aquatic Center - 50,187 Leonhard Memorial - 22,762 Various - Under $10,000 51,633 43,943
Total 394,337$ 431,623$
E. Permanently Restricted Net Assets
Permanently restricted net assets consist of the H.E. Moore Trust of $68,119 as of April 30, 2014 and 2013.

- 69 -
F. Endowment
The Foundation is following the Uniform Prudent Management of Institutional Funds Act adopted by the State of Illinois. As a result, the Foundation classifies as permanently restricted net assets (a) the original value of gifts donated to the permanent endowment, (b) the original value of subsequent gifts to the permanent endowment, and (c) accumulations to the permanent endowment made in accordance with the direction of the applicable donor gift instrument at the time the accumulation is added to the fund. The remaining portion of the donor-restricted endowment fund that is not classified in permanently restricted net assets should be classified as temporarily restricted net assets until those assets are appropriated for expenditure by the Foundation’s Board of Directors. However, because the endowment donor has not placed restrictions on the use of the investment income or the net appreciation resulting from the donor-restricted endowment funds, and because the investment income is not a significant amount annually, all endowment income and appropriation activity is presented in the unrestricted column on the statements of activities.
The Foundation has not adopted an investment policy or spending policy related to the endowment; however, the objective of the Foundation is to maintain the purchasing power of the endowment assets. Endowment assets are invested in cash equivalents. The investment policy of the Foundation is to invest cash equivalents into high-quality instruments with high liquidity and current maturity of one year or less. Actual returns in any given year may vary. Investment income earned from the endowment is spent in accordance with the Foundation’s mission.
Total endowment net assets of $68,119 at April 30, 2014 and 2013 were permanently restricted and had no change in value during the years ended April 30, 2014 and 2013.
G. Related Party Transactions
The District provided donated services to the Foundation. Donated services consist of salaries of District personnel assigned to perform management and fund raising services for the Foundation. For the years ended April 30, 2014 and 2013, the amount contributed and included as in-kind revenues totaled $64,337 and $50,607, respectively. An equivalent expense is included in the statement of activities. For the years ended April 30, 2014 and 2013, the Foundation also received $44,158 and $36,101 from the District in contributions, of which $41,544 and $25,000, respectively, was transferred back to the District. For the years ended April 30, 2014 and 2013, the District’s contributions of $44,158 and $36,101, respectively, consist of funds contributed directly to the District that have been transferred to the Foundation for maintenance of the contributions until the funds are needed by the District. The contribution amounts are 22 and 16 percent of the Foundation’s total support and revenue for the years ended April 30, 2014 and 2013, respectively.

- 70 -
H. Prior Period Adjustments
The accompanying financial statements include a prior period adjustment to correct an error made prior to the year ended April 30, 2013. The Foundation’s individual fund totals were not properly aggregated by type of donor restriction (Temporarily Restricted and Permanently Restricted). The aggregate difference in Total Net Assets at April 30, 2012 is $0. The adjustment had no impact on the change in net assets for the years ended April 30, 2014 and 2013.
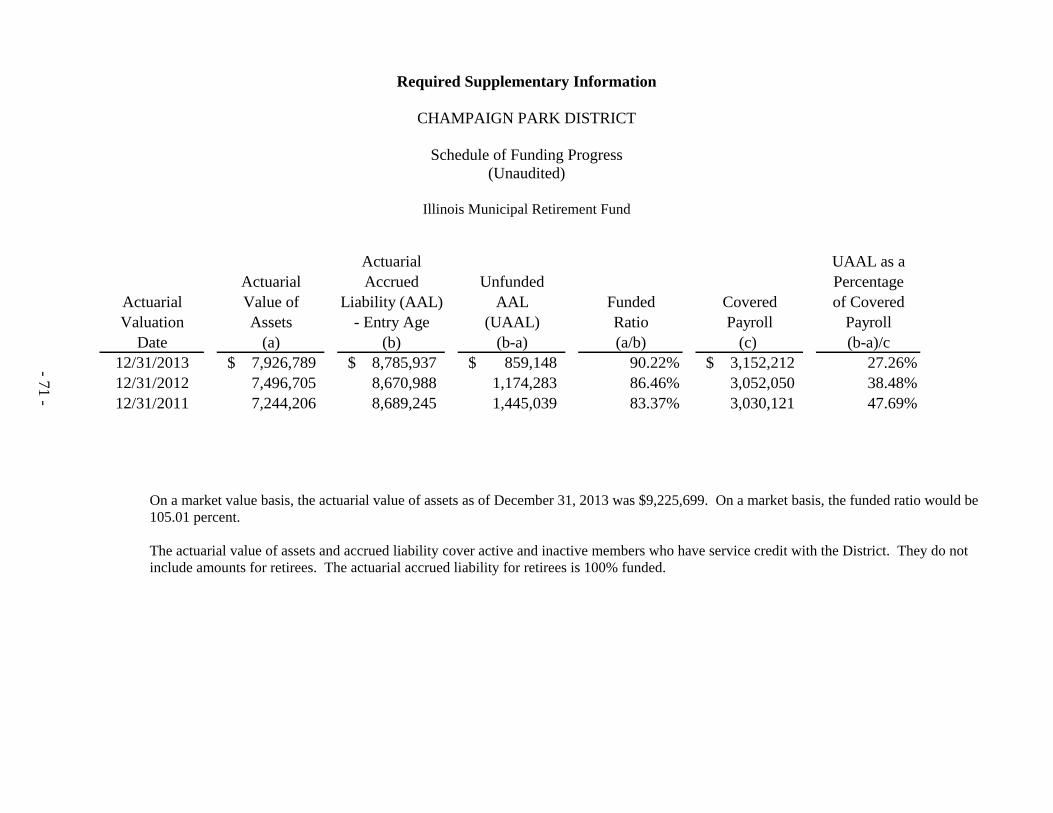
Required Supplementary Information
CHAMPAIGN PARK DISTRICT
Schedule of Funding Progress (Unaudited)
Illinois Municipal Retirement Fund
Actuarial UAAL as aActuarial Accrued Unfunded Percentage
Actuarial Value of Liability (AAL) AAL Funded Covered of CoveredValuation Assets - Entry Age (UAAL) Ratio Payroll Payroll
Date (a) (b) (b-a) (a/b) (c) (b-a)/c12/31/2013 7,926,789$ 8,785,937$ 859,148$ 90.22% 3,152,212$ 27.26%12/31/2012 7,496,705 8,670,988 1,174,283 86.46% 3,052,050 38.48%12/31/2011 7,244,206 8,689,245 1,445,039 83.37% 3,030,121 47.69%
- 71 -
On a market value basis, the actuarial value of assets as of December 31, 2013 was $9,225,699. On a market basis, the funded ratio would be 105.01 percent.
The actuarial value of assets and accrued liability cover active and inactive members who have service credit with the District. They do not include amounts for retirees. The actuarial accrued liability for retirees is 100% funded.

COMBINING STATEMENTS

Debt Service Fund Permanent Fund TotalBond Paving Capital Non-Major
Liability Social Police Special Amortization/ and Improvements Land Working GovernmentalInsurance IMRF Audit Security Protection Donation Debt Service Lighting and Repair Acquisition Cash Funds
ASSETS
Cash and Cash Equivalents 355,036$ 148,031$ 13,775$ 267,962$ 32,057$ 66,313$ 4,494$ 228,768$ 334,662$ 200,115$ 250,000$ 1,901,213$ Receivables:
Accounts Receivable - - - - - - - - 116,281 - - 116,281 Intergovernmental - - - - - - - - 45,388 - - 45,388 Property Taxes 313,214 366,907 20,881 347,518 23,864 - 1,437,799 74,575 - - - 2,584,758
Total Assets 668,250$ 514,938$ 34,656$ 615,480$ 55,921$ 66,313$ 1,442,293$ 303,343$ 496,331$ 200,115$ 250,000$ 4,647,640$
LIABILITIES, DEFERRED INFLOWS OF RESOURCES, AND FUND BALANCES
LIABILITIESAccrued Salaries Payable 2,177$ 17,697$ -$ 16,579$ -$ -$ -$ -$ -$ -$ -$ 36,453$ Accounts Payable 19,528 - - - - - - 7,400 121,576 - - 148,504 Unearned Revenue 440 - - - - - - 42,600 - - - 43,040
Total Liabilities 22,145 17,697 - 16,579 - - - 50,000 121,576 - - 227,997
DEFERRED INFLOWS OF RESOURCES
Unavailable Revenue - Property Taxes 147,120 172,425 10,005 163,304 11,181 - 676,169 35,310 - - - 1,215,514
FUND BALANCESNon-spendable, Permanent Fund - - - - - - - - - - 250,000 250,000 Restricted 498,985 324,816 24,651 435,597 44,740 66,313 766,124 218,033 374,755 - - 2,754,014 Committed - - - - - - - - - 200,115 - 200,115 Assigned - - - - - - - - - - - - Unassigned - - - - - - - - - - - -
Total Fund Balances 498,985 324,816 24,651 435,597 44,740 66,313 766,124 218,033 374,755 200,115 250,000 3,204,129 Total Liabilities, Deferred Inflows of Resources, and Fund Balances 668,250$ 514,938$ 34,656$ 615,480$ 55,921$ 66,313$ 1,442,293$ 303,343$ 496,331$ 200,115$ 250,000$ 4,647,640$
- 72 -
Combining Balance Sheet - CHAMPAIGN PARK DISTRICT
Schedule 1
Non-Major Governmental FundsApril 30, 2014
Special Revenue Funds Capital Projects Funds

Debt Service Fund Permanent Fund TotalBond Paving Capital Non-Major
Liability Social Police Special Amortization/ and Improvements Land Working GovernmentalInsurance IMRF Audit Security Protection Donation Debt Service Lighting and Repair Acquisition Cash Funds
RevenuesProperty Taxes 302,522$ 340,835$ 20,395$ 348,023$ 23,783$ -$ 1,281,045$ 75,727$ -$ -$ -$ 2,392,330$ Intergovernmental Revenues - - - - - - - - 275,043 - - 275,043 Charges for Services, Program Rentals and
Related Items 1,272 - - - - - - - - - - 1,272 Contributions and Sponsorships - - - - - 81,515 - - - - - 81,515 Merchandise and Concession Sales - - - - - - - - - - - - Grants - - - - - - - 207,400 - - - 207,400 Interest Income 417 104 6 132 18 16 176 25 2,027 58 - 2,979 Special Receipts - - - - - - - - 116,281 - - 116,281 Miscellaneous - - - - - - - - - - - -
Total Revenues 304,211 340,939 20,401 348,155 23,801 81,531 1,281,221 283,152 393,351 58 - 3,076,820
ExpendituresCurrent:
Culture and Recreation:Salaries and Wages 46,127 - - - - - - - - - - 46,127 Fringe Benefits 11,712 361,031 - 339,102 - - - - - - - 711,845 Commodities 5,741 - - - - - - - 11,619 - - 17,360 Contractual Services 200,547 - 18,000 - 16,671 46,819 - - - - - 282,037
Total Current 264,127 361,031 18,000 339,102 16,671 46,819 - - 11,619 - - 1,057,369 Capital Outlay 40,925 - - - - - - 233,756 1,012,708 - - 1,287,389
Total Expenditures 305,052 361,031 18,000 339,102 16,671 46,819 - 233,756 1,024,327 - - 2,344,758
Net Excess (Deficit) ofRevenues over Expenditures (841) (20,092) 2,401 9,053 7,130 34,712 1,281,221 49,396 (630,976) 58 - 732,062
Other Financing Sources (Uses)Transfers In - - - - - - - - - 100,000 - 100,000 Transfers Out - - - - - - (1,060,660) - - - - (1,060,660)
Net Other Financing Sources (Uses): - - - - - - (1,060,660) - - 100,000 - (960,660)
Net Change in Fund Balances (841) (20,092) 2,401 9,053 7,130 34,712 220,561 49,396 (630,976) 100,058 - (228,598)
Fund Balance, Beginning of Year 499,826 344,908 22,250 426,544 37,610 31,601 545,563 168,637 1,005,731 100,057 250,000 3,432,727
Fund Balance, End of Year 498,985$ 324,816$ 24,651$ 435,597$ 44,740$ 66,313$ 766,124$ 218,033$ 374,755$ 200,115$ 250,000$ 3,204,129$
Schedule 2
Special Revenue Funds
- 73 -
CHAMPAIGN PARK DISTRICT
For the Year Ended April 30, 2014 Non-Major Governmental Funds
Combining Statement of Revenues, Expenditures, and Changes in Fund Balances -
Capital Projects Funds

SPECIAL REVENUE FUNDS

Actual(Budgetary Budget Budget
Basis) (Final) (Original)REVENUES
Property Taxes 277,581$ 277,000$ 277,000$ Intergovernmental Revenues - - - Charges for Services, Program Rentals, and Related Items 1,272 - - Contributions and Sponsorships - - - Merchandise and Concession Sales - - - Grants - - - Interest Income 417 300 300 Special Receipts - 4,000 4,000
Miscellaneous - - - Total Revenues 279,270 281,300 281,300
EXPENDITURESCurrent:
Culture and Recreation:Salaries and Wages 45,119 47,500 47,500 Fringe Benefits 11,712 12,000 12,000 Commodities 5,741 6,000 6,000 Contractual Services 200,547 264,000 264,000
Total Current 263,119 329,500 329,500
Capital Outlay 40,925 40,000 40,000
Total Expenditures 304,044 369,500 369,500
Net Excess (Deficit) of Revenues
over Expenditures (24,774) (88,200) (88,200)
OTHER FINANCING SOURCES (USES)
Transfers In - - -
Transfers Out - - -
Net Other Financing Sources (Uses) - - -
Net Change in Fund Balances (24,774) (88,200) (88,200)
Fund Balance, Beginning of Year 499,826 499,826 499,826
Fund Balance, End of Year - Budgetary Basis 475,052 411,626$ 411,626$
Revenue Conversion to GAAP Basis:Property Taxes 24,941
Expenditure Conversion to GAAP Basis:Accrued Salaries and Wages (1,008)
Fund Balance, GAAP Basis 498,985$
Liability Insurance FundFor the Year Ended April 30, 2014
- 74 -
Schedule 3
CHAMPAIGN PARK DISTRICTSchedule of Revenues, Expenditures, and Changes in Fund Balance -
Actual (Budgetary Basis) Versus Budget

Actual(Budgetary Budget Budget
Basis) (Final) (Original)REVENUES
Property Taxes 297,299$ 297,650$ 297,650$ Intergovernmental Revenues - - - Charges for Services, Program Rentals and Related Items - - - Contributions and Sponsorships - - - Merchandise and Concession Sales - - - Grants - - - Interest Income 104 196 196 Special Receipts - - - Miscellaneous - - -
Total Revenues 297,403 297,846 297,846
EXPENDITURESCurrent:
Culture and Recreation:Salaries and Wages - - - Fringe Benefits 361,031 350,000 350,000 Commodities - - - Contractual Services - - -
Total Current 361,031 350,000 350,000 Capital Outlay - - -
Total Expenditures 361,031 350,000 350,000
Net Excess (Deficit) of Revenuesover Expenditures (63,628) (52,154) (52,154)
OTHER FINANCING SOURCES (USES)Transfers In - - - Transfers Out - - -
Net Other Financing Sources (Uses) - - -
Net Change in Fund Balances (63,628) (52,154) (52,154)
Fund Balance, Beginning of Year 344,908 344,908 344,908
Fund Balance, End of Year - Budgetary Basis 281,280 292,754$ 292,754$
Revenue Conversion to GAAP Basis:Property Taxes 43,536
Expenditure Conversion to GAAP Basis:Accrued Fringe Benefit -
Fund Balance, GAAP Basis 324,816$
Schedule 4
CHAMPAIGN PARK DISTRICT
- 75 -
Schedule of Revenues, Expenditures, and Changes in Fund Balance -Actual (Budgetary Basis) Versus Budget
Illinois Municipal Retirement FundFor the Year Ended April 30, 2014

Actual(Budgetary Budget Budget
Basis) (Final) (Original)REVENUES
Property Taxes 19,719$ 18,948$ 18,948$ Intergovernmental Revenues - - - Charges for Services, Program Rentals and Related Items - - - Contributions and Sponsorships - - - Merchandise and Concession Sales - - - Grants - - - Interest Income 6 12 12 Special Receipts - - - Miscellaneous - - -
Total Revenues 19,725 18,960 18,960
EXPENDITURESCurrent:
Culture and Recreation:Salaries and Wages - - - Fringe Benefits - - - Commodities - - - Contractual Services 18,000 18,000 18,000
Total Current 18,000 18,000 18,000 Capital Outlay - - -
Total Expenditures 18,000 18,000 18,000
Net Excess (Deficit) of Revenues over Expenditures 1,725 960 960
OTHER FINANCING SOURCES (USES)Transfers In - - - Transfers Out - - -
Net Other Financing Sources (Uses) - - -
Net Change in Fund Balances 1,725 960 960
Fund Balance, Beginning of Year 22,250 22,250 22,250
Fund Balance, End of Year - Budgetary Basis 23,975 23,210$ 23,210$
Revenue Conversion to GAAP Basis:Property Taxes 676
Fund Balance, GAAP Basis 24,651$
Audit FundFor the Year Ended April 30, 2014
- 76 -
Schedule 5
CHAMPAIGN PARK DISTRICTSchedule of Revenues, Expenditures, and Changes in Fund Balance -
Actual (Budgetary Basis) Versus Budget
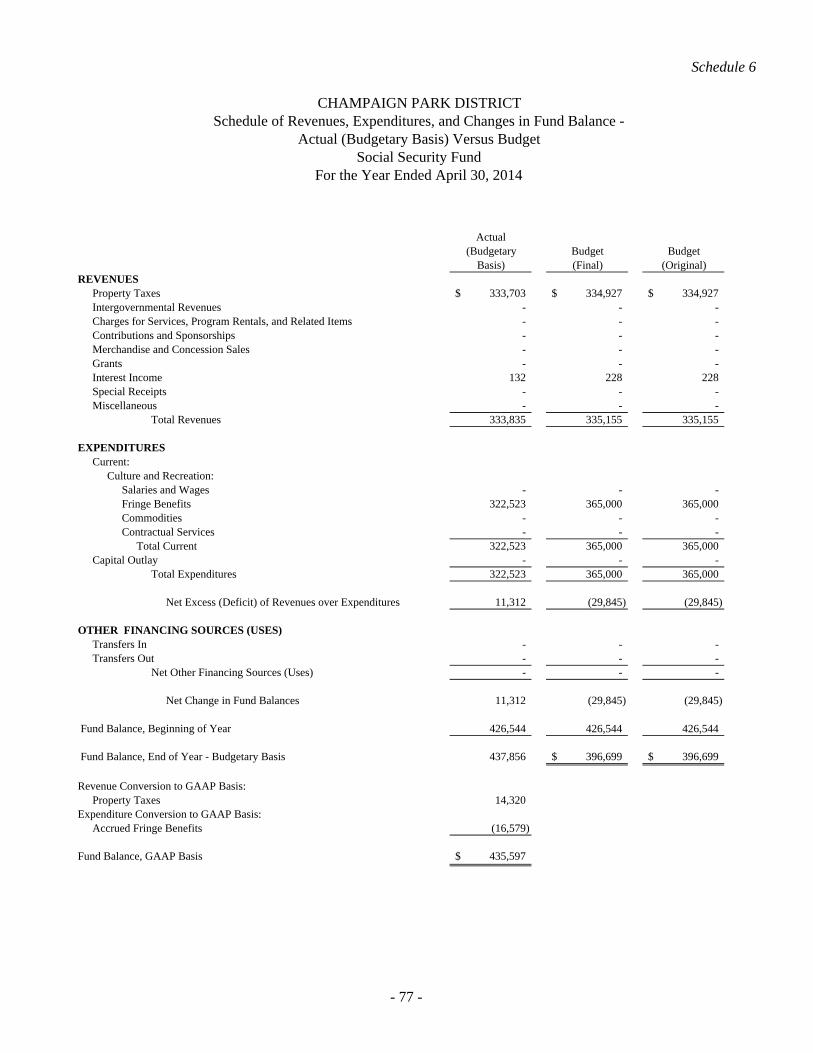
Actual(Budgetary Budget Budget
Basis) (Final) (Original)REVENUES
Property Taxes 333,703$ 334,927$ 334,927$ Intergovernmental Revenues - - - Charges for Services, Program Rentals, and Related Items - - - Contributions and Sponsorships - - - Merchandise and Concession Sales - - - Grants - - - Interest Income 132 228 228 Special Receipts - - - Miscellaneous - - -
Total Revenues 333,835 335,155 335,155
EXPENDITURESCurrent:
Culture and Recreation:Salaries and Wages - - - Fringe Benefits 322,523 365,000 365,000 Commodities - - - Contractual Services - - -
Total Current 322,523 365,000 365,000 Capital Outlay - - -
Total Expenditures 322,523 365,000 365,000
Net Excess (Deficit) of Revenues over Expenditures 11,312 (29,845) (29,845)
OTHER FINANCING SOURCES (USES)Transfers In - - - Transfers Out - - -
Net Other Financing Sources (Uses) - - -
Net Change in Fund Balances 11,312 (29,845) (29,845)
Fund Balance, Beginning of Year 426,544 426,544 426,544
Fund Balance, End of Year - Budgetary Basis 437,856 396,699$ 396,699$
Revenue Conversion to GAAP Basis:Property Taxes 14,320
Expenditure Conversion to GAAP Basis:Accrued Fringe Benefits (16,579)
Fund Balance, GAAP Basis 435,597$
Social Security FundFor the Year Ended April 30, 2014
- 77 -
Schedule 6
CHAMPAIGN PARK DISTRICTSchedule of Revenues, Expenditures, and Changes in Fund Balance -
Actual (Budgetary Basis) Versus Budget
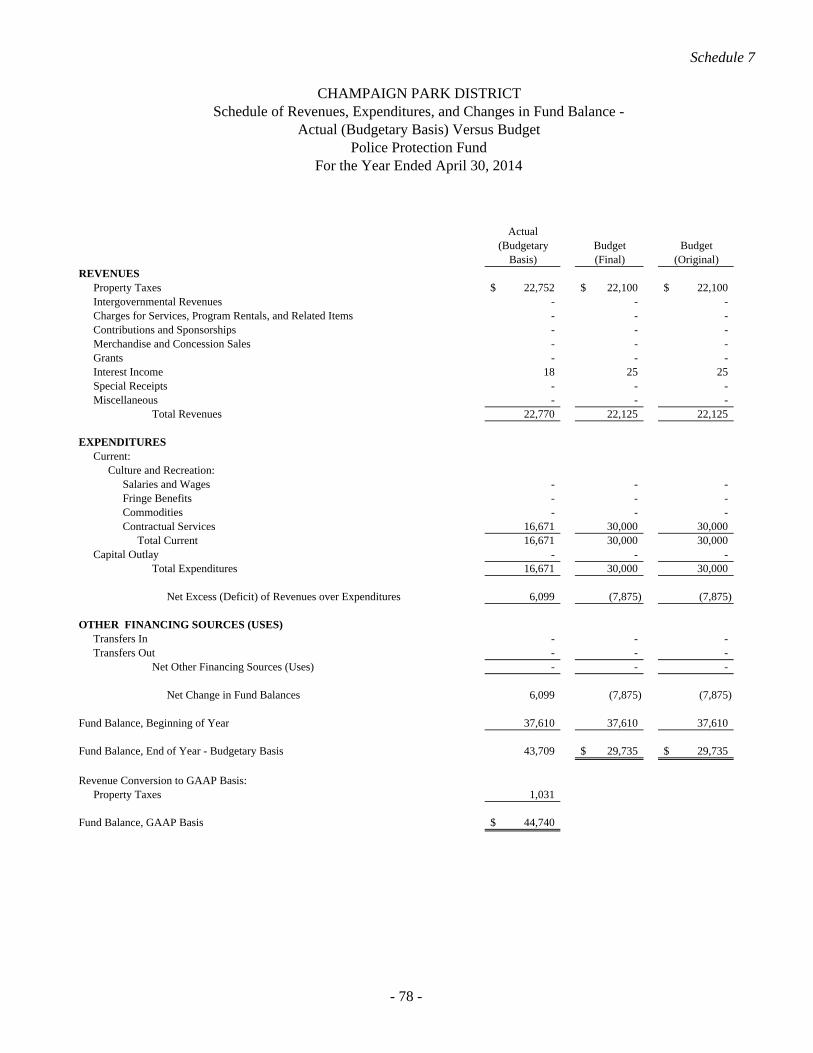
Actual(Budgetary Budget Budget
Basis) (Final) (Original)REVENUES
Property Taxes 22,752$ 22,100$ 22,100$ Intergovernmental Revenues - - - Charges for Services, Program Rentals, and Related Items - - - Contributions and Sponsorships - - - Merchandise and Concession Sales - - - Grants - - - Interest Income 18 25 25 Special Receipts - - - Miscellaneous - - -
Total Revenues 22,770 22,125 22,125
EXPENDITURESCurrent:
Culture and Recreation:Salaries and Wages - - - Fringe Benefits - - - Commodities - - - Contractual Services 16,671 30,000 30,000
Total Current 16,671 30,000 30,000 Capital Outlay - - -
Total Expenditures 16,671 30,000 30,000
Net Excess (Deficit) of Revenues over Expenditures 6,099 (7,875) (7,875)
OTHER FINANCING SOURCES (USES)Transfers In - - - Transfers Out - - -
Net Other Financing Sources (Uses) - - -
Net Change in Fund Balances 6,099 (7,875) (7,875)
Fund Balance, Beginning of Year 37,610 37,610 37,610
Fund Balance, End of Year - Budgetary Basis 43,709 29,735$ 29,735$
Revenue Conversion to GAAP Basis:Property Taxes 1,031
Fund Balance, GAAP Basis 44,740$
- 78 -
For the Year Ended April 30, 2014Police Protection Fund
Schedule 7
Actual (Budgetary Basis) Versus BudgetSchedule of Revenues, Expenditures, and Changes in Fund Balance -
CHAMPAIGN PARK DISTRICT

Actual(Budgetary Budget Budget
Basis) (Final) (Original)REVENUES
Property Taxes -$ -$ -$ Intergovernmental Revenues - - - Charges for Services, Program Rentals, and Related Items - - - Contributions and Sponsorships 81,515 50,000 50,000 Merchandise and Concession Sales - - - Grants - - - Interest Income 16 10 10 Special Receipts - - - Miscellaneous - - -
Total Revenues 81,531 50,010 50,010
EXPENDITURESCurrent:
Culture and Recreation:Salaries and Wages - - - Fringe Benefits - - - Commodities - - - Contractual Services 46,819 60,000 60,000
Total Current 46,819 60,000 60,000 Capital Outlay - - -
Total Expenditures 46,819 60,000 60,000
Net Excess (Deficit) of Revenues over Expenditures 34,712 (9,990) (9,990)
OTHER FINANCING SOURCES (USES)Transfers In - - - Transfers Out - - -
Net Other Financing Sources (Uses) - - -
Net Change in Fund Balances 34,712 (9,990) (9,990)
Fund Balance, Beginning of Year 31,601 31,601 31,601
Fund Balance, End of Year - Budgetary Basis 66,313 21,611$ 21,611$
Revenue Conversion to GAAP Basis:Property Taxes -
Fund Balance, GAAP Basis 66,313$
- 79 -
Special Donation FundFor the Year Ended April 30, 2014
Schedule 8
CHAMPAIGN PARK DISTRICTSchedule of Revenues, Expenditures, and Changes in Fund Balance -
Actual (Budgetary Basis) Versus Budget

DEBT SERVICE FUND

Actual(Budgetary Budget Budget
Basis) (Final) (Original)REVENUES
Property Taxes 1,057,229$ 1,062,000$ 1,062,000$ Intergovernmental Revenues - - - Charges for Services, Program Rentals, and Related Items - - - Contributions and Sponsorships - - - Merchandise and Concession Sales - - - Grants - - - Interest Income 176 250 250 Special Receipts - - - Miscellaneous - - -
Total Revenues 1,057,405 1,062,250 1,062,250
EXPENDITURESCurrent:
Culture and Recreation:Salaries and Wages - - - Fringe Benefits - - - Commodities - - - Contractual Services - - -
Total Current - - - Capital Outlay - - - Debt Service:
Principal - 1,051,000 1,051,000 Interest and Fees - 10,295 10,295
Total Expenditures - 1,061,295 1,061,295
Net Excess (Deficit) of Revenues over Expenditures 1,057,405 955 955
OTHER FINANCING SOURCES (USES)Transfers In - - - Transfers Out (1,060,660) - -
Net Other Financing Sources (Uses) (1,060,660) - -
Net Change in Fund Balances (3,255) 955 955
Fund Balance, Beginning of Year 545,563 545,563 545,563
Fund Balance, End of Year - Budgetary Basis 542,308 546,518$ 546,518$
Revenue Conversion to GAAP Basis:Property Taxes 223,816
Fund Balance, GAAP Basis 766,124$
For the Year Ended April 30, 2014Bond Amortization/Debt Service Fund
- 80 -
Schedule 9
Actual (Budgetary Basis) Versus BudgetSchedule of Revenues, Expenditures, and Changes in Fund Balance -
CHAMPAIGN PARK DISTRICT

CAPITAL PROJECTS FUNDS
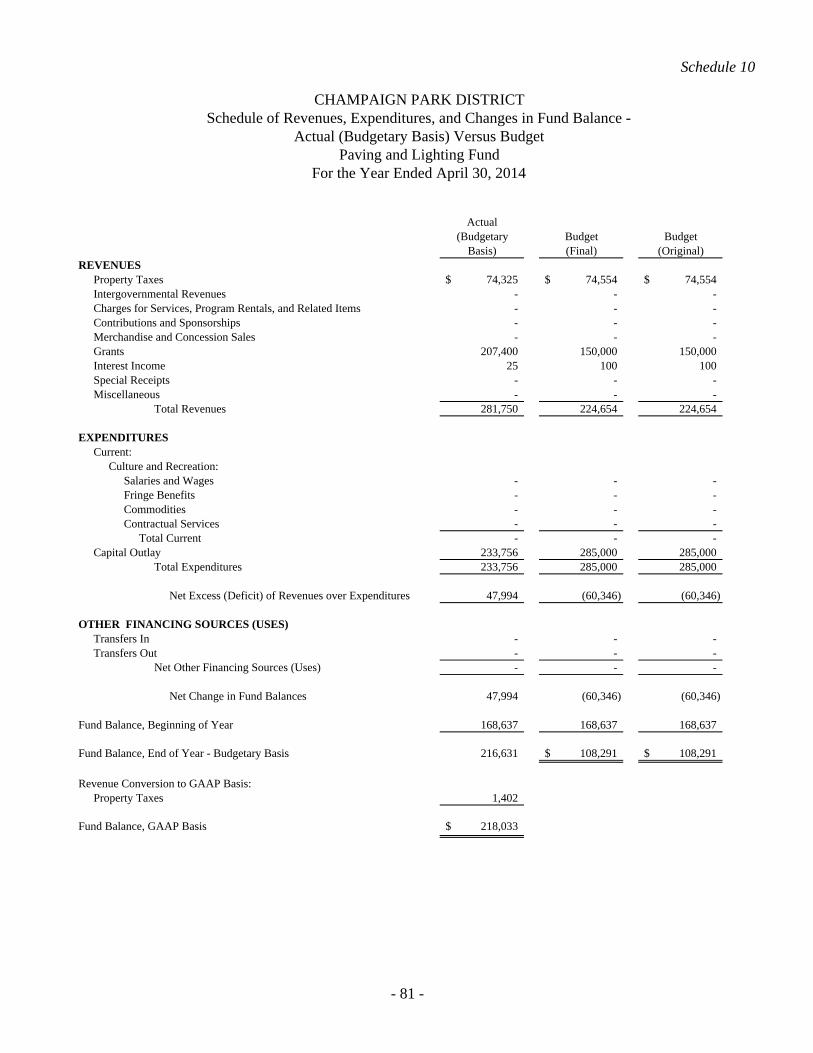
Actual(Budgetary Budget Budget
Basis) (Final) (Original)REVENUES
Property Taxes 74,325$ 74,554$ 74,554$ Intergovernmental Revenues - - - Charges for Services, Program Rentals, and Related Items - - - Contributions and Sponsorships - - - Merchandise and Concession Sales - - - Grants 207,400 150,000 150,000 Interest Income 25 100 100 Special Receipts - - - Miscellaneous - - -
Total Revenues 281,750 224,654 224,654
EXPENDITURESCurrent:
Culture and Recreation:Salaries and Wages - - - Fringe Benefits - - - Commodities - - - Contractual Services - - -
Total Current - - - Capital Outlay 233,756 285,000 285,000
Total Expenditures 233,756 285,000 285,000
Net Excess (Deficit) of Revenues over Expenditures 47,994 (60,346) (60,346)
OTHER FINANCING SOURCES (USES)Transfers In - - - Transfers Out - - -
Net Other Financing Sources (Uses) - - -
Net Change in Fund Balances 47,994 (60,346) (60,346)
Fund Balance, Beginning of Year 168,637 168,637 168,637
Fund Balance, End of Year - Budgetary Basis 216,631 108,291$ 108,291$
Revenue Conversion to GAAP Basis:Property Taxes 1,402
Fund Balance, GAAP Basis 218,033$
Paving and Lighting FundFor the Year Ended April 30, 2014
- 81 -
Schedule 10
CHAMPAIGN PARK DISTRICTSchedule of Revenues, Expenditures, and Changes in Fund Balance -
Actual (Budgetary Basis) Versus Budget

Actual(Budgetary Budget Budget
Basis) (Final) (Original)REVENUES
Property Taxes -$ -$ -$ Intergovernmental Revenues 275,043 240,000 240,000 Charges for Services, Program Rentals, and Related Items - - - Contributions and Sponsorships - - - Merchandise and Concession Sales - - - Grants - - - Interest Income 2,027 3,000 3,000 Special Receipts 116,281 160,000 160,000 Miscellaneous - - -
Total Revenues 393,351 403,000 403,000
EXPENDITURESCurrent:
Culture and Recreation:Salaries and Wages - - - Fringe Benefits - - - Commodities 11,619 15,000 15,000 Contractual Services - 20,000 20,000
Total Current 11,619 35,000 35,000 Capital Outlay 1,012,708 1,232,300 1,232,300
Total Expenditures 1,024,327 1,267,300 1,267,300
Net Excess (Deficit) of Revenues over Expenditures (630,976) (864,300) (864,300)
OTHER FINANCING SOURCES (USES)Transfers In - - - Transfers Out - - -
Net Other Financing Sources (Uses) - - -
Net Change in Fund Balances (630,976) (864,300) (864,300)
Fund Balance, Beginning of Year 1,005,731 1,005,731 1,005,731
Fund Balance, End of Year - Budgetary Basis 374,755 141,431$ 141,431$
Revenue Conversion to GAAP Basis:Property Taxes -
Fund Balance, GAAP Basis 374,755$
- 82 -
For the Year Ended April 30, 2014Capital Improvements and Repair Fund
Schedule 11
Actual (Budgetary Basis) Versus BudgetSchedule of Revenues, Expenditures, and Changes in Fund Balance -
CHAMPAIGN PARK DISTRICT

Actual(Budgetary Budget Budget
Basis) (Final) (Original)REVENUES
Property Taxes -$ -$ -$ Intergovernmental Revenues - - - Charges for Services, Program Rentals, and Related Items - - - Contributions and Sponsorships - - - Merchandise and Concession Sales - - - Grants - - - Interest Income 58 60 60Special Receipts - 100,000 100,000 Miscellaneous - - -
Total Revenues 58 100,060 100,060
EXPENDITURESCurrent:
Culture and Recreation:Salaries and Wages - - - Fringe Benefits - - - Commodities - - - Contractual Services - - -
Total Current - - - Capital Outlay - - -
Total Expenditures - - -
Net Excess (Deficit) of Revenues over Expenditures 58 100,060 100,060
OTHER FINANCING SOURCES (USES)Transfers In 100,000 - - Transfers Out - - -
Net Other Financing Sources (Uses) 100,000 - -
Net Change in Fund Balances 100,058 100,060 100,060
Fund Balance, Beginning of Year 100,057 100,057 100,057
Fund Balance, End of Year - Budgetary Basis 200,115 200,117$ 200,117$
Revenue Conversion to GAAP Basis:Property Taxes -
Fund Balance, GAAP Basis 200,115$
- 83 -
Schedule 12
CHAMPAIGN PARK DISTRICTSchedule of Revenues, Expenditures, and Changes in Fund Balance -
Actual (Budgetary Basis) Versus BudgetLand Acquisition Fund
For the Year Ended April 30, 2014

Schedule of Revenues, Expenditures, and Changes in Fund Balance -
Actual(Budgetary Budget Budget
Basis) (Final) (Original)REVENUES
Property Taxes -$ -$ -$ Intergovernmental Revenues - - - Charges for Services, Program Rentals, and Related Items - - - Contributions and Sponsorships - - - Merchandise and Concession Sales - - - Grants - - - Interest Income 91 160 160 Special Receipts - - - Miscellaneous - - -
Total Revenues 91 160 160
EXPENDITURESCurrent:
Culture and Recreation:Salaries and Wages - - - Fringe Benefits - - - Commodities - - - Contractual Services 3,597 20,000 20,000
Total Current 3,597 20,000 20,000 Capital Outlay 660,422 1,082,430 1,082,430 Debt Service:
Principal 375,000 330,000 330,000 Interest and Fees 191,901 206,670 206,670 Bond Issuance Costs 93,279 - -
Total Expenditures 1,324,199 1,639,100 1,639,100
Net Excess (Deficit) of Revenues over Expenditures (1,324,108) (1,638,940) (1,638,940)
OTHER FINANCING SOURCES (USES)Transfers In 1,060,660 - - Transfers Out - - - Issuance of Refunding Bonds 4,670,000 1,068,000 1,068,000 Payment to Refunded Bond Escrow Agent (4,589,738) - - Bond Issuance Premium 110,958 - -
Net Other Financing Sources (Uses): 1,251,880 1,068,000 1,068,000
Net Change in Fund Balances (72,228) (570,940) (570,940)
Fund Balance, Beginning of Year (833,339) (833,339) (833,339)
Fund Balance, End of Year - Budgetary Basis (905,567) (1,404,279)$ (1,404,279)$
Revenue Conversion to GAAP Basis:Property Taxes -
Expenditure Conversion to GAAP Basis:Accrued Interest 1,326
Fund Balance, GAAP Basis (904,241)$
Bond Proceeds FundFor the Year Ended April 30, 2014
- 84 -
Schedule 13
CHAMPAIGN PARK DISTRICT
Actual (Budgetary Basis) Versus Budget

PERMANENT FUND

Actual(Budgetary Budget Budget
Basis) (Final) (Original)REVENUES
Property Taxes -$ -$ -$ Intergovernmental Revenues - - - Charges for Services, Program Rentals, and Related Items - - - Contributions and Sponsorships - - - Merchandise and Concession Sales - - - Grants - - - Interest Income - - - Special Receipts - - - Miscellaneous - - -
Total Revenues - - -
EXPENDITURESCurrent:
Culture and Recreation:Salaries and Wages - - - Fringe Benefits - - - Commodities - - - Contractual Services - - -
Total Current - - - Capital Outlay - - -
Total Expenditures - - -
Net Excess (Deficit) of Revenues over Expenditures - - -
OTHER FINANCING SOURCES (USES)Transfers In - - - Transfers Out - - -
Net Other Financing Sources (Uses): - - -
Net Change in Fund Balances - - -
Fund Balance, Beginning of Year 250,000 250,000 250,000
Fund Balance, End of Year - Budgetary Basis 250,000 250,000$ 250,000$
Revenue Conversion to GAAP Basis:Property Taxes -
Fund Balance, GAAP Basis 250,000$
For the Year Ended April 30, 2014
- 85 -
CHAMPAIGN PARK DISTRICT
Schedule 14
Schedule of Revenues, Expenditures, and Changes in Fund Balance -Actual (Budgetary Basis) Versus Budget
Working Cash Fund

FIDUCIARY FUND

Balance Balance April 30, 2013 Additions Deletions April 30, 2014
ASSETSCash and Cash Equivalents 45,722$ 26,235$ (15,256)$ 56,701$
LIABILITIESAccounts Payable 893$ 20,361$ (15,256)$ 5,998$
Due to Affiliated Agencies 44,829 5,874 - 50,703
Total Liabilities 45,722$ 26,235$ (15,256)$ 56,701$
Schedule 15
CHAMPAIGN PARK DISTRICTStatement of Changes in Assets and Liabilities -
Fiduciary (Agency) Fund
For the Year Ended April 30, 2014Activity and Affiliates Fund
- 86 -
- 87 -
STATISTICAL SECTION INTRODUCTION (Unaudited)
This part of the Champaign Park District’s (the District) comprehensive annual financial report presents detailed information as a context for understanding what the information in the financial statements, note disclosures, and required supplementary information says about the District’s overall financial health.
Financial Trend Schedules - Schedule 16 through Schedule 19
These schedules contain trend information to help the reader understand how the District’s financial performance and well-being have changed over time.
Revenue Capacity Schedules - Schedule 20 through Schedule 23
These schedules contain information to help the reader assess the District’s most significant local revenue source, the property tax.
Debt Capacity Schedules - Schedule 24 through Schedule 28
These schedules present information to help the reader assess the affordability of the District’s current levels of outstanding debt and the District’s ability to issue additional debt in the future.
Demographic and Economic Information Schedules - Schedule 29 and Schedule 30
These schedules offer demographic and economic indicators to help the reader understand the environment within which the District’s financial activities take place.
Operating Information Schedules - Schedule 31 through Schedule 33
These schedules contain service and infrastructure information to help the reader understand how the information in the District’s financial report relates to the services the District provides and the activities it performs.
Sources – Unless otherwise noted on the Schedules, the information in these Schedules is derived from the comprehensive annual financial reports for relevant years.
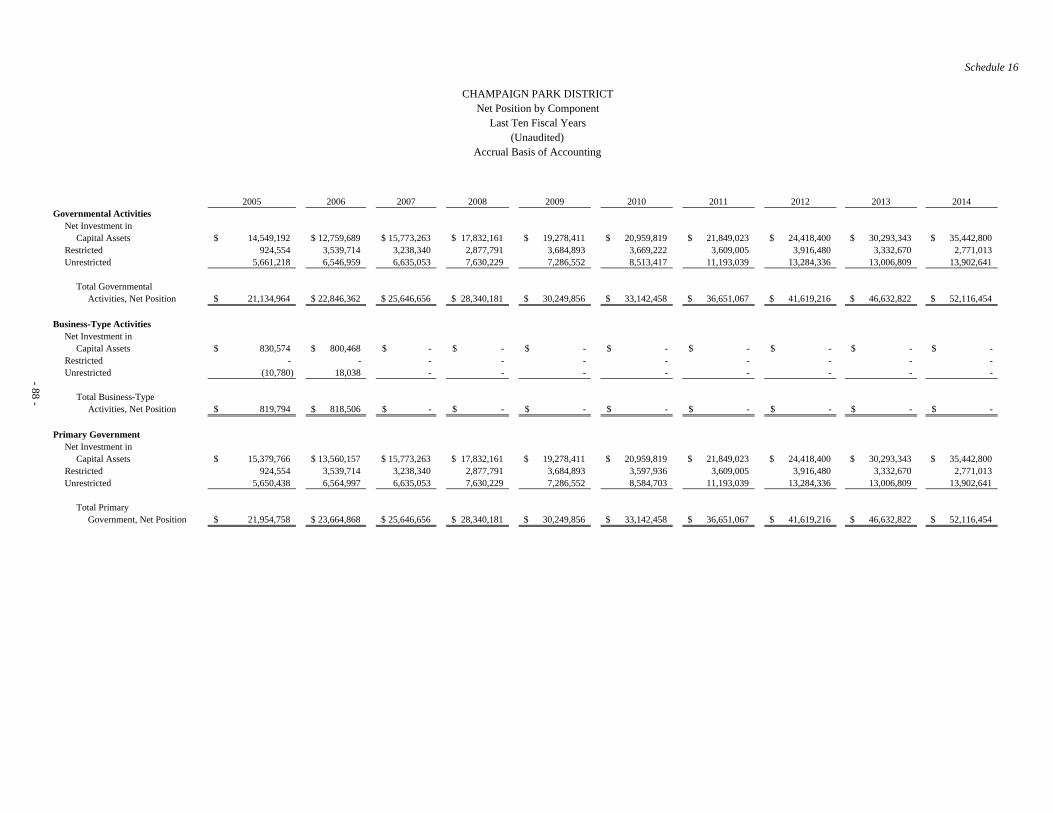
2005 2006 2007 2008 2009 2010 2011 2012 2013 2014Governmental Activities
Net Investment inCapital Assets 14,549,192$ 12,759,689$ 15,773,263$ 17,832,161$ 19,278,411$ 20,959,819$ 21,849,023$ 24,418,400$ 30,293,343$ 35,442,800$
Restricted 924,554 3,539,714 3,238,340 2,877,791 3,684,893 3,669,222 3,609,005 3,916,480 3,332,670 2,771,013 Unrestricted 5,661,218 6,546,959 6,635,053 7,630,229 7,286,552 8,513,417 11,193,039 13,284,336 13,006,809 13,902,641
Total GovernmentalActivities, Net Position 21,134,964$ 22,846,362$ 25,646,656$ 28,340,181$ 30,249,856$ 33,142,458$ 36,651,067$ 41,619,216$ 46,632,822$ 52,116,454$
Business-Type ActivitiesNet Investment in
Capital Assets 830,574$ 800,468$ -$ -$ -$ -$ -$ -$ -$ -$ Restricted - - - - - - - - - - Unrestricted (10,780) 18,038 - - - - - - - -
Total Business-TypeActivities, Net Position 819,794$ 818,506$ -$ -$ -$ -$ -$ -$ -$ -$
Primary GovernmentNet Investment in
Capital Assets 15,379,766$ 13,560,157$ 15,773,263$ 17,832,161$ 19,278,411$ 20,959,819$ 21,849,023$ 24,418,400$ 30,293,343$ 35,442,800$ Restricted 924,554 3,539,714 3,238,340 2,877,791 3,684,893 3,597,936 3,609,005 3,916,480 3,332,670 2,771,013 Unrestricted 5,650,438 6,564,997 6,635,053 7,630,229 7,286,552 8,584,703 11,193,039 13,284,336 13,006,809 13,902,641
Total Primary Government, Net Position 21,954,758$ 23,664,868$ 25,646,656$ 28,340,181$ 30,249,856$ 33,142,458$ 36,651,067$ 41,619,216$ 46,632,822$ 52,116,454$
- 88 -
Schedule 16
Accrual Basis of Accounting(Unaudited)
Last Ten Fiscal YearsNet Position by Component
CHAMPAIGN PARK DISTRICT

2005 2006 2007 2008 2009 2010 2011 2012 2013 2014Expenses
Governmental Activities:Culture and Recreation 7,706,411$ 8,598,313$ 9,784,810$ 10,525,384$ 11,204,804$ 10,948,868$ 10,582,963$ 10,179,618$ 9,907,607$ 11,651,125$ Interest on Long-Term Debt 15,629 234,442 318,594 315,101 303,277 288,319 269,582 246,359 226,474 178,502
Total Governmental Activities Expenses 7,722,040 8,832,755 10,103,404 10,840,485 11,508,081 11,237,187 10,852,545 10,425,977 10,134,081 11,829,627 Business-Type Activities:
Tennis Center 210,933 198,724 - - - - - - - - Total Primary Government Expenses 7,932,973 9,031,479 10,103,404 10,840,485 11,508,081 11,237,187 10,852,545 10,425,977 10,134,081 11,829,627
Program RevenuesGovernmental Activities:
Culture and Recreation:Charges for Services 1,652,724 1,877,641 2,286,648 2,427,436 2,641,675 2,577,061 2,459,268 2,655,793 2,296,963 2,393,696 Operating Grants and Contributions 485,994 376,615 210,116 106,053 166,683 190,932 153,337 157,248 87,233 143,307 Capital Grants and Contributions - 200,000 415,200 1,165,000 671,400 754,286 958,984 699,512 1,383,455 2,695,833
Total Governmental Activities Program Revenues 2,138,718 2,454,256 2,911,964 3,698,489 3,479,758 3,522,279 3,571,589 3,512,553 3,767,651 5,232,836 Business-Type Activities:
Tennis Center:Charges for Services 175,505 196,359 - - - - - - - - Operating Grants and Contributions 2,500 - - - - - - - - -
Total Business-Type Activities Program Revenues 178,005 196,359 - - - - - - - - Total Primary Government Program Revenues 2,316,723 2,650,615 2,911,964 3,698,489 3,479,758 3,522,279 3,571,589 3,512,553 3,767,651 5,232,836
Net (Expense) RevenueGovernmental Activities (5,583,322) (6,378,499) (7,191,440) (7,141,996) (8,028,323) (7,714,908) (7,280,956) (6,913,424) (6,366,430) (6,596,791) Business-Type Activities (32,928) (2,365) - - - - - - - -
Total Primary Government Net (Expense) Revenue (5,616,250) (6,380,864) (7,191,440) (7,141,996) (8,028,323) (7,714,908) (7,280,956) (6,913,424) (6,366,430) (6,596,791)
General Revenues and Other Changes in Net PositionGovernmental Activities:
Property Tax 7,032,406 7,615,512 8,283,567 8,894,143 9,298,052 9,854,581 10,164,667 10,587,248 10,788,055 11,531,594 Replacement Tax 199,041 255,550 284,042 313,096 280,270 222,106 281,141 247,958 262,437 275,043 Interest Income 91,053 358,068 397,453 381,828 141,490 63,847 63,217 28,245 40,693 17,195 Special Receipts - - 135,464 190,301 149,656 379,721 218,381 213,333 224,231 188,633 Other - (139,233) 72,702 56,153 68,530 87,255 62,159 804,789 64,620 67,958 Transfers - - 18,038 - - - - - - - Contribution of Net Capital Assets - - 800,468 - - - - - - -
Total Governmental Activities General Revenues and Other 7,322,500 8,089,897 9,991,734 9,835,521 9,937,998 10,607,510 10,789,565 11,881,573 11,380,036 12,080,423 Business-Type Activities:
Interest Income 311 1,077 - - - - - - - - Transfers - - (818,506) - - - - - - -
Total Business-Type Activities General Revenues and Other 311 1,077 (818,506) - - - - - - - Total Primary Government Changes in Net Position 7,322,811 8,090,974 9,173,228 9,835,521 9,937,998 10,607,510 10,789,565 11,881,573 11,380,036 12,080,423
Change in Net PositionGovernmental Activities 1,739,178 1,711,398 2,800,294 2,693,525 1,909,675 2,892,602 3,508,609 4,968,149 5,013,606 5,483,632 Business-Type Activities (32,617) (1,288) (818,506) - - - - - - -
Total Change in Net Position 1,706,561$ 1,710,110$ 1,981,788$ 2,693,525$ 1,909,675$ 2,892,602$ 3,508,609$ 4,968,149$ 5,013,606$ 5,483,632$
- 89 -
Schedule 17
Accrual Basis of Accounting(Unaudited)
CHAMPAIGN PARK DISTRICTChanges in Net PositionLast Ten Fiscal Years

2005 2006 2007 2008 2009 2010 2011 2012 2013 2014
PRE-GASB 54 CONVERSIONGeneral Fund:
Reserved -$ -$ 2,000$ -$ 8,589$ 749$ 2,250$ -$ -$ -$ Unreserved 2,800,249 3,367,138 3,723,880 4,329,140 3,705,169 5,111,243 6,390,100 - - -
Total General Fund 2,800,249$ 3,367,138$ 3,725,880$ 4,329,140$ 3,713,758$ 5,111,992$ 6,392,350$ -$ -$ -$
All Other Governmental Funds:Reserved, Reported in:
Special Revenue Funds 107,706$ 23,457$ 14,880$ 36,458$ 12,553$ 6,943$ 8,159$ -$ -$ -$ Debt Service Fund 526,453 724,055 - - - - - - - -
Unreserved, Reported in:Special Revenue Funds 2,908,316 3,552,026 4,401,299 4,674,822 5,222,112 5,885,006 6,965,395 - - - Debt Service Fund - - (49,915) (52,774) 497,264 500,354 514,453 - - - Capital Projects Funds 148,101 2,556,284 868,675 1,306,204 1,073,139 679,038 979,426 - - - Permanent Fund 250,000 250,000 250,000 250,000 250,000 250,000 250,000 - - -
Total All Other Governmental Funds 3,940,576$ 7,105,822$ 5,484,939$ 6,214,710$ 7,055,068$ 7,321,341$ 8,717,433$ -$ -$ -$
POST-GASB 54 CONVERSIONGeneral Fund:
Non-Spendable -$ -$ -$ -$ -$ -$ -$ 2,193$ -$ 2,304$ Unassigned - - - - - - - 7,044,891 6,145,304 6,471,136
Total General Fund -$ -$ -$ -$ -$ -$ -$ 7,047,084$ 6,145,304$ 6,473,440$
All Other Governmental Funds:Non-Spendable -$ -$ -$ -$ -$ -$ -$ 261,614$ 255,182$ 268,173$ Restricted - - - - - - - 3,666,480 3,082,670 2,987,015 Committed - - - - - - - 100,000 100,057 200,115 Assigned - - - - - - - 6,884,547 7,073,206 5,586,781 Unassigned - - - - - - - (799,334) (833,339) (1,137,242)
Total All Other Governmental Funds -$ -$ -$ -$ -$ -$ -$ 10,113,307$ 9,677,776$ 7,904,842$
Note: Prior to Fiscal Year 2012, fund balance information in the GASB 54 format is not readily available.
- 90 -
Schedule 18
Modified Accrual Basis of Accounting(Unaudited)
CHAMPAIGN PARK DISTRICTFund Balances of Governmental Funds
Last Ten Fiscal Years

2005 2006 2007 2008 2009 2010 2011 2012 2013 2014Revenues
Property Taxes 7,032,406$ 7,615,512$ 8,283,567$ 8,894,143$ 9,298,052$ 9,854,581$ 10,164,667$ 10,587,248$ 10,788,055$ 11,531,594$ Intergovernmental Revenues 199,041 255,550 284,042 313,096 280,270 222,106 281,141 247,958 262,437 275,043 Charges for Services, Program
Rentals and Related Items 1,447,031 1,665,189 2,058,001 2,162,108 2,396,608 2,344,293 2,258,003 2,414,620 2,116,285 2,219,473 Contributions and Sponsorships 280,999 192,796 192,914 1,212,800 103,895 85,733 106,822 92,946 76,933 130,626 Merchandise and Concession Sales 137,111 161,427 228,647 265,328 245,067 232,768 201,265 241,173 180,678 174,223 Grants 46,306 224,700 431,850 58,253 62,788 1,335,405 79,595 64,302 660,320 1,720,061 Interest Income 91,053 358,068 374,036 381,828 141,489 63,847 63,217 28,245 40,693 17,195 Special Receipts 158,689 159,119 158,473 190,301 149,656 379,721 218,381 213,333 224,231 188,633 Miscellaneous 68,582 51,025 73,662 56,153 68,530 87,255 62,159 98,599 64,620 67,958
Total Revenues 9,461,218 10,683,386 12,085,192 13,534,010 12,746,355 14,605,709 13,435,250 13,988,424 14,414,252 16,324,806
ExpendituresCurrent:
Culture and Recreation 6,912,671 7,365,692 8,009,588 8,868,455 9,263,908 9,187,584 8,981,581 8,665,536 8,312,592 9,158,697 Capital Outlay 1,767,736 6,533,009 3,780,017 2,732,645 2,675,069 3,176,020 1,211,770 2,955,568 6,892,192 8,143,273 Other 31,096 - - - - - - - - - Debt Service:
Principal 985,000 1,000,000 1,165,000 265,000 275,000 285,000 295,000 305,000 315,000 375,000 Interest and Fees 15,629 25,067 410,766 334,879 307,402 292,598 270,449 251,712 231,779 190,575 Bond Issuance Costs - - - - - - - - - 93,279
Total Expenditures 9,712,132 14,923,768 13,365,371 12,200,979 12,521,379 12,941,202 10,758,800 12,177,816 15,751,563 17,960,824
Excess (Deficit) of Revenues Over Expenditures (250,914) (4,240,382) (1,280,179) 1,333,031 224,976 1,664,507 2,676,450 1,810,608 (1,337,311) (1,636,018)
Other Financing Sources (Uses)Transfers In 91,260 125,452 61,947 1,428,521 1,384,115 1,010,698 1,007,468 1,126,100 1,032,880 1,160,660 Transfers Out (91,260) (125,452) (43,909) (1,428,521) (1,384,115) (1,010,698) (1,007,468) (1,126,100) (1,032,880) (1,160,660) Disposal of Capital Assets - - - - - - - 240,000 - - Issuance of Debt 1,000,000 7,972,517 - - - - - - - 4,670,000 Payment to Refunding Bond Escrow Agent - - - - - - - - - (4,589,738) Bond Issuance Premium - - - - - - - - - 110,958
Net Other FinancingSources (Uses) 1,000,000 7,972,517 18,038 - - - - 240,000 - 191,220
Net Change in Fund Balance 749,086$ 3,732,135$ (1,262,141)$ 1,333,031$ 224,976$ 1,664,507$ 2,676,450$ 2,050,608$ (1,337,311)$ (1,444,798)$
Debt Service as a Percentof Non-Capital Expenditures 12.60% 11.65% 15.67% 6.07% 5.56% 5.66% 5.79% 5.97% 6.03% 5.30%
Schedule 19
- 91 -
Modified Accrual Basis of Accounting(Unaudited)
CHAMPAIGN PARK DISTRICTChanges in Fund Balances of Governmental Funds
Last Ten Fiscal Years

Assessed Value Total Assessed ValueLevy Fiscal Real Property Railroads Direct as a PercentYear Years Value Value Total Tax Rate Actual Value of Actual Value
2013 2014/2015 1,502,797,974$ 920,989$ 1,503,718,963$ 0.007645 4,511,156,889$ 33.33%2012 2013/2014 1,528,334,756 928,108 1,529,262,864 0.007088 4,587,788,592 33.33%2011 2012/2013 1,532,639,876 907,361 1,533,547,237 0.006789 4,600,641,711 33.33%2010 2011/2012 1,549,272,226 807,525 1,550,079,751 0.006529 4,650,239,253 33.33%2009 2010/2011 1,545,047,163 747,330 1,545,794,493 0.006300 4,637,383,479 33.33%2008 2009/2010 1,547,286,881 608,574 1,547,895,455 0.006157 4,643,686,365 33.33%2007 2008/2009 1,452,886,965 511,677 1,453,398,642 0.006190 4,360,195,926 33.33%2006 2007/2008 1,324,560,296 474,016 1,325,034,312 0.006414 3,975,102,936 33.33%2005 2006/2007 1,190,706,261 437,157 1,191,143,418 0.006597 3,573,430,254 33.33%2004 2005/2006 1,031,485,898 462,928 1,031,948,826 0.006782 3,095,846,478 33.33%
Source: Champaign County Clerk
Note 1: State law prescribes an assessment ratio of 33% of actual value
Note 2:
- 92 -
Schedule 20
(Unaudited)
CHAMPAIGN PARK DISTRICTAssessed and Estimated Actual Value of Taxable Property
Last Ten Fiscal Years
Fiscal Years - The annual levy covers a calendar year, but the related revenue is recognized 50% in the fiscal year in which the levy is passed and 50% the subsequent fiscal year

Schedule 21
Levy Year 2004 2005 2006 2007 2008 2009 2010 2011 2012 2013Fiscal Years 2005/2006 2006/2007 2007/2008 2008/2009 2009/2010 2010/2011 2011/2012 2012/2013 2013/2014 2014/2015
Champaign Park District:General 0.3416 0.3350 0.3281 0.3154 0.3206 0.3379 0.3374 0.3419 0.3497 0.3499Recreation 0.0749 0.0700 0.0695 0.0696 0.0697 0.0717 0.0549 0.1001 0.1114 0.1205Museum 0.0600 0.0575 0.0525 0.0499 0.05 0.0514 0.0916 0.0648 0.0704 0.0808IL Municipal Retirement 0.0218 0.0215 0.0196 0.0185 0.0185 0.0170 0.0174 0.0186 0.0196 0.0246Social Security 0.0261 0.0255 0.0241 0.0246 0.0234 0.0219 0.0206 0.0210 0.0220 0.0233Audit 0.0010 0.0008 0.0008 0.0013 0.0017 0.0014 0.0014 0.0012 0.0013 0.0014Liability Insurance 0.0226 0.0250 0.0241 0.0234 0.0198 0.0170 0.0168 0.0174 0.0183 0.0210Debt Service 0.0998 0.0854 0.0768 0.0700 0.0657 0.0655 0.0665 0.0677 0.0697 0.0964Paving & Lighting 0.0044 0.0049 0.0048 0.0047 0.0046 0.0048 0.0049 0.0048 0.0049 0.0050Police 0.0003 0.0014 0.0015 0.0016 0.0017 0.0014 0.0014 0.0014 0.0015 0.0016Special Recreation 0.0257 0.0327 0.0396 0.0400 0.0400 0.0400 0.0400 0.0400 0.0400 0.0400
0.6782 0.6597 0.6414 0.6190 0.6157 0.6300 0.6529 0.6789 0.7088 0.7645
City of Champaign 1.3120 1.3120 1.2659 1.2942 1.2942 1.2942 1.2942 1.3084 1.3152 1.3152
Champaign County 0.7981 0.7801 0.7616 0.7389 0.7426 0.7487 0.7688 0.7841 0.8138 0.8511
Forest Preserve District 0.0839 0.0818 0.0800 0.0779 0.0783 0.0790 0.0817 0.0843 0.0880 0.0931
Champaign Township 0.0380 0.0368 0.0357 0.0350 0.0350 0.0357 0.0371 0.0385 0.0404 0.0467
Health District 0.1126 0.1087 0.1060 0.1049 0.1052 0.1071 0.1075 0.1102 0.1163 0.1259
Parkland College 0.4847 0.4776 0.4720 0.4688 0.5115 0.5082 0.5064 0.5120 0.5191 0.5253
Champaign School District 3.9271 3.8288 3.7273 3.6296 3.6554 3.6546 3.7238 3.8805 4.1185 4.3014
Mass Transit District 0.2677 0.2633 0.2592 0.2544 0.2575 0.2619 0.2725 0.2831 0.2966 0.3198
Total 7.7023 7.5488 7.3491 7.2227 7.2954 7.3194 7.4449 7.6800 8.0167 8.3430
Note 1:
Note 2: Tax rates per $100 of assessed value
Note 3: Rate limits exist for certain levy items as follows:General 0.3500 Recreation 0.3700 Museum 0.1500 Audit 0.0050 Paving and Lighting 0.0050 Police 0.0250 Special Recreation 0.0400
Source: Champaign County Clerk
- 93 -
CHAMPAIGN PARK DISTRICT
(Unaudited)Last Ten Fiscal Years
Property Tax Rates - Direct and Overlapping Governments
Fiscal Years - The annual levy covers a calendar year, but Champaign Park District recognizes the related revenue 50% in the fiscal year in which the levy is passed and 50% the subsequent fiscal year

Percent PercentEqualized of Total Equalized of TotalAssessed Assessed Assessed AssessedValuation Rank Valuation Valuation Rank Valuation
Champaign Market Place, LLC (Shopping Center) 23,508,390$ 1 1.56% 20,050,880$ 1 2.06%
Campus Property Management (Housing) 19,135,820 2 1.27% 16,557,130 2 1.70%
Bankier Family 12,991,030 3 0.86% 7,793,330 4 0.80%
Shapland Realty, LLC 10,068,810 4 0.67% 7,851,130 3 0.81%
Regency Consolidated (Developer) 9,404,570 5 0.63%
Nadbol (Commercial Developer) 8,243,390 6 0.55%
Dan Hamelberg (Housing) 7,741,620 7 0.51%
Baytowne Apartments (Housing) 7,247,410 8 0.48% 5,251,400 5 0.54%
Pickus Companies (Developer) 6,925,510 9 0.46%
Christie Management Co (Health Care) 6,528,130 10 0.43% 5,252,130 6 0.54%
Larson Co 5,247,450 7 0.54%
Jeffrey R. Hartman 5,000,030 8 0.51%
Royse & Brinkmeyer Apts 4,517,100 9 0.46%
Rose Irwin R Co. 4,260,600 10 0.44%
Total 111,794,680$ 7.43% 81,781,180$ 8.40%
Source: Champaign County Treasurer
Schedule 22
CHAMPAIGN PARK DISTRICT
- 94 -
Name of Company
(Unaudited)April 30, 2014
Principal Property Taxpayers
2014 2005

Fiscal TotalYears Tax Levy Collected Total Collections to DateEnded for Percent in Subsequent Percent
April 30 Fiscal Years Amount Levy Years Amount Levy
2014/2015 11,495,931$ -$ 0.00% -$ -$ 0.00%2013/2014 10,839,415 - 0.00% 10,765,443 10,765,443 99.32%2012/2013 10,411,252 - 0.00% 10,388,983 10,388,983 99.79%2011/2012 10,120,471 - 0.00% 10,084,307 10,084,307 99.64%2010/2011 9,738,505 - 0.00% 9,671,111 9,671,111 99.31%2009/2010 9,530,392 - 0.00% 9,460,598 9,460,598 99.27%2008/2009 8,996,538 - 0.00% 8,919,393 8,919,393 99.14%2007/2008 8,498,771 - 0.00% 8,452,144 8,452,144 99.45%2006/2007 7,857,973 - 0.00% 7,845,976 7,845,976 99.85%2005/2006 6,998,677 - 0.00% 6,970,280 6,970,280 99.59%
Note 1:
Source: Champaign County Clerk and Champaign County Treasurer
Fiscal Years - The annual levy covers a calendar year, but the related revenue is recognized 50% in the fiscal year in which the levy is passed and 50% the subsequent fiscal year
- 95 -
(Unaudited)
Schedule 23
Champaign Park DistrictProperty Tax Levies and Collections
Last Ten Fiscal Years
Collected Within the First Listed Fiscal Year

Governmental ActivitiesGeneral Alternate Total Debt as a Percent
Fiscal Obligation Revenue Primary of Personal Total Debt
Year Bonds Bonds Government Income Per Capita
2014 -$ 4,970,000$ 4,970,000$ 0.15% 61 2013 - 5,020,000 5,020,000 0.17% 62 2012 - 5,335,000 5,335,000 0.19% 66 2011 - 5,640,000 5,640,000 0.20% 70 2010 - 5,935,000 5,935,000 0.23% 79 2009 - 6,220,000 6,220,000 0.24% 83 2008 - 6,495,000 6,495,000 0.26% 86 2007 975,000 6,760,000 7,735,000 0.33% 103 2006 975,000 6,950,000 7,925,000 0.37% 110 2005 1,000,000 - 1,000,000 0.05% 14
Note: Demographic Information for personal income and population is presented in Schedule 29.This schedule only includes long-term debt. Starting in fiscal year 2008, the general obligation bond issue was considered short-term as it was less than 365 days.
- 96 -
Schedule 24
Last Ten Fiscal YearsRatios of Outstanding Debt by Type
(Unaudited)
CHAMPAIGN PARK DISTRICT

PercentGeneral Less Amount of Estimated
Fiscal Obligation Available in Debt Net General Actual Taxable PerYear Bonds Service Funds Bonded Debt Property Value Capita
2014 -$ -$ -$ 0.00% -$ 2013 - - - 0.00% -2012 - - - 0.00% -2011 - - - 0.00% -2010 - - - 0.00% -2009 - - - 0.00% -2008 - - - 0.00% -2007 975,000 - 975,000 0.02% 13 2006 975,000 524,055 450,945 0.01% 6 2005 1,000,000 526,453 473,547 0.02% 7
Note: Demographic Information for population is presented in Schedule 29.Actual Taxable Property Value is presented in Schedule 20.
This schedule only includes long-term debt. Starting in fiscal year 2008, the general obligation bond issue was considered short-term as it was less than 365 days.
(Unaudited)
- 97 -
Schedule 25
CHAMPAIGN PARK DISTRICTRatio of Net General Bonded Debt Outstanding
Last Ten Fiscal Years

Percentage Amount
Bonded Applicable Applicable
Debt to the to the
Governmental Unit Outstanding Park District Park District (2)
City of Champaign 56,033,619$ 100.00% 56,033,619$
Champaign County 41,748,020 42.88% 17,901,551
Champaign School District Unit #4 7,785,000 78.52% 6,112,782
Champaign-Urbana Public Health District 1,952,271 76.23% 1,488,216
Parkland College 64,115,000 31.10% 19,939,765
Champaign County Forest Preserve 855,600 42.50% 363,630
Subtotal, Overlapping Debt (1) 172,489,510 101,839,563
Champaign Park District Direct Debt 1,068,000 100.00% 1,068,000
Total Direct and Overlapping Debt 173,557,510$ 102,907,563$
Source:
Notes: (1)
(2)
- 98 -
Schedule 26
Direct and Overlapping Governmental Activities DebtCHAMPAIGN PARK DISTRICT
Overlapping governments are those that coincide, at least in part, with the boundaries of the Champaign Park District. This schedule estimates the portion of the outstanding debt of those overlapping governments that is borne by the taxpayers of the Champaign Park District. This estimate produces a schedule that recognizes that, when considering Champaign Park District's ability to issue and repay long-term debt, the entire debt burden borne by the taxpayers should be taken into account. However, this does not imply that every taxpayer is a resident, and therefore responsible for repaying the debt of each overlapping government.
City of Champaign and overlapping government records
Computed by dividing Champaign Park District's assessed value by the assessed value of the overlapping governments and multiplying this rate by the overlapping governments' outstanding debt. An overlapping government unit is any that levies a tax on a citizen of the Champaign Park District. This schedule does not include revenue supported debt.
General Obligations DebtApril 30, 2014
(Unaudited)

Schedule 27
Assessed Valuation (2012 Levy Year) 1,503,718,963$
Legal Debt MarginDebt Limitation - 2.875 Percent of Total Assessed Value 43,231,920$
Total Debt Applicable to the Debt LimitGeneral Obligation Bond Indebtedness 1,068,000 Alternate Revenue Bonds Indebtedness -
Total Debt Applicable to the Debt Limit 1,068,000
Legal Debt Margin 42,163,920$
Total Net Debt Applicable to the Debt Limit as a Percentage of the Debt Limit 2.47%
- 99 -
CHAMPAIGN PARK DISTRICTComputation of Legal Debt Margin
April 30, 2014(Unaudited)

Fiscal Available forYear Revenue Expense Debt Service Principal Interest Total Coverage
201420132012 Note:2011201020092008200720062005
The District does not have bond debt supported strictly by a pledged revenue source. The District has alternate revenue bonds outstanding since fiscal year 2006. These bonds were issued to finance the construction of the District's Aquatic Center. These are general obligations of the District, however, these bonds, and the related interest, are expected to be paid from the funds remaining from the bond issue, the revenue of the District's Aquatic Center, from proceeds of annual, short-term, general obligation bonds, or from property taxes.
- 100 -
(Unaudited)
Schedule 28
CHAMPAIGN PARK DISTRICTSchedule of Revenue Supported Bond Coverage
Last Ten Fiscal Years

PersonalIncome (2) (3) (4) (5)
Fiscal (1) Expressed in Per Capita Median School UnemploymentYear Population Thousands Income Age Enrollment Rate
2014 81,055 3,260,710$ 39,086 26 9,477 8.5%2013 81,055 3,010,220 37,138 25 9,598 7.5%2012 81,055 2,788,129 34,398 25 9,496 6.7%2011 81,055 2,788,129 34,398 25 9,293 8.9%2010 75,254 2,623,279 34,859 24 9,497 9.5%2009 75,254 2,613,045 34,723 24 9,400 8.4%
2008 75,254 2,478,265 32,932 25 9,329 6.5%2007 75,254 2,331,444 30,981 25 9,342 4.8%2006 72,140 2,140,534 29,672 25 9,346 4.2%2005 71,426 2,198,194 30,776 25 9,382 4.7%
Notes: (1)
(2) Provided by the Bureau of Economic Analysis, U.S. Department of Commerce
(3) Age distribution is for the City of Champaign from the 1990 census and 2000 census.
(4) Provided by the Superintendent of Schools, Champaign Unit 4 School District
(5)
- 101 -
Population for 2011 is from a Special Census conducted by the U.S. Bureau of the Census. Population for 2007-2010 is from a Special Census conducted by the U.S. Bureau of the Census. 2002-2006 population is calculated by adding 1% per annum to the 2000 census.
U.S. Department of Labor, Bureau of Labor Statistics. Some amounts from prior years have been updated by the U.S. Department of Labor.
Schedule 29
CHAMPAIGN PARK DISTRICTDemographic and Economic Statistics
Last Ten Fiscal Years(Unaudited)

Percent of Percent ofTotal City Total City
Employees Rank Employment Employees Rank Employment
University of Illinois at Urbana-Champaign (1) 10,820 1 27.4% 10,500 1 28.5%
Carle 5,623 2 14.2%
Champaign Unit 4 Schools 1,814 3 4.6%
Kraft Foods, Inc. 1,350 4 3.4% 1,300 2 3.5%
Parkland College 950 5 2.4%
Champaign County Government 910 6 2.3%
Urbana School District #116 832 7 2.1%
PlastiPak Packaging 810 8 2.1% 600 7 1.6%
Presence Covenant Medical Center 774 9 2.0%
Christie Clinic Association 750 10 1.9%
Collins & Aikman-Rantoul Products 1,100 3 3.0%
Jeld-Wen 800 4 2.2%
Hobbico 700 5 1.9%
Super Valu 625 6 1.7%
Herff Jones Cap & Gown 550 8 1.5%
Colwell 450 9 1.2%
Bell Sports 450 9 1.2%
Total 24,633 62.4% 17,075 46.3%
Source: Economic Development Corporation and Bureau of Labor Statistics
Note: (1) The University of Illinois, administration, and campus are located in both Champaign and Urbana.
Schedule 30
- 102 -
Principal EmployersCHAMPAIGN PARK DISTRICT
Current Fiscal Year and Nine Fiscal Years Earlier(Unaudited)
Name of Company
2014 2005

Schedule 31
2005 2006 2007 2008 2009 2010 2011 2012 2013 2014
Function
Culture and Recreation:Administration 13 14 14 13 13 13 13 13 13 12
Marketing 3 3 3 3 3 3 3 2 2 2
Recreation/Arts 53 55 60 65 65 63 60 59 58 98
Operations 28 29 29 29 30 30 30 30 29 31
TOTAL 97 101 106 110 111 109 106 104 102 143
Beginning in 2014, there was a change in management and calculation of FTES. The Total hours by classification codes are divided by 2.080 hours.
Source: District Finance and Administration Department as of April 30, 2014
Last Ten Fiscal Years(Unaudited)
- 103 -
CHAMPAIGN PARK DISTRICTNumber of District Employees by Function (Full-Time Equivalents)

Schedule 32
2005 2006 2007 2008 2009 2010 2011 2012 2013 2014
Function
Culture and Recreation:Facility Usage
Douglass Park 31,523 24,532 36,665 53,879 68,445 43,676 33,992 23,110 23,402 25,085
Hays Center 15,489 15,938 16,823 14,391 13,780 14,096 11,919 10,351 6,134 5,711
Kaufmann Boathouse 1,403 2,111 3,747 983 1,609 2,149 1,813 945 820 784
Leonhard Rec Center 39,666 39,395 47,940 42,019 35,336 35,445 34,058 25,330 20,925 20,605
Prairie Farm 21,316 16,786 19,350 12,945 16,975 15,699 9,902 10,198 2,835 10,025
Skate Park 3,870 4,535 5,781 3,471 6,419 6,880 6,127 5,830 4,347 unknown
Springer Cultural Center 37,896 38,025 37,496 38,209 34,032 38,032 41,669 37,979 37,504 33,323
Tennis Center 14,705 27,480 44,922 51,447 57,822 55,418 55,837 27,449 28,314 25,548
Virginia Theatre 70,973 60,720 66,250 62,227 62,073 60,329 31,599 79,614 5,570 39,628
Pool UsageSholem Pool 51,240 57,241 68,416 104,577 92,142 86,113 101,539 81,382 95,284 60,496
Spalding Pool 14,418 13,549 21,474 10,058 17,208 13,103 14,100 7,216 closed closed
Source: Various District Departments
(Unaudited)
- 104 -
CHAMPAIGN PARK DISTRICTOperating Indicators by Function
Last Ten Fiscal Years

Schedule 33
2005 2006 2007 2008 2009 2010 2011 2012 2013 2014
Function
Culture and Recreation:Playgrounds 27 27 27 26 26 27 29 29 29 32
Parks 60 60 60 61 62 61 61 61 61 62
Outdoor Tennis Courts 25 25 25 25 25 25 24 24 24 18
Indoor Tennis Courts 6 6 6 6 6 6 6 6 6 6
Lighted Ball Diamonds 11 11 11 11 11 11 11 11 11 11
Soccer Fields 11 11 20 20 20 21 22 22 22 22
Basketball Courts 19 19 19 18 18 17 18 18 18 18
Ball Diamonds 13 13 13 13 13 17 17 17 17 19
Jogging and Bike Trails 10 10 10 11 11 12 13 13 13 14
Recreation Centers 2 2 2 2 6 6 6 6 6 7
Swimming Facilities 2 2 2 2 2 2 2 1 1 1
*Boat Launches 1 1 1 - - - - - - -
Skate Parks 1 1 1 1 1 1 1 1 2 2
*Our boat launch is not a formal boat launch
Source: Various District Departments
(Unaudited)
- 105 -
CHAMPAIGN PARK DISTRICTCapital Asset Statistics by Function
Last Ten Fiscal Years