change detection in 3d environments based on gaussian ... filechange detection in 3d environments...
TRANSCRIPT

Change detection in 3D environments based on Gaussian Mixture Modeland Robust Structural Matching for Autonomous robotic applications
P. Núñez, P. Drews Jr, A. Bandera, R. Rocha, M. Campos and J. Dias
Abstract— The ability to detect perceptions which were neverexperienced before, i.e. novelty detection, is an importantcomponent of autonomous robots working in real environments.It is achieved by comparing current data provided by itssensors with a previously known map of the environment.This often constitutes an extremely challenging task due tothe large amounts of data that must be compared in real-time. With respect to previously proposed approaches, thispaper detects changes in 3D environment based on probabilisticmodels, the Gaussian Mixture Model, and a fast and robustcombined constraint matching algorithm. The matching allowsto represent the scene view as a graph which emerges from thecomparison between Mixtures of Gaussians. Finding the largestset of mutually consistent matches is equivalent to find themaximum clique on a graph. The proposed approach has beentested for mobile robotics purposes in real environments andcompared to other matching algorithms. Experimental resultsdemonstrate the performance of the proposal.
I. I NTRODUCTION
In order to autonomously explore and navigate on anunknown and dynamic environment, mobile robots typicallyrequire to determine their pose (position and orientation)and to simultaneously build a map of this environmentbased on perceptual data. In this situation, the ability todetect and respond suitably to scene changes arises as anuseful component. For instance, in robotic surveillance andsecurity systems [1], environment changes may be riskysituations requiring the activation of some kind of alarmswith which the robot should be aware of. In a similar way,robots exploring dangerous environments (e.g. abandonedmines [2]), should solve and warn about risk situationswhen a change is detected along its motion with respectto the known map. Then, the novelty detection arises asa mechanism which allows the robot to adapt itself tonew situations and to continue its operation, updating theknowledge of the environment and focusing the attention ona specific region of interest [3].
The basic idea behind most current novelty detectionapproaches in mobile robotics is that the robot carries sensorsto perceive the environment and to match the obtained datawith the expected data available in the map. The success of
This work has been partially supported by the PROMETHEUS, EU-FP7-ICT-2007-1-214901 project, by MICINN Project n. TIN2008-06196 andTSI-020301-2009-2, CAPES, CNPQ and FEDER funds.
P. Núñez is member of the ISIS Group, Universidad de Málaga, andRobolab Group, Dept. Tecnología de los Computadores y las Comunica-ciones, Universidad de Extremadura, Spain.
Paulo Drews Jr. and M. Campos are with Dept. Computer Science,Federal University of Minas Gerais, Brazil. ([email protected])
A. Bandera is with ISIS Group, Universidad de Málaga, SpainRest of authors are with the Institute of Systems and Robotics, Dept.
Electrical and Computer Engineering, University of Coimbra, Portugal.
this matching process is conditioned on (1) the existenceof accurate sensors capable of obtaining raw informationfrom the environment, (2) the availability of fast and reliablealgorithms capable of extracting a high-level representationfrom the large sets of noisy and uncertain data, and (3) theexistence of an accurate method that is be able to detect thechange according to the employed representations.
With respect to the first question, 3D laser range sensorsor vision-based systems can be used. Applying vision tofeature extraction leads to increase CPU usage due to thecomplexity of the algorithms required. Conversely, a 3Dlaser range scanner is capable of collecting such high qualityrange data but it suffers from very small number of specularreflections. The angular uncertainty of the laser sensor isvery small and, therefore, it can provide to the robot avery fine description of the surroundings. For the secondissue, pattern recognition and image analysis backgroundhave inspired different methods for clustering of 3D points.Thus, simple methods have been broadly used to supportmobile robot operation extracting planar structures or morecompact models [4], [5], [3]. Other possibility is to addressthe 3D clustering problem within the framework of statisticalapproaches,e.g. using Mixture Models [6] or PrincipalComponent Analysis [7]. Specifically, Mixtures of Gaussiandistributions provide good models of point clusters, as itwas demonstrated in previous works by the authors (see [8]and [9]). Finally, with respect to the third question, severalmetrics have been proposed to detect changes using the dataacquired by the sensors. Typically, the aim is to compare theclouds of 3D points associated to each dataset and detectthose pairs of points whose distance is higher than a fixedthreshold. In order to reduce the computational cost of thisprocess, more complex metrics, which include statisticalinformation associated to the underlying point distributions,have been used. In Tomasiet al. ’s work [10], the EarthMover’s Distance was proposed as a new metric for solvingthis kind of situation. This metric was employed in a previouswork by the authors where a greedy algorithm is used fordetecting changes in the robot environment [9]. The maindisadvantage of this approach is its strong dependence on thenumber of Gaussians associated to the map, which impliesan increasing error in the number of detected changes.
The proposed approach consists of a novel algorithm fordetecting changes in the environment of the robot using the3D data acquired by laser range sensors. Fig. 1 shows anoverview of the method. Firstly, the environment informationis simplified through a multi-scale sampling technique inorder to reduce the computation burden of detecting changes.

Fig. 1. Problem statement: given the 3D information acquired by the lasersensor at time instantt and a known map on the environment, the robotdetects changes in the scene using a structural matching algorithm.
Next, the data to be compared is compacted according to thewell-known Gaussian Mixture Model (GMM). The GMMassumes that the probability density function (pdf) of thecloud of points can be modelled by a mixture of Gaussiandistributions [8]. Finally, the system performs a structuralmatching stage in the GMM feature space in order to findthe novelty in the scene.
The latter part of the process is the main novelty intro-duced in the method by this paper. Most of the matchingalgorithms in the literature are limited by the independenceassumption, where each possible association is consideredasa separate problem, with no influence on the association ofother possible associations located in the same vicinity. Theproposed work uses a robust and fast algorithm which doesnot only take into account the Gaussians distributions sim-ilarity to define the global matching (absolute constraints),but also relative constraints related to local structural infor-mation. These two constraints, both absolute and relative,are used to compute a consistency matrix for all pairwisematching combinations. This matrix is used to find thelargest set of mutually consistent matchings. This processis equivalent to find the maximum clique on a graph definedby this adjacency matrix.
The rest of the paper is organized as follows. Sec. II brieflyreviews the maximum clique problem and the branch-and-bound algorithm which will be employed to solve it in thisproposal. Sec. III describes the proposed novelty detectionapproach. Experimental results are shown in Sec. IV. ThisSection also includes a comparison of the proposal withother related approaches. Finally, Sec. V draws the mainconclusions and future work.
II. M AXIMUM CLIQUE PROBLEM
Let G = (N,E) be an undirected graph with node setN = {n1, ...nn}. Two nodesni and nj are said to beadjacent if they are connected by an edgeeij ∈ E. A cliqueof a graph is a set of nodes where all of them are adjacent,and a maximum clique is the largest among all cliques in a
TABLE I
FAST MAXIMUM CLIQUE ALGORITHM [11]
function clique(U , size)1: if |U | = 0 then2: if size > max then3: max := size4: New record; save it.5: found := true6: end if7: return8: end if9: while U 6= ∅ do10: if size+ |U | ≤ max then11: return12: end if13: i := min{j|nj ∈ U}14: if size+ c[i] ≤ max then15: return16: end if17: U := U\{ni}18: clique(U ∪N(ni); size + 1)19: if found = true then20: return21: end if22: end while23: returnfunction new24: max := 025: for i := n downto 1 do26: found := false27: clique(Si ∩N(ni), 1)28: c[i] := max29: end for30: return
graph. The problem of finding the maximum clique problemis computationally equivalent to some other important graphproblems,e.g. the maximum independent (or stable) setproblem and the minimum node cover problem. Since theseare NP-hard problems, no polynomial time algorithms areexpected to be found.
In this paper, the branch-and-bound fast algorithm pro-posed in [11] for the maximum clique problem is employed.Let {n}ni=1 be the set of nodes of the graphG and Si
be the subset{ni, ni+1, ...nn}. Firstly, the maximum cliquealgorithm looks for cliques inSn that containnn (the largestclique is{nn}), then cliques inSn−1 that containnn−1, andso on. The algorithm is presented in Table I. The set of nodesadjacent to a nodeni is denoted byN(ni) and the numberof nodes in the graph isn. The global variablemax givesthe size of a maximum clique when the algorithm terminates.The functionc(i) gives the largest clique inSi. Obviously,for any 1 ≤ i ≤ n − 1, we have thatc(i) = c(i + 1) orc(i) = c(i+ 1) + 1. Moreover, we havec(i) = c(i+ 1) + 1iff there is a clique inSi of size c(i + 1) + 1 that includesthe nodeni. Therefore, starting fromc(n) = 1, we searchfor such cliques. If a clique is found,c(i) = c(i + 1) + 1,otherwisec(i) = c(i + 1). The size of a maximum cliqueis given by c(1). Old values of the functionc(i) enablesthe new pruning strategy (in line 14). That is, if we searchfor a clique of size greater thans, then we can prune thesearch if we considerni to become the(j + 1)-th node andj + c(i) ≤ s.

Fig. 2. The main goal of the proposed algorithm is to detect any noveltyin the working environment of the robot (e.g. the cylinder in b).
III. N OVELTY DETECTION IN 3D ENVIRONMENTS
The main goal of novelty detection isto determine anypreviously unknown feature[3]. This section describes theproposed algorithm for detecting changes in the robot sur-rounding (e.g. novelty marked in Fig. 2). The proposedmethod is based on our previous works [8] and [9]. In thecurrent approach, the 3D laser range data is preprocessed inorder to reduce the number of points. Then, the compriseddata is transformed from the Euclidean space to the GMMspace. Finally, the novelty is detected using a structuralmatching algorithm. The main advantages of this approachare (i) its feasibility, due to the data simplification andposterior compression using GMM, and (ii) robust matching,due to the outliers removal and the use of the combinedconstraint matching method. A more detailed description ofthe algorithm is provided by the next subsections.
A. Pre-processing stage
The main aim of the pre-processing stage is to reduce thehigh density of points acquired by a typical 3D laser scanner.Specifically, the approach used in this work is based on themethod proposed by Paulyet al. [12]. This method has oneimportant contribution: it reduces the computation time whileminimizing the losing of geometric information. Basically,it computes a multi-scale points cloud using binary spacepartition. The use of covariance analysis allows to computethe surface variation (σ) based on eigenvalues. Thereby, thepoints clusterP is split if its size,|P |, is larger than a givenvalue and the surface variation is above a maximum thresholdσmax. The value ofσmax is set to0.1, where the range ofσ is [0; 1
3]. This threshold has been empirically selected to a
typical laser data density value.This hierarchical cluster simplification builds a binary tree
based on the split of each region. The split plane is definedby the centroid ofP and the eigenvector associated to thegreater eigenvalue (λ2). Thus, the points cloud is alwayssplit along the direction of greatest variation. The multi-scale
Fig. 3. a) 3-dimensional laser range data and comprised one (yellow andblack, respectively); b) GMM associated to the original laser data; and c)GMM associated to the comprised laser data.
representation is based on the restriction level imposed tothetree. The tree grows until the cluster is just one point. Thescale is chosen by setting values to the size ofP , |P |, andto theσmax value.
On the other hand, considering a points cloud obtained bya laser scanner, the ground plane is almost always presentin the data. In this work, a simple method using RANSACis used to fit a ground plane [13]. Finally, sparse outliers inthe 3D scan laser data are removed based on the techniquedescribed in [14].
B. Gaussian Mixture Model (GMM)
A Gaussian mixture model(GMM) is a probability modelfor density estimation using a convex linear combination ofGaussians density functions. The GMM has the form:
f(x,Θ) =
K∑
k=1
pk g(x;µk,Σk)(
x ∈ RN)
(1)
In this model, each Gaussian is defined by a coefficientpk ≥ 0, which satisfies
∑K
k=1pk = 1, and by its mean and
covariance matrix (µk and Σk). The GMM provides goodmodels of clusters of points: each cluster corresponds to aGaussian density with mean somewhere within the centroidof the cluster, and with a covariance matrix somehow mea-suring the spread of that cluster.
Given a set of points, it is possible to find the GMMΘ using the Expectation-maximization (EM) algorithm [8].The size of K is selected usingKmax and the MDLpenalty function [15]. Fig. 3 illustrates the results of thepreprocessing and GMM stages. In Fig. 3a, the 3D laser dataand the comprised data provided by the pre-processing stageare drawn in yellow and black, respectively. The number ofpoints has been reduced about 70%. Figs. 3b and 3c showthe GMM associated to the original laser range data and tothe comprised data, respectively. See [8] for further details.
C. Combined Constraint matching algorithm
In this section, the matching problem is formulated asa graph-theoretic data association problem. Thus, the fun-damental data structure of this step is the correspondencegraph [16], which represents valid associations betweenthe two mixture of Gaussians (see Fig. 4). Cliques withinthe graph indicate mutual associations compatibility and,byperforming a maximum clique search, the joint compatibleassociation set emanated from the better matchings of Mix-tures of Gaussians may be found. The construction of the

correspondence graph is performed through the applicationof both relative and absolute constraints. Thus, nodes ofthe graph indicate individual association compatibility andthey are determined by absolute constraints. On the otherhand, the arcs of the correspondence graph indicate jointcompatibility of the connected nodes. They are determinedby relative constraints.
Let Θ = {((θ1, p1), . . . , (θn, pn))} and Γ ={((γ1, q1), . . . , (γm, qm))} be the GMMs associated withtwo 3D scans, whereθi(µi,Σi) andγj(µj ,Σj) are Gaussiansfunctions,pi andqj are the weights associated to each Gaus-sian, and(µk,Σk) is a vector containing all the coordinatesof the meansµk and all the entries of the covariance matrixΣk. The method used to calculate the correspondence graphhas two major steps:
1) Definition of the nodes of the correspondence graph.In the proposed method, graph nodes are associated totentative matchings of Gaussian distributions from twoGMMs,Θ andΓ, after applying an absolute constraint.Let |Θ| = n and |Γ| = m be the number of Gaussiansfunctions, respectively. Firstly, the algorithm generatesthe matrixTt (n × m) for all pairwise combinations,by calculating the distance between the two Gaussianfunctions:
dθi,γj= max(dµij
, dΣij) (2)
wheredµijis the Euclidean distance between the two
Gaussian functions using the coordinates of the meanvector, anddΣij
the distance between the covariancematrices associated to the Gaussian functions [17].This is defined as:
dΣij=
√
√
√
√
N∑
k=1
ln2λk(Σi,Σj) (3)
whereλ represents the generalized eigenvalues ofΣi
andΣj , andN is the dimensionality of the matrices.The matrix item associated to the matching of twosimilar Gaussian functions presents a low value. Onthe other hand, high values atTt correspond to dissim-ilar features. Pairwise matched features whose matrixvalues are lower that a fixed thresholdU t
T constitutethe set of tentative matchings. Thus, graph nodes aredefined as the set of all possible combinations of thesepairwise descriptors (e.g. node (1a, 1b) in Fig. 4 isvalid if θ1a is a possible correspondence ofγ1b ).
2) Definition of the arcs of the correspondence graph.For all pairwise combinations of matchings inTt, arelative constraint matrix is calculated,Rt. To do that,a relative constraint on the space of the GMM is used.A pair of matched Gaussian functions (θi, γi) and (θj ,γj) is consistent iff they satisfy the relative constraint:
max(ωdµ, ωdΣ
) ≤ U tR, (4)
being
ωdµ=
√
|(dΘµij)2− (dΓµij
)2|
ωdΣ=
√
|(dΘΣij
)2− (dΓ
Σij)2|
(5)
Fig. 4. Nodes represent tentative matchings when considered individually.Arcs indicate compatible associations, and a clique is a setof mutuallyconsistent associations (e.g. the clique marked in red implies that thematching shown between a) and b) may coexist).
whereU tR is a threshold defined by the user. Thus, the
corresponding entry in the relative constraint matrixRt contains a 1 value if the constraint is satisfied (arcin the graph), and 0 otherwise. For instance, in Fig. 4,the relative constraint between (1a, 1b) and (2a, 2b)matches, and then node (1a, 1b) is connected to node(2a, 2b). The relative constraint between (2a, 5b) onlymatches with (2a, 2b).
3) Maximum clique detection and change description.The set of mutually consistent matches which providesa largest clique is calculated. This is equivalent offinding the maximum clique on a graph with adjacencymatrix Rt. The problem was briefly explained inSec. II. After applying the maximum clique algorithmdescribed in that Section, this step obtains a set ofmutually compatible associations,i.e. a set of matchedGaussian functions (red lines in Fig. 4). In this way, thealgorithm takes into account structural relationships todetect correct associations, which result in 3D pointsin the environment that are not associated to changesin the robot surrounding. Thus, the set of Gaussianfunctions inΘ which are not included in the cliquerepresents the novelty detected by the algorithm. InFig. 4, the only node which is not include in the clique,i.e. (2a, 5b), is the novelty in the robot environment.
IV. EXPERIMENTAL RESULTS
In this section, the proposed change detection methodhas been analyzed in terms of robustness and computationalload. The main novelty of this work, the combined con-straint matching algorithm, which includes the search forthe maximum clique on the graphs, is compared with othertwo matching approaches: (i) a simple matching algorithmbased on the position of the Gaussian functions in the GMM
space; and (ii) the greedy algorithm proposed by the authorsin [9], which is based on Earth MoverŠs Distance (EMD).All the methods have been implemented in C++, and theyare tested in a 1.66GHz Pentium PC computer with 1Gb ofRAM.
A. Change detection in real environment
Novelty detection algorithm has been tested in differentreal environments inside the research area sited in the MinasGerais Federal University, as is shown in Fig. 5. For theexperiments drawn in Fig. 5, three differentnoveltieswereincluded in order to evaluate the results of the algorithm (acylinder, a person and a box in Fig. 5a, respectively). Fig.5b illustrates the 3D laser range data acquired by the robotafter the simplification method. The GMM associated to the3D map is shown in Fig. 5c, and the real novelty is markedin the figure. Results of the proposed algorithm are drawn inFig. 5d. As it is shown in the figure, the novelty detectionalgorithm is able to extract the Gaussian functions associatedto the changes in the environment.
B. Evaluation of the robustness and time processing
Robustness and computational load of the proposed match-ing algorithm have been evaluated and compared againsttwo different matching methods: the greedy EMD-basedalgorithm [9], and a simple matching algorithm which isonly based on an absolute constraint,i.e. the Euclidean dis-tance between the mean vector associated to each Gaussianfunction. With the aim of validating the approach, the sameset of 3D laser range data collected by the sensors has beenused. For each 3D dataset, the Gaussian Mixture Model (Γ)is calculated using different numbers of Gaussian functions,(m = {10, 20, 30, 40}). The Gaussian functions associatedto the novelty are manually selected (the total number isconsidered asTotal positives). Next, each novelty detectionalgorithm is run and the number of Gaussian functions asso-ciated to correct and incorrect detected changes are manuallycounted, and they are considered asNumberT rueNovelty
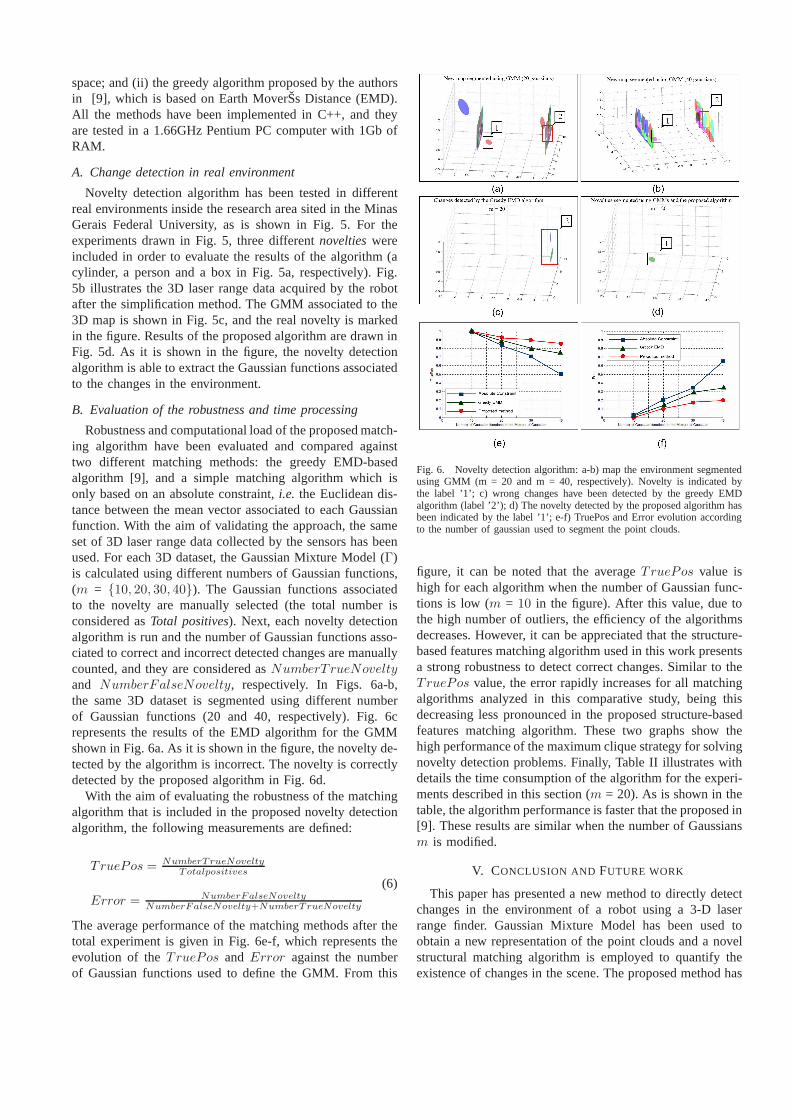
and NumberFalseNovelty, respectively. In Figs. 6a-b,the same 3D dataset is segmented using different numberof Gaussian functions (20 and 40, respectively). Fig. 6crepresents the results of the EMD algorithm for the GMMshown in Fig. 6a. As it is shown in the figure, the novelty de-tected by the algorithm is incorrect. The novelty is correctlydetected by the proposed algorithm in Fig. 6d.
With the aim of evaluating the robustness of the matchingalgorithm that is included in the proposed novelty detectionalgorithm, the following measurements are defined:
TruePos = NumberTrueNoveltyTotalpositives
Error = NumberFalseNoveltyNumberFalseNovelty+NumberTrueNovelty
(6)
The average performance of the matching methods after thetotal experiment is given in Fig. 6e-f, which represents theevolution of theTruePos and Error against the numberof Gaussian functions used to define the GMM. From this
Fig. 6. Novelty detection algorithm: a-b) map the environment segmentedusing GMM (m = 20 and m = 40, respectively). Novelty is indicated bythe label ’1’; c) wrong changes have been detected by the greedy EMDalgorithm (label ’2’); d) The novelty detected by the proposed algorithm hasbeen indicated by the label ’1’; e-f) TruePos and Error evolution accordingto the number of gaussian used to segment the point clouds.
figure, it can be noted that the averageTruePos value ishigh for each algorithm when the number of Gaussian func-tions is low (m = 10 in the figure). After this value, due tothe high number of outliers, the efficiency of the algorithmsdecreases. However, it can be appreciated that the structure-based features matching algorithm used in this work presentsa strong robustness to detect correct changes. Similar to theTruePos value, the error rapidly increases for all matchingalgorithms analyzed in this comparative study, being thisdecreasing less pronounced in the proposed structure-basedfeatures matching algorithm. These two graphs show thehigh performance of the maximum clique strategy for solvingnovelty detection problems. Finally, Table II illustrateswithdetails the time consumption of the algorithm for the experi-ments described in this section (m = 20). As is shown in thetable, the algorithm performance is faster that the proposed in[9]. These results are similar when the number of Gaussiansm is modified.
V. CONCLUSION AND FUTURE WORK
This paper has presented a new method to directly detectchanges in the environment of a robot using a 3-D laserrange finder. Gaussian Mixture Model has been used toobtain a new representation of the point clouds and a novelstructural matching algorithm is employed to quantify theexistence of changes in the scene. The proposed method has

Fig. 5. Three different experiments where the novelty detection algorithm is evaluated. See text for further details.
TABLE II
COMPARATIVE STUDY OF DIFFERENT NOVELTY DETECTION ALGORITHMS.
Number of Points Time Elapsed (s)Reference MapCurrent MapSimpl. Ref. MapSimpl. Cur. MapGMM Ref. Map GMM Cur. Map Greedy EMD Absolute Proposed
Real Data - Test Area 1Simplified 21631 21744 0.43 0.43 176.84 164.13 0.020 0.012 0.014Complete 79171 79633 - - 627.02 534.51 0.060 0.041 0.046
Real Data - Test Area 2Simplified 21631 21744 0.43 0.46 176.91 110.4 0.020 0.011 0.014Complete 79171 81134 - - 624.13 1342.71 0.03 0.023 0.027
Real Data - Test Area 3Simplified 21631 21865 0.41 0.46 167.47 108.76 0.040 0.020 0.028Complete 79171 80112 - - 625.23 865.12 0.051 0.036 0.041
been compared with two different matching methods in themathematical space of Mixture of Gaussians. Experimentalresults in various real scenarios demonstrate the feasibilityof the approach.
Future work will be focused on the integration of thecurrent novelty detection algorithm into real robotic applica-tions, like surveillance or exploration of dangerous environ-ment, where detecting and segmenting novelties is important.
REFERENCES
[1] H. Andreasson, M. Magnusson, and A. Lilienthal. "Has somethingchanged here? Autonomous Difference Detection for Security PatrolRobots". InProc. of IEEE/RSJ IROS, pp. 3429-3435, 2007.
[2] A. Nuchter, H. Surmann, K. Lingemann, J. Hertzberg, and S. Thrun."6D SLAM with an Application in Autonomous Mine Mapping". InProc. of IEEE International Conference on Robotics and Automation,pp. 1998-2003, 2004.
[3] H. Vieria and U. Nehmzow. "Visual novelty detection withautomaticscale selection",Robotic and Autonomous Systems, V. 55, No. 8, pp.693-701, 2007.
[4] N. Lomiere. "A generic methodology for partitioning unorganised 3Dpoint clouds for robotic vision". InProc. of the 1st Canadian Conferenceon Computer and Robot Vision, pp. 64-71, 2004.
[5] S. Ioannis and L. Marius. "Automated feature-based range registrationof urban scenes of large scale". InProc. of IEEE Computer SocietyConference on Computer Vision and Pattern Recognition, pp. 555–561,2003.
[6] G. McLachlan and D. Peel. "Finite Mixture Models". Wiley, New-York,2000.
[7] I. Jolliffe. Principal Component Analysis. Springer series. 2002.[8] P. Núñez, P. Drews Jr, R. Rocha, M. Campos and J. Dias. "Novelty
Detection and 3D Shape Retrieval based on Gaussian Mixture Models forAutonomous Surveillance Robotics". InProc. of IEEE/RSJ InternationalConference on Robots and Systems, pp. 4724-4730, 2009.
[9] P. Drews-Jr, P. Núñez, R. Rocha, M. Campos and J. Dias. "NoveltyDetection and 3D Shape Retrieval using Superquadrics and Multi ScaleSampling for Autonomous Mobile Robots". Accepted inProc. of IEEEInternational Conference on Robotics and Automation, 2010.
[10] C. Tomasi, Y. Rubner and L. Guives. "A metric for distributions withapplications to image databases", inProc. of ICCV, pp. 59-66, 1998.
[11] P. Ostergard, "A fast algorithm for the maximum clique problem", inDiscrete Applied Mathematics, 120, pp. 197U-207, 2002.
[12] M. Pauly, M. Gross and L. Kobbelt, "Efficient simplification of point-sampled surfaces", inProc. of IEEE Visualization, pp 163-170, 2002.
[13] K. Lai and D. Fox, "3D Laser Scan Classification Using WebDataand Domain Adaptation",Robotics: Science and Systems (RSS), 2009.
[14] R. B. Rusu, Z. C. Marton, N. Blodow, M. Dolha and M. Beetz,"To-wards 3D Point cloud based object maps for household environments",Robotics and Autonomous Systems, V. 56, No. 11, pp. 927-941, 2008.
[15] G. Rissanen, "Modeling the shortest data description", Automatica, V.14, pp. 465-471, 1978.
[16] H. G. Barrow, R. M. Burstall, Subgraphs isomorphism, matchingrelational structures and maximal cliques, Information Processing Letters4 (1976) 83-84.
[17] W. Forstner and B. Moonen, "A metric for covariance matrices", inTechnical Report, Dpt. of Geodesy and Geoinformatics, University ofStuttgart, Germany, 1999.