change detection in landuse / … detection in landuse / landcover mapping in asaba, niger delta b/w...
TRANSCRIPT
British Journal of Environmental Sciences
Vol.3, No.3, pp.42-61, August 2015
Published by European Centre for Research Training and Development UK (www.eajournals.org)
42 ISSN 2055-0219(Print), ISSN 2055-0227(online)
CHANGE DETECTION IN LANDUSE / LANDCOVER MAPPING IN ASABA, NIGER
DELTA B/W 1996 AND 2015. A REMOTE SENSING AND GIS APPROACH
Ejemeyovwi, Danny Ochuko (Ph.D, Snr. Lecturer),
Faculty of the Social Sciences, Department of Geog. & Reg. Planning,
Delta State University, P.M.B. 1, Abraka, Delta State, Nigeria
ABSTRACT: Remote sensing is used in this research work for the development and acquisition
of Landuse/land cover data, pattern and its attendant effects in Asaba, Delta State Nigeria. Remote
sensing images and digital data verified by ground trothing (field work) satellite data are used to
assess the rate of change in Landuse / Land cover between 1996 and 2015. It also examines the
extent to which images and GIS softwares effectively contribute to mapping landuse/cover in the
Niger Delta region. Remote sensing and geographic Information System (GIS) help integrate
natural, cultural, social and economic information to create spatial information system on the
available terrain resources. Sets of NARSDA images were acquired corresponding with the
years, field checked to ascertain the data captured on the terrain.. The digital satellite data are
incorporated as input data into IDRISI 32 GIS environmental to separately map out the
landuse/land cover units and their magnitude determine. Five distinct units were identified in
classification of landuse/landed cover pattern categories as follows: Farmland, Build up land,
Waste land, Forest land and Water bodies. Land consumption rate indicate a progressive spatial
expansion of the city was high in 1996/2006 and higher between 2006 and 2015. Also, land
absorption coefficient being a measure of consumption of new urban land by increased urban
population, was high between 1996 and 2006 and between 2006 and 2015. Ground trothing was
carried out to ascertain the accuracy of data and there are major changes in the landuse/land
cover. It was discovered that there is rapid inbuilt-up areas evidently explained in buildings
projects that resulted in decrease in forest land, agricultural land and open space. This is
attributed to the anthropogenic activities of farming, bush burning, grazing, etc. However, the
area occupied by water remained unchanged over the years. This study demonstrates that remotely
sensed data and GIS based approach is found to be timely and cost effective than the conventional
method of analysis, classification of land use pattern effective for planning and management.
KEY WORDS: Remote Sensing, Satellite image, Geographic information System (GIS), IDRISI
32 software, Land cover, Landuse, Mapping, Change Detection
INTRODUCTION
The demand for landuse/landcover data has grown in multiple folds over the years as an
indispensable means of planning and implementation of developmental projects. Without
considering the implications for planning of major developmental projects, there has been
unprofessional use of agricultural land and open spaces in an unplanned situation. The data derived
for landuse/land cover give insight to better understand land utilization aspects as well as play a
British Journal of Environmental Sciences
Vol.3, No.3, pp.42-61, August 2015
Published by European Centre for Research Training and Development UK (www.eajournals.org)
43 ISSN 2055-0219(Print), ISSN 2055-0227(online)
vital role in the formulation of policies and programme implementation for development. It is
important to note that, land is very important resource to man and it is better managed for
continuous existence and its progress depends on our ability to avoid its mismanagement.
Traditional field survey, remote sensing images and digital data verified by ground trothing (field
work) are widely used in data collection of the environment for this study. With the traditional
field survey alone, it is difficult to update and upgrade data base except for Inclusion of remote
sensing and GIS method .
STATEMENT OF THE PROBLEM
Researchers have worked on Land use/Landcover mapping in ancient cities of Ibadan, Lagos,
Benin City, Ilorin, etc, in Nigeria, while few have been done in new towns like Asaba town (study
Area) in Oshimilli local Government Area. However, emphases were laid on aerial photographs,
Landsat and spot satellites in land use / landcover mapping in cities of Nigeria for
comparative analysis of sequential photographs, but none is carried out with NARSDA image
f or land use / land cover mapping of Asaba town. The approach of comparison for change
detection in landscape on time series analysis, is based on land absorption and consumption
coefficients of new urban land carried out at a point in time with the image of area was taken at
same time in the past and to correspond with the present. The review of literature on the related
application on Landuse/ Landcover mapping shows that, there are few remarkable works on
Landuse/land cover mapping and classification in the Niger Delta region of Nigeria, and this
research tends to fill this gap.
AIM AND OBJECTIVES STUDY
The aim of the study is to use satellite remotely sensed satellite image to generate
landuse/landcover data, make comparison using temporal consideration (1996 - 2015), with a view
to ascertain the level of changes in landuse/cover based on land absorption and consumption rates.
Finally to use ground truthing verify the accuracy of major changes in the landuse/land cover in
the study area.
STUDY AREA
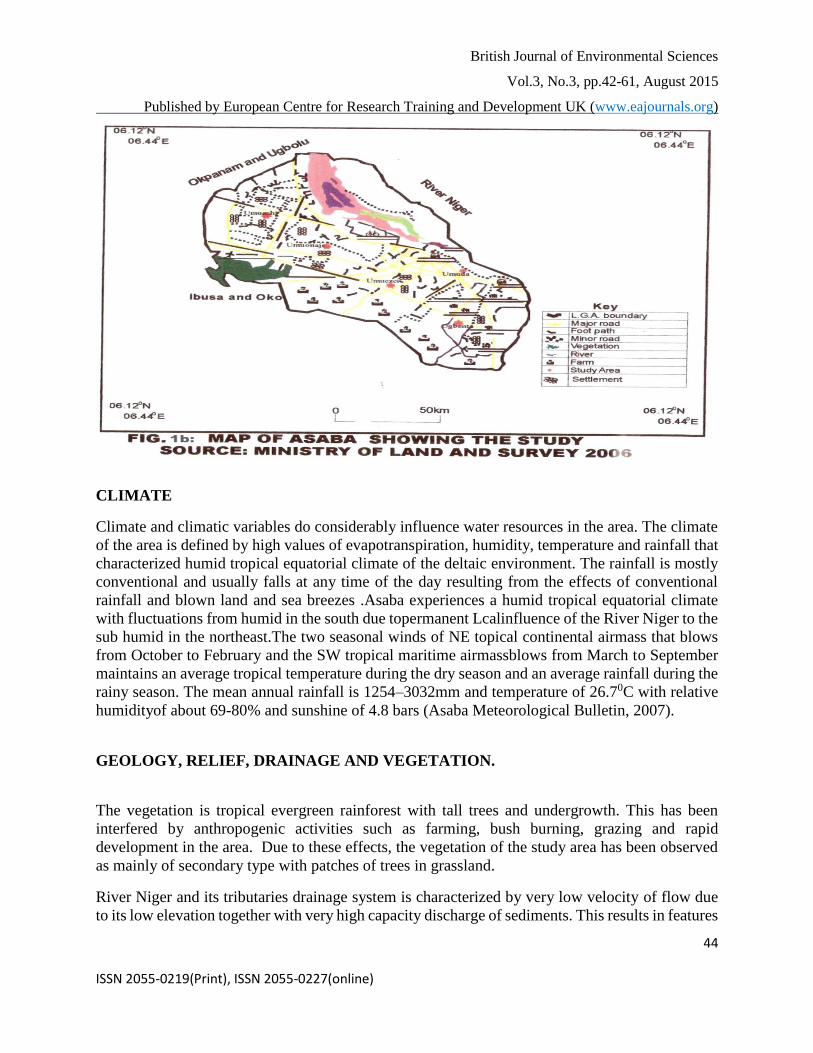
Location and Size
Asaba is the capital city of Delta State and was created in August 27th 1991 out of the former
Bendel State. It also serves as the Local Government headquarter of the Oshimilli South Local
Government Area. (Fig 1). It is located on the bank of the Niger River. Geographic reference
indicates that, it is located on latitude 6o30iand longitude 6o45iE with estimated area of about 200
square kilometres. Asaba is made up of few villages tha are Okot include Anala, Oko-Ogbele and
Okwe to mention but a few. The town has a network of good roads, standard hotels and
communication facilities. The Niger Bridge connects Asaba to Onitsha in Anambra State but
separated by the River Niger.
British Journal of Environmental Sciences
Vol.3, No.3, pp.42-61, August 2015
Published by European Centre for Research Training and Development UK (www.eajournals.org)
44 ISSN 2055-0219(Print), ISSN 2055-0227(online)
CLIMATE
Climate and climatic variables do considerably influence water resources in the area. The climate
of the area is defined by high values of evapotranspiration, humidity, temperature and rainfall that
characterized humid tropical equatorial climate of the deltaic environment. The rainfall is mostly
conventional and usually falls at any time of the day resulting from the effects of conventional
rainfall and blown land and sea breezes .Asaba experiences a humid tropical equatorial climate
with fluctuations from humid in the south due topermanent Lcalinfluence of the River Niger to the
sub humid in the northeast.The two seasonal winds of NE topical continental airmass that blows
from October to February and the SW tropical maritime airmassblows from March to September
maintains an average tropical temperature during the dry season and an average rainfall during the
rainy season. The mean annual rainfall is 1254–3032mm and temperature of 26.70C with relative
humidityof about 69-80% and sunshine of 4.8 bars (Asaba Meteorological Bulletin, 2007).
GEOLOGY, RELIEF, DRAINAGE AND VEGETATION.
The vegetation is tropical evergreen rainforest with tall trees and undergrowth. This has been
interfered by anthropogenic activities such as farming, bush burning, grazing and rapid
development in the area. Due to these effects, the vegetation of the study area has been observed
as mainly of secondary type with patches of trees in grassland.
River Niger and its tributaries drainage system is characterized by very low velocity of flow due
to its low elevation together with very high capacity discharge of sediments. This results in features
British Journal of Environmental Sciences
Vol.3, No.3, pp.42-61, August 2015
Published by European Centre for Research Training and Development UK (www.eajournals.org)
45 ISSN 2055-0219(Print), ISSN 2055-0227(online)
such as braided channels, lagoons, canals, bars, creeks, meanders as shown in the Nigeria Surveys
topographical sheet of the area.map of that result from alternative flooding and exposure episodes
of a long rainy season with short dry season accompanied with tidal movements. In the rainy
season, high rainfall and poorly drained soil of low retention capacity results in wide spread
flooding and erosion. Thus, 80% of the entire area is flooded with the rivers overflowing their
banks at the peak of wet season as the coastline is buffeted throughout the year by tidal current
(tides) of the Niger and indeed Astlantic Ocean (Ejemeyovwi ,2008).
Most of the area lies below sea level (bsl) with only few places of 20mm height above ssea level
(asl) (Odemero and Ejemeyovwi, 2008). This result in marshy and waterlogged condition of the
entire landscape,a poorly drained environment coupled with several tributaries and distributaries
that empty waters into the River Niger,
The surface geology of the study area is made up of Ameki and Ogwashi- Asaba formations in
the northeast of Delta state and the coastal plain sands (Benin formation) that astride the northern
boundary with Edo State and beyond. The Ogwashi-Asaba formation is made up of coarse grained
sands containing lignite and peaty clay seams. It is poor of ground water and characterized by the
widespread occurrence of lost circulation (Rayment, 1965). Both the Ameki and Ogwashi-Asaba
formations are richly endowed with kaolinites, while the latter formation also contains lignite
seams Ejemeyovwi (2008).Three geologic formations are recognizable form the distinct attributes
of depositional circles of sediments since early cretaceous (135my ± 65) in the area. They are
upper Benin sands, middle Agbadaofinterbedded sands/marine shales and lower Akata made up
of massive and regressive marine shales and clays deposits (Nwachukwu and Odjegba, 2001).
POPULATION OF THE AREA
The area is naturally made up mainly of the Igbo (Delta) ethnic group and as a state capital, large
population of Urhobo, Itsekiri, Ijaw, Isokos are residents. The total population the area was
estimated to be 49,725 in 1991,123,746 in 2006(NPC,2006)and a population of 1,723,745 due to
influx of migrants especially as a state capital.
HUMAN ACTIVITIES
Asaba is mainly an administrative town with high commercial activities carried out. The banking
industry has about twenty commercial banks in Asaba, located along the Nnebisi road. There is
only one major market in the area, (Ogbogonogo market) which is also located along the Nnebisi
road. The State government and the private investors have contributed in no small measure to the
development of the place e.g. the Ogbogonogo market was reconstructed by the state government
with modern facilities to enhance maximum commercial activities in the area. A small market is
alsolocated along the cable point area.There are also high commercial activities in areas of
transportation industry with Delta line and private ownership. There are notable companies and
hotels in Asaba. These includeindustries such as textile, aluminium industry along the Agbor-
Benin expressway, general steel mills (GSM) in Ibusa road and hotels like grand, sunrise, Nairese,
etcLumbering activity with saw mills located in the area. The traffic light area have wood/furniture
British Journal of Environmental Sciences
Vol.3, No.3, pp.42-61, August 2015
Published by European Centre for Research Training and Development UK (www.eajournals.org)
46 ISSN 2055-0219(Print), ISSN 2055-0227(online)
works, due to presence of hard wood of the humid tropical trees with various species such as
Opepe, mahogany, matsonia, Iroko, etc. Agricultural activities in the form of farming, animal
husbandry (poultry and rearing of animals) are carried out in the area. When the river Niger
overflows its bank, it enriches the soil fertility for the cultivation of crops e.g. cassava, yam, maize
in the area. A lot of fishing activities is also carried out along the river Niger and its tributaries.
The river Niger beach is a tourist area that is a hospitable place for tourism
SETTLEMENT PATTERN
The settlement pattern of Asaba is a nucleated type of settlement though with some linear
disposition. The major road is the Nnebisiroad and the river Niger by the town, makes for nucleated
pattern of settlement and the houses are closely built but houses across the Onitsha – Asaba
expressway are dispersed in a linear pattern.
LITERATURE REVIEW
The U.S Geological Survey carried out a research program in 1985 to produce 1:250,000 scale
land cover maps of Alaska using landsat MSS data (Fiz Patrick et al, 1987). Also, the state of
Maryland health planning commission employed landsat TM data to create a land cover data set
for inclusion in Maryland geographic information (MAG) database. The seven TM bands were
used to produce 21 class land cover map (EOSAT 1992). ln 1992, the Georgia Department of
Natural Resources completed mapping the entire state of Georgia to identify and quantify
wetlands and other land cover types using landsat thematic mapper(TM) data (ERDAS, 1992).
Onokerhoraye and Omuta (1994) attribute difference in the land use to processes of land use
development in cities of Nigeria. During the pre – colonial period, land use type in the traditional
cities of Nigeria comprises the residential, commercial and some open spaces. They futher
explained that modern traditional cities in the country have varieties of land use types that reflect
the processes and patterns of urban development in recent times. Among the dominant land use
types in the urban areas of the country are residential and commercial, industrial, public and semi
public, transport and communication, recreation. The comparison of some urban areas devoted to
various types of landuse indicated that, residential landuse still dominates all other landuse
activities in the world. This portrays the importance of residential landuse. However, in case over
of 50% of the total land use devoted to residential development, residential land use with in urban
area varies in terms of density, quality, racial or ethic occupancy and age. Thus, residential landuse
in some urban areas are not consent rather it varies from one urban area to another in terms of
density, quality, racial or ethnic grouping and even age.
Analysis of land use and cover changes using the combination of MSS landsat and land use map
of Indonesia by Dimyati, (1995) revealed that, land use/land cover change were evaluated. Remote
sensing was used to calculate the index of change which was carried out based on superimposition
of land use/land cover images of 1972, 1984 and land use maps of 1990 was to analyze the pattern
British Journal of Environmental Sciences
Vol.3, No.3, pp.42-61, August 2015
Published by European Centre for Research Training and Development UK (www.eajournals.org)
47 ISSN 2055-0219(Print), ISSN 2055-0227(online)
of change in the area, this was rather difficult with the traditional method of surveying as noted by
Olorunfemi (1983) when he was using aerial photographic approach to monitor urban land use in
iilorin in Nigeria.
Adeniyi and Omojola (1997) also mapped the landuse and landcover change evaluation of Sokoto-
Rima Basin using landsat and archival remote sensing procedures. Adeniyi (1978, 1980,1981) did
a study on residential landuse in estimating and predicting population growth of the city of Lagos.
Adeniyi and Omojola (1999) in their analysis of land cover change evaluation in Sokoto – Rima
Basin of North – Western Nigerian based on archival remote sensing and GIS techniques, used
aerial photographs, landsat MSS, SPOT XS/Panchromatic image transparency and topographic
map sheets to study change in the two dams (Sokoto and Guronyo) for time interval between 1962
and 1986. The study revealed that, land use/ cover of both areas were unchanged before the
constructions and settlement mostly covered the entire area. However, during the post- Dam era,
the land use/ land cover classes changed but with settlement still remaining most prominent.
Also, Ikhuoria (1999) investigated the application of spot 1 satellite data in the analysis of urban
growth regimes and land characteristics of Benin City Daniel et al, (2002) in the comparison of
land cover change detection methods in USA, made use of 5 methods namely traditional post –
classification cross tabulation, cross correlation analysis neutral networks, knowledge – based
expert systems, image segmentation and object – oriented classification. A combination of direct
T1 and T2 change detection as well as post classification analysis was employed. Nine land use
cover classes were selected for analysis and the merits to each of the five methods examined at the
point of their research and no single approach could solve the land use change detection problem.
Arvind and Nathawat (2006) carried out study oo land use land cover mapping of Panchkula,
Ambala and Yanunanger districts, Hangana state india and observed that the heterogeneous
climate and physiographic conditions in these districts resulted in the development of different
land use and cover pattern in these district An evaluation of digital analysis satellite data indicate
that majority of the areas in these districts are used for agricultural purpose with hilly regions
exhibiting fair development of reserved forest with the land cover pattern generally controlled by
agro – climatic conditions, ground water potential and a host of other factors
Zubair, (2006) project examines the use of GIS and Remote Sensing in mapping land use/land
cover in Ilorin between 1972 and 2001 so as to detect changes takenplace in this status between
these periods. Subsequently, an attempt was made atprojecting the observed land use land cover
in the next 14 years. In achieving this, land consumption rate and land absorption coefficient were
introduced to aid in the quantitative assessment of the change using Arcview 3.2 GIS system. The
result of the work shows a rapid growth inbuilt-up land between 1972 and 1986 while the periods
between 1986 and 2001 witnessed a reduction in this class. It was also observed that change by
2015 may likely follow the trend in 1986/2001. Suggestions were therefore made at the end of the
work on ways to use the information as contained therein optimally. Attempt was made to capture
as accurate as possible five land use land cover classes as they change through time. Except for
the inability to accurately map out water body in 1972 due to the aforementioned limitation, the
five classes (farm land. waste land, built, up land, forest land and water body) were distinctly
British Journal of Environmental Sciences
Vol.3, No.3, pp.42-61, August 2015
Published by European Centre for Research Training and Development UK (www.eajournals.org)
48 ISSN 2055-0219(Print), ISSN 2055-0227(online)
produced for each study year but with more emphasis on built-up land as it is a combination of
anthropogenic activities hat make up this class; and indeed, it is one that affects the other classes.
Ejemeyovwi (2009) studied the land use pattern and its attendant effects in Abraka Urban, Delta
State. High spatial resolution remote sensing spot satellite image of 2005 and 2008 were used for
systematic mapping and classification of various land use/land cover types and their effects using
Arcview 3.2 GIS system. Seven distinct units were identified in classification and land use pattern
analysis as follows: commercials, communication and utilities, industrial, institution, recreation,
residential and vacant land. The residential unit accounts for over 80% of all the landuse type.
This study also demonstrates that remotely sensed data and GIS based approach is found to be
timely, cost effective than the conventional method in classification and analysis of land use
pattern and effects and for planning and management in Abraka.
CONCEPTUAL FRAMEWORK
Irrespective of the fact that the internal structure of every urban centers looks different and unique,
there are common characteristics that most towns and cities posses and can be divided into three
(3) distinct segments which are represented with theories of internal urban structures. These
include concentric, radial and multiple nuclei cities. These various cities are usually result from
different growth patterns that occurred b ut the first and the last ones apply mostly relevant to
developing countries.
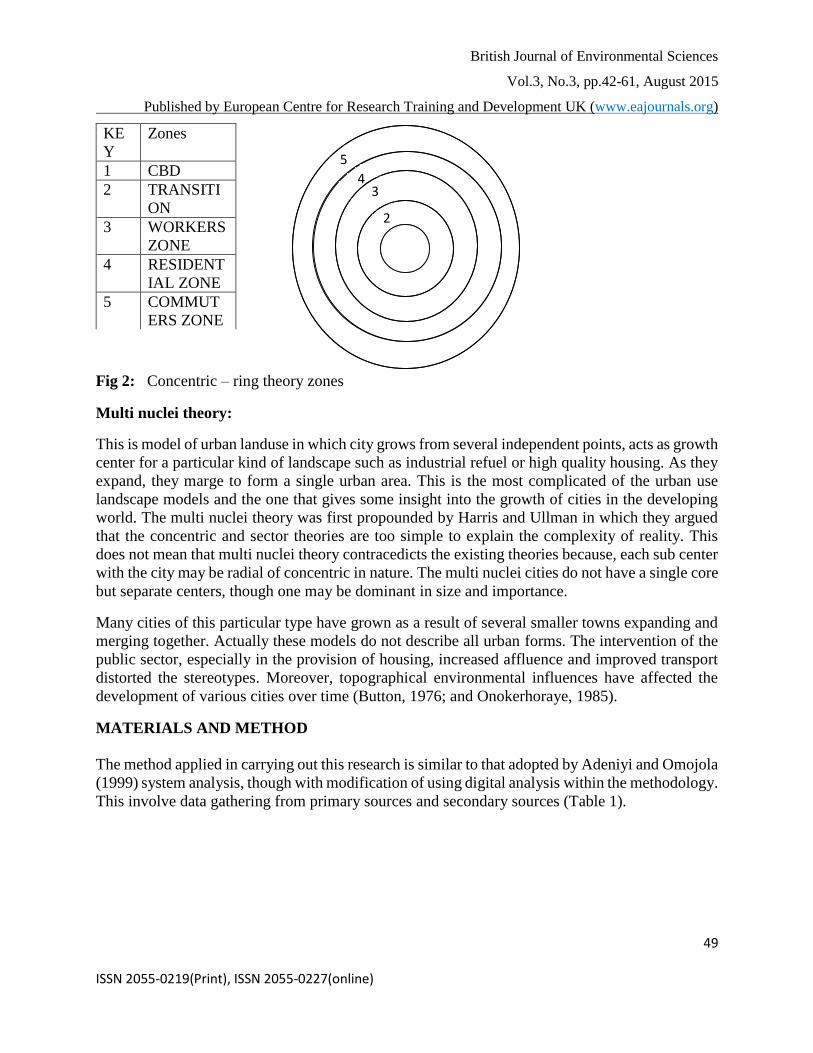
I. Concentric – ring theory zones
This is a hypothetical pattern of landuse within an urban area, in which activities occur at
different distances from the center. This results in sequences of rings. The theory was first
suggested in 1925 by an American sociologist Earnest W. Burgess on the basis of his study of city
of Chicago. He identified five (5) concentric zones of land use types within the cities. These are;
1. core central business district(CBD) - the focus of the commercial, social and civic life
2. after CBD, there is the transition zone characterized by individual premises, old private
houses, office and warehouses. It is usually a poor area.
3. The ring of residential properties which in the past provided accommodation for those in
the CBD; but within the growth of sub-urban, become random and now house the poorest
section of the community.
4. next zone comprises of more spacious and usually single family dwelling with some high
class apartment which house the middle and high income earners.
5. outermost commuter zone which may be beyond the continuous built- up area of the town
and it is characterized by large detached house as well as village which have taken on
dormitory functions.
British Journal of Environmental Sciences
Vol.3, No.3, pp.42-61, August 2015
Published by European Centre for Research Training and Development UK (www.eajournals.org)
49 ISSN 2055-0219(Print), ISSN 2055-0227(online)
Fig 2: Concentric – ring theory zones
Multi nuclei theory:
This is model of urban landuse in which city grows from several independent points, acts as growth
center for a particular kind of landscape such as industrial refuel or high quality housing. As they
expand, they marge to form a single urban area. This is the most complicated of the urban use
landscape models and the one that gives some insight into the growth of cities in the developing
world. The multi nuclei theory was first propounded by Harris and Ullman in which they argued
that the concentric and sector theories are too simple to explain the complexity of reality. This
does not mean that multi nuclei theory contracedicts the existing theories because, each sub center
with the city may be radial of concentric in nature. The multi nuclei cities do not have a single core
but separate centers, though one may be dominant in size and importance.
Many cities of this particular type have grown as a result of several smaller towns expanding and
merging together. Actually these models do not describe all urban forms. The intervention of the
public sector, especially in the provision of housing, increased affluence and improved transport
distorted the stereotypes. Moreover, topographical environmental influences have affected the
development of various cities over time (Button, 1976; and Onokerhoraye, 1985).
MATERIALS AND METHOD
The method applied in carrying out this research is similar to that adopted by Adeniyi and Omojola
(1999) system analysis, though with modification of using digital analysis within the methodology.
This involve data gathering from primary sources and secondary sources (Table 1).
KE
Y
Zones
1 CBD
2 TRANSITI
ON
3 WORKERS
ZONE
4 RESIDENT
IAL ZONE
5 COMMUT
ERS ZONE
2
3 4
5
British Journal of Environmental Sciences
Vol.3, No.3, pp.42-61, August 2015
Published by European Centre for Research Training and Development UK (www.eajournals.org)
50 ISSN 2055-0219(Print), ISSN 2055-0227(online)
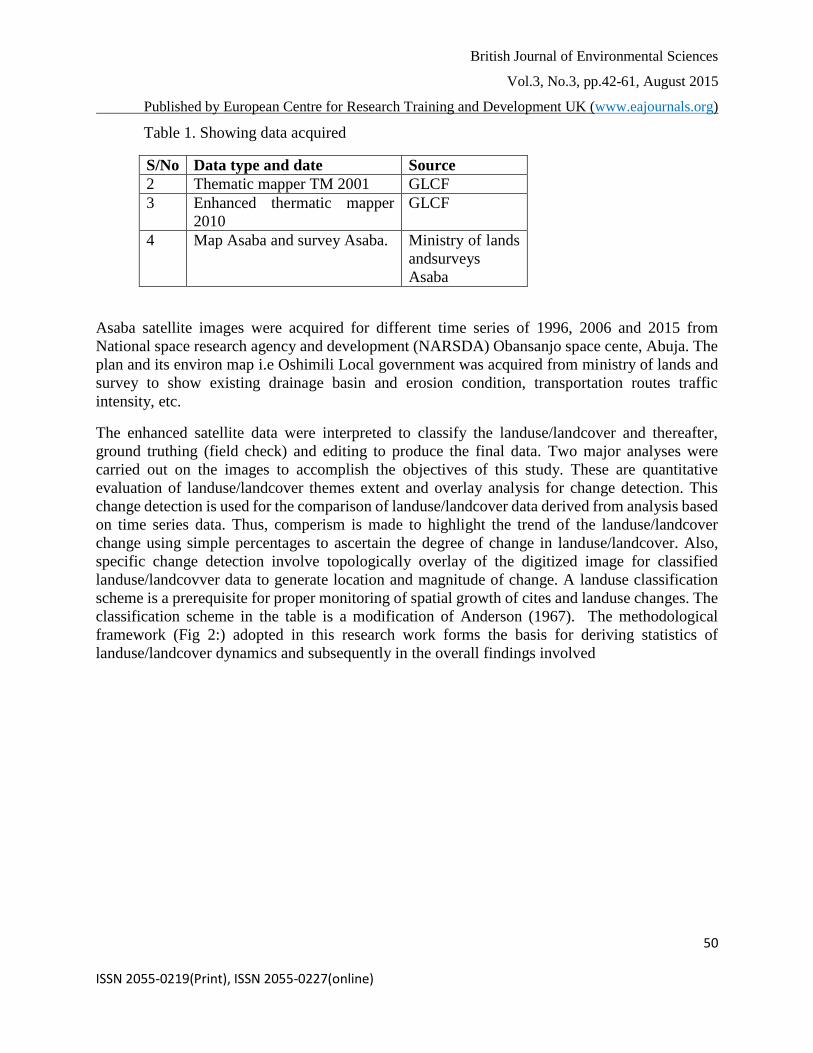
Table 1. Showing data acquired
S/No Data type and date Source
2 Thematic mapper TM 2001 GLCF
3 Enhanced thermatic mapper
2010
GLCF
4 Map Asaba and survey Asaba. Ministry of lands
andsurveys
Asaba
Asaba satellite images were acquired for different time series of 1996, 2006 and 2015 from
National space research agency and development (NARSDA) Obansanjo space cente, Abuja. The
plan and its environ map i.e Oshimili Local government was acquired from ministry of lands and
survey to show existing drainage basin and erosion condition, transportation routes traffic
intensity, etc.
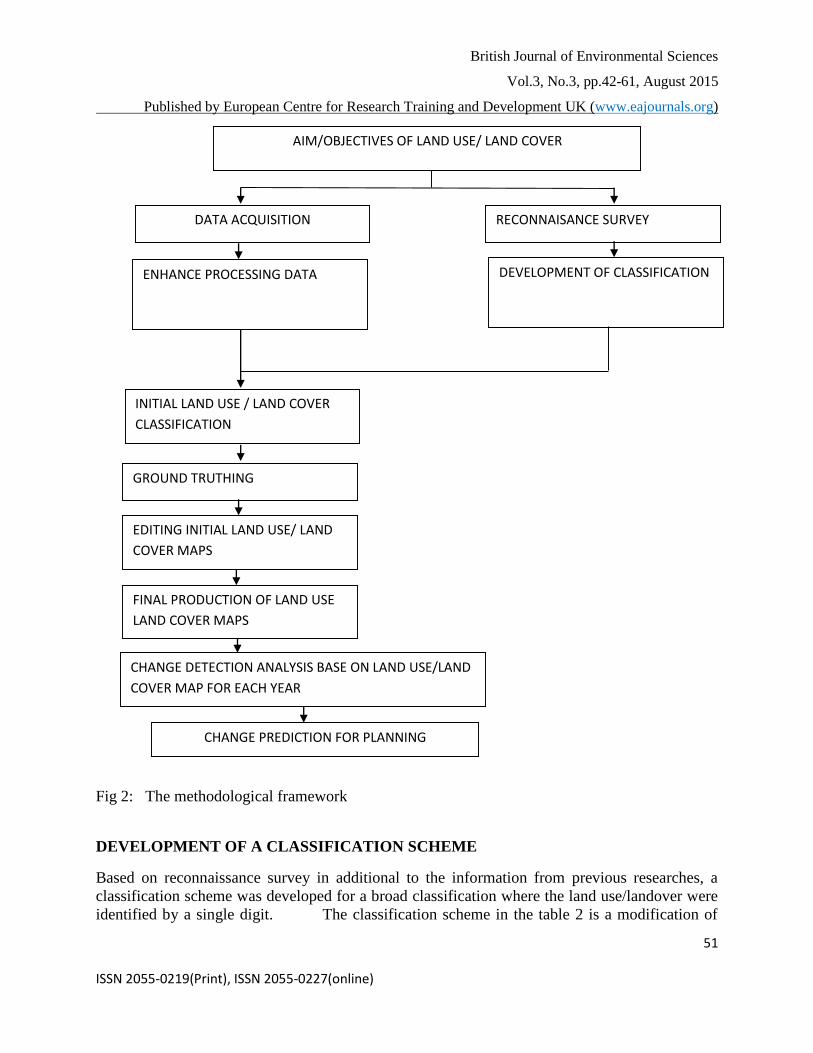
The enhanced satellite data were interpreted to classify the landuse/landcover and thereafter,
ground truthing (field check) and editing to produce the final data. Two major analyses were
carried out on the images to accomplish the objectives of this study. These are quantitative
evaluation of landuse/landcover themes extent and overlay analysis for change detection. This
change detection is used for the comparison of landuse/landcover data derived from analysis based
on time series data. Thus, comperism is made to highlight the trend of the landuse/landcover
change using simple percentages to ascertain the degree of change in landuse/landcover. Also,
specific change detection involve topologically overlay of the digitized image for classified
landuse/landcovver data to generate location and magnitude of change. A landuse classification
scheme is a prerequisite for proper monitoring of spatial growth of cites and landuse changes. The
classification scheme in the table is a modification of Anderson (1967). The methodological
framework (Fig 2:) adopted in this research work forms the basis for deriving statistics of
landuse/landcover dynamics and subsequently in the overall findings involved
British Journal of Environmental Sciences
Vol.3, No.3, pp.42-61, August 2015
Published by European Centre for Research Training and Development UK (www.eajournals.org)
51 ISSN 2055-0219(Print), ISSN 2055-0227(online)
Fig 2: The methodological framework
DEVELOPMENT OF A CLASSIFICATION SCHEME
Based on reconnaissance survey in additional to the information from previous researches, a
classification scheme was developed for a broad classification where the land use/landover were
identified by a single digit. The classification scheme in the table 2 is a modification of
AIM/OBJECTIVES OF LAND USE/ LAND COVER
DATA ACQUISITION RECONNAISANCE SURVEY
ENHANCE PROCESSING DATA DEVELOPMENT OF CLASSIFICATION
INITIAL LAND USE / LAND COVER
CLASSIFICATION
GROUND TRUTHING
EDITING INITIAL LAND USE/ LAND
COVER MAPS
FINAL PRODUCTION OF LAND USE
LAND COVER MAPS
CHANGE DETECTION ANALYSIS BASE ON LAND USE/LAND
COVER MAP FOR EACH YEAR
CHANGE PREDICTION FOR PLANNING
British Journal of Environmental Sciences
Vol.3, No.3, pp.42-61, August 2015
Published by European Centre for Research Training and Development UK (www.eajournals.org)
52 ISSN 2055-0219(Print), ISSN 2055-0227(online)
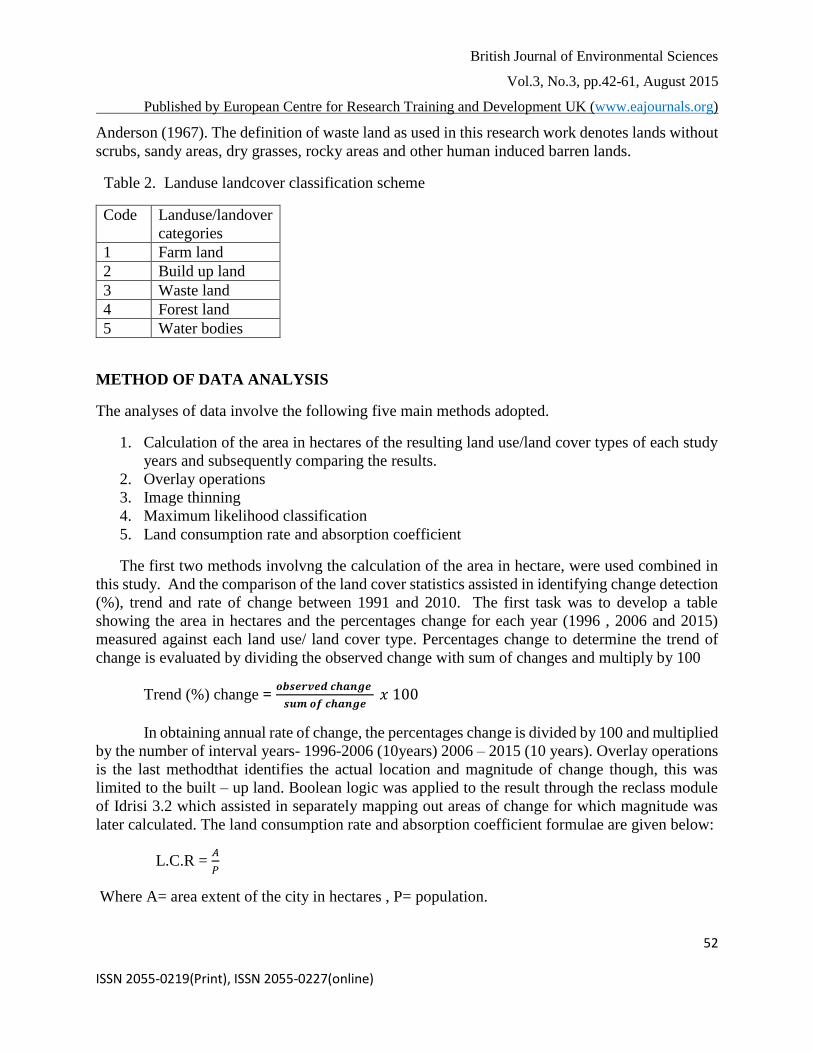
Anderson (1967). The definition of waste land as used in this research work denotes lands without
scrubs, sandy areas, dry grasses, rocky areas and other human induced barren lands.
Table 2. Landuse landcover classification scheme
Code Landuse/landover
categories
1 Farm land
2 Build up land
3 Waste land
4 Forest land
5 Water bodies
METHOD OF DATA ANALYSIS
The analyses of data involve the following five main methods adopted.
1. Calculation of the area in hectares of the resulting land use/land cover types of each study
years and subsequently comparing the results.
2. Overlay operations
3. Image thinning
4. Maximum likelihood classification
5. Land consumption rate and absorption coefficient
The first two methods involvng the calculation of the area in hectare, were used combined in
this study. And the comparison of the land cover statistics assisted in identifying change detection
(%), trend and rate of change between 1991 and 2010. The first task was to develop a table
showing the area in hectares and the percentages change for each year (1996 , 2006 and 2015)
measured against each land use/ land cover type. Percentages change to determine the trend of
change is evaluated by dividing the observed change with sum of changes and multiply by 100
Trend (%) change = 𝒐𝒃𝒔𝒆𝒓𝒗𝒆𝒅 𝒄𝒉𝒂𝒏𝒈𝒆
𝒔𝒖𝒎 𝒐𝒇 𝒄𝒉𝒂𝒏𝒈𝒆 𝑥 100
In obtaining annual rate of change, the percentages change is divided by 100 and multiplied
by the number of interval years- 1996-2006 (10years) 2006 – 2015 (10 years). Overlay operations
is the last methodthat identifies the actual location and magnitude of change though, this was
limited to the built – up land. Boolean logic was applied to the result through the reclass module
of Idrisi 3.2 which assisted in separately mapping out areas of change for which magnitude was
later calculated. The land consumption rate and absorption coefficient formulae are given below:
L.C.R = 𝐴
𝑃
Where A= area extent of the city in hectares , P= population.
British Journal of Environmental Sciences
Vol.3, No.3, pp.42-61, August 2015
Published by European Centre for Research Training and Development UK (www.eajournals.org)
53 ISSN 2055-0219(Print), ISSN 2055-0227(online)
And L.A.C = 𝐴 2−𝐴1
𝑃2−𝑃1
A1 and A2 are the area extent (in hectares) for the early and later years, and P1 and P2 are
population figure for the early and later years respectively (Yeates and Garner, 1976)
L.C.R =A measure of compactness which indicates a progressive spatial expansion of a city
The formula given for the population estimate was developed by the researcher in evaluating the
socio-economic implications of change, the effect of observed of observed changes in the land use
and land cover between 1996 and 2015 were used as major criteria.
DATA PRESENTATION AND ANALYSIS
The aim and objectives of this study form the basis of the analysis carried out. The results are
presented in form of maps, histogratm charts and statistical tables..
LAND USE/ LAND COVER DISTRIBUTION
The static landuse/landcover distribution for each study year is derived from 1996, 2006, 2015
images. The figures presented represent the static area of each landuse/ landcover category for
each study year
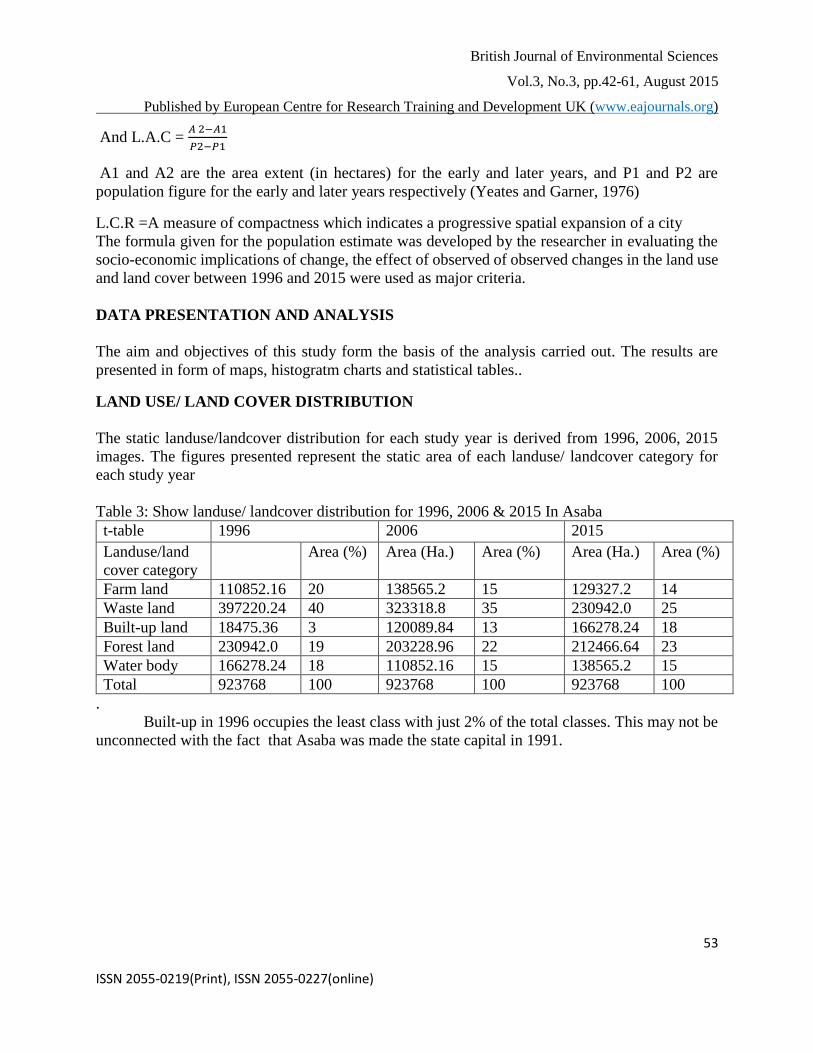
Table 3: Show landuse/ landcover distribution for 1996, 2006 & 2015 In Asaba
t-table 1996 2006 2015
Landuse/land
cover category
Area (%) Area (Ha.) Area (%) Area (Ha.) Area (%)
Farm land 110852.16 20 138565.2 15 129327.2 14
Waste land 397220.24 40 323318.8 35 230942.0 25
Built-up land 18475.36 3 120089.84 13 166278.24 18
Forest land 230942.0 19 203228.96 22 212466.64 23
Water body 166278.24 18 110852.16 15 138565.2 15
Total 923768 100 923768 100 923768 100
.
Built-up in 1996 occupies the least class with just 2% of the total classes. This may not be
unconnected with the fact that Asaba was made the state capital in 1991.
British Journal of Environmental Sciences
Vol.3, No.3, pp.42-61, August 2015
Published by European Centre for Research Training and Development UK (www.eajournals.org)
54 ISSN 2055-0219(Print), ISSN 2055-0227(online)
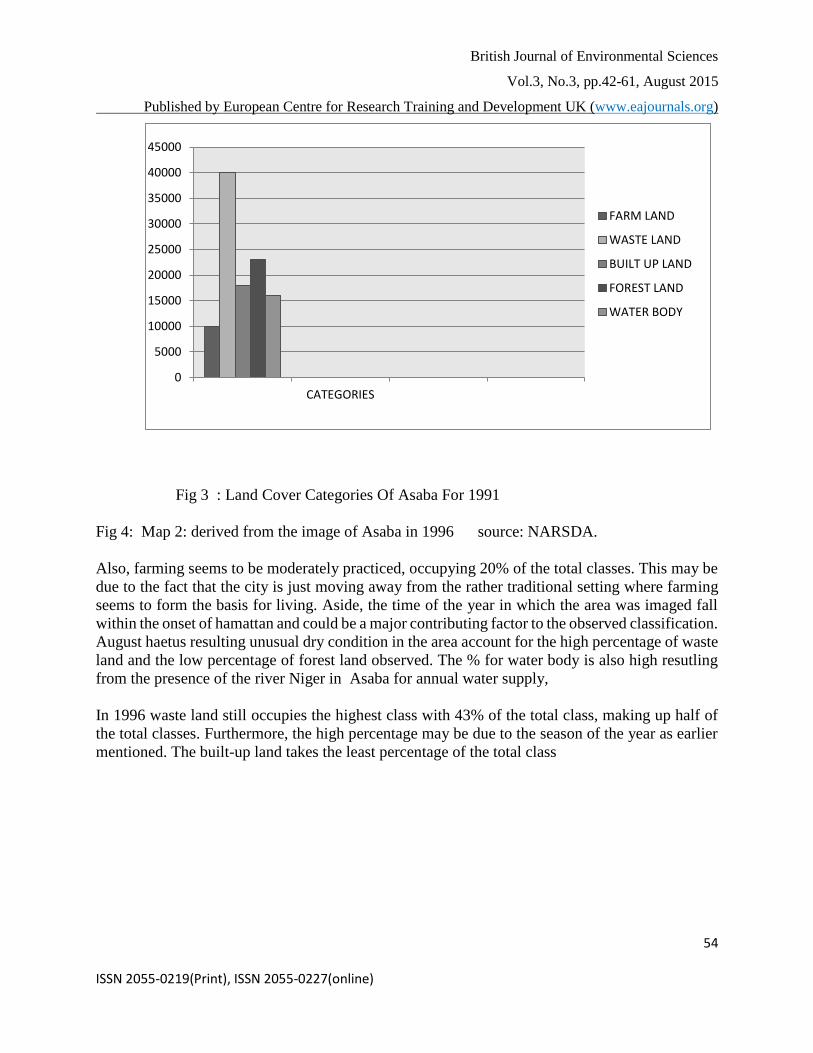
Fig 3 : Land Cover Categories Of Asaba For 1991
Fig 4: Map 2: derived from the image of Asaba in 1996 source: NARSDA.
Also, farming seems to be moderately practiced, occupying 20% of the total classes. This may be
due to the fact that the city is just moving away from the rather traditional setting where farming
seems to form the basis for living. Aside, the time of the year in which the area was imaged fall
within the onset of hamattan and could be a major contributing factor to the observed classification.
August haetus resulting unusual dry condition in the area account for the high percentage of waste
land and the low percentage of forest land observed. The % for water body is also high resutling
from the presence of the river Niger in Asaba for annual water supply,
In 1996 waste land still occupies the highest class with 43% of the total class, making up half of
the total classes. Furthermore, the high percentage may be due to the season of the year as earlier
mentioned. The built-up land takes the least percentage of the total class
0
5000
10000
15000
20000
25000
30000
35000
40000
45000
CATEGORIES
FARM LAND
WASTE LAND
BUILT UP LAND
FOREST LAND
WATER BODY
British Journal of Environmental Sciences
Vol.3, No.3, pp.42-61, August 2015
Published by European Centre for Research Training and Development UK (www.eajournals.org)
55 ISSN 2055-0219(Print), ISSN 2055-0227(online)
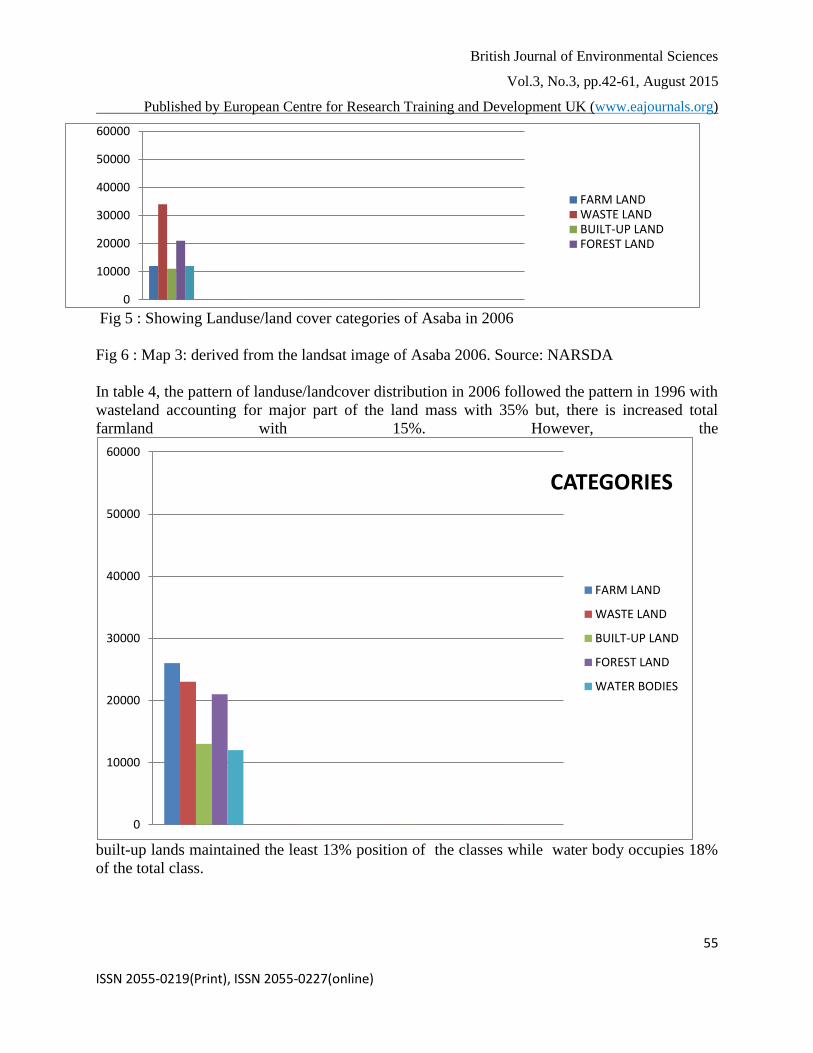
Fig 5 : Showing Landuse/land cover categories of Asaba in 2006
Fig 6 : Map 3: derived from the landsat image of Asaba 2006. Source: NARSDA
In table 4, the pattern of landuse/landcover distribution in 2006 followed the pattern in 1996 with
wasteland accounting for major part of the land mass with 35% but, there is increased total
farmland with 15%. However, the
built-up lands maintained the least 13% position of the classes while water body occupies 18%
of the total class.
0
10000
20000
30000
40000
50000
60000
FARM LANDWASTE LANDBUILT-UP LANDFOREST LAND
0
10000
20000
30000
40000
50000
60000
CATEGORIES
FARM LAND
WASTE LAND
BUILT-UP LAND
FOREST LAND
WATER BODIES
British Journal of Environmental Sciences
Vol.3, No.3, pp.42-61, August 2015
Published by European Centre for Research Training and Development UK (www.eajournals.org)
56 ISSN 2055-0219(Print), ISSN 2055-0227(online)
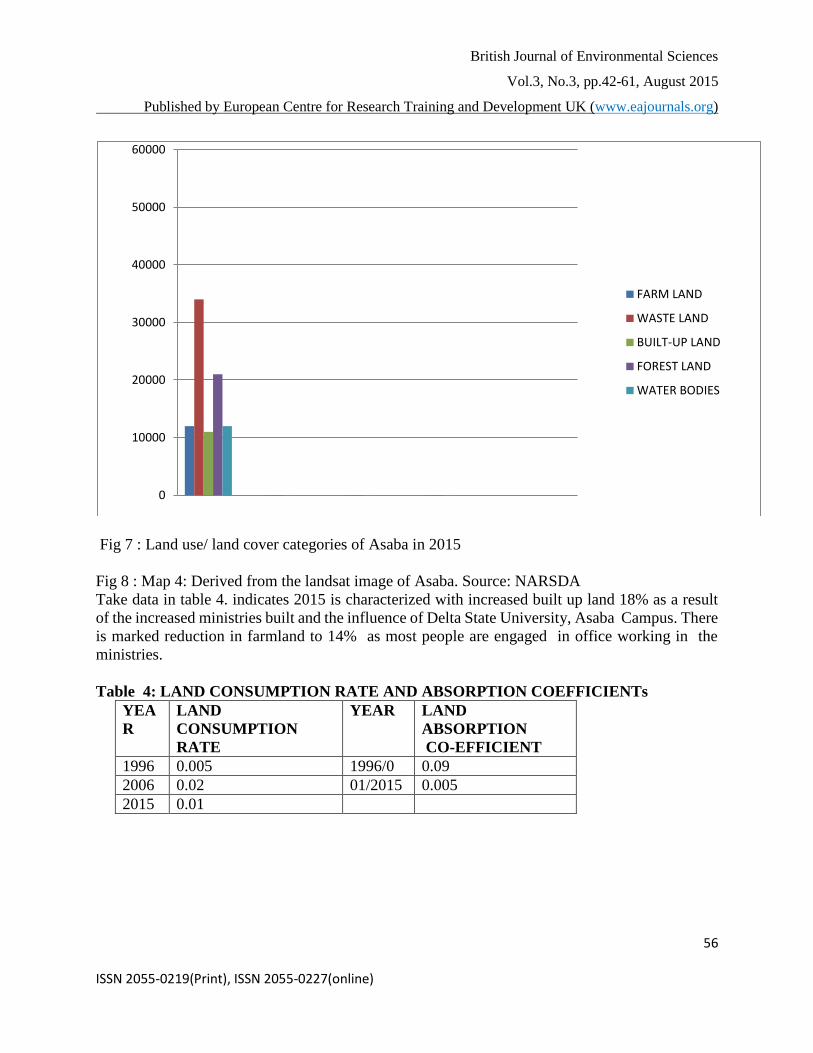
Fig 7 : Land use/ land cover categories of Asaba in 2015
Fig 8 : Map 4: Derived from the landsat image of Asaba. Source: NARSDA
Take data in table 4. indicates 2015 is characterized with increased built up land 18% as a result
of the increased ministries built and the influence of Delta State University, Asaba Campus. There
is marked reduction in farmland to 14% as most people are engaged in office working in the
ministries.
Table 4: LAND CONSUMPTION RATE AND ABSORPTION COEFFICIENTs
YEA
R
LAND
CONSUMPTION
RATE
YEAR LAND
ABSORPTION
CO-EFFICIENT
1996 0.005 1996/0 0.09
2006 0.02 01/2015 0.005
2015 0.01
0
10000
20000
30000
40000
50000
60000
FARM LAND
WASTE LAND
BUILT-UP LAND
FOREST LAND
WATER BODIES
British Journal of Environmental Sciences
Vol.3, No.3, pp.42-61, August 2015
Published by European Centre for Research Training and Development UK (www.eajournals.org)
57 ISSN 2055-0219(Print), ISSN 2055-0227(online)
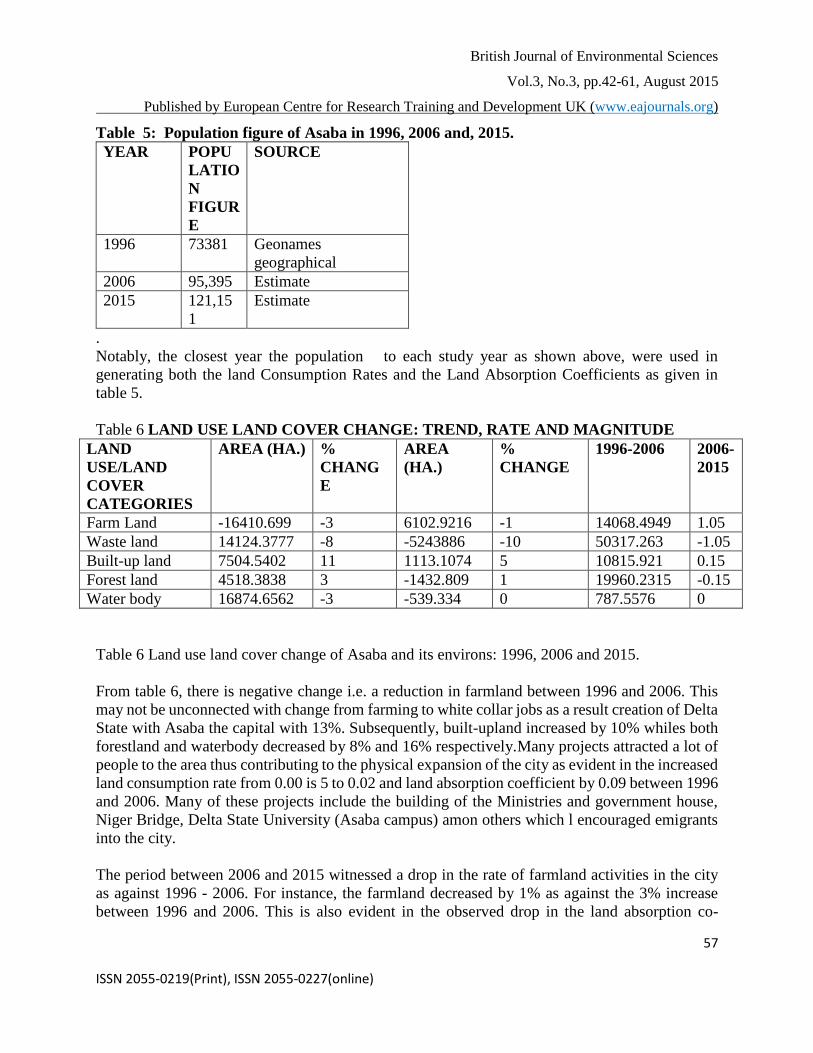
Table 5: Population figure of Asaba in 1996, 2006 and, 2015.
YEAR POPU
LATIO
N
FIGUR
E
SOURCE
1996 73381 Geonames
geographical
2006 95,395 Estimate
2015 121,15
1
Estimate
.
Notably, the closest year the population to each study year as shown above, were used in
generating both the land Consumption Rates and the Land Absorption Coefficients as given in
table 5.
Table 6 LAND USE LAND COVER CHANGE: TREND, RATE AND MAGNITUDE
LAND
USE/LAND
COVER
CATEGORIES
AREA (HA.) %
CHANG
E
AREA
(HA.)
%
CHANGE
1996-2006 2006-
2015
Farm Land -16410.699 -3 6102.9216 -1 14068.4949 1.05
Waste land 14124.3777 -8 -5243886 -10 50317.263 -1.05
Built-up land 7504.5402 11 1113.1074 5 10815.921 0.15
Forest land 4518.3838 3 -1432.809 1 19960.2315 -0.15
Water body 16874.6562 -3 -539.334 0 787.5576 0
Table 6 Land use land cover change of Asaba and its environs: 1996, 2006 and 2015.
From table 6, there is negative change i.e. a reduction in farmland between 1996 and 2006. This
may not be unconnected with change from farming to white collar jobs as a result creation of Delta
State with Asaba the capital with 13%. Subsequently, built-upland increased by 10% whiles both
forestland and waterbody decreased by 8% and 16% respectively.Many projects attracted a lot of
people to the area thus contributing to the physical expansion of the city as evident in the increased
land consumption rate from 0.00 is 5 to 0.02 and land absorption coefficient by 0.09 between 1996
and 2006. Many of these projects include the building of the Ministries and government house,
Niger Bridge, Delta State University (Asaba campus) amon others which l encouraged emigrants
into the city.
The period between 2006 and 2015 witnessed a drop in the rate of farmland activities in the city
as against 1996 - 2006. For instance, the farmland decreased by 1% as against the 3% increase
between 1996 and 2006. This is also evident in the observed drop in the land absorption co-
British Journal of Environmental Sciences
Vol.3, No.3, pp.42-61, August 2015
Published by European Centre for Research Training and Development UK (www.eajournals.org)
58 ISSN 2055-0219(Print), ISSN 2055-0227(online)
efficient from 0.09 between 1996 and 2006. Indeed the austerity measure known as (SAP)
introduced in the country at this period to restore the country’s economy, could be a major factor
at this period. Also, there was a general increase of 2% in farmland which is evident in the 8%
reduction of wasteland and 3% reduction of forest land. This may be as a result of non interest in
farming and the excitement of governance which attracted many people from farming to white
collar jobs.
FINDING, IMPLICATION AND RECOMMENDATION
There is anticipated crowdedness in Asaba come 2020. This situation will have negative
implications in the area because of the associated problems of related crime and spread of diseases.
It is therefore suggested that encouragement to build towards the outskirts through provision of
incentives and reduce rforces of attraction at the city centre in these areas.Indeed, between the
period of 1996 and 2015, there has been a reduction in the spatial expansion of Asaba compared
witht the period between 1996 and 2006. There is a possibility of continual reduction in this area
over the next 14yrs. This may suggest that the city has reduced in major functions that attracted
emigrants into the area. Indeed, there have been many defunct industries within this period. It is
therefore suggested here that government should encourage both local and foreign investors and
more importantly revived the defunct industries.
After the initial reduction in farmland between 1996 and 2006, the city witnessed steady growth
in this class and indeed continue with this trend in 2006-2015. For this projection to be realistic, a
deliberate attempt should be made by the state government to achieve this since as it will lead to
food security and more importantly a source of revenue to the state.Wasteland seems to be reducing
between 1996 and 2006 and between 2006 and 2015 signifying a desirable change. Forest land
steady reduced between 1996 and 2006 and indeed the trend in 2006-/2015. This good for the state
and indeed the nation if the moderate reduction in forest land observed in between 1995 and 2006
is a projected to 2030 is upheld. Land consumption rate which is a measure of compactness indicate
a progressive spatial expansion of the city was high in 1996-2006 and between 2006 - 2015 and
this is the case before 2030.
Land absorption coefficient a measure of consumption of new urban land by unit increase in urban
population. This was high between 1996 - 2006, and between 2006 - 2015. It suggests that the rate
at which new lands are acquired for development is low. This I sthe trend in 2006-2015 as there
seems to be concentration of development toward the outskirts. This may be as a result of people
desiring to move away from the centre of activities to the outskirts of the city because of high
crime rate
SUMMARY AND CONCLUSION
This research work demonstrates the ability of GIS and remote sensing in capturing spatial-
temporal data. Attempt was made to capture as accurate as possible five land use/land cover classes
as they change through time. Five classes were distinctly identified for each study year but more
emphasis is placed on built-up land as it is a combination of anthropogenic activities that make up
British Journal of Environmental Sciences
Vol.3, No.3, pp.42-61, August 2015
Published by European Centre for Research Training and Development UK (www.eajournals.org)
59 ISSN 2055-0219(Print), ISSN 2055-0227(online)
this class; and it is one that affects the other classes. In achieving this, land consumption and land
Absorption coefficient were introduced into the research work. An attempt was also made at
generating a formula for estimating population growth using the recommended national population
commission of 3% growth rate.However, the result of the work shows a rapid growth in built-up
land between 1996-2006 and 2006-2015.
REFERENCE
Adeniyi, P. D. (1978). A remote sensing Approach to the monitoring of urban growth (with
particular references to Lagos, Nigeria). An unpublished Ph.D Thesis presented to
university of Waterloo, Ontario Canada.
Adeniyi, P.O (1980). Land use change analysis using sequential aerial photography and computer
techniques". Photogrammetric x. Engineering and remote sensing Vol. 46(11), pp 1447-1464.
Adeniyi, P.O. & Omojola, O. (1990). Landuse / land cover change evaluation in Sokoto - Rima
Basin of N.W. Nigeria Based on Archival Remote Sensing and GIS-Techniques In
Geoinformation Technology Applications for Resource and environmental Management in
Africa Adeniyi P.O.(ed.) African Association of remote sensing of the environment
Pp. 143 - 158.
Adeoye, A. A (1998). Geographic / Land information system. Lagos. Published by ISBN, No. 978-
34540-05, Lagos Nigeria
Alakpodia,I.J. (2000). Soil characteristics under gas flares in the Niger Delta, Nigeria. In
Olurunfemi, J, F(ed.) Geo. Studies Forum. An international jour. of environmental and
policy issues, publ. by Dept. of Geog., University of Ilorin, vol. 1, no. 1 & 2, pp. 2-3.
Arvind C. pandy and M.S Nathaweth 2006. Land use land cover mapping through digital image
processing of satellite data – case study from Panchkula, Ambala and Yamunanagar District,
Haryana state, India.
Anderson, et al 1976. A land use land covers classification system for use with remote sensor data.
Geological printing office, Washington, D.C p.28
Badwen, M.G. (967). Applications of aerial photography in land system mapping photpgrammetric
Record, Vol. 5(30), pp. 461-473.
Christaller, (1933), central place theory- Wilkipedia free Enclopedia
Coppin, P. & Bauer, M. 1996. Digital change detection in forest ecosystems with remote sensing
imagery. Remote sensing review. Vol. 13.p. 207-234
Daniel, et al, 2002 A comparison of land use and landcover change detection methods. ASPRS-
ACSM Annual conference and FIG XXII congress pp2
Dale, P.F & McLaughlin J. (1998). Land information management:Introduction with special
reference to cadastral problems in third world countries. Oxford University press, Wanton,
Oxford pp. 1-16.
Delta State Nigeria, (1997). Delta state diary, governments press Asaba pp23.
Dimyati et al, (1995) an analysis of land use / land cover change using the combination of MSS
landsat and land use map- a case study of Yogyakarta, Indonesia, international journal of
remote sensing 17 (5): 931-944
British Journal of Environmental Sciences
Vol.3, No.3, pp.42-61, August 2015
Published by European Centre for Research Training and Development UK (www.eajournals.org)
60 ISSN 2055-0219(Print), ISSN 2055-0227(online)
El Shazty, E.M. et al (1976). Regional prospecting for iron ore in Bahariya Oasis El, Jaiyum Area,
Egypt, using LANd
SAT Satellite images. Cairo Remote sensing center academy of scientific research and technology,
Ejemeyovwi, D.O. (2009). Land use/and cover mapping and land use pattern in abraka. A paper
published by journal of Env. Science, International Research and Development Institute,
Uyo, Akwa Ibom, Nigeria., vol.5, no. 3, pp. 14-23.
ERDAS, inc. 1992. ERDAS production service map state for Georgia DNR in the monitor Vol. 4,
No 1, Erdas, Inc Atlanta, GA
EOSAT 1992, landsat TM classification international Georgia wetlands in EOSAT data user notes
vol. 7, No1, EOSAT company, Lanham , MD.
EOSAT 1994, EOSAT,s statewide purchase plan south caroline residents in the know, in EOSAT
notes, vol 9, No 1, EOSAT company lanham, MD.
ERDAS field guide. 1999. Earth resources data analysis system. ERDAS Inc. Atlanta, Georgia.
P.628.
Fizpatric – line et al (1987). Producing alaska interim land cover maps from lansat digital and
ancillary data. In processing of the 11th Annual William T. Pecora Memorial symposium:
satellite land rempre sensing: current programs and a look into the future American society
of photogrammetric and remote sensing, Pp. 339- 347.
Ikhuoria, I.A. (1999). An analysis of urban growth regime and land use characteristic of an Africa
city using spot- Satellite data. Geometries and international journal, vol. 55, no. 3.
Idirisi 32 guide GIS and image processing volume 1, release 2. Pp. 17
James, R. A., Ernest, E. H., John, T. R, & Richard E. W (2009). A land use and land cover
classification system for use with remote sensor data. A revision of the land use
classification system as presented in U.S. Geological Survey circular 671.
Geological Survey Professional Paper 964. 58p. Macleod & congalton 1998. A quantitative
comparison of change detection Algorithms for monitoring Eelgrass from remotely sensed
data Photometric engineering & remote sensing vol. 64 No 3. P. 207-216.
Meyer, W.B 1995. Past and present land use and land – cover in the USA consequences p 24-33
Moshen A, (1999). Environmental land use change detection and assessment using with multi –
temporal satellite imagery. Zanjan University.
Olaniran, J.O (2002) rainfall Anomalies in Nigeria: the Contemporary 55th Inaugural lecture
university press IIlorin.
Olorunfemi J.F (1983) monitoring urban – use in developed countries – an aerial photographic
environmental int 9,27-32
Onokorhoraye, A.G (1985), an outline of human geography and planning series of study.
University of Benin, Benin City, pg 99-104
Oyegun R.O (1985), “the use and waste of water in a third world city” Geojournal, Reidel
publishing company, 10.2, 205- 210
Reibsame, W.E, Mayer, W.B,. and Turner, B.L.II. 1994. Modeling land use and cover as part of
global environmental change. Climate change vol. 45.
Shoshany, M, et al (1994). Monitoring temporal vegetation cover changes Mediterranean and Arid
Ecosystems using a remote sensing technique: case study of the Judean
Mountain and the Judean desert, journal of Arid environmental, 33;9-21.
British Journal of Environmental Sciences
Vol.3, No.3, pp.42-61, August 2015
Published by European Centre for Research Training and Development UK (www.eajournals.org)
61 ISSN 2055-0219(Print), ISSN 2055-0227(online)
Singh, A (1989).. Digital change detection techniques using remotely sensed data. International
journal of remote sensing. Vol 10. 6,p, 989-1003.
US. Geological survey, 1999. The lansat system link USGS on te world wide web. URL: http//
landsat7. Usgs. Gov/landsat_sat.html.11/10/99.
Wilkie, D.S and Finn, J.T 1996. Remote sensing imagery for natural resources monitoring.
Columbia University press New York p. 295.
Xiamei Y and Ronqing L.Q Y, (1999). Change detection based on remote sensing information
model and its application to coastal line of yellow river Delta – earth observation center,
NASDA, china.
Yeates, M and Garner, B (1976) the North American city, Harper and row pub New york.
Zubair, A. O. (2006). Change detection in land use and land cover using remote sensing data
and GIS (a case study of Ilorin and its environs in Kwara State. An MSc project
submitted to the department of geography University of Ibadan. Using geographical
information systems unpublished. 44P..