changes in buoyancy and chemical composition during growth ... · changes in buoyancy and chemical...
TRANSCRIPT

Vol. 128: 77-90,1995 MARINE ECOLOGY PROGRESS SERIES Mar Ecol Prog Ser
Published November 23
Changes in buoyancy and chemical composition during growth of a coastal marine diatom:
ecological and biogeochemical consequences
Tammi L. Richardsonlv*, John J. ~ u l l e n ' , ~
'Department of Oceanography, Dalhousie University, Halifax, Nova Scotia. Canada B3H 451 2Bigelow Laboratory for Ocean Sciences, McKown Point. West Boothbay Harbor. Maine 04575, USA
ABSTRACT Growth and sinklng of the coastal manne diatom Thalassiosira weissflogii was studled dunng experiments in a 2 1 m tall water column Under nutnent-replete conditions, T weissflogii grew rapidly in the upper layer of the tank and cells exhibited nearly neutral buoyancy Cells sank however, after depletion of ambient nitrate The growth and sinking of cells were well described by a simple model with nitrate-dependent growth and sinking terms The best fit was obtained by describing the sinking response with a slgmoid functlon ~ v h e r e the time scale for increased sinking was 25 h after nitrate depletion Smaller-scale batch culture experiments showed changes that were consistent wlth increased slnking upon depletion of nitrate carbohydrate per m1 of culture increased 2- to 5-fold over 3 5 d , while protein per m1 did not change signif~cantly After re-introduction of nitrate into the medium carbohydrate protein ratios reverted to their onginal values Calculations show that intracel- lular density and cell sinking rate should change substantially due to fluctuations in carbohydrate and that increased ballast of carbohydrate was sufficient to cause the slnking observed in the tank Changes in the buoyancy of small (15 pm) diatoms such as T weissflogii In response to changes in nutr~ent status have important ecological and biogeochemical implications Nutrient-dependent changes in sinking rates can result in ~ncreased residence time of cells in the mixed layer of the ocean, and In enhanced transport of deep nutnents to the euphotic zone uncoupled from inputs of inorganic carbon
KEY WORDS: Buoyancy . Chemical composition . Thalassiosira . Sinking . Carbohydrate . Proteln
INTRODUCTION
Suspension and sinking of marine phytoplankton have received considerable attention in recent years due to increased interest in the flux of organic material to the deep sea (Michaels & Silver 1988, Jahnke 1990). Since an organism's vertical position in the water column will ultimately determine its overall primary productivity and growth, an understanding of mecha- nisms of suspension and sinking is critical to accurate descriptions of marine ecosystems (Smayda 1970, Walsby & Reynolds 1980).
Stokes' law is usually used to describe the sinking rate of phytoplankton cells (Smayda 1970, Vogel 1981, Oliver 1994):
2 gr2(p - p') v = 9 P%
where V is the sinking rate of the cell (m S-') (positive in the downwards direction), g is acceleration due to gravity (m s - ~ ) , r is cell radius (m), p is intracellular density (kg m-3), p ' i s the density of sea water (kg m-3), p is the dynamic viscosity of sea water (kg m-' S-') and I$, is a dimensionless coefficient of form resistance, which is the ratio of the velocity of an equivalent sphere to that of cells of similar density and volume (Heaney & Butterwick 1985). The (p -p ' ) term is known as excess density.
Motile phytoplankton are capable of directed swim- ming and can control their position in the water col- umn (e.g. Cullen 1985), while the vertical position of non-motile phytoplankton is determined by interac- tions between the buoyancy of a cell and its physical
O lnter-Research 1995 Resale of full article not permitted

Mar Ecol Prog Ser 128: 77-90, 1995
environment (Smayda 1970). Cell buoyancy is affected by changes in excess density. Physiological changes in excess density may include changes in internal ion concentration (Gross & Zeuthen 1948, Beklemishev et al. 1961, Anderson & Sweeney 1977, 1978, Kahn & Swift 1978), internal carbohydrate concentration (Vil- lareal & Carpenter 1990, Romans et al. 1994), or the production of gas vesicles, an adaptation found in many species of freshwater and marine blue-green algae (Walsby 1978, also reviewed by Oliver 1994). The most comprehensive studies of changes in excess density have concerned the buoyancy of blue-green algae, where overall buoyancy conferred by gas vesi- cles can be modified by changes in cellular carbohy- drate (e.g. van Rijn & Shilo 1985, Walsby et al. 1989, Ibelings et al. 1991, Romans et al. 1994).
Physiological changes in buoyancy may be indepen- dent of changes in density of surrounding sea water (Bienfang & Szyper 1982) and of any morphological adaptations to suspension (Smayda & Boleyn 1966a, b), though some morphological adaptations (like the pro- duction of chitin fibres by Thalassiosira weissflogii; see Walsby & Xypolyta 1977) may contribute to an in- crease in the coefficient of form resistance which will slow the sinking speed of the cell. Cell buoyancy may depend on the light and nutrient status of the organism (Steele & Yentsch 1960, Bienfang et al. 1982, 1983, Bienfang & Harrison 1984, Granata 1987, Waite et al. 1992a, b) and may require significant inputs of meta- bolic energy (Waite et al. 1 9 9 2 ~ ) .
Buoyancy changes give phytoplankton distinct eco- logical advantages. For example, it can be advanta- geous for cells to have low excess density so they will remain suspended in the illuminated waters of the euphotic zone. Often, however, nutrient levels in illu- minated waters do not become significant until well below the euphotic zone (e.g. Hayward 1991). Thus, buoyancy changes that cause cells to sink to deeper layers to obtain nutrients are also of great benefit. Sinking of cells following d~atom blooms is thought to be a survival strategy whereby cells become 'resting stages' in dark, cold water and are then ready to seed a new population when conditions are right (Smetacek 1985).
Changes in buoyancy may also cause cell sinking rates to slow and often result in accumulation of cells in subsurface maxima near nutrient gradients (Steele &
Yentsch 1960, Heaney et al. 1989). Lande & Wood (1987) calculated residence times of cells in the surface mixed layer and nutricline of a 2-layer model of the upper ocean. Cells whose sinking rates slowed to 1 m d- ' at the top of the nutricline (from 4 m d- ' in the mixed layer) were shown to spend a substantially longer time in the mixed layer than cells with sinking rates that did not change, because the more slowly
sinking cells had greater probability of being mixed back up to the surface. Prolonged cycles of sinking and resuspension meant that cells were 'shuttled' between nutrient-rich (deeper) waters and higher irradiance surface layers (Lande & Wood 1987).
In this study, we focus on the buoyancy of a relatively small coastal marine diatom and on the connection between cell buoyancy, nutrient status, and cellular chemical composition. Experiments performed in a 2.1 m tall laboratory water column showed that a pop- ulation of nutrient-replete Thalassiosira weissflogii was almost neutrally buoyant, but once nutrients ran out the nearly neutral buoyancy was lost. To determine the mechanism of sinking, we examined changes that occur in carbohydrate and protein during nutrient depletion and how changes in these constituents may affect cell sinking rates. Results are discussed in terms of the ecological advantages of buoyancy changes, both with respect to increased sinking rates upon nutrient depletion and decreased sinking rates when nutrient-replete. Finally, we discuss the potential bio- geochemical consequences of buoyancy changes as a result of unbalanced growth.
METHODS
Tank experiments. Unialgal cultures of the marine diatom Thalassiosira weissflogii (Provasoli-Guillard Center for Culture of Marine Phytoplankton strain no. 1336) were grown in 10 1 polycarbonate carboys which contained 8 1 of sterile-filtered artificial sea water (ASW)-based f/2 medium (Guillard 1972) with nitrate concentration adjusted to 440 pM. Sterile filtra- tion was done using a 0.2 pm Culture Capsule filter (Gelman Sciences, Ann Arbor, MI, USA). Cells were grown at 20°C, on a 16 h light:8 h dark cycle. Illumi- nation was from 7 Vita-Lite fluorescent lamps provid- ing a quantum scalar irradiance of 150 1.lmol m-2 S-' (photosynthetically active radiation, PAR) as measured by a Biospherical Instruments QSL-100 4n sensor placed just outside the culture containers.
Experiments were conducted in a 2.1 m tall, 0.29 m inner diameter (;.d.) opaque polyvinylchloride cylinder (Fig. 1; see Cullen & Horrigan 1981, Heaney & Eppley 1981). The bottom of the tank was surrounded by a barrel through which 9°C water was circulated to pro- duce temperature stratification. The top portion of the tank was wrapped with an insulating blanket to con- serve heat and to maintain a stable temperature gradi- ent. Illumination was provided from above on a 12 h light: l 2 h dark cycle (lights on from 08:OO to 20:OO h) using a 250 W metal halide Grow Lamp (Applied Hydroponics, Inc., San Rafael, CA, USA) shining through a running-water heat filter made of clear

Richardson & Cullen: Growth and s~nk ing of a coastal dlatom 79
H Lamp
4-E Heat trap
Fig. 1. Schematic of tank experiment apparatus. See 'Meth- ods' for details
acrylic. Irradiance just below the surface water of the tank was approximately 150 pm01 m-2 S - ' PAR as measured with a QSL-100 submersible sensor. Room temperature averaged 20°C, though variations (+3"C) occurred due to heating by the lamp during the day and cooling of the ambient air at night; variations in water temperature were minimized by the insulating blanket.
The tank was filled with l00 1 of sterile-filtered ASW- based f/2 medium without nitrate and was inoculated with the 8 l culture of exponential phase Thalassiosira weissflogii described above. Nearly uniform vertical distribution of the culture was achieved by pumping the inoculum of T weissflogii into the tank using a Masterflex peristaltic pump with 5 mm 1.d. silicone tubing, while simultaneously mixing the tank by pulling the tube up and down. This resulted in an ini- tial chlorophyll concentration of approximately 7 mg m-3, an initial nitrate concentration of 30 PM, and an initial temperature of 20°C. Once these conditions were established, the 9°C water was circulated through the barrel surrounding the bottom of the tank, and a sharp thermocline at about 150 cm depth was established within 12 h of inoculation. This thermo- cline remained nearly constant for the duration of the experiment (Fig. 2A). Cells were allowed to adjust to tank conditions for approximately 4 d , after which rou- tine sampling began.
Vertical profiles were conducted using a double- tube profihng system much like that described by Cullen & Horngan (1981) (refer to Fig. 1). Weighted sil- icone tubing (i.d. 1.6 mm) was lowered into the tank. One end of the tube ran from the tank, through a Mas- terflex peristaltic pump (flow rate approx. 30 m1 min-') to the micro-flow-through cell of a Turner Designs Model 10-005R fluorometer. A return-flow tube carried
this water to the depth from which it came, with little disruption of temperature stratification in the water column. Daily monitoring of 3(3,4-dichloropheny1)-1, l-dimethylurea (DCMU)-induced fluorescence ratios (Roy & Legendre 1979, Vincent 1980) indicated no deleterious effects of pumping to photosynthetic capacity of cells. A thermistor was attached near the intake tube which gave vertical profiles of tempera- ture. Using this double-tube system, profiles of fluores- cence and temperature were performed at depth inter- vals of 20 cm. Vertical profiles were done for 20 d , 6 times daily (at 01:00, 07:30, 11:00, 14:00, 17:00, and 20:OO h). Sampling times included one point at the end of the dark period (the 07:30 h profile) and one point at the end of the light period (20:OO h).
Samples for cell counts, chlorophyll, and nitrate con- centration were removed from a T-connector in the return flow tube at 3 to 5 depths per profile. Depths chosen for sampling depended upon observed vertical distributions of fluorescence. Chlorophyll concentra- tions were determined by fluorescence after at least 24 h extraction in 90% acetone in the dark at -lO°C (Strickland & Parsons 1972). Nitrate concentrations
Temperature ("C)
0 5 1 0 1 5 2 0 2 5 0 ~ " " I " " l " " l " " , ' . " ,
Irradiance (pmol m" S- ' )
0 30 60 90 120 150
Fig. 2. (A) Temperature profiles at 3 time points during the tank experiment: Day 1 (e), Day 4 (o), and Day 10 (X]. (B) Irra- diance profiles measured with distilled water in the tank (no cells) (*, with exponential curve fit as solid line) and modeled curves for Day 5 (- - -) and Day 10 (. - . -) of the experiment
(see 'Methods' for details)
Mar Ecol Prog Ser 128: 77-90, 1995
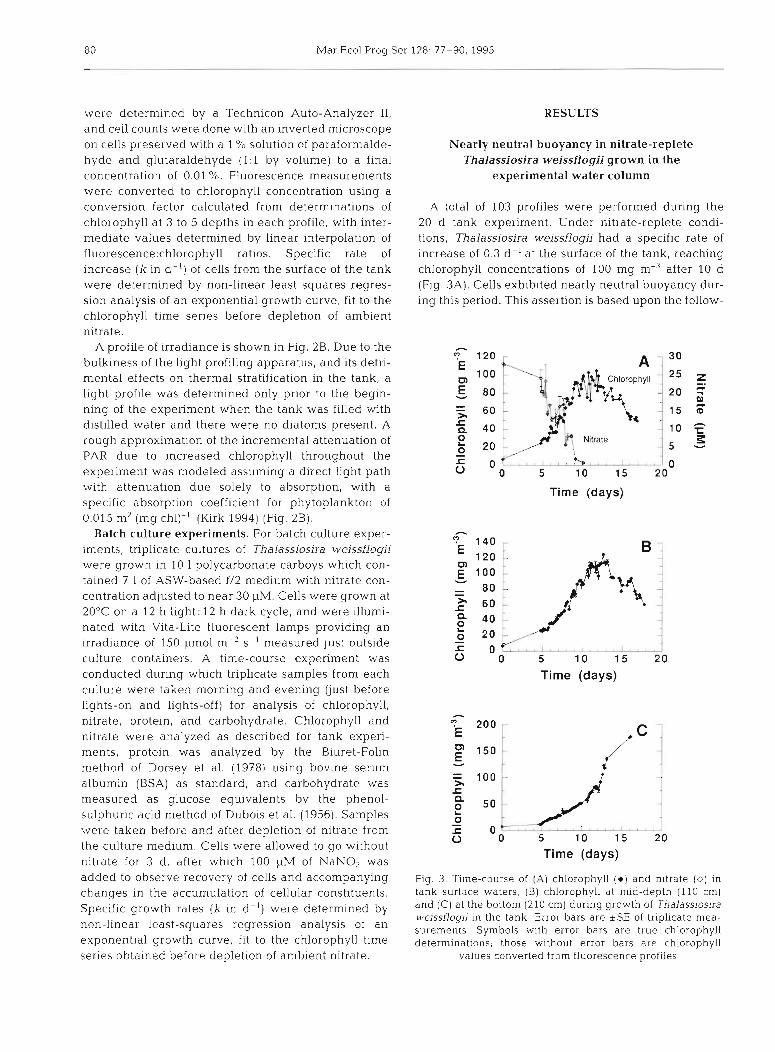
were determined by a Technicon Auto-Analyzer 11, and cell counts were done with an inverted microscope on cells preserved with a 1 % solution of paraformalde- hyde and glutaraldehyde (1:l by volume) to a final concentration of 0.01 %. Fluorescence measurements were converted to chlorophyll concentration using a conversion factor calculated from determinations of chlorophyll at 3 to 5 depths in each profile, with inter- mediate values determined by linear interpolation of fluorescence:chlorophyll ratios. Specific rate of increase ( k i n d- ') of cells from the surface of the tank were determined by non-linear least squares regres- sion analysis of an exponential growth curve, fit to the chlorophyll time series before depletion of ambient nitrate.
A profile of irradiance is shown in Fig. 2B. Due to the bulkiness of the light profiling apparatus, and its detri- mental effects on thermal stratification in the tank, a light profile was determined only prior to the begin- ning of the experiment when the tank was filled with distilled water and there were no diatoms present. A rough approximation of the incremental attenuation of PAR due to increased chlorophyll throughout the experiment was modeled assuming a direct light path with attenuation due solely to absorption, with a specific absorption coefficient for phytoplankton of 0.015 m2 (mg ch1)-' (Kirk 1994) (Fig. 2B).
Batch culture experiments. For batch culture exper- iments, triplicate cultures of Thalassiosira weissflogii were grown in 10 1 polycarbonate carboys which con- tained 7 1 of ASW-based f/2 medium with nitrate con- centration adjusted to near 30 yM. Cells were grown at 20°C on a 12 h light: 12 h dark cycle, and were illumi- nated with Vita-Lite fluorescent lamps providing an irradiance of 150 pm01 m-' S-' measured just outside culture containers. A time-course experiment was conducted during which triplicate samples from each culture were taken morning and evening (just before lights-on and lights-off) for analysis of chlorophyll, nitrate, protein, and carbohydrate. Chlorophyll and nitrate were analyzed as described for tank experi- ments, protein was analyzed by the Biuret-Folin method of Dorsey et al. (1978) using bovine serum albumin (BSA) as standard, and carbohydrate was measured as glucose equivalents by the phenol- sulphuric acid method of Dubois et al. (1956). Samples were taken before and after depletion of nitrate from th.e culture medium. Cells were allowed to go without nitrate for 3 d, after which 100 pM of NaN03 was added to observe recovery of cells and accompanying changes in the accumulation of cellular constituents. Specific growth rates (k in d-l) were determined by non-linear least-squares regression analysis of an exponential growth curve, fit to the chlorophyll time series obtained before depletion of ambient nitrate.
RESULTS
Nearly neutral buoyancy in nitrate-replete Thalassiosira weissflogii grown in the
experimental water column
A total of 103 profiles were performed during the 20 d tank experiment. Under nitrate-replete condi- tions, Thalassiosira weissflogii had a specific rate of increase of 0.3 d-l at the surface of the tank, reaching chlorophyll concentrations of 100 mg m-3 after 10 d (Fig. 3A). Cells exhibited nearly neutral buoyancy dur- ing this period. This assertion is based upon the follow-
Time (days)
Time (days)
Time (days)
Fig. 3. Time-course of (A) chlorophyll (e) and n~trate (0) in tank surtace waters, (B) chlorophyll at mid-depth (110 cm) and (C) at the bottom (210 cm) during growth of Thalass~osira weissflogii in the tank. Error bars are *SE of triplicate mea- surements Symbols with error bars are true chl.orophyll determinatlons; those without error bars are chlorophyll
values converted from fluorescence profiles

Richardson & Cullen: Growth and slnking of a coastal diatom 81
Chlorophyll (mg m'3) 0 20 40 60 80 100
O-
Chlorophyll (mg m'=)
0 50 100 150 200
O-
Chlorophyll (mg m-3)
0 50 100 150 200
Fig. 4. Representative chlorophyll profiles done at 20:OO h daily during the tank experiment. (A) Profiles on Day 1 (initial), 6, 7, 8, and 9 (in order, left to right). (B) Days 15 ( W ) , 17 (O), and 18 ( A ) . (C) Days 19 ( X ) , 21 ( A ) , and 22 (+). Error bars are *SE of triplicate measurements Symbols with error bars are true chlorophyll determinations; those without error bars are chlorophyll values
converted from fluorescence profiles
ing observations: (1) growth rates of cells at the surface surface waters. Cell count data and surface chlorophyll of the tank were the same as cells in batch cultures data (Fig. 3A) showed that cells did not sink immedi- under similar conditions (0.3 d- ' , discussed below), ately upon depletion of nitrate from the medium. Qual- indicating that significant numbers of cells were not itative examination of chlorophyll data shows a time lost to sinking, (2) chlorophyll yield was as predicted lag of approximately 48 h; a slightly longer lag (60 h) is for an initial nitrate concentration of 30 I-IM (using a indicated by cell count data. The difference is consis- nitrate:chlorophyll relationship of 0.3 pm01 pg- ' estab- tent with a change in chlorophyll per cell after deple- lished during batch culture work), and (3) there was no tion of nitrate from culture medium (Fig. 5). noticeable accumulation of cells at the bottom of the A die1 series of profiles taken between 01:OO and tank (210 cm) until after nitrate was depleted from 20:OO h on a typical day before nitrate depletion shows upper layers (see Figs. 3A to C & 4) . rapid accumulation of chlorophyll between 11:OO and
Chlorophyll profiles done at 20:OO h each day (Fig. 4 ) 14:00 h with profiles keeping their characteristic shape show increases near the surface with minimal accumu- throughout the day (Fig. 6). lation at depth until after Day 10, at which time the profile changed dramatically showing accumulation at mid-depth (Fig. 4B), then deep in the tank (Fig. 4C). Cell counts (Fig. 5) confirm that cells disappeared from
Chlorophyll (mg m-3)
0 1 0 20 30 40 50 60
0
- 0.01 50
0 - 0.00s g E
0 3 W
Y 100 - 0.006 = 5
I U n
0) aJ
a l0000 0.004 ' 0 o 150
E, Z ' 5000 0)
0 2 0 0
0 5 10 15 20
m ~ u ~ n ~ 9 ~ # , ~ ~
-
-
-
: 01:oo
Time (days) Fig. 6. Dlel series of chlorophyll profiles done on a represen-
Fig. 5. time-course of cell counts (e) and chlorophyll per cell tative day (Day 8) before depletion of nitrate from surface (0 ) of Thalasslosjra weissflog~i taken from surface water of the waters of the tank. Proflles were done at 01:OO (U), 07:30 (*), experimental tank. Error bars are +SE of triplicate measure- 11:OO (A) , 14:OO (v ) , 17:00 (o), and 19:30 h (X). The 07:30 pro- ments. Arrow indicates time at which nitrate was de- file is just before lights-on; 19:30 is just before lights-off.
pleted from surface waters Error bars are +SE of triplicate measurements
Mar Ecol Prog Ser 128: 77-90,1995
0 2 4 6 8 1 0 1 2
Time (days)
4 6 B 1 0 1 2 Time (days)
0 2 4 6 8 1 0 1 2
Time (days) 0 2 4 6 8 1 0 1 2
Time (days)
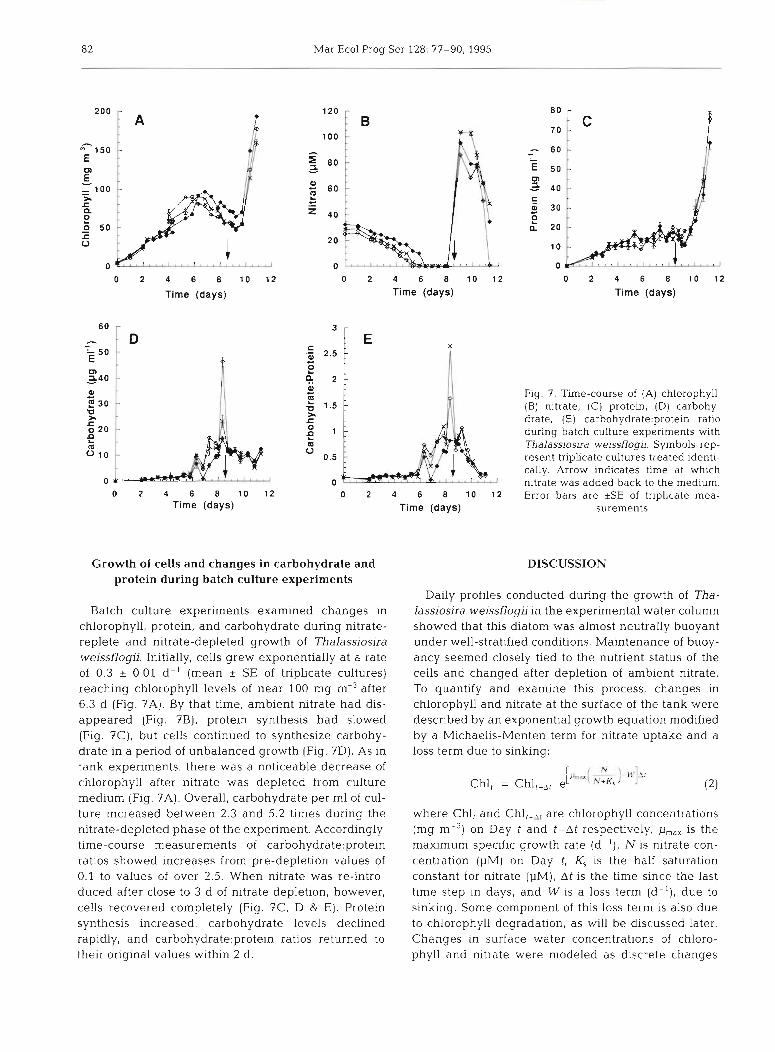
Q - Fig. 7. Time-course of (A) chlorophyll, $ 1.5 (B) nitrate, (C) protein, (D) carbohy- r c drate, (E) carbohydrate:protein ratio 0 e during batch culture experiments with m 0
Thalassiosira weissflogii. Symbols rep- 0.5 resent triplicate cultures treated identi-
cally. Arrow ~ndicates time at which 0 nitrate was added back to the medium.
0 2 4 6 8 10 1 2 Error bars are *SE of triplicate mea- Time (days) surements
Growth of cells and changes in carbohydrate and protein during batch culture experiments
Batch culture experiments examined changes in chlorophyll, protein, and carbohydrate during nitrate- replete and nitrate-depleted growth of Thalassiosira weissflogii. Initially, cells grew exponentially at a rate of 0.3 & 0.01 d- ' (mean * SE of triplicate cultures) reaching chlorophyll levels of near 100 mg m-3 after 6.3 d (Fig. ?A). By that time, ambient nitrate had dis- appeared (Fig. ?B), protein synthesis had slowed (Fig. 7C), but cells continued to synthesize carbohy- drate in a period of unbalanced growth (Fig. 7D). As in tank experiments, there was a noticeable decrease of chlorophyll after nitrate was depleted from culture medium (Fig. 7A). Overall, carbohydrate per m1 of cul- ture increased between 2.3 and 5.2 times during the nitrate-depleted phase of the expenment. Accordingly, time-course measurements of carb0hydrate:protein ratios showed increases from pre-depletion values of 0.1 to values of over 2.5. When nitrate was re-intro- duced after close to 3 d of nitrate depletion, however, cells recovered completely (Fig. 7C, D & E) . Protein synthesis increased, carbohydrate levels declined rapidly, and carb0hydrate:protein ratios returned to their original values within 2 d.
DISCUSSION
Daily profiles conducted during the growth of Tha- lassiosira weissflogii in the experimental water column showed that this diatom was almost neutrally buoyant under well-stratified conditions. Maintenance of buoy- ancy seemed closely tied to the nutrient status of the cells and changed after depletion of ambient nitrate. To quantify and examine this process, changes in chlorophyll and nitrate at the surface of the tank were described by an exponential growth equation modified by a Michaelis-Menten term for nitrate uptake and a loss term due to sinking:
rhax(-?' . \ - l Chl, = Ch1,-,, el N+Ks'
where Chl, and Ch1,-,, are chlorophyll concentrations (mg m-3) on Day t and t -At respectively, p,,, is the maximum speclfic growth rate (d-l) , N is nltrate con- centration (PM) on Day t, K, is the half saturation constant for nitrate (PM), At is the time since the last time step in days, and W is a loss term (d-l), due to sinhng. Some component of this loss term is also due to chlorophyll degradation, as will be discussed later. Changes in surface water concentrations of chloro- phyll and nitrate were modeled as discrete changes

Richardson & Cullen: Growth and sinking of a coastal diatom
from an initial chlorophyll concentration of 7 n ~ g m-3, an initial nitrate concentration of 30 pM (initial values during the tank experiment), and a nitrate:chloro- phyll ratio of 0.3 pm01 pg-'. Generally, W was mod- eled as:
where W , is the maximum specific loss rate (d- l ) , t is time in days, td is the time of nitrate depletion (d), and T, is a time scale for increased sinking (d). This formu- lation varies W 100-fold, from 1 to 100 % of the maxi- mum specific loss rate, W,, with a sigmoid function con- sistent with changes in chemical composition during unbalanced growth (Cullen & Lewis 1988); cells reach 10% of W, at approximately 2.5 T,.
Parameters for Eqs. (2) & (3) were estimated by a least-squares non-linear curve fitting routine in Systat, version 5.2. The optimal combination of parameters was determined using a grid search method on a spreadsheet, where the aim was to minimize the sum of the squared deviations of the modeled vs measured chlorophyll.
0 5 10 15 20
Time (days)
5 1 0 15 2 0
Time (days)
Four possible time-courses were modeled by varying the form of W, the loss term. Chlorophyll and nitrate distributions were modeled for the case where there was no sinking of cells upon nitrate depletion, that is, if W was set to zero through the entire time series (Fig. 8A), and for the case where Wremained constant with time and was set to W,, the value of which was determined by the grid search method (Fig. 8B). Tank experiment data showed that sinking losses were not detectable before depletion of ambient nitrate. There- fore, modeled distributions shown in Fig. 8C & D have sinking initiated after nitrate depletion. Chlorophyll and nitrate distributions are shown if sinking of cells occurred immediately after ambient nitrate depletion (Fig. 8C). In this case, T, was set to the arbitrary low value of 0.0001 d. Finally, distributions are shown for the case where sinking of cells starts slowly after nitrate depletion, then accelerates (following a sigmoid function) to the maximum specific sinking rate (Fig. 8D). This was the best-fit equation as determined by F-ratio test (Moore & McCabe 1993) (see Table 1). According to this chlorophyll-based model equation, the time scale for increased sinking after depletion of
0 5 10 15 2 0 Time (days)
5 1 0 15 20
Time (days)
Fig. 8. Fits of model equations (-) to observed chlorophyll (a) and nitrate (0) data. (A) Fit of model equation with nitrate- dependent growth of cells but no sinking of biomass. (B) Fit of model equation with constant sinlung rate. (C) Fit of model equation with no delay between depletion of ambient nitrate and initiation of sinking. (D) Fit of model equation with nitrate- dependent growth and nitrate-dependent sinking where cells reach 50% of their maximal sinking rate 115 h after depletion of
ambient nitrate

Mar Ecol Prog Ser 128: 77-90, 1995
Table 1. F-ratio comparison of f ~ t s of 4 versions of Eq. (2) to observed surface chlorophyll distnbutlons during growth of Thalas- sjosira weissflogii in the experimental tank. The 4 versions of Eq. (2) are: Model A = no sinklng of blomass, Model B = constant sinking of biomass, Model C = immediate nitrate-dependent sinklng, Model D = nitrate-dependent, sigmoid-shaped sinking function. We compare only the fit of Model D to the fits of the other 3 models. Values for sum of the squared deviations of mod- eled chlorophyll from observed values (SS dev model,,,,) were determined by spreadsheet calculations. Degrees of freedom (df) are the number of parameters in each model. The F-statistic is determined according to the equation:
(SS dev model 1 -SS dev model 2) X (df model 2 - df model 1) F-statistic =
(SS dev model 2/No. of obs - df model 2)
where model 1 and model 2 are designated such that model 1 has the higher sum of squared deviations of the model from the observed data. F-ratio analysis shotvs that the fit of Model D is significantly better than the fits of the other 3 models at p = 0 001,
as the calculated F-statistics are all greater than the critlcal value of 56.18 (according to Table F, Moore & McCabe 1993)
Comparison SS dev modelob, d f No. of observations Calculated F-stat~stic Significant at p = 0.0017
Model D to Model A
Model D to Model B
Model D to Model C
Yes
Yes
Yes
ambient nitrate was 25 h (1.04 d). Thus, cells reach 10% of W, approximately 62 h after nitrate depletion. The model equation also gave a maximum specific growth rate (pmax) of 0.3 d- l , a KS value of 1.95 PM, and a maximum specific sinklng (loss) rate of 0.22 d - ' This loss rate corresponds to a sinking rate of 0.04 m d - ' over an arbitrary surface stratum of 20 cm.
An unknown component of the loss term (which we have considered due entirely to sinking) is due to the degradation of cellular chlorophyll upon nitrate deple- tion. Quantification of the degradation component is difficult. The use of chlorophyll data from batch culture experiments (which are not confounded by sinking losses) predicts a chlorophyll degradation rate of 0.14 d- l . If this rate is applied directly to the model immediately after nitrate depletion, it results in a gross overestimate of the actual loss of chlorophyll. In fact, it predicts that all the loss of chlorophyll from the surface of the tank could be from chlorophyll degradation. We know from cell count data, however, that cells were lost from the surface. This decline in cell numbers actu- ally represents a minimum estimate of sinking losses, because cell division continues after the depletion of ambient nitrate (Fig. 5) . The absence of a clearly de- fined relationship between cell numbers and nitrate disappearance precluded modeling cell numbers ver- sus time, so the exact contribution of sinking to losses from the tank must lie somewhere between the mini- mum estimation from cell count data (0.1 d - ' , accord- ing to a least-squares regression negative exponential curve fit) and the maximum specific loss rate of 0.22 d- ' determined by the model fit to chlorophyll data.
Neutral buoyancy and sinking upon nitrate depletion
Nutrient-replete Thalassiosira weissflogii exhibited nearly neutral buoyancy. There are at least 3 previous reports of neutral buoyancy in marine diatoms. In a similar experiment with a much larger tank, Strickland et al. (1969) observed neutral buoyancy during nitrate- replete growth of the relatively large [cell length approx. 40 pm) diatom Ditylum brightwellii, but they did not run the experiment to complete exhaustion of nutrients. Eppley et al. (1967) noticed neutral buoy- ancy in T. weissflogii under specific culture conditions, and though they suspected that a fraction of these cells were neutrally buoyant in nature, they did no further investigation of this buoyancy or of the effects of nutri- ent depletion on buoyancy. Takahashi & Bienfang (1983) found that natural populations of ultraplankton (size range < 3 pm) were neutrally buoyant, i.e. they had no measurable sinking rates. Both neutral and positive buoyancv have been reported for the large (>l00 pm) diatoms Rhizosolenia spp. and Elhmodiscus spp. (Villareal 1988, 1992).
Our observation of nearly neutral buoyancy in nitrate-replete Thalassiosira weissflogii was based upon the interpretation of chlorophyll profiles derived from in vivo fluorescence, which were then used as a proxy for biomass distribution. Though we recognize the inherent variability in fluorescence per chlorophyll and in chlorophyll per cell (as discussed above), cell counts done on surface samples agree with the pattern of biomass distribution inferred from chlorophyll pro- files, and we believe that these profiles are representa-

R~chardson & Cullen. Growth a n d s ~ n k i n g of a coastal d ~ a t o m 85
tive of changes in overall biomass distribution. How- ever, one clarification is necessary: the conversion from fluorescence profiles to chlorophyll profiles was done using 3 to 5 direct chlorophyll measurements as calibration points, while values between these points were determined by linear interpolation. There was not always a surface sample taken for each profile, so apparent decreases in chlorophyll near the surface (see Fig. 6, for example) may be artifacts of extrapolat- ing outside the range of measurements.
Thalassiosira weissflogii sank under nutrient- depleted conditions. It could be argued that sinking might have occurred a t some critical concentration of biomass even if cells were not depleted of nutrients (Jackson 1990); however, the timing of the sinking response was consistent with changes in chemical composition (discussed in the next section) and with results previously reported in the literature. Much attention has been paid to the effects of nutrient depletion on cell sinking rate, though results in the Lit- erature are often contradictory. Steele & Yentsch (1960) recognized early that nutrient status and cell buoyancy are closely related. Their expenments with Skeletonema costatum showed that sinking rates increased when nutrients were depleted from culture medium, but that sinking rates of nutrient depleted cells decreased considerably when cells were re- enriched and placed in the dark. Later work that mea- sured sinking rates of cells in relatively small columns (Bienfang 1981a) found that nitrate depletion caused either a decrease (Bienfang et al. 1982) or no signifi- cant change (Bienfang 1981b, Bienfang & Harrison 1984, Bienfang et al. 1986) in cell sinking rates, though sinking rate increases were seen in response to depletion of other nutrients like phosphate and sili- cate (e.g. Bienfang & Harrison 1984). More recent work on the dynamics of the sinking of spring blooms showed that termination and sinking of blooms occurred consistently at limiting nitrate concentra- tions (Waite et al. 1992a) and that Thalassiosira spe- cies were the most nutrient-sensitive, that is, their sinking rates increased most dramatically upon nitrate depletion (Waite et al. 1992b).
Some generalizations can be made between appar- ently contradictory evidence in the literature. Mea- surements which found no significant change in cell sinking rate with nltrate depletion were often done on natural populations which included a variety of phyto- plankton types (e.g. Bienfang 1981b, Bienfang & Har- rison 1984), and all phytoplankton do not necessarily respond to nitrate depletion in the same way. There seems to be at least genus-specific differences in sensi- tivity to nitrate exhaustion (Waite et al. 1992a, b) as well as variation in sinking rates due to the pre-condi- tioning nutrient history of the population (Bienfang
1981b) and growth phase (Bienfang 1981c), so it is not surprising that there could be no obvious overall changes in sinking rates due to nutrient depletion. Dif- ferent cells may react differently to nitrate depletion, but no change in the sinking rate of the population would be observed if sinking rates of mixed popula- tions are measured using bulk biomass (not taxon spe- cific) estimates such as total chlorophyll.
The early work of Steele & Yentsch (1960) involved expenments with a monospecific culture (as was o'urs), while the later work of Waite et al. (1992a, b) dealt with blooms composed of only a few genera of dia- toms (dominated by Thalassiosira aestivalis). Species- specific changes in cell sinking rates, therefore, should be more obvious for the case of monospecific popula- tions than for more diverse assemblages of phyto- plankton. Moreover, the termination of spring blooms due to nitrate exhaustion is similar to our 'bloom' and its termination in the tank.
The sinking of cells from surface waters of the tank occurred some time after the depletion of ambient nitrate. Chlorophyll data indicated that this sinking commenced approximately 24 to 48 h after ambient nitrate depletion. Cell count data, however, show that the time scale for increased sinking was closer to 60 h. The time scale is likely underestimated by the chloro- phyll data, as results from batch culture experiments and measured chlorophyll per cell during the tank experiment both show evidence of chlorophyll degra- dation. The model using chlorophyll a s the biomass parameter thus overestimates actual sinking losses, as discussed earlier. Batch culture experiments showed little change in carbohydrate:protein ratios for the first 30 h after ambient nitrate depletion, then ratios in- creased rapidly to the end of the nitrate-depleted phase of the experiment. This indicates, perhaps, that cells were responding to depletion of internal nitrogen pools rather than to prevailing concentrations of nitrate, though no measurements of internal pools were made.
There is some support for delayed sinking in the lit- erature. Bienfang (1981b) cites pre-conditioning nutri- ent history as a possible explanation for why h e found no significant relationship between ambient nutrient concentrations and sinking rates of heterogeneous phytoplankton populations. In direct contrast to our work, however, Waite et al. (1992a) found that initia- tion of sinking of a spring bloom occurred before com- plete exhaustion of ambient nitrate, at threshold levels between 1 and 2 pM. It is not clear to us why these results differ, though increased aggregation of cells under low nutrient conditions (Ki~rboe et al. 1990) may have played a role. We noticed no aggregation of Tha- lassiosira weissflogii during microscopic examination of surface samples taken from the tank.

Mar Ecol Prog Ser 128: 77-90.1995
Increased intracellular density as a result of unbalanced growth
It is instructive to ask why nutrient-depleted cells sank from surface waters of the tank. Changes in cel- lular carbohydrate and protein during batch culture experiments could be responsible for changes in cell buoyancy observed during the tank experiment, so we performed calculations using literature values to deter- mine how changes in carbohydrate and protein affect intracellular density of a model cell. Initial values of carbohydrate and protein per cell were taken from Myklestad (1974) for nutrient-replete cultures of Tha- lassiosira fluviatilis and were converted to carbohy- drate per pm3 cell volume and protein per pm3 cell vol- ume using cell volume data of Conover (1974) for the same organism. Resulting concentrations were 2.0 X
10-7 yg pm-3 and 1.2 X 10⁻⁷ pg for carbohydrate and protein, respectively.
Our model cell was composed only of carbohydrate, protein, and sea water. The total carbon pool of the cell, therefore, was determined by the total amount of carbon contained in carbohydrate and protein, assum- ing that carbohydrate (as laminarin) was 44.4 % carbon and protein was 50% carbon by weight (West & Todd 1963). Starting from initial values stated above, the weight of a 1 pm3 volume was computed and ex- pressed as density in units of kg m-3. For this calcula- tion, the densities of carbohydrate and protein were assumed to be 1600 kg m-3 and 1300 kg m-3, respec-
l 0 E Cell radius = 7.5 pm
Fig. 9. Model output of changes in sinking rate expected with concurrent changes in carb0hydrate:protein ratio for a model cell of radius 7.5 pm (similar to the radus of Thalassiosira wejssflogi~]. Solid h e (-1 shows expected sinking rate changes for a cell that keeps its total carbon content constant but shunts newly-acquired carbon into carbohydrate instead of protein (case 1). Dashed line (- -) shows expected sink- ing rate changes if a cell increases its carbohydrate but keeps both its protein and cell volume constant (case 2). Dotted line (- - - . -) shows expected sinking rate changes if a cell increases its carbohydrate, keeps its protein constant, but gradually increases its overall cell volume (case 3). See 'Discussion'
for details
tively (Oliver & Walsby 1984). The remainder of the 1 pm3 volume was assumed to be occupied by sea water. We then varied both the partitioning of total car- bon (between carbohydrate and protein) and the total carbon pool to determine concurrent changes in intra- cellular density. To convert changes in intracellular density to changes in sinking rate of the model cell, we applied the equivalent changes in density to a cell of 7.5 pm radius and computed sinking rate from Stokes' law for a sphere (Eq. l), assuming a sea water density of 1029 kg m-3 and a dynamic viscosity of 1.072 X 10⁻³ kg m-' S-' at 20°C (Vogel 1981).
The relationship between sinking rate and carbohy- drate:protein ratio was examined for 3 cases (Fig. 9). For case 1, we assumed that the total carbon content of the cell remained constant, but that the partitioning of carbon between carbohydrate and protein changed. Total volume of the cell was kept constant. Potential variations in cell volume due to changes in relative amounts of carbohydrate and protein were countered by changes in cell water content. For case 2, we assumed that cell protein remained constant, but that carbohydrate could increase or decrease. As with case 1, changes in volume occupied by carbohydrate were balanced by changes in water content so that total volume of the cell remained constant. For case 3, cell protein was held constant, carbohydrate was allowed to fluctuate, and the cell was allowed to get larger or smaller. Maximum change in cell radius within the range of the model was *8 %.
Model calculations (Fig. 9) show that the smallest ballast-related changes in sinking speed would be experienced by a cell that keeps its total carbon con- tent constant, and merely shunts carbon acquired under nitrogen-depleted conditions into carbohydrate rather than protein. The greatest changes in cell sink- ing rate would be experienced by a cell that changes its cellular content of carbohydrate but keeps both its volume and its cellular content of protein constant. Intermediate between these values is the cell that changes its cellular carbohydrate and volume, but keeps its protein content constant. Over the course of nutrient depletion, that is, from carb0hydrate:protein ratios of 0.1 to those of slightly less than 3.0 (the maxi- mum range of carb0hydrate:protein ratios determined during batch culture experiments, refer to Fig. 7e), these cells could experience changes in cell sinking rates of up to 4.5 cm h-' or 1.1 m d-l (using Fig. 9) . It would take approximately 60 h for these changes to occur, which agrees well with the range of time scales for increased sinking determined during the tank experiment. During batch culture experiments, rever- sal of carb0hydrate:protein ratios was rapid. Within 24 h after nitrate was added back to the medium, car- bohydrate:protein values decreased to 1.0 from a value

Richardson & Cullen: Growth and sinking of a coastal diatom
close to 3.0 (using Fig. ?E), which could translate to a sinking rate decrease 2.8 cm h- ' or 0.7 m d-' (using Fig. 9). Overall, these calculations indicate that in- creases in carbohydrate ballast alone could have caused the changes in cell buoyancy observed during growth of Thalassiosira weissflogii in the experimental water column.
Though batch culture experiments and modeling exercises showed that increases in intracellular carbo- hydrate due to nitrate depletion could have resulted in the changes in buoyancy observed during the tank experiment, our calculations assume that the cell is composed only of carbohydrate, protein, and water. As this is untrue, calculated density changes and calcu- lated sinking rates should be considered only as rela- tive changes. They do not represent absolute values for cell sinking rates. True sinking rate of the cell will depend on many other factors, including silicification, ionic content, lipid content, and morphological charac- teristics (see review by Smayda 1970). The model of density change which allowed cell volume to increase is the more ecologically relevant, since cell volume tends to increase with growth of Thalassiosira weiss- flogii until cell division (Conover 1974).
Changes in intracellular density were calculated based only upon the measurement of carbohydrate as glucose equivalents which are detected by the phenol- sulphuric acid method. Any incorporation of carbohy- drate into storage products other than P-1.3-glucan (such as mannitol) was not measured and was not considered in our analysis, though this incorporation is usually less than 2% (see Myklestad 1978). Even with- out accounting for other storage products there was a substantial increase in calculated intracellular density due to P-1,3-glucans alone.
Ecological consequences and biogeochemical implications of buoyancy changes and changes in chemical composition during unbalanced growth
We have shown that Thalassiosira weissflogii can be almost neutrally buoyant and that its sinking rate can change significantly (perhaps by as much as 1 m d-l) as the result of accumulation of carbohydrate during unbalanced growth. We have also shown that the chemical composition of T. weissflogii can revert rapidly upon exposure to nitrogen. These observations may have important ecological consequences. The model of Lande & Wood (1987) showed that cells whose sinking rates slowed under nutrient-replete conditions spend a substantially longer total time in the surface mixed layer because of greater probability of re-entrainment back into the mixed layer. We did not show that the rates of cells sinking from the surface of
the tank slowed once they reached the nutrient gradi- ent. Data from batch cultures, however, showed clearly that the physiology of these cells is plastic enough to change intracellular density and thus permit fairly rapid buoyancy reversals. This would confer a distinct ecological advantage. According to the Lande & Wood (1987) model, nutrient-dependent buoyancy changes allow cells to be shuttled between the top of the nutri- cline (where there is low light but high nutrient con- centrations) and shallower depths (where there is high light but low or no nutrients). Access to both high light and high concentrations of nutrients may result in greater overall levels of primary productivity and growth than if buoyancy changes were not possible.
The vertical movements of phytoplankton represent an input of nitrogen to the euphotic zone and are a form of new production as defined by Dugdale & Goer- ing (1967). Because, in the dark, nitrate can be taken up without concurrent uptake of carbon (Terry 1982), cells will instead combine nutrients acquired at depth with carbon acquired in surface waters; that is, the processes of nutrient uptake and carbon uptake become uncoupled in space and time (Cullen 1985, Fraga et al. 1992). Thus, the input of nitrogen through vertical movements of cells is not coupled to the input of carbon in the Redfield ratio (Redfield 1958), as is the case for physically transported dissolved nutrients (see Eppley & Peterson 1979). Since photosynthesis occur- ring in surface waters requires a carbon source, and since stoichiometric equivalents of carbon are not brought to the surface by cells in coupled transport with nitrogen, new production resulting from buoy- ancy-assisted uptake of nutrients could result in the net removal of carbon from oceanic surface waters which, in turn, could affect the air-sea exchange of car- bon dioxide.
A clear example of the uncoupled movements of carbon and nitrogen due to vertical movements of phytoplankton was shown by Fraga et al. (1992) through their measurements of Broecker's parameters (Broecker 1974). These parameters, known as 'NO', 'CO', and 'PO', are intended to be conservative prop- erties that characterize water masses. If biochemical reactions in the water mass are occurring in Redfield proportions, each of Broecker's parameters will be con- stant with depth. During a red tide of the dinoflagellate Gymnodinium catenatum, however, Fraga et al. (1992) found distinct vertical differences in their measure- ments of Broecker's parameters indicating that bio- chemical reactions in the water mass were not occur- ring in Redfield ratios. They attributed these deviations to vertical migrations by the dinoflagellates, whereby carbohydrate synthesis at the surface and nutrient uptake at depth resulted in a carbon deficit near the surface and a nitrogen deficit below.

Mar Ecol Prog Ser 128: 77-90, 1995
The ecological consequences of uncoupled carbon and nitrogen uptake have been outlined previously by Goldman et al. (1992). Similar to our observations dur- ing batch culture experiments with Thalassiosira weissflogii, Goldman et al. (1992) found uncoupling between photosynthesis and nutrient uptake in cul- tures of the diatom Stephanopyxispalmeriana. Carbon accumulation continued well into the stationary phase of the growth of this diatom, long after nutrients were depleted from the growth medium. Though C:N uptake ratios during exponential (nutrient-replete) growth were in Redfield proportions (approximately 6:1), large deviations from Redfield stoichiometry occurred during the nutrient-depleted period of carbon accumulation (to C:N ratios of 12:l) . These observa- tions are not restricted to laboratory experiments: removal of carbon from nutrient-depleted waters of the North Atlantic has been noted by Sambrotto et al. (1993) and Michaels et al. (1994). Goldman et al. (1992) point out the ecological consequences of unbalanced growth: the conventional definition of new production assumes that the flux of particulate organic carbon (POC) as new production can be calculated by multi- plying new production as particulate organic nitrogen (PON) by the Redfield ratio of 6.6 (by atoms). It assumes a balance between the input of nutrients to the euphotic zone and the flux of organic matter to the deep ocean, even over short time scales. I f , however, C:N ratios are higher due to excess carbon accumula- tion during unbalanced growth, then the conventional definition of new production must be revised. By fail- ing to consider the continuation of photosynthesis by some phytoplankton species after nutrient depletion, estimates of new production could be grossly underes- timated (Goldman et al. 1992).
Goldman et al. (1992) also recognized the potential contributions of excess carbon accumulation to in- creased sinking speed of cells. In their study, nutrient- depleted cells formed highly condensed gelatinous masses, probably as the result of cellular excretion of complex heteropolysaccharides. Aggregation of these cells into large masses, and their subsequently high sinking speeds, would lead to direct export of cells from the euphotic zone with minimal losses to grazing. The loss of 'photosynthetically heavy' cells from the eu- photic zone, however, is not necessarily an irreversible process. As we have shown by our batch culture exper- iments with Thalassiosira weissflogii, cells that have been accumulating carbon during unbalanced growth have the capacity to respond rapidly to increased nutri- ents, even after fairly long periods of nutrient defi- ciency (in our case up to 3 d). Rather than considering unbalanced growth and sinking as a one-way process, then, perhaps the process should be viewed as a cycle. That is, carbon accumulation provides adequate ballast
to increase sinking speed, but the recovery from nutri- ent deficiency (perhaps to return to a state of increased buoyancy) allows cells to more easily return to the well- Iit waters of the euphotic zone. The observed recovery of cells from nutrient deficiency also lends support to the purported ability of cells to migrate vertically in nature (Villareal et al. 1993).
Thus, changes in cell buoyancy may be viewed as inherent consequences of cell physiology. The increase in cellular excess density provided by carbohydrate as the result of unbalanced growth followed by slowing of sinking rate due to uptake of nutrients and the use of stored carbohydrate is, in effect, a built-in buoyancy regulating mechanism. Rapid increases of cell sinking rate when cells are nutrient depleted and rapid returns to increased buoyancy when nutrient replete may rep- resent an ecological adaptation to environments where light and nutrients are spatially separated.
Acknowledgements Thanks to A. J . Bowen, M.-E Carr, J . L. Craigie, M. R. Lewis and 3 perspicacious and genial review- ers for helpful comments on the manuscr~pt. Thanks also to A. M. Ciotti for help with sampling and to Wade Blanchard for statistical advice. This study was supported by a grant from the Natural Sciences and Engineering Research Council (Canada) to J.J.C. and an EIiza Ritchie Doctoral Scholarship to T.L.R.
LITERATURE CITED
Anderson LWJ, Sweeney BM (1977) Die1 changes in sedimen- tation characteristics of Ditylum brightwellil: changes in cellular lipid and effects of respiratory inhibitors and ion- transport modifiers. Limnol Oceanogr 22539-552
Anderson LWJ, Sweeney BM (1978) Role of inorganic ions in controlling sedimentation rate of a marine centric diatom Ditylum brlghtwellii. J Phycol 14:204 -214
Beklemishev KB, Petrikova M N , Semina G1 (1961) On the cause of buoyancy of plankton diatoms. Tr lnst Okeanol Akad Nauk SSSR 51:33-36
Bientang PK (1981a) SETCOL - a technologically simple and reliable method for measuring phytoplankton sinking rates. Can J Fish Aquat Sci 38:1289-1294
Bienfang PK (1981b) Sinking rates of heterogeneous, temper- ate phytoplankton populatlons. J Plankton Res 3:235-253
Bienfang PK (1981~) Sinking rate dynamics of Cricosphaera carlerae Braarud. 11. Senescence response to various limit- ing substrates In non-steady state populations. J exp mar Biol Ecol 49.235-244
Bienfang PK, Conquest L, Antill E (1986) Compositional and buoyancy responses to nutrient deficiency in marine phytoplankton. Report of the Oceanic Institute. Makapuu Point, Waimanalo, HI
Bienfang PK, Harrison PJ (1984) Sinking-rate response of nat- ural assemblages of temperate and subtrop~cal phyto- plankton to nutnent depletion. Mar Biol 83:293-300
Bienfang PK, Harrison PJ, Quarmby LM (1982) Sinking rate response to deplet~on of nitrate, phosphate, and silicate in four marine diatoms. Mar Biol 67:295-302
Bienfang PK, Szyper JP (1982) Effects of temperature and salinity on sinking rates of the centric d~a tom Ditylum bnghtwcrllii. Biol Oceanogr 1321 1-223
Richardson & Cullen: Growth and sinking of a coastal diatom 89
Blenfang PK, Szyper JP, Laws E (1983) Slnklng rate and pig- ment responses to light-limitation of a marine diatom: implications to dynamics of chlorophyll maximum layers. Oceanol Acta 6:55-62
Broecker WS (1974) 'NO', a conservative water-mass tracer. Earth Planet Sci Lett 23:lOO-107
Conover SW (1974) Nitrate. ammonium, and urea as nitrogen sources for marine diatoms in culture and in spring blooms. PhD thesis, Dalhousle University, Halifax
Cullen JJ (1985) Die1 vertical migration by dinoflagellates: role of carbohydrate and behavioral flexibility. In- Rankin MA (ed) Migration: mechanisms and adaptive sign~fi- cance. Contr mar Sci 27 (Suppl):135-152
Cullen J J , Horrigan S W (1981) Effects of nitrate on the diur- nal vertical migration, carbon to nitrogen ratio, and the photosynthetic capacity of the dinoflagellate Gymno- dinium splendens. Mar Biol 62:81-89
Cullen JJ , Lewls MR (1988) The kinetics of algal photoadap- tation in the context of vertical mixing. J Plankton Res 10: 1039-1063
Dorsey TE, MacDonald P, Roels OA (1978) Measurement of phytopldnkton protein content with the heated biuret folin assay. J Phycol 14:167-171
Dubois M, Gilles KA, Hamilton JK, Rebers PA, Smith F (1956) Calorimetric method for determination of sugars and related substances. Analyt Chem 28:350-356
Dugdale RC, Goering J J (1967) Uptake of new and regener- ated forms of nitrogen in primary productivity. Limnol Oceanogr 12:196-206
Eppley RW, Holmes RW. Strickland JDH (1967) Sinking rates of marine phytoplankton measured with a fluorometer. J exp mar Biol Ecol 1 191-208
Eppley RW, Peterson BJ (1979) Particulate organic matter flux and planktonic new production in the deep ocean. Nature 282577-680
Fraga F, Perez FF, Figueiras FG, Rios AF (1992) Stoichiomet- ric variations of N. P. C and O2 during a Gyn?nodinit~m catenatunl red tide and their interpretation. Mar Ecol Prog Ser 87 123-134
Goldman JC, Hansell DA, Dennett MR (1992) Chemical char- acterization of three large oceanic diatoms: potential im- pact on water column chemistry. Mar Ecol Prog Ser 88: 257-270
Granata TC (1987) Measurements of phytoplankton sinking and growth under varied light lntensities and m~xing regimes. PhD thesis, University of California, Berkeley
Gross F, Zeuthen E (1948) The buoyancy of plankton diatoms: a problem of cell physiology. Proc R Soc Lond (Ser B) 135: 382-389
Guillard KKL (1972) Culture of phytoplankton for feeding marine ~nvertebrates. In: Smith WL. Chanley MH (eds) Culture of marine invertebrate animals. Plenum Press, New York, p 29-60
Hayward TL (1991) Primary production In the North Pacific Central Gyre: a controversy w ~ t h important impl~cations. Trends Ecol Evol6:281-284
Heaney SI. Butterwick C (1985) Comparative mechanisms of algal movement in relation to phytoplankton production. In: Rankin MA (ed) Migration: mechanisms and adaptive significance. Contr~b mar Sci 27 (Suppl):114-134
Heaney Sl, Davey MC, Brooks AS (1989) Formation of sub- surface maxima of a diatom within a stratified lake and in a laboratory water column. J Plankton Res 11:1169-1184
Heaney SI, Eppley RW (1981) Light, temperature, and nitro- gen as interacting factors affecting die1 vertical migrations of dlnoflagellates In culture. J Plankton Res 3.331-344
lbelings BW, h4ur LR, Walsby AE (1991) Diurnal changes in
buoyancy and vertical d~stribution in populations of Microcystis in two shallow lakes. J Plankton Res 13: 419-436
Jackson GA (1990) A model of the formation of marine algal flocs by physical coagulation processes. Deep Sea Res 37: 1197-1211
Jahnke RA (1990) Ocean flux studles: a status report. Rev Geophys 28:381-398
Kahn N. Swift E (1978) Positive buoyancy through ionic con- trol in the nonmotile marine dinoflagellate Pyrocystis noc- tiluca Murray ex Schuett. Limnol Oceanogr 23-649-658
K~orboe T, Andersen K P, Dam H G (1990) Coagulation effi- ciency and aggregate formation in marine phytoplankton. Mar Biol 107:235-245
Kirk JTO (1994) Light and photosynthesis in aquatic ecosys- tems, 2nd edn. Cambridge University Press, Cambridge
Lande R, Wood AM (1987) Suspension times of particles in the upper ocean. Deep Sea Res 34:61-72
Michaels AF, Bates NR, Buesseler KO. Carlson CA, Knap AH (1994) Carbon-cycle imbalances in the Sargasso Sea. Nature 372537-540
M~chaels AF, Silver MW (1988) Primary production sinking fluxes and the microbial food web. Deep Sea Res 35: 473-490
Moore DS, McCabe GP (1993) Introduction to the practice of statistics, 2nd edn. WH Freeman and Company, New York
h4yklestad S (1974) Production of carbohydrates by marine planktonic diatoms. I. Comparison of nlne different spe- cies in culture. J exp mar B~ol Ecol 15:261-274
Myklestad S (1978) P-l, 3-glucans in diatoms and brown sea- weeds. In: Hellebust JA, Craigie J S (eds) Handbook of phycological methods. I1 Physiological and biochemical methods. Cambridge University Press. Cambridge, p 133-141
Ollver RL (1994) Floating and sinking In gas-vacuolate cyanobacteria. J Phycol30:161-173
Oliver RL, LValsby AE (1984) Direct evidence for the role of light-mediated gas vesicle collapse in the buoyancy regu- lation of Anabaena flos-aquae (cyanobacteria). Limnol Oceanogr 29.879-886
Redfield AC (1958) The biological control of chemical factors in the environment. Am Sci 46(3):1-221
Romans KM, Carpenter EJ, Bergman B (1994) Buoyancy reg- ulation in the colonial diazotrophic cyanobacterium Tri- chodesmium tenue: ultrastructure and storage of carbohy- drate, polyphosphate, and nitrogen. J Phycol 30:l-7
Roy S, Legendre L (1979) DCMU-enhanced fluorescence as an index of photosynthetic activity in phytoplankton. Mar Biol 55:93-101
Sambrotto RN, Savidge G, Robinson C, Boyd P, Takahashi T, Karl D, Langdon C, Ch~pman D, Marra J , Codispoti L (1993) Elevated consumption of carbon relative to nltro- gen in the surface ocean. Nature 363:248-250
Smayda TJ (1970) The suspension and sinking of phytoplank- ton in the sea. Oceanogr mar biol A Rev 8:353-414
Smayda TJ, Boleyn BJ (1966a) Experimental observations on the flotation of marine diatoms. 11. Skeletonema costatum and Rhizosolenia setigera. Limnol Oceanogr 11: 18-34
Smayda TJ. Boleyn BJ (1966b) Experimental observations on the flotation of marine diatoms. 111. Bacteriastrum hyal- inum and Chaetoceros lauderi. Limnol Oceanogr 11: 35-43
Smetacek VS (1985) Role of sinlang in diatom life-history cycles: ecological, evolutionary and geological signifi- cance. Mar Biol 84:239-251
Steele JH, Yentsch CS (1960) The vertical distribution of chlorophyll. J mar biol Ass UK 39:217-226

Mar Ecol Prog Ser 128: 77-90, 1995
Strickland JDH, Holm-Hansen 0, Eppley RW, Linn RJ (1969) The use of a deep tank in plankton ecology. I. Studies of the growth and composition of phytoplankton crops at low nutrient levels. Limnol Oceanogr 14123-34
Strickland JDH, Parsons TR (1972) A practical handbook of seawater analysis, 2nd edn. Bull Fish Res Bd Can 167: 1-310
Takahashi M, Bienfang PK (1983) Size structure of phyto- plankton biomass and photosynthesis in subtropical Hawaiian waters. Mar Biol 76.203-211
Terry KL (1982) Nitrate uptake and assimilation in Thalas- siosira weissflogii and Phaeodactylum tricornutum: inter- actions with photosynthesis and with the uptake of other ions. Mar Biol 69:21-30
van Rijn J, Shilo M (1985) Carbohydrate fluctuations, gas vac- uolation and vertical migration of scum-forming cyano- bacteria in fishponds. Limnol Oceanogr 30:1219-1228
Villareal TA (1988) Positive buoyancy in the oceanic diatom Rhizosolenia debyana H. Peragallo. Deep Sea Res 35: 1037-1045
Villareal TA (1992) Buoyancy properties of the giant diatom Ethmodiscus. J Plankton Res 14:459-463
Villareal TA, Altabet MA, Culver-Rymsza K (1993) Nitrogen transport by vertically-migrat~ng diatom mats in the North Pacific Ocean. Nature 363:709-7 12
Villareal TA, Carpenter EJ (1990) Die1 buoyancy regulation in the marine diazotro~hic cvanobacterium Trichodesmium thiebautij. Limnol 0ceanogr 35:1832- 1837
Vincent WF (1980) Mechanisms of rapid photosynthetic adap-
This article was submitted to the editor
tation in natural phytoplankton communities. I. Changes in photochemical capacity as measured by DCMU- induced chlorophyll fluorescence. J Phycol 16568-577
Vogel S (1981) Life in moving fluids: the physical biology of flow. Princeton University Press, Princeton, NJ
Waite A, Bienfang PK, Harrison PJ (1992a) Spring bloom sed- imentation in a subarctic ecosystem. I. Nutrient sensitivity. Mar Biol 114:119-129
Waite A, Bienfang PK, Harrison PJ (1992b) Spring bloom sed- imentation in a subarctic ecosystem I1 Succession and sedimentation. Mar Biol 114:131-138
Walte A, Thompson PA, Harrison PJ (1992~) Does energy con- trol the sinking rates of marine diatoms2 Llmnol Oceanogr 37:468-477
Walsby AE (1978) The properties and buoyancy-providing role of gas vacuoles in Trichodesmium Ehrenberg. Br phy- c01 J 13:103-116
Walsby AE, Reynolds CS (1980) Sinking and floating. In: Mor- ris I (ed) The physiological ecology of phytoplankton. Uni- versity of California Press, Los Angeles, p 371-412
Walsby AE, Reynolds CS, Oliver RL, Kromkamp J (1989) The role of gas vacuoles and carbohydrate content in the buoy- ancy and vertical distribution of Anabaena rninutissirna in Lake Rotongaio, New Zealand. Ergebn Limnol 32:l-25
Walsby AE, Xypolyta A (1977) The form resistance of chitin fibres attached to the cells of Thalassiosira fluviatilis Hustedt. Br phycol J 12:215-223
West ES, Todd WR (1963) Textbook of biochemistry, 3rd edn. The MacMillan Company, New York
Manuscript first received: February 22, 1995 Revised version accepted: May 16, 1995