changes in fine-sediment storage during the lssf matt kaplinski, joe hazel, mark manone, rod...
TRANSCRIPT

Changes in Fine-Sediment Storage During the LSSF
Matt Kaplinski, Joe Hazel, Mark Manone, Rod Parnell, Joe Cain, John Souter
Northern Arizona University
And
Jack Schmidt, Hoda Sondossi, Utah State University

• Data Collection
•Preliminary Results
NAU
USU
• Conclusions

Jan Feb Mar Apr May Jun Jul Aug Sep Oct Nov2000
200
300
400
500
600
700
800
900D
aily
Dis
ch
arg
e (
m3 /
s)
S pring h igh flow sFall h igh flow
LSS F
surveys


UTAH
A RIZO N A
L e e 's F e rry
P ie rceFerry
(R M 0 )
L a ke
M e a d
55
09402000
09380000
09382000
09383100
09401200
L a ke P o w e ll
N
GlenCanyonDam
GrandCanyonNationalPark
10 0 10 2 0
M iles
Kilom eters
010 1 0 2 5
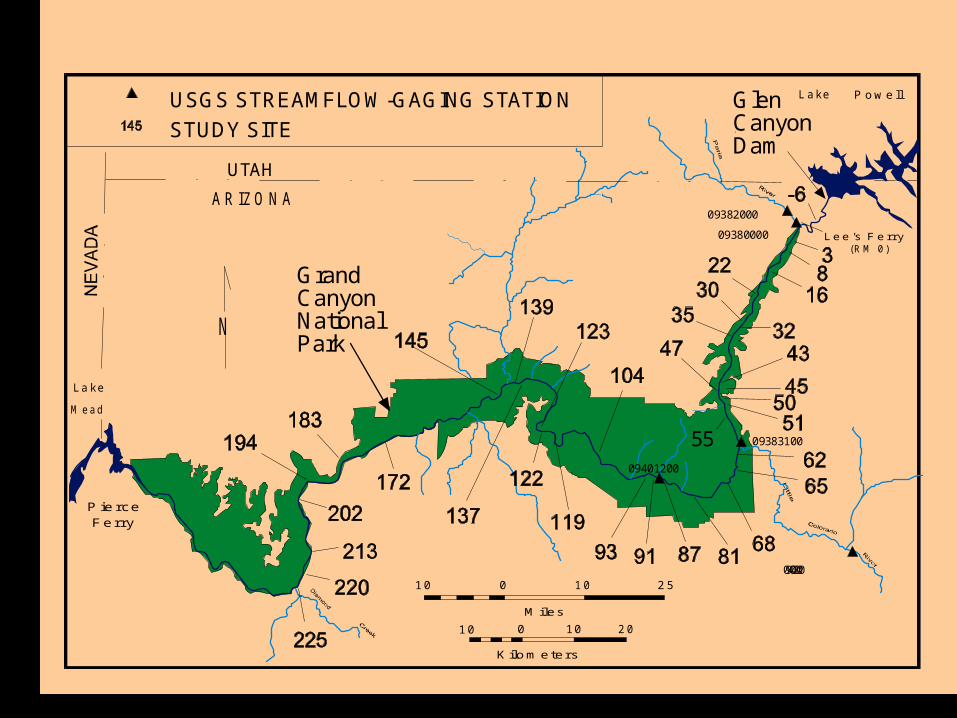
USGS STREAMFLOW-GAGING STATION
STUDY SITE

NAU Sites
(March, June, August, September)
• Topographic surveys of sand bars/channel margins
• Hydrographic surveys of the eddy and channel
• Grain size samples of the sand bar/eddy/channel
• Photographs

Reach-based approach(June, August, September)
Reach 1: mile 1 to RM3 (Paria riffle to Cathedral Wash)
Reach 2: mile 29 to mile 32 (Silver grotto to South Canyon eddy)
Reach 3: mile 42 to mile 46 (above Anasazi Bridge to below Eminence camp)
Reach 4: mile 60 to mile 61 (60 mile rapids to mouth of LCR)
Reach 5: mile 63 to mile 66 (below Crash Canyon gravel bar to Lava-Chuar rapids)
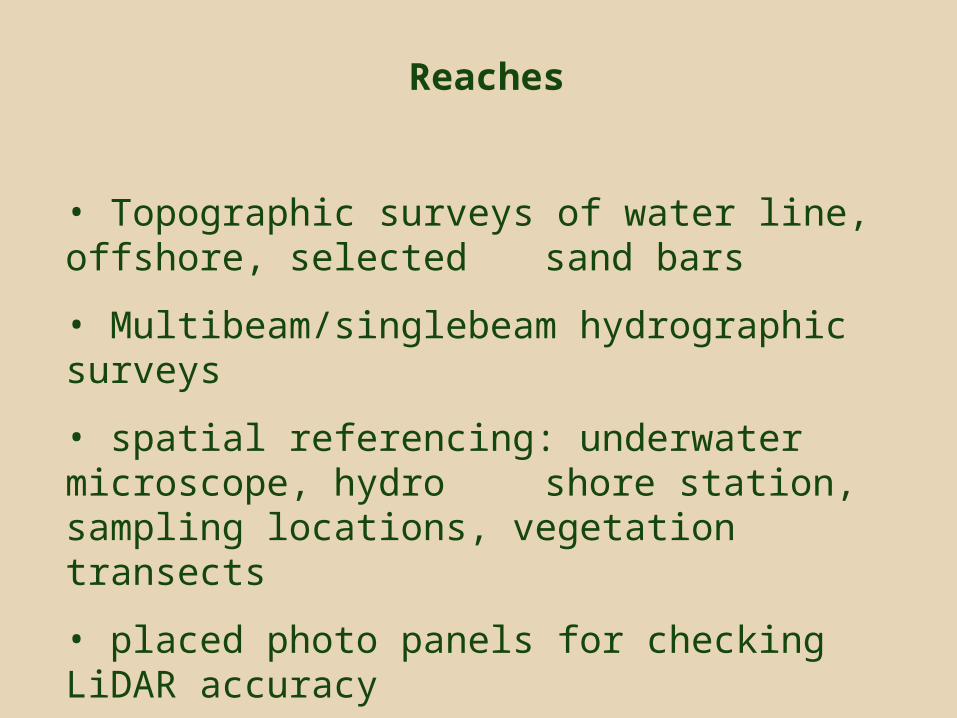
Reaches
• Topographic surveys of water line, offshore, selected sand bars
• Multibeam/singlebeam hydrographic surveys
• spatial referencing: underwater microscope, hydro shore station, sampling locations, vegetation transects
• placed photo panels for checking LiDAR accuracy
UTAH
A RIZO N A
L e e 's F e rry
P ie rceFerry
(R M 0 )
L a ke
M e a d
55
09402000
09380000
09382000
09383100
09401200
L a ke P o w e ll
N
GlenCanyonDam
GrandCanyonNationalPark
10 0 10 2 0
M iles
Kilom eters
010 1 0 2 5
USGS STREAMFLOW-GAGING STATION
STUDY SITE

0
1
0.2
0.4
0.6
0.8
Sa
nd
Ba
r T
hic
kn
es
s (
m)
1996BHBF
Nov. 1997HMF
1992 1994 1996 1998 2000
Sept.2000 HMF
1991 1993 1995 1997 1999
8,000 cfs - 25,000 cfsAbove 25,000 cfs
May2000 HMF

-50
-25
0
25
50
75
Are
a C
ha
ng
e (
%)
1996BHBF
400 600 800 1000 1200 1400
Experim ental Flow D ischarge (m 3/s)
-50
-25
0
25
50
75
Vo
lum
e C
ha
ng
e (
%)
1996BHBF
1997 HM F and 2000 HM F's
1997 HM F and Sept. 2000 HM F
Changes between 226 and 708 m3/s
M ay 2000 HMF

-50
-25
0
25
50
75
100
Are
a C
ha
ng
e (
%)
1996BHBF
400 600 800 1000 1200 1400
Experim ental Flow D ischarge (m 3/s)
-50
-25
0
25
50
75
100
Vo
lum
e C
ha
ng
e (
%)
1996BHBF
1997 HM F and 2000 HM F's
1997 HM F and 2000 HM F's
Changes above 708 m3/s

September 2000 Spike Flow: Analysis of Aerial Images (Utah State Univ.)
• Study area: Sixtymile Rapid to LCR (2 river km)
• Map area of exposed submerged, wet, dry sand before and after spike; map water’s edge at 31,500 cfs during spike
• Compare areas of sand and areas of backwaters before and after spike and in relation to conditions after 1996 flood

Outline of deposits immediately before the fall 2000 spike
Water’s edge during the fall 2000 spike
Outline of deposits 2 weeks after the fall 2000 spike
Water’s edge during the fall 2000 spike
Before After

0
0.2
0.4
0.6
0.8
1
THE AREA OF EACH EDDY INUNDATED BY 31,500 CFS ISAPPROXIMATELY 23% LESS THAN THE AREA INUNDATED
BY 45,000 CFS, FOR EDDIES BETWEENSIXTYMILE RAPIDS AND LCR
Inundated at 45,000 cfs Inundated at 31,500 cfs
Rat
io o
f ar
ea o
f ed
dy in
und
ate
d, t
o th
e to
tal e
ddy
area
To
tal a
rea
of b
ack
wa
ter
(m2)
0
500
1000
1500
2000
2500
Aug/24 Aug/30 Sep/5 Sep/10 Sep/16 Sep/22
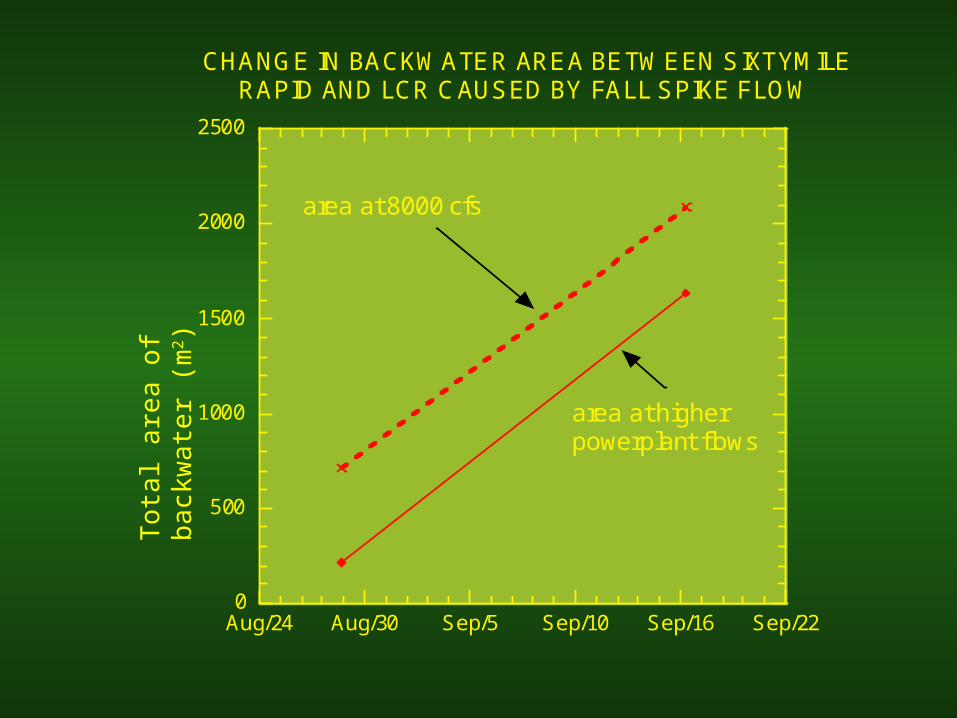
area at 8000 cfs
area at higherpowerplant flows
CHANGE IN BACKWATER AREA BETWEEN SIXTYMILE RAPID AND LCR CAUSED BY FALL SPIKE FLOW

Fill
rat
io
Eddy Count:
Gain: 8
Loss: 5
No Change: 3
0
0.2
0.4
0.6
0.8
1
THE RATIO OF SAND EXPOSED AT 8000 CFS TO THE AREA OF EACH EDDY INUNDATED AT 31,500 CFS FOR THE EDDIES BETWEEN SIXTYMILE RAPIDS AND THE LCR
IMMEDIATELY BEFORE THE FLOOD
TWO WEEKS AFTER THE FLOOD
these ratios are not statistically different
Nu
mb
er
of E
ddie
s
0
2
4
6
8
10
-1 -0.8 -0.6 -0.4 -0.2 0 0.2 0.4 0.6 0.8 1
Net Normalized Aggradation
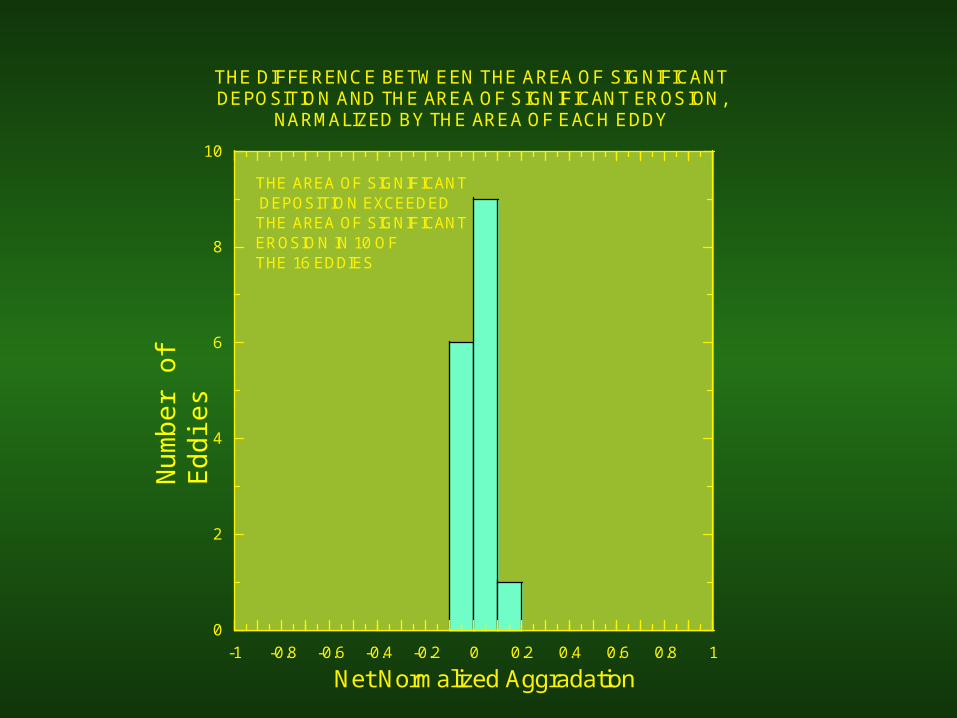
THE DIFFERENCE BETWEEN THE AREA OF SIGNIFICANT DEPOSITION AND THE AREA OF SIGNIFICANT EROSION,
NARMALIZED BY THE AREA OF EACH EDDY
THE AREA OF SIGNIFICANT DEPOSITION EXCEEDED THE AREA OF SIGNIFICANT EROSION IN 10 OF THE 16 EDDIES

Fill
rat
io
0
0.2
0.4
0.6
0.8
1
THESE RATIOS ARE NOT STATISTICALLY DIFFERENT
THE RATIO OF EXPOSED SAND (AT 8000 CFS) TO THE AREA INUNDATED BY EACH FLOOD FOR THE EDDIES BETWEEN SIXTYMILE
RAPIDS AND THE LCR
IMMEDIATELY AFTER THE 1996 CONTROLLED FLOOD
TWO WEEKS AFTER THE FALL 2000 SPIKE

Preliminary Conclusions• No significant change in the high-elevation (above 25,000 cfs ) parts of sand bars
• The mid-level (8,000 cfs to 25,000 cfs) parts of sand bars were aggraded during both the spring and fall high flow events
• No data yet available to assess topographic changes at low elevations within eddies or of the channel bed
• Topographic measurements made at 18 study sites between Lees Ferry and Phantom Ranch generally agree with aerial image analysis of changes at 15 eddies near the LCR
• Backwater area (at least from 60 to 61 mile) increased substantially during the Fall high flow
• power-plant capacity flows inundate approximately 23% less area within eddies than 45,000cfs