changes in official poverty and inequality rates in the
TRANSCRIPT
AnglesNew Perspectives on the Anglophone World 8 | 2019Neoliberalism in the Anglophone World
Changes in Official Poverty and Inequality Rates inthe Anglophone World in the Age of NeoliberalismNicholas Sowels
Electronic versionURL: http://journals.openedition.org/angles/560DOI: 10.4000/angles.560ISSN: 2274-2042
PublisherSociété des Anglicistes de l'Enseignement Supérieur
Electronic referenceNicholas Sowels, « Changes in Official Poverty and Inequality Rates in the Anglophone World in theAge of Neoliberalism », Angles [Online], 8 | 2019, Online since 01 April 2019, connection on 28 July2020. URL : http://journals.openedition.org/angles/560 ; DOI : https://doi.org/10.4000/angles.560
This text was automatically generated on 28 July 2020.
Angles. New Perspectives on the Anglophone World is licensed under a Creative Commons Attribution-NonCommercial-ShareAlike 4.0 International License.

Changes in Official Poverty andInequality Rates in the AnglophoneWorld in the Age of NeoliberalismNicholas Sowels
1 This article presents an overview of official poverty and inequality rates in the
Anglophone world, which are key issues related to the emergence of neoliberal
capitalism since the late 1970s. They have had an important role to play in the rise of
populist political movements leading to protectionist and nationalist politics, especially
in the United States and the United Kingdom (Gamble 2017). In both countries,
neoliberalism and globalization have left significant sections of society behind, fuelling
popular anger against the status quo and so-called metropolitan elites, especially since
the financial crisis and Great Recession. The Brexit referendum in June 2016 and the
election of Donald Trump in November 2016 are clear manifestations of such anger in
the face of public policies that have largely pursued a back-to-business agenda since
the crisis.
2 The rise of inequality has been especially strong in the United States, where the “top
1%” of rich households has demonstrably pulled away from the rest of society in terms
of income growth and wealth accumulation. Meanwhile, “middle America” has been
largely left out of the growth that has accompanied neoliberal economic policies that
go back to the 1970s, as a way of tackling stagflation at the time. Broadly speaking,
these policies have included significant reductions in direct government intervention
in economies and the strengthening of market forces to make product, financial and
labour markets more flexible. Specifically, policies have been based on: the
abandonment of fiscal policy as a tool for managing demand and supporting
employment in favour of monetary policy aimed primarily at achieving low inflation,
steep tax cuts for top income earners, the deregulation of markets, the privatization
and contracting out of public service provision, the deliberate weakening of trade
union power, the pursuit of international trade liberalization, and the financialization
of the world economy which has been in the forefront of globalization. Such policies
Changes in Official Poverty and Inequality Rates in the Anglophone World in t...
Angles, 8 | 2019
1
have varied from country to country, as has their impact on inequality and poverty
levels in the industrialized world. But among the developed countries, these policies
have been especially pronounced in the Anglophone world, and they contrast strongly
with the more interventionist policies of government that shaped capitalism in the
post-war era.
3 To examine the broader impact of neoliberalism on poverty and inequality, this article
will begin by providing a brief overview of the definitions of both phenomena which
are linked but distinct. Section 2 will then present the key basic data on inequality and
poverty trends, using standardized data provided by the OECD. It will also provide
summary statistics concerning the income share of the “top 1%” provided by the World
Inequality Database, constructed by the team of researchers working with Thomas
Piketty.1 The final section will review and analyze the specificity of the Anglophone
world’s experience with neoliberalism.
Key definitions of poverty and inequality
4 Poverty and inequality are linked but separate phenomena and affect the lives of
millions of people on a daily basis in the Anglophone world (and beyond). Before
turning to the dry statistics, it is important to recall — I believe — that the daily
hardship of poverty is lost in the data and is generally absent in the media, and even in
art. We may be exposed to war and terror on TV, while the audio-visual and plastic arts
can shock. Abject poverty is also easily visible on the streets of major cities, where
homeless people and refugees huddle under shelters, in cardboard boxes or simple
tents. But most of the time, the daily grind of, say, the 40 million US citizens living
below the poverty line takes place out of sight. Only occasionally it is captured on film,
in TV documentaries, or in written fiction.
Measuring poverty
5 There are two traditional definitions of poverty which split the Anglophone world. The
first definition is more politically conservative and is based on assigning an absolute
monetary value to poverty. This approach is used in the United States, where a poverty
threshold is calculated on the basis of a “dollar amount for the sum of three broad
categories of basic goods and services — food, clothing, and shelter (including utilities)”
(Citro and Michael 1995). The poverty threshold is then adjusted to take into account
household composition, with successive adults and children being weighted less in
terms of the resources they need. Thus, in 2017, the poverty threshold for persons
living in mainland America (i.e. not Alaska nor Hawaii) was a yearly income of $12,750
for a single adult under the age of 65, and $24,858 for a household with two adults
under 65, and two children under 18 (see Table 1) (US Census Bureau 2018).
6 The other principle definition of poverty is a relative definition. Used in the European
Union and by international organizations such as the OECD, this definition sets the
poverty threshold at 60 (or 50) percent of the median household disposable income,
equivalised to take into account household composition. This means that all state
benefits/transfers are first added to households’ initial earned income and taxes are
subsequently deducted. Again, adults in a household have diminishing weights, as do
children.2
Changes in Official Poverty and Inequality Rates in the Anglophone World in t...
Angles, 8 | 2019
2

7 Poverty — or “low income” — is usually measured like this in the United Kingdom.
Government statistics however also use an absolute definition of poverty/low income.
This is calculated by adjusting the 60 percent median income threshold in a base year
(currently 2010/11) for inflation, to provide a more absolute measure of poverty
(McGuinness 2018). Relative measures of poverty by definition follow the evolution of
median wages. By contrast, this calculation of absolute poverty in real money terms
increases more slowly, as it does not reflect real growth in the economy, only price
increases. In an expanding economy, this leads to more visible falls in poverty. An
important issue in the UK statistics (and in other Anglophone countries) is also the
inclusion or not of housing costs. Given the slow growth of housing units in recent
decades in the UK, housing is an increasingly pressing expense on household budgets.
As a result, the percentage of people living on low income “after housing costs” (AHC)
is about 5 percentage points higher than the share on low income “before housing
costs” (BHC).
8 In Ireland, the official measure of poverty relates to “consistent poverty”, which draws
on two overlapping indicators: i) the at-risk-of-poverty indicator of individuals living
in households below 60 percent of the median income, and ii) the basic deprivation
indicator which captures individuals lacking 2 or more of 11 basic necessities, which
include two pairs of shoes, a warm waterproof overcoat, new (not second-hand)
clothes, the ability to eat a meal with meat, chicken or fish (or the vegetarian
equivalent) every second day, and have a roast joint or equivalent once a week, the
ability to keep adequately warm, etc. (Dept. of Employment Affairs and Social
Protection 2016).
Table 1: Monetary Values of Poverty Thresholds (and equivalent in euros*)3
Indicator YearIncome per
year, 1 person
Income per year, 2
adults & 2 children
United
States
Poverty line (absolute value:
basket of goods and services)2017
$12,750
(€9,960)
$24,858
(€20,209)
United
Kingdom60% median income BHC 2016/17
£17,200
(€19,770)
£36,000
(€40,900)
Ireland 60% median income €12,358 €25,823
Canada LIM (Low income measure) 2015C$22,133
(€14,097)
C$44,266
(€28,194)
Australia 60% median income BHC 2013-14A$26,600
(€16,729)
A$55,862
(€35,133)
Changes in Official Poverty and Inequality Rates in the Anglophone World in t...
Angles, 8 | 2019
3

New
Zealand60% median income BHC 2016
NZ$22,620
(€13,464)
NZ$49,400
(€29,404)
Sources: (full references are given at the end of the article): US: Census Bureau, “Poverty Thresholds”,2018; UK: DWP, “Households Below Average Income: An analysis of the UK income distribution:1994/95-2016/17”; Ireland: European Anti Poverty Network Ireland, “Relative Poverty Rates”; Canada:Statistics Canada, “Census in Brief: Children living in low-income households”; Australia: AustralianCouncil of Social Service [ACOSS] and Social Policy Research Centre [SPRC], “Poverty in Australia2016”; New Zealand: Ministry of Social Development, “Household incomes in New Zealand: Trends inindicators of inequality and hardship 1982 to 2016”.
9 Canada has no official poverty line. A number of low income lines are nevertheless used
by government agencies to inform public debate. Thus, Statistics Canada formulated
the Low Income cut-offs (LICO) in the 1960s. These are thresholds below which families
that spend more than 20 percentage points than the average family on certain
necessities are defined as having a low income. The necessities include food, shelter
and clothing. This is a low, but relative definition of poverty. The Market basket
measure (MBM) in contrast defines a family as having a low income if it does not have
enough money to buy “a specific set of goods and services that represent a basic
standard of living”. The MBM is therefore an absolute measure of poverty, similar to
the US poverty line. Lastly, Canada also uses a Low income measure (LIM) which
identifies families with income below the 50% median household income. This is similar
to the EU definition — but lower. In 2014, it was estimated that 8.8% of the population
(3.0 million people) were living below the LICO; 11.3% (or 3.9 million) below the MBM
rate, and 13.0% (4.5 million) below the LIM (Government of Canada 2016). The relative
definition using the 50% of median income threshold therefore seems to be the
broadest, most inclusive definition.
10 Australia has no official definition of a poverty threshold either. Instead, poverty is
principally measured by two independent, non-governmental organizations, albeit
using public data. The Melbourne Institute tracks an absolute measure of poverty. This
is done by updating a benchmark of weekly disposable income for a family of two
adults and two children, as originally calculated in December 1973 (at A$62.70). Other
thresholds for different types of families are calculated using equivalence scales: there
seems to be no calculation for isolated individuals. These poverty lines are updated
using an index of per capita household disposable income. Thus, in September 2017, the
poverty line for this two-adult, two-child household was A$961.21 per week, including
housing costs, and A$744.07 other than housing (Melbourne Institute 2018). For its part,
the Australian Council of Social Service and the Social Policy Research Centre regularly
report on relative poverty lines at the 50% and 60% of median disposable household
income, before and after housing costs. For a couple with two children, the poverty line
in 2013-14 at the 60% threshold was A$1,074.27 BHC and A$864.26 AHC (ACOSS and
SPRC 2016).
11 Lastly, New Zealand also uses a mix of absolute and relative measures. Thus, two
relative thresholds are calculated at “50 and 60 percent of the current year’s household
disposable income median net-of-housing-costs”. An absolute measure is also
calculated, based on 50 % of the 2007 median household income (net-of-housing-costs),
which has been subsequently updated to ensure its real value (Ministry of Social
Development 2017).
Changes in Official Poverty and Inequality Rates in the Anglophone World in t...
Angles, 8 | 2019
4

Defining inequality
12 Measures of inequality typically relate mainly to income. The two most common
measures are the Gini coefficient which is derived from the Lorenz Curve and the ratio
of the top 10% (or 20%) of incomes to the bottom 10% (or 20%) of incomes. The Gini
coefficient provides a scale indicator of inequality running from 0 (or 0%) indicating
total equality, to 1 (or 100%) indicating total inequality (in which the top 1% takes all).
It is usually used for income inequality, where statistics tend to be more reliable as they
are usually based on households’ tax declarations.
13 Some qualifying comments need to be made about this, however. There are limits to
the upper-most value of the Gini coefficient concerning the distribution of income,
simply because all members of a society need to receive some income to ensure
subsistence, otherwise a society (or community) will collapse. Also, as societies get
richer, the quantity of basic necessities needed to function in society — and the
economy — rises. As a result, Gini coefficients have historically never exceeded 0.6 in
today’s major industrialized nations (including in the 19th century) (Milanovic 2016). In
the post-World War II period and even with the rise of neoliberalism, Gini coefficients
for disposable household income (after benefits and taxes) tend to cluster in a
relatively narrow range from 0.25-0.3 for fairly equal societies (as in Scandinavia), to
0.35-0.4 for unequal societies (as in the United States today). It is only in extremely
unequal societies, where national income is sufficiently higher than total, national
subsistence income, that higher Gini values of 0.45 and more may be found (typically in
Latin America).
14 The Gini coefficient may also be used to indicate wealth inequality. This however is less
common because estimating wealth inequality is hard: declarations are less frequent
(for example inheritance tax declarations) and wealth may often be held more in
families than by individuals. Moreover, holders of wealth frequently avoid declaring
assets fully, which is also the case for incomes. As a result, Gini coefficients are
generally likely to understate inequalities.
An Overview of Current Poverty Rates and InequalityTrends in the Anglophone Countries
15 Table 2 is taken from the OECD Income Distribution and Database (IDD). It provides two
indicators of poverty: a relative measure at the 50% threshold of median disposable
income; and a more absolute measure: the “anchored” 50% threshold of median
disposable income in 2005 uses the same procedure to adjust for inflation as described
for the UK and New Zealand above. The Table ranks poverty rates for 2015 in ascending
order.
16 Not surprisingly, the United States comes nearly bottom of the list, just behind Turkey,
with 17.2 percent of its population living in poverty, based on this measure —
compared to 13.5% of the population living below the official poverty line in 2015
(Semega et al. 2017: 43). Canada too has a poverty level that was above the OECD
average: respectively 14.2 percent and 11.6 percent in 2015. In diminishing order,
Australia (12.8 percent), New Zealand (10.9 percent) and the United Kingdom (also at
10.9%) are clustered around the OECD average. Only Ireland, with a poverty rate of 9.2
Changes in Official Poverty and Inequality Rates in the Anglophone World in t...
Angles, 8 | 2019
5

percent, has a significantly lower rate, more akin to the rates found in continental and
northern Europe. A quick glance at the table does indeed provide some impression of
loose country groupings. Thus, the emerging countries (Turkey, Mexico and Chile) have
significantly higher poverty rates than the OECD average. By contrast, poverty rates in
the Scandinavian countries (Denmark, Finland, Iceland, Norway and Sweden) are all
lower — sometimes much lower — than the OECD average. Northern European
countries (the Netherlands, Austria, Germany and Belgium) along with France are also
all situated around the OECD average. On the other hand, the Mediterranean countries
(Portugal, Italy, Greece and Spain) all had above-average poverty rates in 2015. Finally,
the Central European countries have relatively low poverty rates, which is not the case
for the Baltic States of Estonia and Latvia — Lithuania is not a member of the OECD but
with 16.5 percent, it has a similar poverty rate to its Baltic neighbors.
17 This broad breakdown corresponds in general terms to the image one has of the
different welfare states and “varieties of capitalism” in the developed world (see
below). Poverty rates are lower on average in the more equal societies in Scandinavia,
followed by countries with traditionally strong welfare states in northern Europe. In
contrast, countries with more limited welfare states in the Mediterranean also have
higher rates of poverty on the whole. As for the Anglophone countries, they stand out
collectively as having liberal welfare states, with minimal state income support for
pensions and unemployment pay, which are backed up by private welfare schemes. The
US stands out strongly as having a very high poverty rate by OECD standards.
Table 2: Poverty Rates in the OECD Countries
Source: OECD Income Distribution Database (IDD). Gini, poverty, income, Methods and Concepts. http://www.oecd.org/social/income-distribution-database.htm
Changes in Official Poverty and Inequality Rates in the Anglophone World in t...
Angles, 8 | 2019
6

18 Table 2 also shows that with relative poverty at the 50% threshold, the impact of the
2007-2008 financial crisis and ensuing Great Recession has been largely absorbed in the
Anglophone world. The figures for 2015 indicate that relative poverty rates are now
lower than in 2007, with the notable exception of Canada, where this measure of the
poverty rate rose from 12.9 percent in 2007 to 14.2 percent in 2015. Canada’s figures are
comparatively high in terms of the OECD average, and their increase has been
substantial.
19 At the same time, Canada and the UK have seen quite clear falls in the percentage of
persons living at or under the “anchored” threshold (in the UK, this percentage fell
from 11.8 percent in 2007 to 9.4 percent in 2015). Other things being equal, fewer
people are therefore living in poverty in real terms, indicating that the effects of the
financial crisis have been mitigated to some degree. In Canada, this likely stems from
the fact that the financial crisis had far less impact on its banking system, and so on
growth. In the UK, government measures to protect pensions mean that incomes of
older people were safeguarded after the crisis. This probably explains much of the
reduction in “anchored” poverty, though it should be noted that young people have
been particularly badly affected by the crisis. The measure of “anchored” poverty is
also particularly telling for Ireland. While Ireland too has seen a fall in the percentage
of persons living under the 50% threshold, the share of persons living at or under the
“anchored” rate actually increased from 7.2 percent in 2007 to 11.4 percent in 2015,
reflecting the huge economic shock experienced by Ireland due to the financial crisis
(Whelan 2013).
Table 3: Inequality Indicators for the OECD countries (Gini coefficient and ratio of top 20 percent tobottom 20 percent)4
Source: OECD Income Distribution Database (IDD). Gini, poverty, income, Methods and Concepts. http://www.oecd.org/social/income-distribution-database.htm
Changes in Official Poverty and Inequality Rates in the Anglophone World in t...
Angles, 8 | 2019
7
20 In terms of child poverty, at the relative 50% measure, Ireland had a comparatively low
rate of child poverty at 9.2 percent in 2014. The UK too was somewhat below the OECD
average (respectively 11.2 percent and 13.1 percent). Relative child poverty rates were
however markedly higher in Canada (17.1 percent) and the United States (19.9 percent).
The United States and Australia also had particularly high relative poverty rates among
the elderly: respectively 20.9 and 25.7 percent, compared to the OECD average of 12.9
percent.
21 Turning to inequality, the Gini coefficient for equivalised disposable household income
indicates that Ireland had a slightly more equal income distribution on this measure in
2015 than the OECD average (respectively 0.298 and 0.317). This distinguishes Ireland
from the other Anglophone countries. Canada at 0.318 was only a little more unequal,
followed by Australia at 0.337. For New Zealand, the Gini coefficient was 0.349, while
the UK was at 0.360 and the US at 0.390. The high Gini coefficients of these last four
countries — Australia, New Zealand, the UK the US — are strong manifestations of the
rise in inequality associated with neoliberalism in the Anglophone world. In all cases,
the Gini coefficient rose substantially from 1980 (roughly the beginning of neoliberal
tax cutting policies) to 2015: up by 0.068 in both Australia and New Zealand, by fully
0.093 in the United Kingdom and by 0.086 in the United States. It should be noted
however that these increases were not uniform. In particular, reviewing global
inequality trends in 2017, François Bourguignon distinguishes countries like the United
States (as well as France, Denmark and Sweden, Israel and Japan) which have
experienced a rising inequality trend, from those which have been characterized by a
“one-step” rise. The latter include the United Kingdom and New Zealand (where
inequality rose strongly in the second half of the 1980s, and then remained largely
unchanged before actually falling somewhat after the financial crisis), and Canada and
Australia (both experiencing their one-step increase in the second half of the 1990s,
and again small drops in the immediate years after the crisis) (Bourguignon 2017).
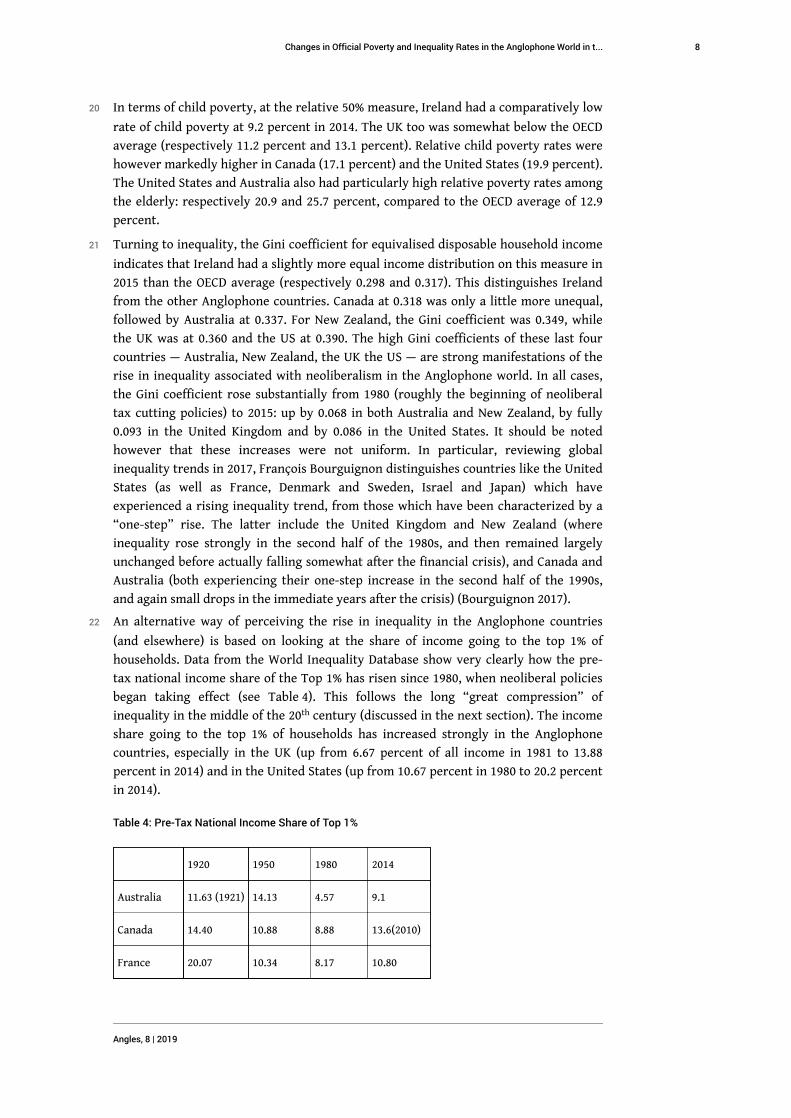
22 An alternative way of perceiving the rise in inequality in the Anglophone countries
(and elsewhere) is based on looking at the share of income going to the top 1% of
households. Data from the World Inequality Database show very clearly how the pre-
tax national income share of the Top 1% has risen since 1980, when neoliberal policies
began taking effect (see Table 4). This follows the long “great compression” of
inequality in the middle of the 20th century (discussed in the next section). The income
share going to the top 1% of households has increased strongly in the Anglophone
countries, especially in the UK (up from 6.67 percent of all income in 1981 to 13.88
percent in 2014) and in the United States (up from 10.67 percent in 1980 to 20.2 percent
in 2014).
Table 4: Pre-Tax National Income Share of Top 1%
1920 1950 1980 2014
Australia 11.63 (1921) 14.13 4.57 9.1
Canada 14.40 10.88 8.88 13.6(2010)
France 20.07 10.34 8.17 10.80
Changes in Official Poverty and Inequality Rates in the Anglophone World in t...
Angles, 8 | 2019
8

Ireland 16.93(1938) 12.92(1943) 6.65 10.50(2009)
New Zealand 11.34(1921) 9.43 5.65 8.09
UK 10.89(1951) 6.67(1981) 13.88
US 18.40 15.88 10.67 20.2
Source: World Inequality Database. http://wid.world/.
The Impact of Neoliberalism on Inequality in theAnglophone Countries
23 The precise impact of neoliberalism on inequality in the Anglophone countries is hard
to measure, given the variety of factors which have affected changes in income and
wealth in these countries, and elsewhere in the world. That said, inequality has risen
more strongly in these countries than in other industrialized nations, and the evidence
provided by the “varieties of capitalism” literature indicates that these English-
speaking countries have implemented neoliberalism more strongly than other
developed nations, consolidating their nature as “liberal market economies”. This
section briefly reviews the concept of neoliberalism, how the strengthening of market
forces and transactions-based economic relationships have contributed to the specific
form of capitalism prevalent in these countries today, and what forces have driven
greater inequality.
The concept of neoliberalism
24 Neoliberalism is a concept that is broad and widely-used to describe the trend in public
policies which emerged from the 1970s onwards, and that have accompanied the
process of globalization. These policies have narrowed the scope of government
intervention in developed and developing economies, while weakening the power of
organized labor in pursuing wage claims and protecting workers’ rights. The policies
include specifically: the deregulation of markets; the shift away from fiscal policy as a
tool for managing demand and supporting employment in favor of monetary policy
aimed primarily at achieving price stability; the privatization and contacting out of
public services; steep tax cuts for top income earners and the shift to regressive
taxation (like VAT and sales taxes); ongoing cuts in corporation tax and the financing
of public deficits through the sale of bonds to private and institutional investors; the
pursuit of international trade liberalization; domestic and international capital market
liberalization, and more generally the financialization of economic activity (i.e. the
expansion of financial services and the transformation of assets into securities and
financial instruments); as well as the deliberate weakening of trade union power,
through anti-union legislation and cuts in numbers of tenured public sector workers.
25 To be sure, these processes have not been uniform across countries. As Jamie Peck
notes, neoliberalism has taken a “zigzagging course”: its path has been strewn with
“policy failures, oppositional pushbacks, and stuttering forms of malregulation”. He
also rightly points out that in many countries total government spending has not much
Changes in Official Poverty and Inequality Rates in the Anglophone World in t...
Angles, 8 | 2019
9

declined as a share of GDP, the State’s powers have been extended in certain areas, and
more generally that markets have always needed the State to enforce the protection of
private property and contracts. Yet Peck also describes how neoliberalism as the
dominant economic ideology and practice reasserted itself fairly quickly after the
financial crisis (Peck 2013). Similarly, David Harvey has argued that neoliberalism has
benefitted from the “uneven geographical developments” of nations, noting that
“competition between territories (states, regions, or cities) as to who had the best
model for economic development or the best business climate… heightened in the more
fluid and open systems of trading relations established after 1970” (Harvey 2005: 87).
Harvey too is skeptical about “extract(ing) some composite picture of a typical
neoliberal state”, yet he notes there are two arenas in particular in which neoliberalism
restores class power. The first concerns the way labor and the environment are treated
as mere commodities, to be subordinated to business interests. The second stems from
how neoliberal states favor the financial system over the well-being of their
populations and environments (ibid: 70-1): an observation he made in the mid-2000,
shortly before the financial crisis and which has turned out to be highly prescient.
Moreover, Harvey points to the privatization of assets as key component of neoliberal
agenda, and the imperative of States to use their power to impose or invent market
mechanisms (ibid: 65). Significantly, he observes that the main “substantive
achievement of neoliberalization” has been to redistribute, rather than generate
wealth and income (ibid: 159). This rapacious nature of neoliberalism is laid bare in
even starker terms by Naomi Klein. In The Shock Doctrine, she argues that “disaster
capitalism” emerged in the 1970s as a comprehensive policy approach to restructuring
societies in states of disaster and shock, following: violent political takeover (Chile
under Pinochet in the 1970s), internal collapse (the Soviet Union and its satellites in
Eastern Europe in the early 1990s), invasion (Iraq in 2003) or natural disasters
(hurricane Katrina in New Orleans, in 2005). Preying on profound societal
disorientation associated with such upheavals, private interests restructured
economies and societies for their own profit. This was (and is) achieved by drawing not
only on neoliberal theory and policy-prescriptions, but also on techniques of psychiatry
(including electro-shocks) experimented in the 1950s to remodel troubled
personalities. Such policies were pursued very visibly in the aptly named, pro-market
“shock therapies” applied to the transition economies of Eastern Europe during the
early 1990s (Klein 2008).
26 Returning to the Anglophone countries, a considerable heterodox economic literature
developed during the 1990s and through to the mid-2000s, examining their political
and economic trajectories, in contrast to developments in other industrialized
countries. In 1990, the Danish sociologist Gøsta Esping-Andersen published his
landmark study on The Three Worlds of Welfare Capitalism, in which he identifies so-called
“liberal welfare states”. These are found in the English-speaking countries, and are
characterized by minimal public social insurance (unemployment support, pensions,
etc.), and incentives for households to subscribe to private health, pension and even
unemployment schemes. A year later and very much in the wake of the fall of the
Berlin Wall, Michel Albert (a senior civil servant turned insurance financier) contrasted
what he called “neo-American capitalism” and “Rhineland capitalism”, in Capitalisme
contre capitalism (1991). Albert specifically pointed to the deepening of stock market
finance for firms and the rise of shareholder capitalism in the 1980s, allied to tax cuts,
deregulation and high military spending as characteristics of the new economic regime
Changes in Official Poverty and Inequality Rates in the Anglophone World in t...
Angles, 8 | 2019
10

established by the Republican Presidency of Ronald Reagan (January 1981 to January
1989). In contrast, Rhineland capitalism — exemplified most clearly by (West) Germany
— was based on stable relationships between companies and their “house banks”, as
well as more stable relationships between firms, their suppliers, their customers and
their employees. Indeed, a notable feature of Rhineland capitalism has been the
involvement of companies in training apprentices and the negotiation of collective
branch agreements between employer organizations and unions. This dichotomy of
models of capitalism was extended in the collective research project and publication
coordinated by Peter Hall and David Soskice: Varieties of Capitalism: The Institutional
Foundations of Comparative Advantage (2001). By investigating the functioning of
companies in a series of economic sectors, the study argues that a basic distinction can
be made between “liberal market economies” (LMEs) and “coordinated market
economies” (CMEs) in terms of five relational spheres: industrial relations, vocational
training and education, corporate governance, inter-firm relations and employees.
Although nuances exist, the Anglophone economies are all identified as LMEs,
characterized by much clearer transaction and market-based relationships than CMEs.
Two distinguishing characteristics of these countries involve the way the financial
rewards of higher education grew during the 1980s and 1990s, while their educational
systems produced quite large minorities of workers with relatively limited skills, even
if overall educational levels were comparatively high.
27 In fact, the evolution of wages for low-skilled workers has been widely noted as a cause
for inequality in the economic literature. In a recent, summary article of global
inequality trends, François Bourguignon notes that “almost by definition, globalization
and technological progress are the most obvious common factors of income
distribution across countries”, and that “[i]n the developed countries, globalization and
skill-based technological progress are certainly responsible for a rise in the share of
total income going to capital and for the slow growth of wages and employment of
unskilled labor” (Bourguignon 2017). For much of the 1980s and 1990s, technological
progress was strongly identified as the main source of rising inequality in the United
States especially, due to skills differentials. Yet with the rise of Chinese exports, trade
competition has played a more important role too. This follows almost mechanically —
as indicated by the theory of international economics — from the way greater
international trade favors the returns on capital as a production factor in rich
countries, either directly or through the geographical relocation of manufacturing via
foreign direct investment or outsourcing to low-wage countries. The financialization
accompanying globalization has further enhanced rewards to capital, including
investment income received by high-income households (specifically of top executives
and leading employees/managers in finance). More specifically, Bourguignon quotes an
OECD study published in 2011 which estimated that — on average — globalization and
technological change explained 40 percent of the increase in the Gini coefficient since
the early 1980s. A further 22 percent of the average increase was due to assortative
mating and changing household composition. Furthermore, among the country-specific
factors aggravating inequality, changes in tax and welfare systems have had the most
direct impact on inequality (Bourguignon 2017).
Changes in Official Poverty and Inequality Rates in the Anglophone World in t...
Angles, 8 | 2019
11

Policy shifts
28 Indeed, tax policy changes have been of fundamental importance in inequality trends
in the Anglophone countries. It is now often forgotten that both the UK and the US
were high-tax countries in the decades after World War II, compared for example to
France and Germany. The top income tax rate in Britain in the 1970s was 83 percent,
and in the US it was 70 percent. Substantial tax cuts by the Thatcher and Reagan
governments then brought the top income tax rates down to 40 percent in the UK and
to 28 percent in the US by 1988, whereas the rates in Germany (56 percent) and France
(57 percent) remained much higher at the time.5 At the beginning of 2018, the top
personal income tax rates were 37 percent in the US,6 45 percent in the UK,7 53 percent
in France,8 and 42 percent in Germany. 9 These figures indicate both a spread of
neoliberalism’s anti-tax policies, yet also continued divergence among countries.
29 The tax-cutting agenda in the UK and US has been largely described as a tax revolt by
the middle classes. It began with the successful referendum in the state of California on
Proposition 13 to cut property taxes in 1978. In the United States, such tax cutting
subsequently became part of the “supply-side” agenda to break with the economic
policies of the past, and which was frequently referred to as “Reaganomics” after
Reagan’s election in 1980. This agenda involved market deregulation, but also the clear
belief that tax cuts would stimulate economic activity and ultimately lead to higher
overall tax revenues, a relationship promoted publicly and visually by Arthur Laffer
and his “Laffer-curve” (Laffer 2004). Allied to the idea that tax cuts would lead to faster
growth and higher tax revenues was the belief that greater wealth (of the rich) would
“trickle down” to the rest of society. Everyone would finally be better off. While the
economics of Thatcherism were not couched in exactly the same terms, the policies of
successive British governments (first Conservative, then New Labour) were based on
similar beliefs: for the Conservatives, cutting taxes would encourage people to work
more and build businesses; for New Labour, strong growth — including the success of
financial services — would provide the tax revenues to fight child poverty and pay tax
credits for low-income families. The same is broadly true wherever neoliberal reforms
have been implemented, especially in the Anglophone world. Thus, the mid-1980s saw
fundamental shifts to neoliberal economic policies in Australia and New Zealand
pushed through by Labor governments elected in both countries in 1984. In Australia,
reforms began by liberalizing international trade through lower tariffs, the removal of
exchange controls and the floating of the exchange. The neoliberal agenda was then
pursued incrementally, throughout the following two decades, affecting all aspects of
the economy (De Brouwer 2003). In New Zealand, reform was led especially by Finance
Minister Roger Douglas who implemented a draconian, rapid neoliberal program of
market deregulation and tax reform, dubbed “Rogernomics”. Subsidies to agriculture
(and industry) were scrapped, as were tariffs, while the top tax rate was gradually
brought down from 66% to 33%. A second sharp wave of reforms to deregulate markets
was subsequently driven through by Ruth Richardson, Finance minister in the National
government of 1990 to 1993, whose policies became known as “Ruthanasia” (Evans
1996). In Canada, reform came later and was pushed mainly to rein in public deficits
and public debt by cutting taxes and decentralizing spending to Canada’s provinces. As
a result of massive fiscal restructuring, the overall government deficit was cut from 6%
of GDP in 1995, to a balanced position by 1997, with surpluses thereafter, leading to
significant downsizing of government and strong pay restraint (Thiessen 2001).
Changes in Official Poverty and Inequality Rates in the Anglophone World in t...
Angles, 8 | 2019
12

30 By contrast, the policy shift in Ireland was more complex and intriguing. While
pursuing a tax-cutting agenda in the late 1980s, tripartite coordination with
management and unions also allowed the authorities to tackle inflation by using an
incomes policy as part of a national development plan. This, together with Ireland’s
increasing integration into the European Union and the inflow of EU monies, paved the
way for Ireland to become the Celtic Tiger in the 1990s. At the same time, the rock-
bottom corporate tax rate of only 12.5% helped lure substantial US high-tech
investment to the country (Whelan 2013).
Forces driving inequality
31 While the dislocations of neoliberal reforms in the Anglophone world during the 1980s
did not bring immediate clear improvements in their economic performance, the
situation changed quite notably from the early 1990s onwards, through to the financial
crisis of 2007-2008. This was a period of long, sustained growth on the whole. Even the
stock market crash of high-tech companies in 2000, followed by conventional falls in
stocks in the wake of 9/11 and a shallow recession in the US in 2001 did not upset this
broadly buoyant picture. These were the heyday years of the Anglo-Saxon economic
model, with even an American “liberal” (i.e. progressive) economist like Paul Krugman
celebrating the “certain je ne sais quoi of les Anglophones” (Krugman 1999). What was less
apparent at the time, however, was the way prosperity in these countries, and
especially the United States, was dependent on household borrowing and rising
property prices. Put simply, financial deregulation had allowed middle-income
households in the United States, in particular, to “eat credit” in order to maintain their
living standards, while their real wages stagnated (Rajan). When the crash came, the
reality of neoliberalism for “middle America” was brutally revealed.
32 More fundamentally, the historical reality of capitalism was subsequently revealed to
the US economics profession with the publishing of Thomas Piketty’s seminal work in
English in 2014, Capital in the Twenty-First Century. While this mammoth investigation
into the long-term dynamics of capitalism had received some media attention in
France, the release of the book in English in spring 2014 turned it into an international
bestseller, with sales topping 1.5 million. Apart from its dazzling assembly of data, the
central thesis of the book is that when operating normally, capitalism inevitably leads
to greater inequality, especially of wealth. This proposition was supported by rigorous
reasoning and long-term trend analyses conducted by Piketty (and his team) which led
to the spectacularly simple conclusion that the real rate of return on capital (r)
generally exceeds the growth rate (g): or in a formula which anyone can understand r >
g. Other things being equal, capital in the hands of the few — including non-working
rentiers — will therefore accumulate at a faster rate than growth and so lead to ever
greater inequality. Moreover, Piketty argues that in periods of high capital values
relative to labor income, the tendency for capital to concentrate is especially strong.
This was the case in the 19th century, as it is again true today, with high real-estate
values in much of the developed world, and high stock market values: Graph 1 shows
the rising share of total wealth held by the top 1%, especially in the United States, and
the typical U-shaped evolution of inequality measures during the 20th century. As the
world was still reeling from the financial crisis, Piketty’s analysis clearly hit its mark.
Changes in Official Poverty and Inequality Rates in the Anglophone World in t...
Angles, 8 | 2019
13

Graph 1: The Share Net Personal Wealth Held by the Top 1% (in percent)
Source: World Inequality Database. http://wid.world/.
33 Piketty’s book therefore explicitly overturned the previously held belief that while
capitalism and industrialization had indeed led to a massive rise of inequality in the
19th century, the 20 th century had experienced falling inequality, especially in the
industrialized nations, but also elsewhere. This apparent behavior of capitalism was
first identified by the economic historian Simon Kuznets, and became known as the
“Kuznets curve”, a bell-shaped curve in which inequality first rises over time, before
subsequently falling. Piketty points out that Kuznets himself was aware that this
optimistic outcome of capitalism was partly empirical and largely speculative. In fact,
Piketty argues that the substantial reduction in inequality for much of the 20th century
had nothing to do with the internal workings of capitalism. Instead, it resulted from
the political shocks of the World Wars and the economic consequences of the Great
Depression. These unusual events led to massive falls in the value of accumulated
capital relative to the output of labor, and hence to falls in the returns on capital
relative to wages. Since the end of the 1970s, however, the slow post-1945 build-up of
capital, along with the liberalization of markets and especially financial markets, have
allowed the historical tendencies of capitalism to reassert themselves. As a result,
inequality is once again rising. The explosion of pay for top managers, which today
combines salaried income with earnings related to stock price movements, is a notable
driver of the present surge in inequality (Piketty 2014: 30-61). This phenomenon has
been especially marked in the Anglophone world, notably the United States and the
United Kingdom. In both these countries, top managers’ overall compensation has
exploded from being twenty or thirty times average workers’ pay in the 1960s and
1970s, to anything up to 200 or 300 times workers’ pay today (Davis and Mishel 2014).
Conclusion
34 Neoliberalism has been a global phenomenon. It emerged first, most clearly in the
United States and the United Kingdom in the late 1970s, coincidentally at a time when
Deng Xiaoping began initiating market-oriented reforms in China. As time went on, and
Changes in Official Poverty and Inequality Rates in the Anglophone World in t...
Angles, 8 | 2019
14

especially following the fall of the Berlin Wall in 1989 and the collapse of Soviet central
planning as an alternative economic system, neoliberal policies have been adopted in
many parts of the world. In the developed world, neoliberal reforms have generally
been strongly pursued in the Anglophone nations, and these countries have all been
clearly identified as “liberal market economies” in the varieties of capitalism literature.
35 One consequence of their stronger pursuit of neoliberalism has been the rise in
inequality observed since 1980 (although Ireland is a notable exception, as its history of
tripartism has likely fostered greater social cohesion, so that its level of disposable
income inequality has remained unchanged). The United States on the other hand
stands out as its levels of income and wealth inequality have soared since the late
1970s. Given that the US makes up 70% of the population of the Anglophone world
studied in this paper, its experience largely dominates this country group. But it is
important not to lose sight of the fact that, while all these countries today have higher
levels of inequality than the OECD average (on the basis of Gini coefficients of their
disposable household incomes), their experiences are varied.
BIBLIOGRAPHY
ACOSS (Australian Council of Social Service) and SPRC (Social Policy Research Centre). “Poverty
in Australia 2016.” 2016. https://www.acoss.org.au/wp-content/uploads/2016/10/Poverty-in-
Australia-2016.pdf
Albert, Michel. Capitalisme contre capitalisme, Paris: Seuil, 1991.
Bourguignon, François. “World changes in inequality: an overview of facts, causes, consequences
and policies.” Monetary and Economic Department. BIS Working Papers, N° 654, August 2017.
Citro, Constance and Michael, Roberts ed. Measuring Poverty: A New Approach, Washington, DC:
National Research Council, 1995.
Davis, Alyssa and Mishel, Lawrence. CEO Pay Continues to Rise as Typical Workers are Paid Less.
Economic Policy Institute, 2014. https://www.epi.org/publication/ceo-pay-continues-to-rise/.
De Brouwer, Gordon. “Economic Reform and Growth in Australia”, Paper prepared for the
Australian Studies Association of Japan Symposium in Nagoya, 2003.
Department of Employment Affairs and Social Protection. Poverty: Measurement and Monitoring.
2016. https://m.welfare.ie/en/Pages/Poverty-Measurement-and-Monitoring.aspx.
Department of Work and Pensions. Households Below Average Income: An analysis of the UK income
distribution: 1994/95-2016/17. https://www.gov.uk/government/uploads/system/uploads/
attachment_data/file/691917/households-below-average-income-1994-1995-2016-2017.pdf.
Esping-Andersen, Gøsta. The Three Worlds of Welfare Capitalism. Cambridge: Polity Press &
Princeton: Princeton UP, 1990.
European Anti Poverty Network Ireland. Relative Poverty Rates. https://www.eapn.ie/poverty/
relative-poverty-rates/.
Changes in Official Poverty and Inequality Rates in the Anglophone World in t...
Angles, 8 | 2019
15

Evans, Lewis et al. “Economic Reform in New Zealand 1984-95: The Pursuit of Efficiency.” Journal
of Economic Literature, XXXIV, 1996: 1856-1902.
Gamble, Andrew. “Governing in the New Hard Times.” L’Observatoire de la société britannique 19,
2017: 31-47.
GOV.UK. “Income Tax rates and Personal Allowances.” https://www.gov.uk/income-tax-rates.
Government of Canada. “A Backgrounder on Poverty in Canada.” 2016. https://www.canada.ca/
en/employment-social-development/programs/poverty-reduction/backgrounder.html.
Hall, Peter and Soskice, David ed. Varieties of Capitalism. The Institutional Foundations of Comparative
Advantage. Oxford: Oxford UP, 2001.
Harvey, David. A Brief History of Neoliberalism. Oxford: OUP, 2005.
Klein, Naomi. The Shock Doctrine: The Rise of Disaster Capitalism. London: Penguin, 2008.
Krugman, Paul. “That certain je ne sais quoi of les Anglophones.” 1999. http://web.mit.edu/
krugman/www/english.html.
Laffer, Arthur. The Laffer Curve: Past, Present, and Future. The Heritage Foundation, 2004. https://
www.heritage.org/taxes/report/the-laffer-curve-past-present-and-future.
McGuinness, Feargal, “Poverty in the UK: statistics.” House of Commons Library: Briefing Paper
7096, 2018. http://researchbriefings.parliament.uk/ResearchBriefing/Summary/
SN07096#fullreport.
Melbourne Institute. “Poverty Lines: Australia, September Quarter 2017.” 2018.https://
melbourneinstitute.unimelb.edu.au/__data/assets/pdf_file/0006/2688099/Poverty-Lines-
Australia-September-2017.pdf.
Milanovic, Branko. Global Inequality: a New Approach for the Age of Globalization, Cambridge,
Massachusetts: Belknap Harvard, 2016.
Ministry of Social Development. “Household incomes in New Zealand: Trends in indicators of
inequality and hardship 1982 to 2016.” Wellington: 2017. https://www.msd.govt.nz/documents/
about-msd-and-our-work/publications-resources/monitoring/household-income-report/
2017/2017-incomes-report-wed-19-july-2017.pdf.
Peck, Jamie. “Explaining (with) Neoliberalism.” Territory, Politics, Governance 1 (2), 2013. DOI:
10.1080/21622671.2013.785365
Piketty, Thomas. Le capital au XXIe siècle. Paris: Seuil, 2013.
Piketty, Thomas. Capital in the Twenty-First Century. Cambridge: Harvard UP, 2014.
Rajan, Raghuram. Fault Lines: How Hidden Fractures Still Threaten the World Economy. Princeton:
Princeton UP, 2011.
Scheidel, Walter. The Great Leveler: Violence and the History of Inequality from the Stone Age to the
Twenty-First Century. Princeton: Princeton UP, 2017.
Semega, Jessica L., Kayla R. Fontenot and Melissa A. Kollar. Income and Poverty in the United States:
2016. Washington, DC: U.S. Government Printing Office, 2017. https://www.census.gov/library/
publications/2017/demo/p60-259.html.
Statistics Canada. “Census in Brief: Children living in low-income households.” http://
www12.statcan.gc.ca/census-recensement/2016/as-sa/98-200-x/2016012/98-200-x2016012-
eng.cfm.
Changes in Official Poverty and Inequality Rates in the Anglophone World in t...
Angles, 8 | 2019
16

Steuerklassen.com. “Spitzensteuersatz.” https://www.steuerklassen.com/steuern/
spitzensteuersatz/.
Thiessen, Gordon. “Canada’s Economic Future: What Have We Learned from the 1990s?” Canadian
Club of Toronto, 2001. https://www.bankofcanada.ca/2001/01/canada-economic-future-what-
have-we-learned/.
Trading Economics. “United States Personal Income Tax Rate.” https://tradingeconomics.com/
united-states/personal-income-tax-rate.
United States Census Bureau. “Poverty Thresholds.” https://www.census.gov/data/tables/time-
series/demo/income-poverty/historical-poverty-thresholds.html.
Whelan, Karl. “Ireland’s Economic Crisis: The Good, the Bad and the Ugly.” University College
Dublin, 2013. http://www.karlwhelan.com/Papers/Whelan-IrelandPaper-June2013.pdf.
Wikipedia. “Barème de l’impôt sur le revenu en France.” https://fr.wikipedia.org/wiki/
Bar%C3%A8mes_de_l%27imp%C3%B4t_sur_le_revenu_en_France.
World Inequality Database. URL: http://wid.world/.
NOTES
1. Both Thomas Piketty in his book (2013) and the WID (http://wid.world/) credit a large team
for creating this database, including the WID Executive Committee of Facundo Alvaredo, Lucas
Chancel, Piketty himself, Emmanuel Saez and Gabriel Zucman, and the late Anthony Atkinson.
2. For the OECD, the standard household of two adults is given a weight of 1 (0.67 for the first
adult and 0.33 for the second adult). Children are then each weighted 0.2, so that a household
with two adults and two children has a weighting, or equivalence value, of 1.4.
3. *The conversion into euros has been done using exchange rates prevailing in early April 2018.
These rates differ from those prevailing in the years indicated. Nor do they reflect purchasing
power parity. The calculations just serve to give a rough indication of the euro equivalent of the
values in the other currencies.
4. The Gini coefficients for 1980 are taken from Walter Scheidel (2017: 406-8). The figures in
brackets indicate other years of available data (e.g., (84) = 1984).
5. The figures here are taken from Thomas Piketty, ibid, Chapter 14. They can all be downloaded
from his webpages at the Paris School of Economics. http://piketty.pse.ens.fr/fr/capital21c.
6. Trading Economics. “United States Personal Income Tax Rate.” https://
tradingeconomics.com/united-states/personal-income-tax-rate.
7. GOV.UK. “Income Tax rates and Personal Allowances.” https://www.gov.uk/income-tax-rates.
8. 45 percent top income tax rate plus the 8 percent CSG. Wikipedia. “Barème de l’impôt sur le
revenu en France”. https://fr.m.wikipedia.org/wiki/
Bar%C3%A8mes_de_l%27imp%C3%B4t_sur_le_revenu_en_France.
9. Steuerklassen.com. “Spitzensteuersatz”, https://www.steuerklassen.com/steuern/
spitzensteuersatz/.
Changes in Official Poverty and Inequality Rates in the Anglophone World in t...
Angles, 8 | 2019
17
ABSTRACTS
This article reviews the evolution of inequality and poverty in the Anglophone countries (the
United States, the United Kingdom, Canada, Australia, New Zealand and Ireland) since the shift to
neoliberal economic policies in the late 1970s. It provides brief summaries of the key definitions
of inequality and poverty, which are separate but related phenomena. The article confirms the
general impression that inequality has risen more quickly in this country group than in other
developed countries. This is especially so for the United States, although Ireland is a notable
exception with unchanged inequality levels. The article goes on to identify key policy
characteristics of neoliberalism which have favoured capital over labour, and how they have
contributed to consolidating the economic structure of these countries as “liberal market
economies”. This in turn has impacted inequality, especially through strong cuts in top income
tax rates.
Cet article examine l'évolution de l'inégalité et de la pauvreté dans les pays anglophones (États-
Unis, Royaume-Uni, Canada, Australie, Nouvelle-Zélande et Irlande) depuis la mise en place des
politiques économiques néolibérales à partir de la fin des années 1970. Il donne un bref résumé
des définitions clés de l'inégalité et de la pauvreté, qui sont des phénomènes distincts mais liés.
L'article confirme l'impression générale selon laquelle les inégalités ont augmenté plus
rapidement dans ce groupe de pays que dans d’autres pays développés. C'est particulièrement le
cas pour les États-Unis. L'Irlande constitue à l’inverse une exception notable, avec des niveaux
d'inégalité inchangés. L'article poursuit en identifiant les principales caractéristiques politiques
du néolibéralisme qui ont favorisé le capital au détriment du travail et comment elles ont
contribué à consolider la structure économique de ces pays en tant qu'"économies de marché
libérales". Ceci a eu un impact sur les inégalités, particulièrement par le biais de fortes
réductions d’impôts pour les tranches supérieures.
INDEX
Keywords: neoliberalism, globalization, taxation, inequality, poverty
Mots-clés: mondialisation, néolibéralisme, fiscalité, inégalité, pauvreté
AUTHOR
NICHOLAS SOWELS
Nicholas Sowels is Associate Professor in English for economics at the Paris 1 Panthéon-Sorbonne
University since 2003. His research in recent years has focused on the causes and consequences
of the 2007-2008 financial crisis, the financial implications of Brexit, as well as other issues
related to the British economy and public policy. Contact: nicholas.sowels[at]univ-paris1.fr
Changes in Official Poverty and Inequality Rates in the Anglophone World in t...
Angles, 8 | 2019
18