changes in upland bird numbers and distribution in the ... · changes in upland bird numbers and...
TRANSCRIPT
GAME & WILDLIFE CONSERVATION TRUST
Changes in upland bird numbers and distribution in the Berwyn Special Protection Area, North Wales
between 1983 and 2012
Philip Warren & David Baines
June 2012 (revised October 2012)
The Game & Wildlife Conservation Trust The Coach House Eggleston Hall Barnard Castle County Durham DL12 0AG Tel: (01833) 651936 E-mail: [email protected]
2
Contents
Contents ........................................................................................................................................................ 2
Summary ....................................................................................................................................................... 3
Acknowledgements ....................................................................................................................................... 4
Introduction .................................................................................................................................................. 5
Methods ........................................................................................................................................................ 8
Study area ................................................................................................................................................. 8
Data sources .............................................................................................................................................. 9
Red grouse surveys ................................................................................................................................... 9
Upland bird surveys ................................................................................................................................ 10
Analyses .................................................................................................................................................. 11
Results ......................................................................................................................................................... 12
Red grouse .............................................................................................................................................. 12
Upland bird surveys ................................................................................................................................ 18
Breeding waders ................................................................................................................................. 18
Passerines ........................................................................................................................................... 21
Corvids ................................................................................................................................................ 23
Raptors ................................................................................................................................................ 25
Gamebirds ........................................................................................................................................... 27
Changes in the ranked abundance of birds in the Berwyn ..................................................................... 29
Trends in relation to conservation status ............................................................................................... 29
Discussion.................................................................................................................................................... 31
References .................................................................................................................................................. 34
3
Summary
The Berwyn Special Protection Area (SPA) supports the most extensive tract of blanket bog and
upland heath in Wales. The site was designated in 1998 as an SPA for its internationally
significant numbers of hen harrier Circus cyaneus, merlin Falco columbarius, peregrine Falco
peregrinus and red kite Milvus milvus, whilst also supporting significant proportions of Welsh
populations of upland breeding waders. Following the Second World War there has been a
decline in grouse moor management in the Berwyn and by the late 1990s driven grouse
shooting had ceased. In this report, we assess changes in the numbers of red grouse and the
abundance of other upland birds in the Berwyn using shooting bag records, grouse count data
collected on four moors between 1995 and 2012; and repeat upland bird surveys in 1983-5 and
2002.
Main findings Between 1983-5 and 2002, lapwing were lost from the Berwyn survey areas, golden
plover declined from 10 birds to one and curlew declined by 79% despite its
conservation designations.
Carrion crow numbers increased six-fold and raven four-fold, with the number of
occupied 1-km2 grid squares doubling and trebling respectively.
Buzzard numbers increased two-fold in abundance and the number of occupied grid
squares increased four-fold. Peregrines also increased seven-fold in abundance,
whilst hen harriers declined by half. There were no significant changes detected in the
abundance of the other SPA designated raptors, merlin and red kite.
Meadow pipits and whinchat doubled and stonechat increased ten-fold between
surveys. Ring ouzel declined by 78% and tree pipit by 50%.
The numbers of red grouse shot in the Berwyn peaked in the early 1900s and then
declined, with driven grouse moor management having ceased by the late 1990s.
Between the upland breeding bird surveys, red grouse numbers declined by 54% and
the occupied range of 1-km2 grid squares fell by 38%.
Grouse count data on four moors collected since 1995 showed that grouse numbers
have remained at low levels on three of the moors, with adult summer densities at
Llanarmon declining from 15 grouse km-2 in 1995 to 3 grouse km-2 in 2009. Summer
densities ranging from 21 grouse km-2 at Llanarmon to 6 grouse km-2 at Vyrnwy.
For black grouse, numbers declined by 78% between the upland breeding bird surveys
and occupied 1-km2 grid squares fell by 28%.
To restore breeding wader populations within the Berwyn, we recommend that
predator control is incorporated as a general tool within agri-environment schemes,
particularly where habitat enhancements through heather burning and appropriate
grazing are being practised.
4
Acknowledgements
We would like to thank the Moorland Association for funding this study. We would also like to
thank the Countryside Council for Wales (CCW) for providing data from the upland bird surveys
undertaken in the Berwyn in 1983-5 and 2002 and to the numerous fieldworkers from CCW and
RSPB who completed the survey work. We would also like to thank all the landowners for
allowing us access to their land to undertake grouse counts in spring and summer and to the
RSPB for providing grouse count data from Vyrnwy. Thanks also to Julie Ewald, Neville Kingdom
and Christopher Wheatley who gave valuable assistance with GIS related issues and to Nicholas
Aebischer for providing National Gamebag Census data for moors within the Berwyn.
5
Introduction
Heather Calluna vulgaris dominated moorland in the uplands of the United Kingdom is of high
international conservation importance for a range of birds species (Thompson et al. 1995). In
Wales, the Berwyn is the most important upland area for breeding birds and was designated as
a Special Protection Area (SPA) in accordance with the European Union Birds Directive (EEC
1979) in 1998 to protect the internationally significant populations of hen harrier Circus
cyaneus, merlin Falco columbarius, peregrine Falco peregrinus and red kite Milvus milvus (Table
1). The Berwyn also supports significant proportions of the Welsh populations of other upland
birds and is designated as a Site of Special Scientific Interest (SSSI) for its upland breeding bird
assemblage, which includes black grouse Tetrao tetrix, red grouse Lagopus lagopus scoticus,
golden plover Pluvialis apricaria, dunlin Calidris alpina, snipe Gallinago gallinago, curlew
Numenius arquata, short-eared owl Asio flammeus, whinchat Saxicola rubetra, stonechat
Saxicola torquata, wheatear Oenanthe oenanthe, ring ouzel Turdus torquatus, raven Corvus
corax and chough Pyrrhocorax pyrrhocorax.
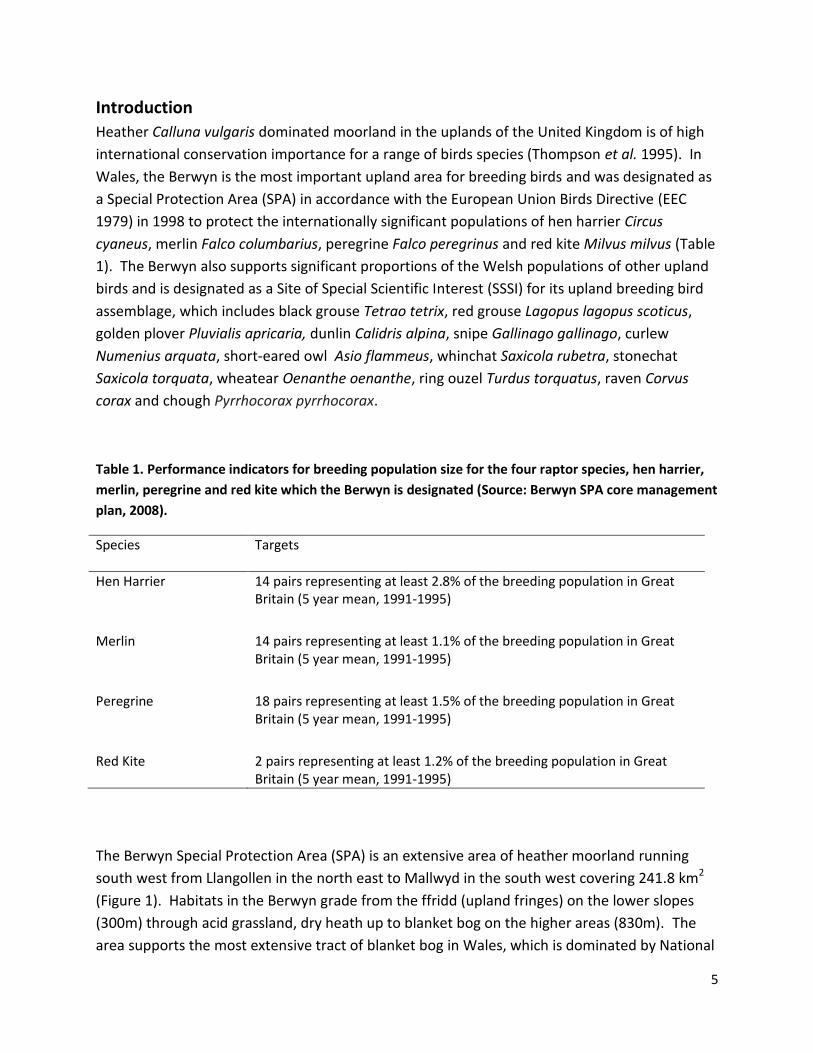
Table 1. Performance indicators for breeding population size for the four raptor species, hen harrier,
merlin, peregrine and red kite which the Berwyn is designated (Source: Berwyn SPA core management
plan, 2008).
Species
Targets
Hen Harrier 14 pairs representing at least 2.8% of the breeding population in Great Britain (5 year mean, 1991-1995)
Merlin 14 pairs representing at least 1.1% of the breeding population in Great Britain (5 year mean, 1991-1995)
Peregrine 18 pairs representing at least 1.5% of the breeding population in Great Britain (5 year mean, 1991-1995)
Red Kite 2 pairs representing at least 1.2% of the breeding population in Great Britain (5 year mean, 1991-1995)
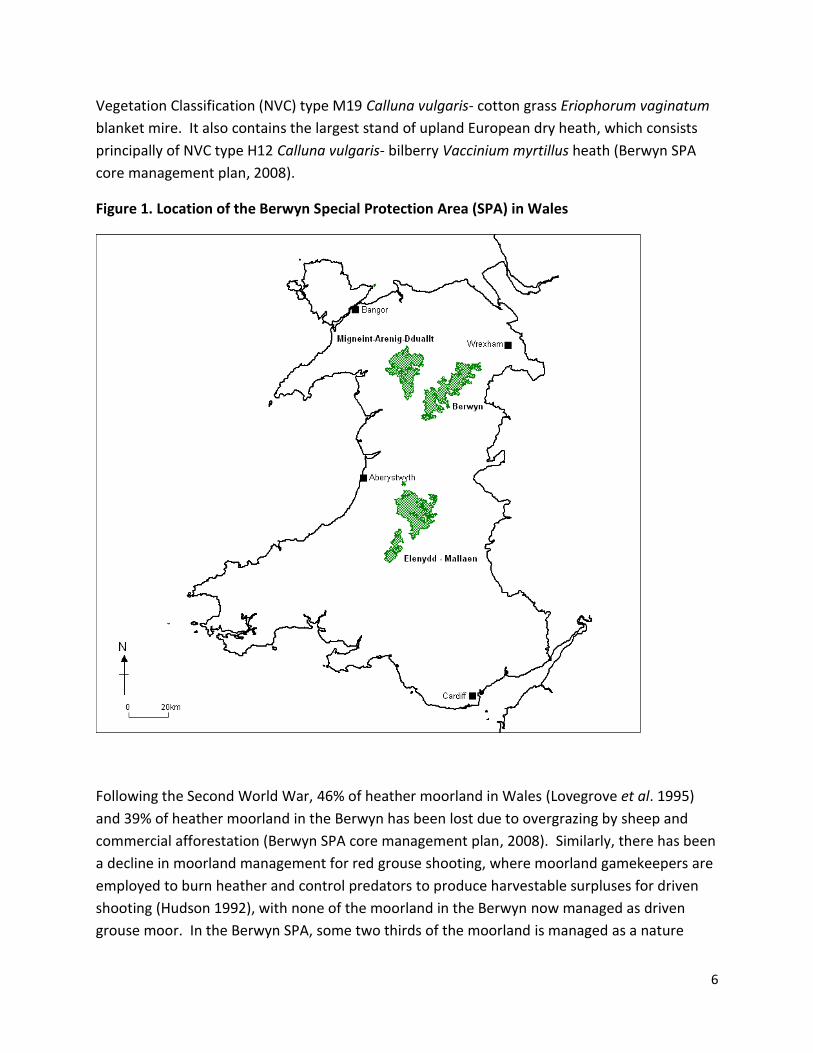
The Berwyn Special Protection Area (SPA) is an extensive area of heather moorland running
south west from Llangollen in the north east to Mallwyd in the south west covering 241.8 km2
(Figure 1). Habitats in the Berwyn grade from the ffridd (upland fringes) on the lower slopes
(300m) through acid grassland, dry heath up to blanket bog on the higher areas (830m). The
area supports the most extensive tract of blanket bog in Wales, which is dominated by National
6
Vegetation Classification (NVC) type M19 Calluna vulgaris- cotton grass Eriophorum vaginatum
blanket mire. It also contains the largest stand of upland European dry heath, which consists
principally of NVC type H12 Calluna vulgaris- bilberry Vaccinium myrtillus heath (Berwyn SPA
core management plan, 2008).
Figure 1. Location of the Berwyn Special Protection Area (SPA) in Wales
Following the Second World War, 46% of heather moorland in Wales (Lovegrove et al. 1995)
and 39% of heather moorland in the Berwyn has been lost due to overgrazing by sheep and
commercial afforestation (Berwyn SPA core management plan, 2008). Similarly, there has been
a decline in moorland management for red grouse shooting, where moorland gamekeepers are
employed to burn heather and control predators to produce harvestable surpluses for driven
shooting (Hudson 1992), with none of the moorland in the Berwyn now managed as driven
grouse moor. In the Berwyn SPA, some two thirds of the moorland is managed as a nature
7
reserve by Severn Trent Water/ Royal Society for the Protection of Birds at Vyrnwy and by the
Countryside Council for Wales (CCW) at Pale. On the remaining moors, the less intensive
walked-up grouse shooting is now only practised (Sotherton et al. 2009). In this study we
assess the changes in the abundance of red grouse and a suite of other upland breeding birds in
the Berwyn SPA from red grouse shooting bag records, grouse counts conducted on 16, 1-km2
blocks on four moors between 1995 and 2012 and from a repeat upland bird survey across 107,
1-km2 grid squares in 1983-5 and 2002 (Sim et al. 2005).

8
Methods
Study area
The Berwyn covers 241.8 km2 of upland North Wales, designated as a SPA, SSSI and a Special
Area of Conservation (SAC). The largest landholding here is the 100.8 km2 Severn Trent Water/
RSPB Vyrnwy Estate, which includes 42 km2 of the Berwyn National Nature Reserve (NNR)
(Figure 2). The second largest holding is the 38 km2 Pale Moor NNR managed by CCW. The
remainder of the Berwyn SPA is managed privately, with the main landholdings being the
Llanarmon Estate covering 31.4 km2 and the Carrog (5.8 km2), Nantyr (9.4 km2) and Vivod (7.0
km2) estates. Grouse count data were also available from Ruabon, which although not within
the Berwyn SPA were included in the analyses as the moor lies adjacent to the north east
(Figure 2) and is within the same SAC.
Figure 2. Distribution of the main landholdings within the Berwyn SPA
9
Data sources
Upland bird survey data from the Berwyn SPA in 1983-5 and 2002 were sourced under licence
from Countryside Council for Wales (CCW). Red grouse bag data were extracted from the
GWCT’s National Gamebag Census (NGC) which collects shooting bag returns annually from
over 600 estates in the UK (Tapper 1992) for moors with returns from the Berwyn. Red grouse
count data between 1995 and 2000 were collected as part of The Welsh Grouse Project, a
partnership project between GWCT, CCW and RSPB. Subsequent grouse counts were
undertaken on Llanarmon, Pale and Ruabon periodically by GWCT and by the RSPB at Vyrnwy.
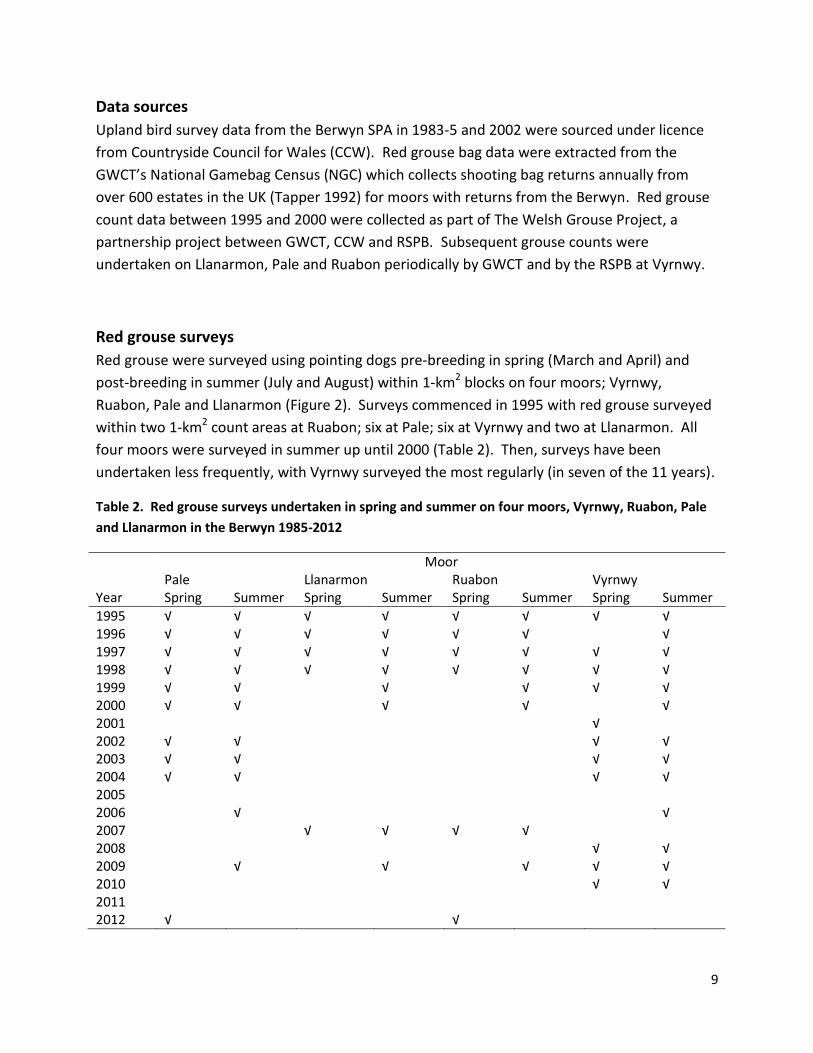
Red grouse surveys
Red grouse were surveyed using pointing dogs pre-breeding in spring (March and April) and
post-breeding in summer (July and August) within 1-km2 blocks on four moors; Vyrnwy,
Ruabon, Pale and Llanarmon (Figure 2). Surveys commenced in 1995 with red grouse surveyed
within two 1-km2 count areas at Ruabon; six at Pale; six at Vyrnwy and two at Llanarmon. All
four moors were surveyed in summer up until 2000 (Table 2). Then, surveys have been
undertaken less frequently, with Vyrnwy surveyed the most regularly (in seven of the 11 years).
Table 2. Red grouse surveys undertaken in spring and summer on four moors, Vyrnwy, Ruabon, Pale
and Llanarmon in the Berwyn 1985-2012
Moor Pale Llanarmon Ruabon Vyrnwy Year Spring Summer Spring Summer Spring Summer Spring Summer
1995 √ √ √ √ √ √ √ √ 1996 √ √ √ √ √ √ √ 1997 √ √ √ √ √ √ √ √ 1998 √ √ √ √ √ √ √ √ 1999 √ √ √ √ √ √ 2000 √ √ √ √ √ 2001 √ 2002 √ √ √ √ 2003 √ √ √ √ 2004 √ √ √ √ 2005 2006 √ √ 2007 √ √ √ √ 2008 √ √ 2009 √ √ √ √ √ 2010 √ √ 2011 2012 √ √

10
Upland bird surveys
We assessed upland bird survey data collected in the Berwyn SPA within 107, 1-km2 grid
squares (Figure 3) grouped by CCW/RSPB into 14 plots for reporting purposes which were
surveyed in 1983-5 and then again in 2002. In 1983, 22, 1-km2 squares were surveyed, with a
further 52 in 1984 and 33 in 1985, with all repeated in 2002. Parallel line transects were walked
across the study plots with two observers spaced at 200m apart. Surveys were undertaken
between 08.30 and 18.00 hours BST to avoid the main periods of rapidly changing bird activity
(Reed et al. 1985). All bird sightings were mapped on to 1:10000 or 1:25000 maps using
standard behaviour codes. Surveys were not carried out in high winds greater than 35
km/hour, heavy rain or poor visibility. Repeat surveys in 2002 were undertaken within seven
days of the original survey dates with all surveyors received training in the survey technique
used to allow comparability between surveys (Sim et al. 2005).
Figure 3. Location of the upland bird survey 1-km2 squares in the Berwyn SPA surveyed in 1983-5 and repeated in 2002

11
Analyses
Differences in red grouse spring and summer densities and breeding productivity between
moors and years were tested using ANOVA. Changes in red grouse abundance in spring and
summer between 1995 and 2012 were assessed using linear regression. Data were not
available from counts in spring and summer on all moors in all years (Table 2) therefore to
assess whether red grouse populations were in decline or were just at different stages within a
natural cycle (Hudson 1992) we increased the sample size by calculating adult summer densities
for those years with only spring count data available. Adult summer densities were estimated
through calculating a mean breeding season loss rate (change in numbers of adults between
spring and summer counts) calculated from all moors where spring and summer data were
available.
The analyses of breeding bird abundance were based on the maximum count from one of the
two visits. Counts of flocks of waders (five or more) were excluded. We tested for significant
differences only where the measure abundance was 30 or more in either the original or repeat
survey. We assessed changes in the numbers of breeding birds between surveys in 1983-85
and 2002 using Generalised Linear Models (GLM) with a Poisson error distribution and a
logarithm link function in Genstat 11 (VSN international Ltd). All birds were counted in both
survey years, with the exception of skylark and meadow pipit which were only counted across
both periods in six of the 14 study plots.

12
Results
Red grouse
National Gamebag Census
Long term red grouse bag data were available from four moors in the Berwyn 1880-2010. In
the early 1900s the numbers of red grouse shot peaked on one moor at 282 grouse shot km-2
but then subsequently declined (Figure 4), with little shooting during the Second World War.
Following the Second World War the numbers shot increased on three of the moors, peaking in
the 1970s at 82 grouse km-2 but by the early 1990s grouse were infrequently shot on all four
moors.
Figure 4. Numbers of red grouse shot km-2 on four moors in the Berwyn 1880-2010
0
50
100
150
200
250
300
Gro
use
sh
ot
km-2
13
In 1994, a survey to establish the extent and management of grouse moors in Wales (CCW
unpublished report) identified ten grouse moors in the Berwyn, with data available for nine.
Gamekeepers were employed on five moors (four part-time and one full-time), with the other
four unkeepered. Two moors shot driven grouse, five shot grouse walked up, whilst grouse
were no longer shot on the remaining two moors. By the late 1990s, driven grouse moor
management in the Berwyn had effectively ceased (Offord 2002, Whitfield & Fielding 2009).
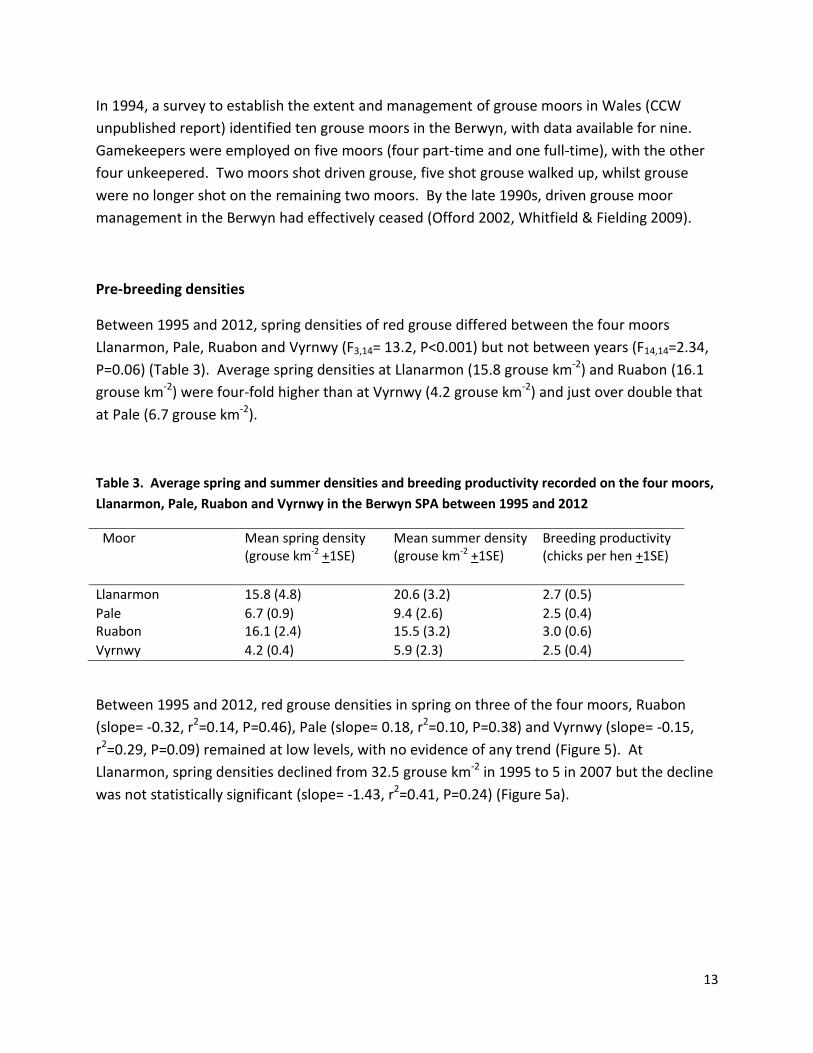
Pre-breeding densities
Between 1995 and 2012, spring densities of red grouse differed between the four moors
Llanarmon, Pale, Ruabon and Vyrnwy (F3,14= 13.2, P<0.001) but not between years (F14,14=2.34,
P=0.06) (Table 3). Average spring densities at Llanarmon (15.8 grouse km-2) and Ruabon (16.1
grouse km-2) were four-fold higher than at Vyrnwy (4.2 grouse km-2) and just over double that
at Pale (6.7 grouse km-2).
Table 3. Average spring and summer densities and breeding productivity recorded on the four moors,
Llanarmon, Pale, Ruabon and Vyrnwy in the Berwyn SPA between 1995 and 2012
Moor Mean spring density (grouse km-2 +1SE)
Mean summer density (grouse km-2 +1SE)
Breeding productivity (chicks per hen +1SE)
Llanarmon 15.8 (4.8) 20.6 (3.2) 2.7 (0.5)
Pale 6.7 (0.9) 9.4 (2.6) 2.5 (0.4) Ruabon 16.1 (2.4) 15.5 (3.2) 3.0 (0.6)
Vyrnwy 4.2 (0.4) 5.9 (2.3) 2.5 (0.4)
Between 1995 and 2012, red grouse densities in spring on three of the four moors, Ruabon
(slope= -0.32, r2=0.14, P=0.46), Pale (slope= 0.18, r2=0.10, P=0.38) and Vyrnwy (slope= -0.15,
r2=0.29, P=0.09) remained at low levels, with no evidence of any trend (Figure 5). At
Llanarmon, spring densities declined from 32.5 grouse km-2 in 1995 to 5 in 2007 but the decline
was not statistically significant (slope= -1.43, r2=0.41, P=0.24) (Figure 5a).
14
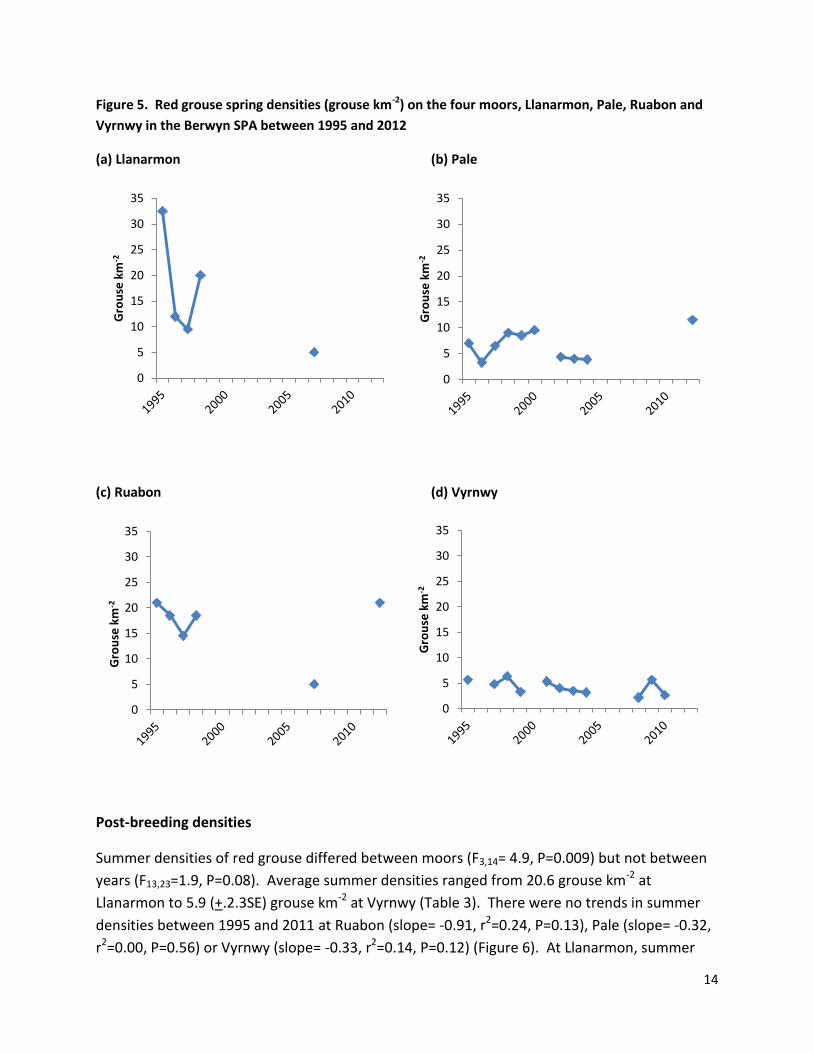
Figure 5. Red grouse spring densities (grouse km-2) on the four moors, Llanarmon, Pale, Ruabon and
Vyrnwy in the Berwyn SPA between 1995 and 2012
(a) Llanarmon (b) Pale
(c) Ruabon (d) Vyrnwy
Post-breeding densities
Summer densities of red grouse differed between moors (F3,14= 4.9, P=0.009) but not between
years (F13,23=1.9, P=0.08). Average summer densities ranged from 20.6 grouse km-2 at
Llanarmon to 5.9 (+.2.3SE) grouse km-2 at Vyrnwy (Table 3). There were no trends in summer
densities between 1995 and 2011 at Ruabon (slope= -0.91, r2=0.24, P=0.13), Pale (slope= -0.32,
r2=0.00, P=0.56) or Vyrnwy (slope= -0.33, r2=0.14, P=0.12) (Figure 6). At Llanarmon, summer
0
5
10
15
20
25
30
35
Gro
use
km
-2
0
5
10
15
20
25
30
35
Gro
use
km
-2
0
5
10
15
20
25
30
35
Gro
use
km
-2
0
5
10
15
20
25
30
35
Gro
use
km
-2

15
densities declined from 59.5 grouse km-2 in 1995 to 8 in 2009, but the decline was not
statistically significant (slope= -2.32, r2=0.47, P=0.06) (Figure 6a).
Figure 6. Red grouse summer densities (grouse km-2) on the four moors Llanarmon, Pale, Ruabon and
Vyrnwy in the Berwyn SPA between 1995 and 2011
(a) Llanarmon (b) Pale
(c) Ruabon (d) Vyrnwy
0
10
20
30
40
50
60
70
Gro
use
km
-2
0
10
20
30
40
50
60
70
Gro
use
km
-2
0
10
20
30
40
50
60
70
Gro
use
km
-2
0
10
20
30
40
50
60
70
Gro
use
km
-2
16
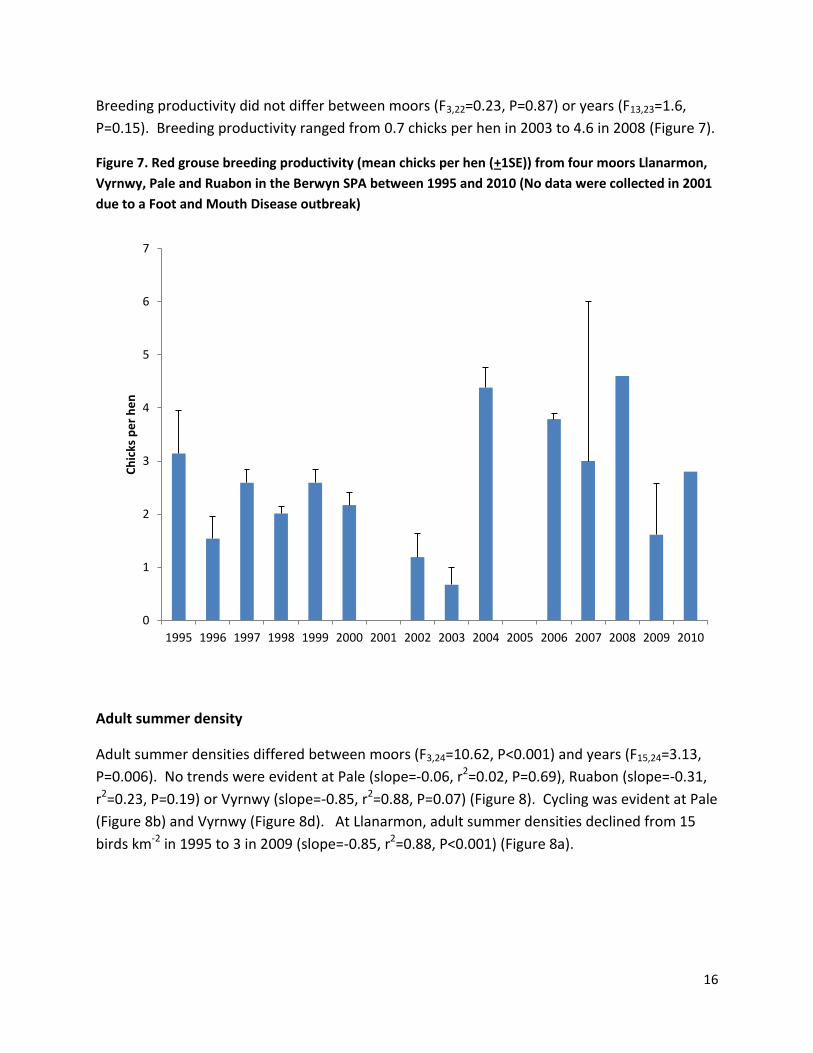
Breeding productivity did not differ between moors (F3,22=0.23, P=0.87) or years (F13,23=1.6,
P=0.15). Breeding productivity ranged from 0.7 chicks per hen in 2003 to 4.6 in 2008 (Figure 7).
Figure 7. Red grouse breeding productivity (mean chicks per hen (+1SE)) from four moors Llanarmon,
Vyrnwy, Pale and Ruabon in the Berwyn SPA between 1995 and 2010 (No data were collected in 2001
due to a Foot and Mouth Disease outbreak)
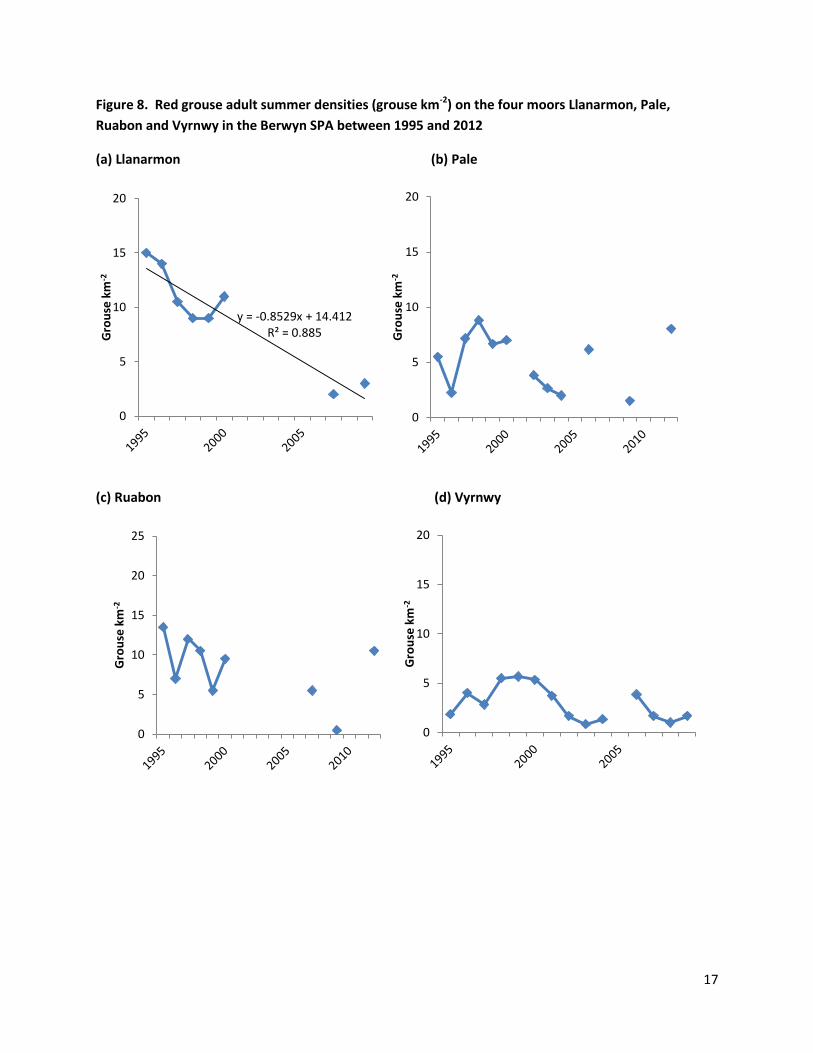
Adult summer density
Adult summer densities differed between moors (F3,24=10.62, P<0.001) and years (F15,24=3.13,
P=0.006). No trends were evident at Pale (slope=-0.06, r2=0.02, P=0.69), Ruabon (slope=-0.31,
r2=0.23, P=0.19) or Vyrnwy (slope=-0.85, r2=0.88, P=0.07) (Figure 8). Cycling was evident at Pale
(Figure 8b) and Vyrnwy (Figure 8d). At Llanarmon, adult summer densities declined from 15
birds km-2 in 1995 to 3 in 2009 (slope=-0.85, r2=0.88, P<0.001) (Figure 8a).
0
1
2
3
4
5
6
7
1995 1996 1997 1998 1999 2000 2001 2002 2003 2004 2005 2006 2007 2008 2009 2010
Ch
icks
pe
r h
en
17
Figure 8. Red grouse adult summer densities (grouse km-2) on the four moors Llanarmon, Pale,
Ruabon and Vyrnwy in the Berwyn SPA between 1995 and 2012
(a) Llanarmon (b) Pale
(c) Ruabon (d) Vyrnwy
y = -0.8529x + 14.412 R² = 0.885
0
5
10
15
20
Gro
use
km
-2
0
5
10
15
20
Gro
use
km
-2
0
5
10
15
20
25
Gro
use
km
-2
0
5
10
15
20
Gro
use
km
-2
18
Upland bird surveys
Breeding waders
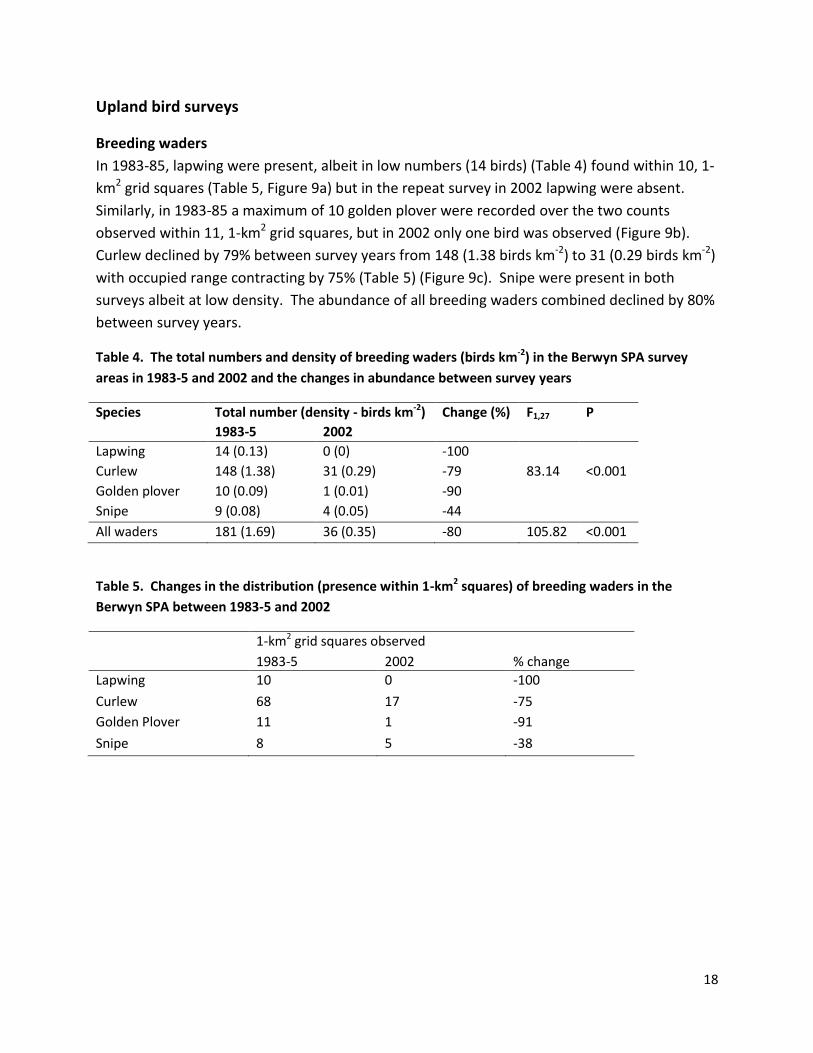
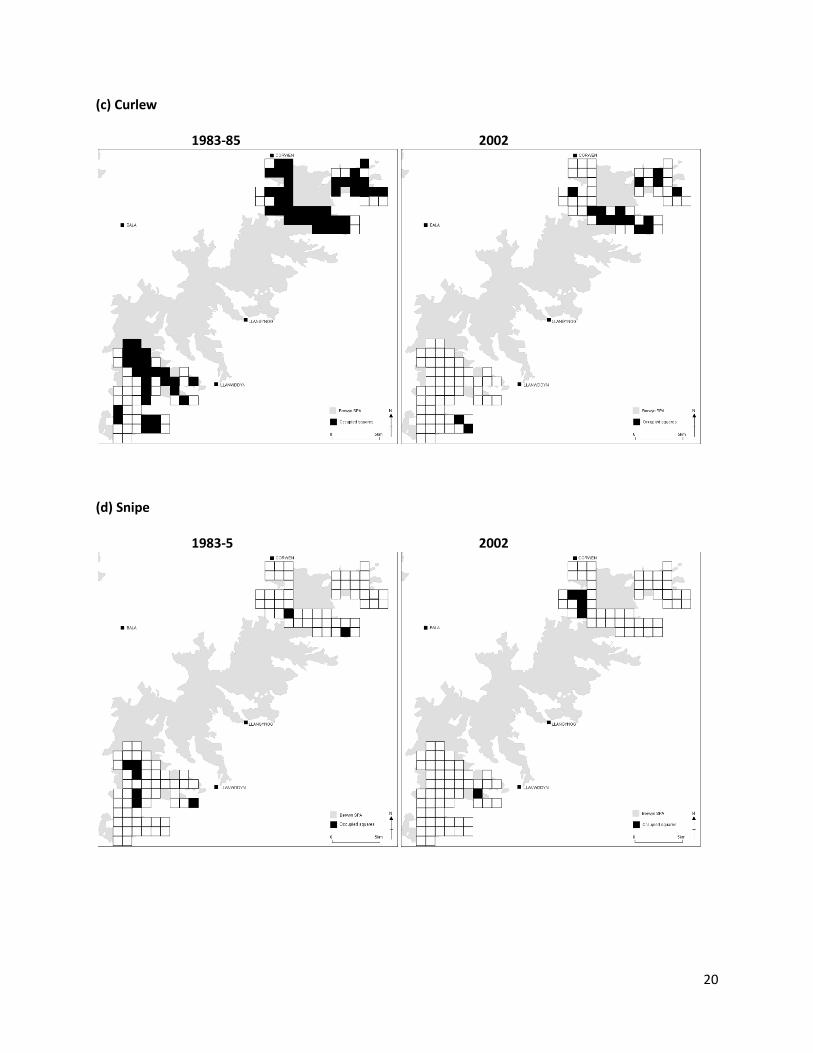
In 1983-85, lapwing were present, albeit in low numbers (14 birds) (Table 4) found within 10, 1-
km2 grid squares (Table 5, Figure 9a) but in the repeat survey in 2002 lapwing were absent.
Similarly, in 1983-85 a maximum of 10 golden plover were recorded over the two counts
observed within 11, 1-km2 grid squares, but in 2002 only one bird was observed (Figure 9b).
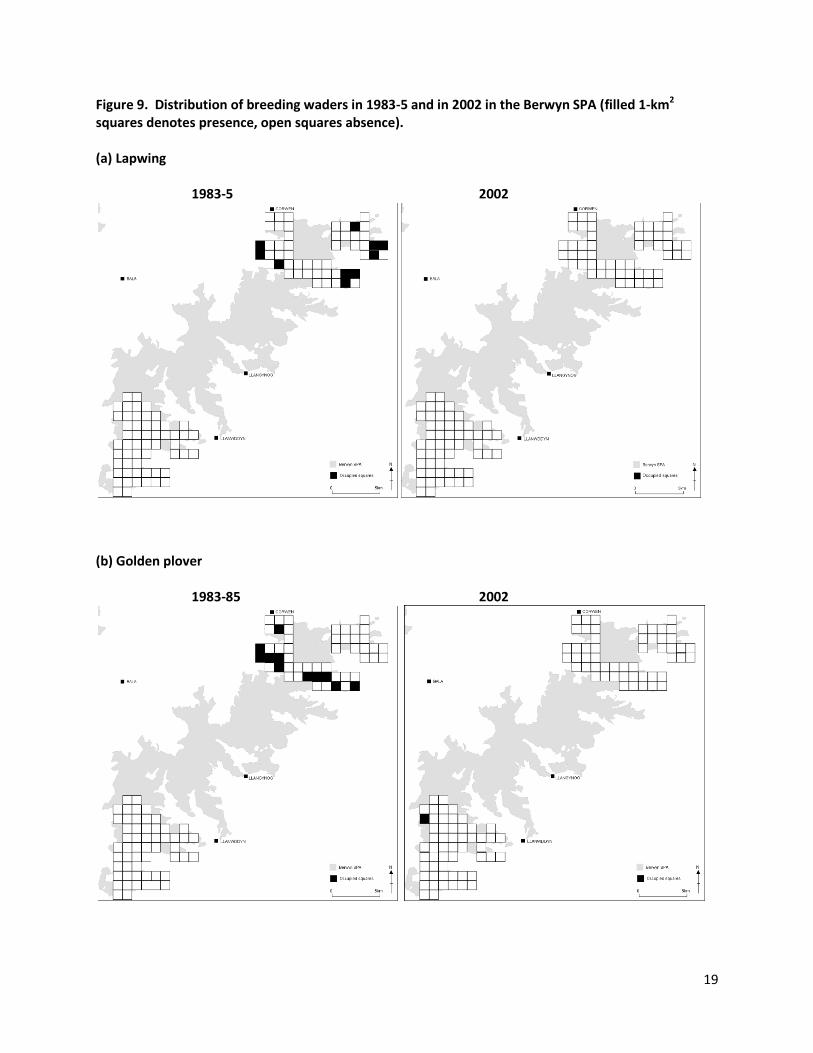
Curlew declined by 79% between survey years from 148 (1.38 birds km-2) to 31 (0.29 birds km-2)
with occupied range contracting by 75% (Table 5) (Figure 9c). Snipe were present in both
surveys albeit at low density. The abundance of all breeding waders combined declined by 80%
between survey years.
Table 4. The total numbers and density of breeding waders (birds km-2) in the Berwyn SPA survey
areas in 1983-5 and 2002 and the changes in abundance between survey years
Species Total number (density - birds km-2) Change (%) F1,27 P
1983-5 2002
Lapwing 14 (0.13) 0 (0) -100
Curlew 148 (1.38) 31 (0.29) -79 83.14 <0.001
Golden plover 10 (0.09) 1 (0.01) -90
Snipe 9 (0.08) 4 (0.05) -44
All waders 181 (1.69) 36 (0.35) -80 105.82 <0.001
Table 5. Changes in the distribution (presence within 1-km2 squares) of breeding waders in the
Berwyn SPA between 1983-5 and 2002
1-km2 grid squares observed
1983-5 2002 % change
Lapwing 10 0 -100
Curlew 68 17 -75
Golden Plover 11 1 -91
Snipe 8 5 -38
19
Figure 9. Distribution of breeding waders in 1983-5 and in 2002 in the Berwyn SPA (filled 1-km2 squares denotes presence, open squares absence). (a) Lapwing
1983-5 2002
(b) Golden plover
1983-85 2002
20
(c) Curlew
1983-85 2002
(d) Snipe
1983-5 2002
21
Passerines
Moorland specialists
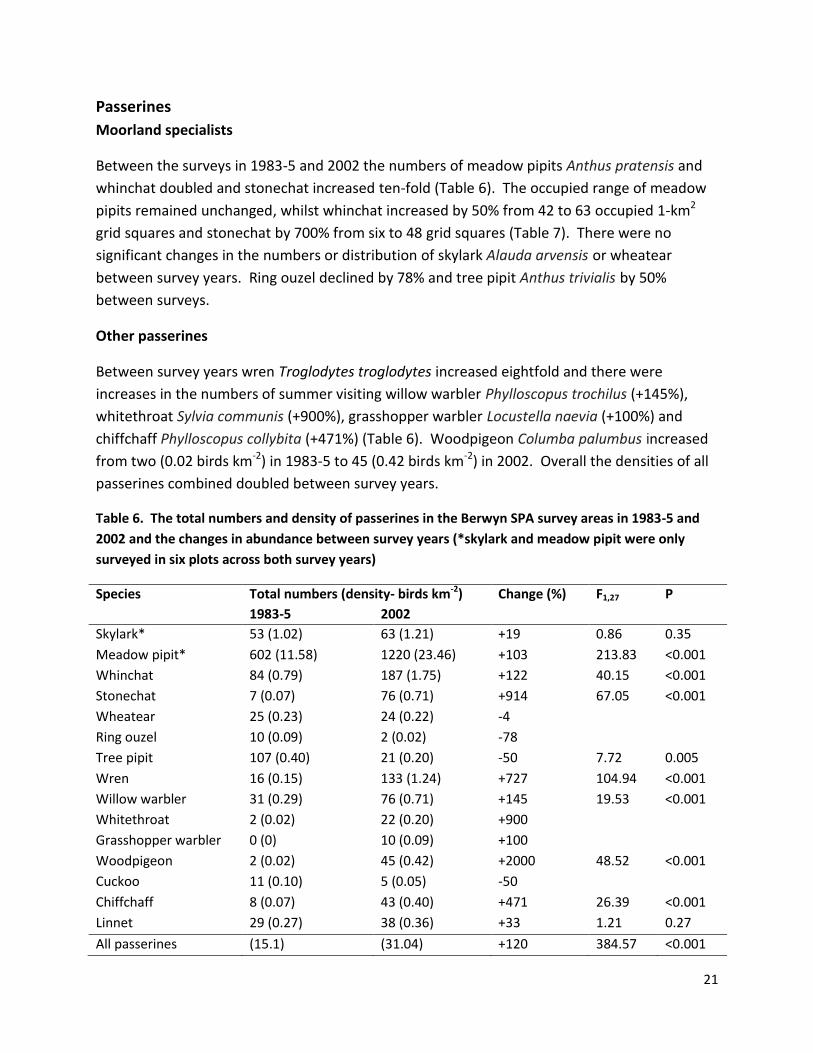
Between the surveys in 1983-5 and 2002 the numbers of meadow pipits Anthus pratensis and
whinchat doubled and stonechat increased ten-fold (Table 6). The occupied range of meadow
pipits remained unchanged, whilst whinchat increased by 50% from 42 to 63 occupied 1-km2
grid squares and stonechat by 700% from six to 48 grid squares (Table 7). There were no
significant changes in the numbers or distribution of skylark Alauda arvensis or wheatear
between survey years. Ring ouzel declined by 78% and tree pipit Anthus trivialis by 50%
between surveys.
Other passerines
Between survey years wren Troglodytes troglodytes increased eightfold and there were
increases in the numbers of summer visiting willow warbler Phylloscopus trochilus (+145%),
whitethroat Sylvia communis (+900%), grasshopper warbler Locustella naevia (+100%) and
chiffchaff Phylloscopus collybita (+471%) (Table 6). Woodpigeon Columba palumbus increased
from two (0.02 birds km-2) in 1983-5 to 45 (0.42 birds km-2) in 2002. Overall the densities of all
passerines combined doubled between survey years.
Table 6. The total numbers and density of passerines in the Berwyn SPA survey areas in 1983-5 and
2002 and the changes in abundance between survey years (*skylark and meadow pipit were only
surveyed in six plots across both survey years)
Species Total numbers (density- birds km-2) Change (%) F1,27 P
1983-5 2002
Skylark* 53 (1.02) 63 (1.21) +19 0.86 0.35
Meadow pipit* 602 (11.58) 1220 (23.46) +103 213.83 <0.001
Whinchat 84 (0.79) 187 (1.75) +122 40.15 <0.001
Stonechat 7 (0.07) 76 (0.71) +914 67.05 <0.001
Wheatear 25 (0.23) 24 (0.22) -4
Ring ouzel 10 (0.09) 2 (0.02) -78
Tree pipit 107 (0.40) 21 (0.20) -50 7.72 0.005
Wren 16 (0.15) 133 (1.24) +727 104.94 <0.001
Willow warbler 31 (0.29) 76 (0.71) +145 19.53 <0.001
Whitethroat 2 (0.02) 22 (0.20) +900
Grasshopper warbler 0 (0) 10 (0.09) +100
Woodpigeon 2 (0.02) 45 (0.42) +2000 48.52 <0.001
Cuckoo 11 (0.10) 5 (0.05) -50
Chiffchaff 8 (0.07) 43 (0.40) +471 26.39 <0.001
Linnet 29 (0.27) 38 (0.36) +33 1.21 0.27
All passerines (15.1) (31.04) +120 384.57 <0.001
22
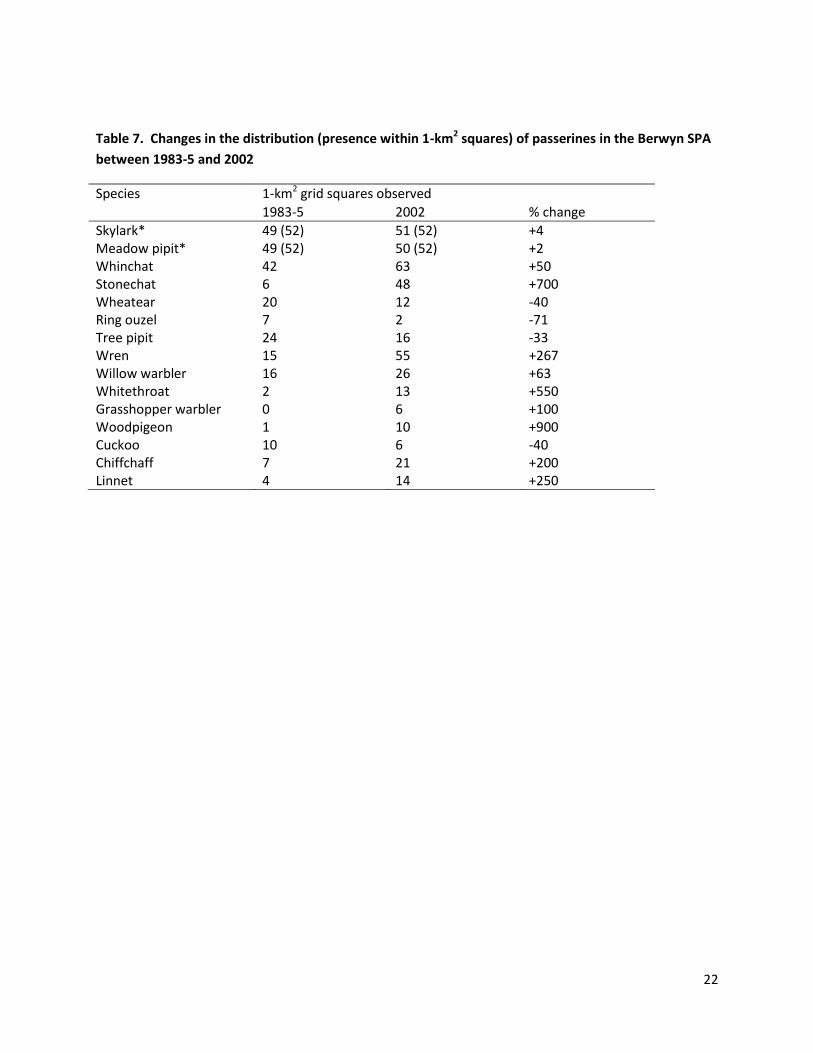
Table 7. Changes in the distribution (presence within 1-km2 squares) of passerines in the Berwyn SPA
between 1983-5 and 2002
Species 1-km2 grid squares observed
1983-5 2002 % change
Skylark* 49 (52) 51 (52) +4 Meadow pipit* 49 (52) 50 (52) +2 Whinchat 42 63 +50 Stonechat 6 48 +700 Wheatear 20 12 -40 Ring ouzel 7 2 -71 Tree pipit 24 16 -33 Wren 15 55 +267 Willow warbler 16 26 +63 Whitethroat 2 13 +550 Grasshopper warbler 0 6 +100 Woodpigeon 1 10 +900 Cuckoo 10 6 -40 Chiffchaff 7 21 +200 Linnet 4 14 +250
23
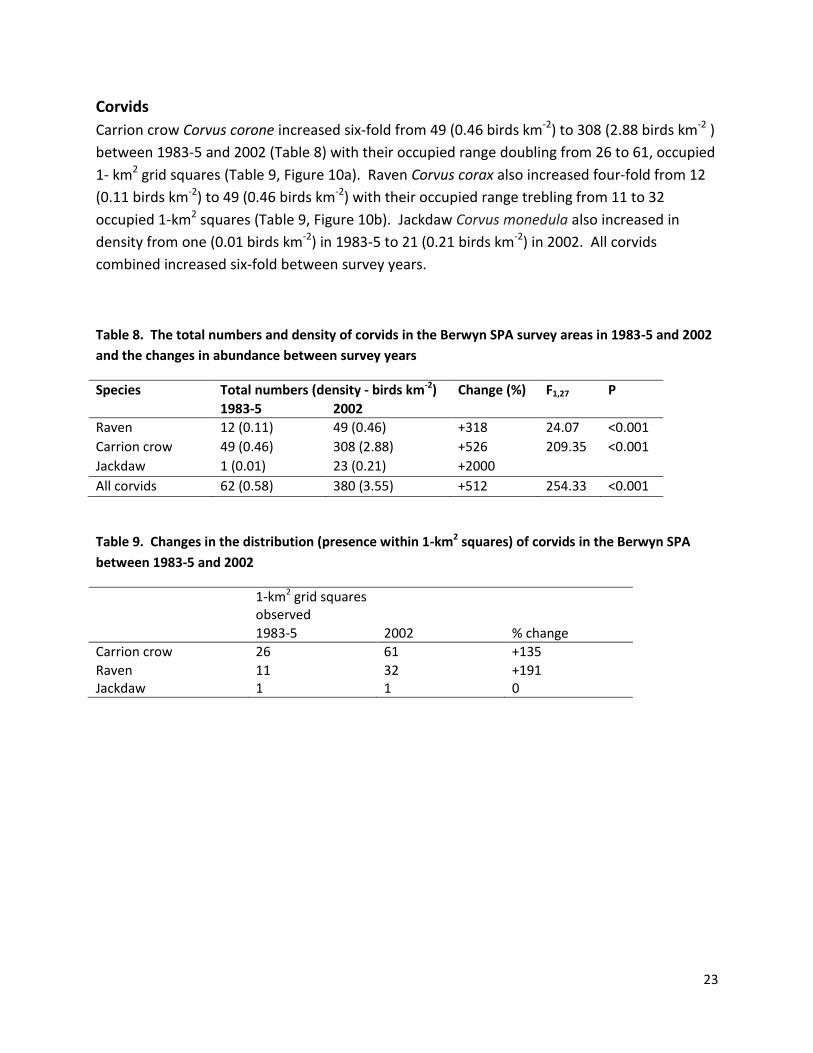
Corvids
Carrion crow Corvus corone increased six-fold from 49 (0.46 birds km-2) to 308 (2.88 birds km-2 )
between 1983-5 and 2002 (Table 8) with their occupied range doubling from 26 to 61, occupied
1- km2 grid squares (Table 9, Figure 10a). Raven Corvus corax also increased four-fold from 12
(0.11 birds km-2) to 49 (0.46 birds km-2) with their occupied range trebling from 11 to 32
occupied 1-km2 squares (Table 9, Figure 10b). Jackdaw Corvus monedula also increased in
density from one (0.01 birds km-2) in 1983-5 to 21 (0.21 birds km-2) in 2002. All corvids
combined increased six-fold between survey years.
Table 8. The total numbers and density of corvids in the Berwyn SPA survey areas in 1983-5 and 2002
and the changes in abundance between survey years
Species Total numbers (density - birds km-2) Change (%) F1,27 P
1983-5 2002
Raven 12 (0.11) 49 (0.46) +318 24.07 <0.001
Carrion crow 49 (0.46) 308 (2.88) +526 209.35 <0.001
Jackdaw 1 (0.01) 23 (0.21) +2000
All corvids 62 (0.58) 380 (3.55) +512 254.33 <0.001
Table 9. Changes in the distribution (presence within 1-km2 squares) of corvids in the Berwyn SPA
between 1983-5 and 2002
1-km2 grid squares observed
1983-5 2002 % change
Carrion crow 26 61 +135
Raven 11 32 +191 Jackdaw 1 1 0
24
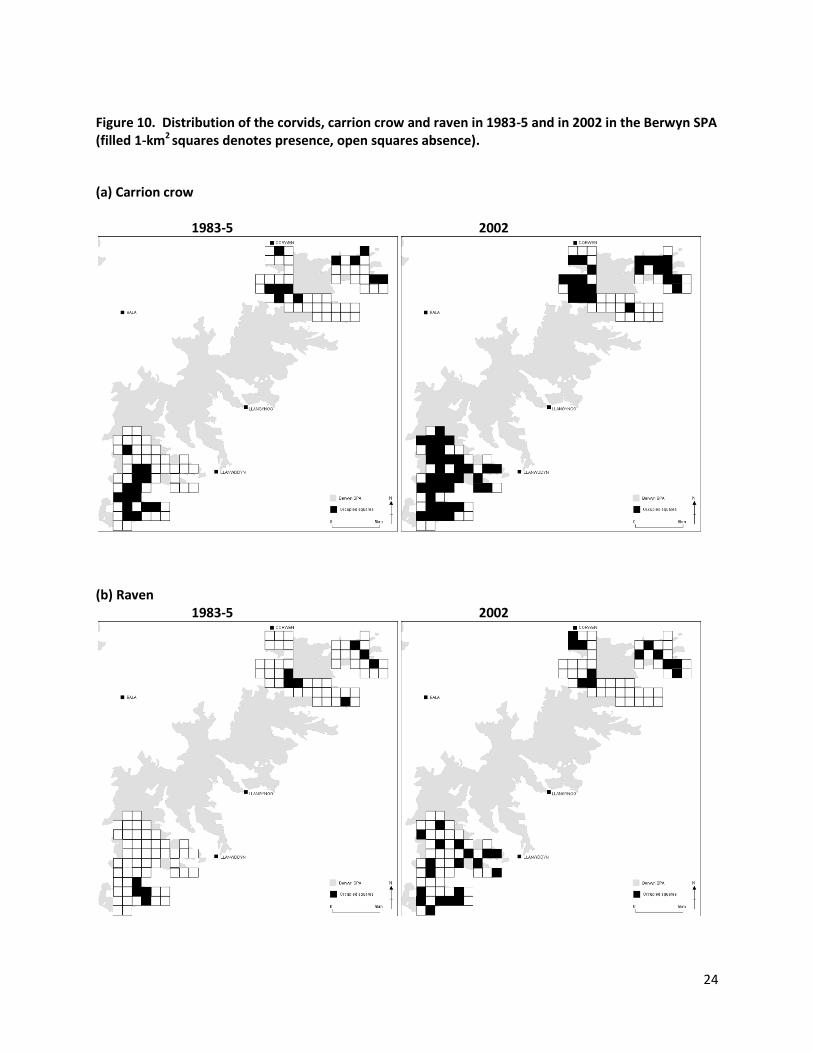
Figure 10. Distribution of the corvids, carrion crow and raven in 1983-5 and in 2002 in the Berwyn SPA (filled 1-km2 squares denotes presence, open squares absence).
(a) Carrion crow
1983-5 2002
(b) Raven
1983-5 2002
25
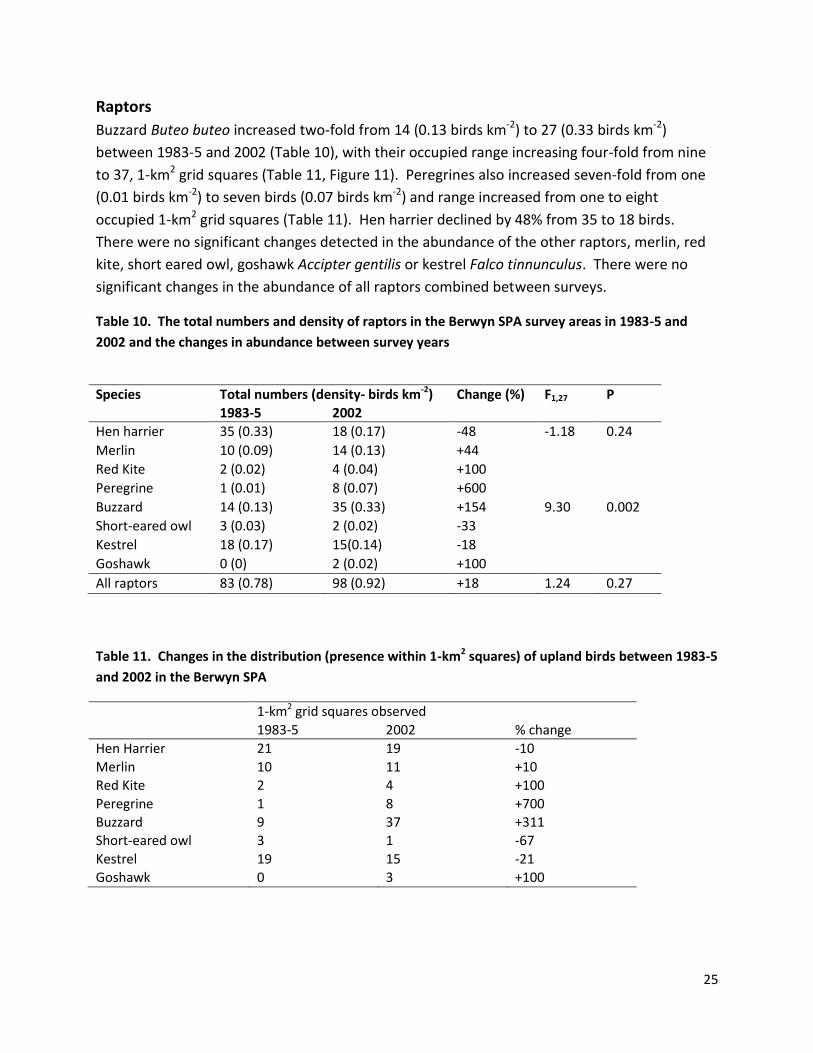
Raptors
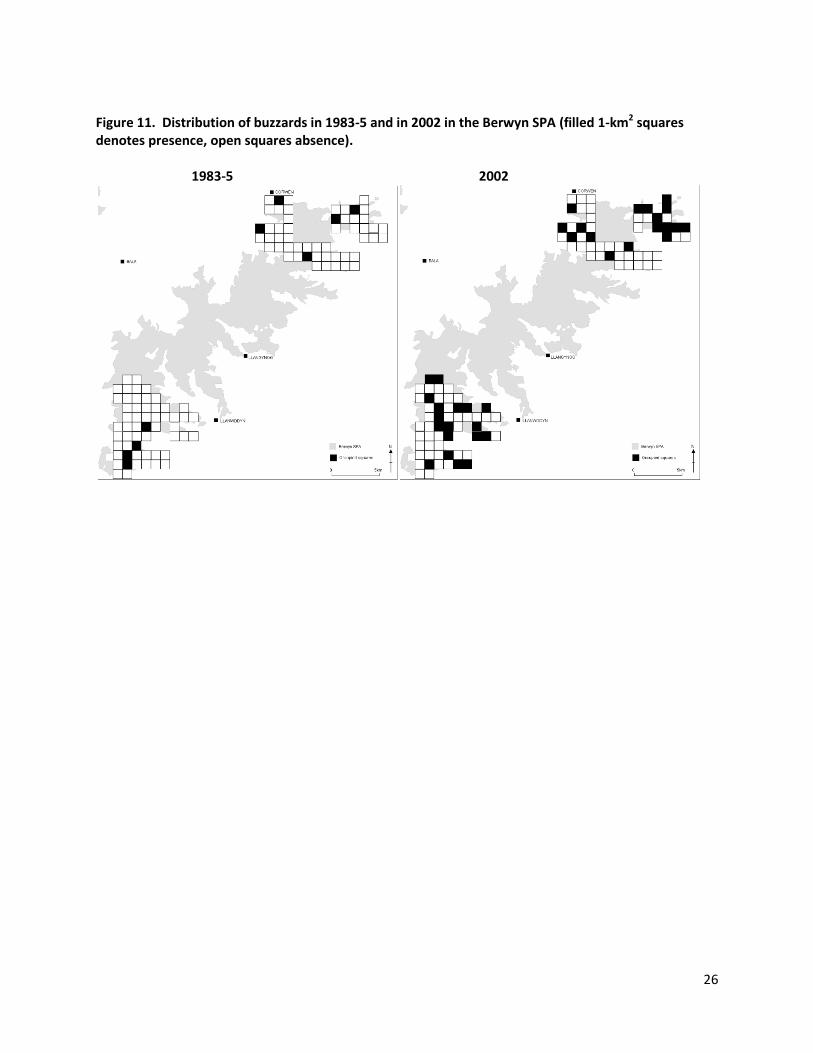
Buzzard Buteo buteo increased two-fold from 14 (0.13 birds km-2) to 27 (0.33 birds km-2)
between 1983-5 and 2002 (Table 10), with their occupied range increasing four-fold from nine
to 37, 1-km2 grid squares (Table 11, Figure 11). Peregrines also increased seven-fold from one
(0.01 birds km-2) to seven birds (0.07 birds km-2) and range increased from one to eight
occupied 1-km2 grid squares (Table 11). Hen harrier declined by 48% from 35 to 18 birds.
There were no significant changes detected in the abundance of the other raptors, merlin, red
kite, short eared owl, goshawk Accipter gentilis or kestrel Falco tinnunculus. There were no
significant changes in the abundance of all raptors combined between surveys.
Table 10. The total numbers and density of raptors in the Berwyn SPA survey areas in 1983-5 and
2002 and the changes in abundance between survey years
Species Total numbers (density- birds km-2) Change (%) F1,27 P
1983-5 2002
Hen harrier 35 (0.33) 18 (0.17) -48 -1.18 0.24
Merlin 10 (0.09) 14 (0.13) +44
Red Kite 2 (0.02) 4 (0.04) +100
Peregrine 1 (0.01) 8 (0.07) +600
Buzzard 14 (0.13) 35 (0.33) +154 9.30 0.002
Short-eared owl 3 (0.03) 2 (0.02) -33
Kestrel 18 (0.17) 15(0.14) -18
Goshawk 0 (0) 2 (0.02) +100
All raptors 83 (0.78) 98 (0.92) +18 1.24 0.27
Table 11. Changes in the distribution (presence within 1-km2 squares) of upland birds between 1983-5
and 2002 in the Berwyn SPA
1-km2 grid squares observed
1983-5 2002 % change
Hen Harrier 21 19 -10
Merlin 10 11 +10 Red Kite 2 4 +100
Peregrine 1 8 +700 Buzzard 9 37 +311 Short-eared owl 3 1 -67
Kestrel 19 15 -21 Goshawk 0 3 +100
26
Figure 11. Distribution of buzzards in 1983-5 and in 2002 in the Berwyn SPA (filled 1-km2 squares denotes presence, open squares absence).
1983-5 2002
27
Gamebirds
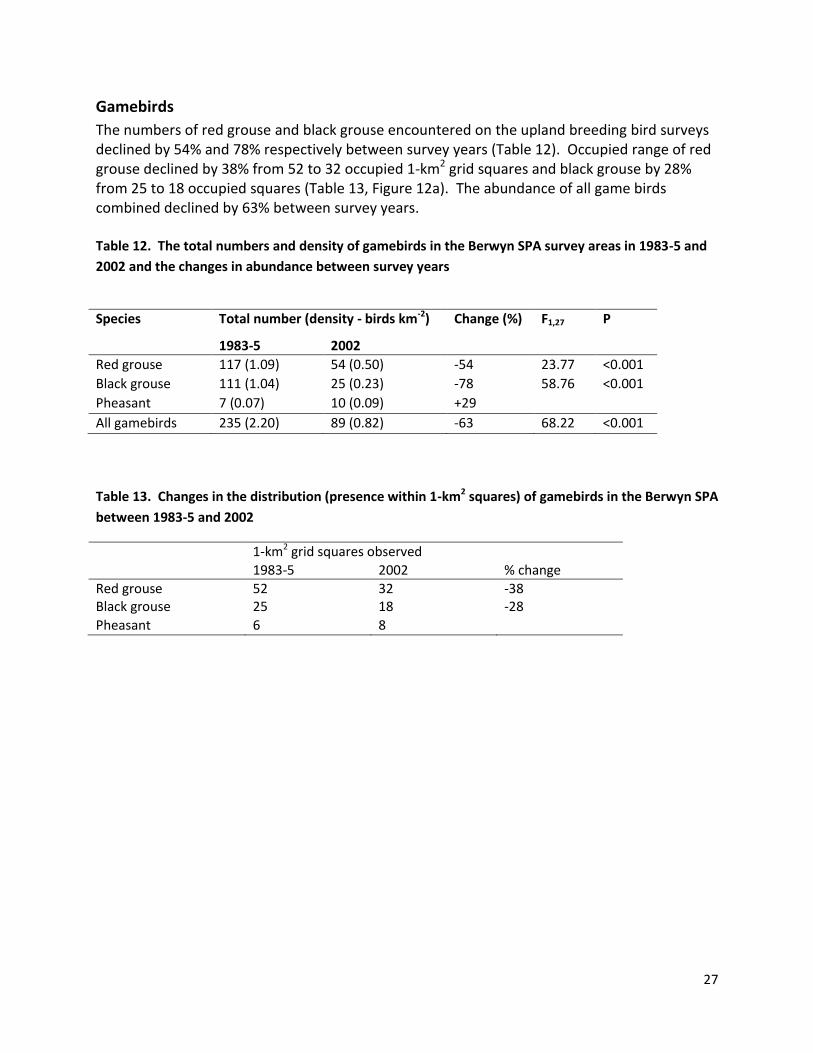
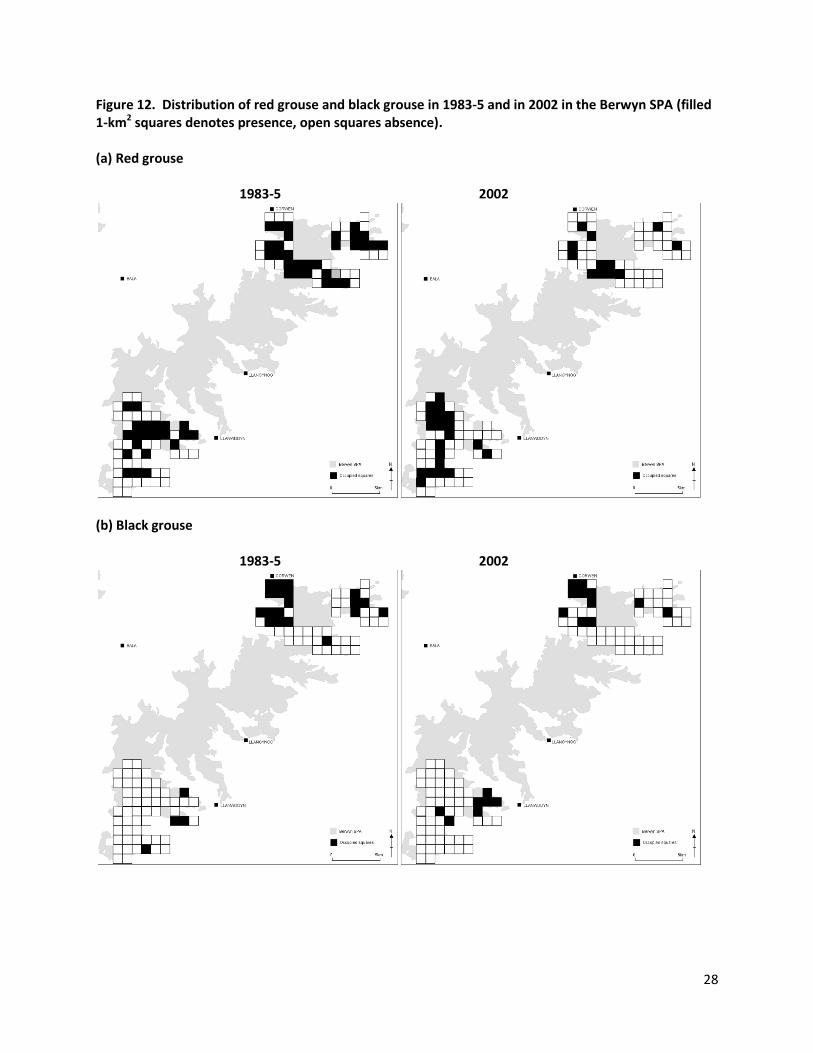
The numbers of red grouse and black grouse encountered on the upland breeding bird surveys declined by 54% and 78% respectively between survey years (Table 12). Occupied range of red grouse declined by 38% from 52 to 32 occupied 1-km2 grid squares and black grouse by 28% from 25 to 18 occupied squares (Table 13, Figure 12a). The abundance of all game birds combined declined by 63% between survey years. Table 12. The total numbers and density of gamebirds in the Berwyn SPA survey areas in 1983-5 and
2002 and the changes in abundance between survey years
Species Total number (density - birds km-2) Change (%) F1,27 P
1983-5 2002
Red grouse 117 (1.09) 54 (0.50) -54 23.77 <0.001
Black grouse 111 (1.04) 25 (0.23) -78 58.76 <0.001
Pheasant 7 (0.07) 10 (0.09) +29
All gamebirds 235 (2.20) 89 (0.82) -63 68.22 <0.001
Table 13. Changes in the distribution (presence within 1-km2 squares) of gamebirds in the Berwyn SPA
between 1983-5 and 2002
1-km2 grid squares observed
1983-5 2002 % change
Red grouse 52 32 -38 Black grouse 25 18 -28
Pheasant 6 8
28
Figure 12. Distribution of red grouse and black grouse in 1983-5 and in 2002 in the Berwyn SPA (filled 1-km2 squares denotes presence, open squares absence). (a) Red grouse
1983-5 2002
(b) Black grouse
1983-5 2002
29
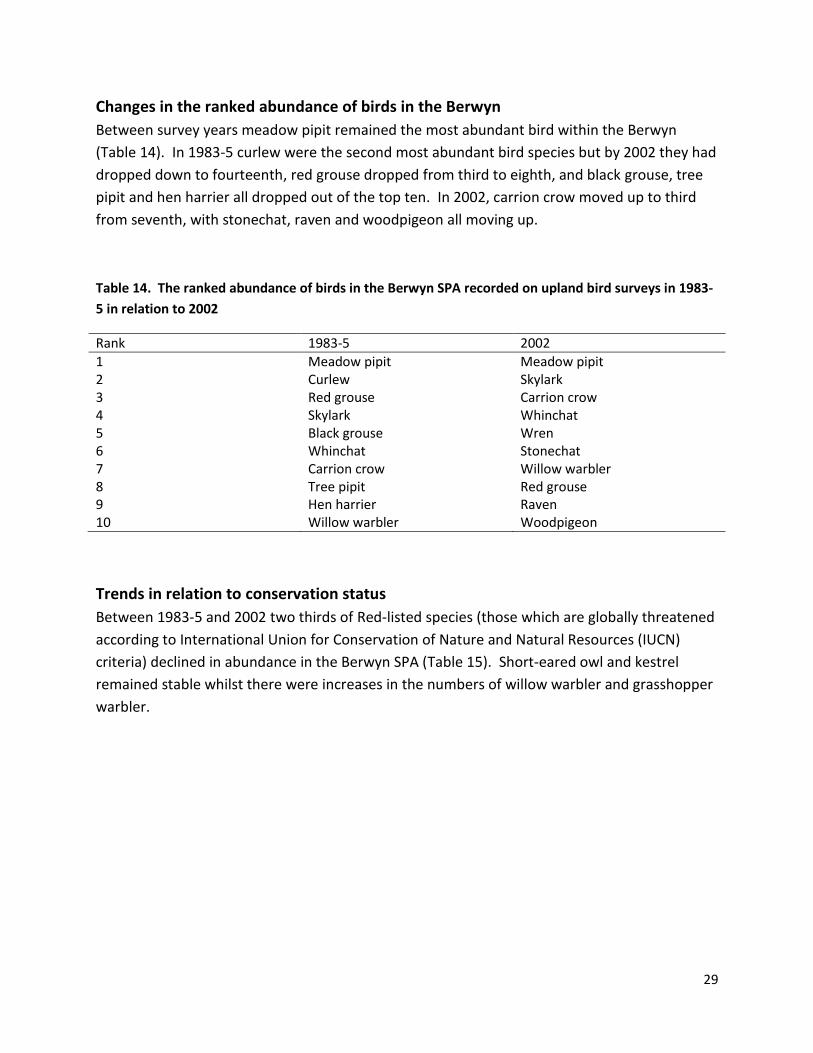
Changes in the ranked abundance of birds in the Berwyn
Between survey years meadow pipit remained the most abundant bird within the Berwyn
(Table 14). In 1983-5 curlew were the second most abundant bird species but by 2002 they had
dropped down to fourteenth, red grouse dropped from third to eighth, and black grouse, tree
pipit and hen harrier all dropped out of the top ten. In 2002, carrion crow moved up to third
from seventh, with stonechat, raven and woodpigeon all moving up.
Table 14. The ranked abundance of birds in the Berwyn SPA recorded on upland bird surveys in 1983-
5 in relation to 2002
Rank 1983-5 2002
1 Meadow pipit Meadow pipit 2 Curlew Skylark 3 Red grouse Carrion crow 4 Skylark Whinchat 5 Black grouse Wren 6 Whinchat Stonechat 7 Carrion crow Willow warbler 8 Tree pipit Red grouse 9 Hen harrier Raven 10 Willow warbler Woodpigeon
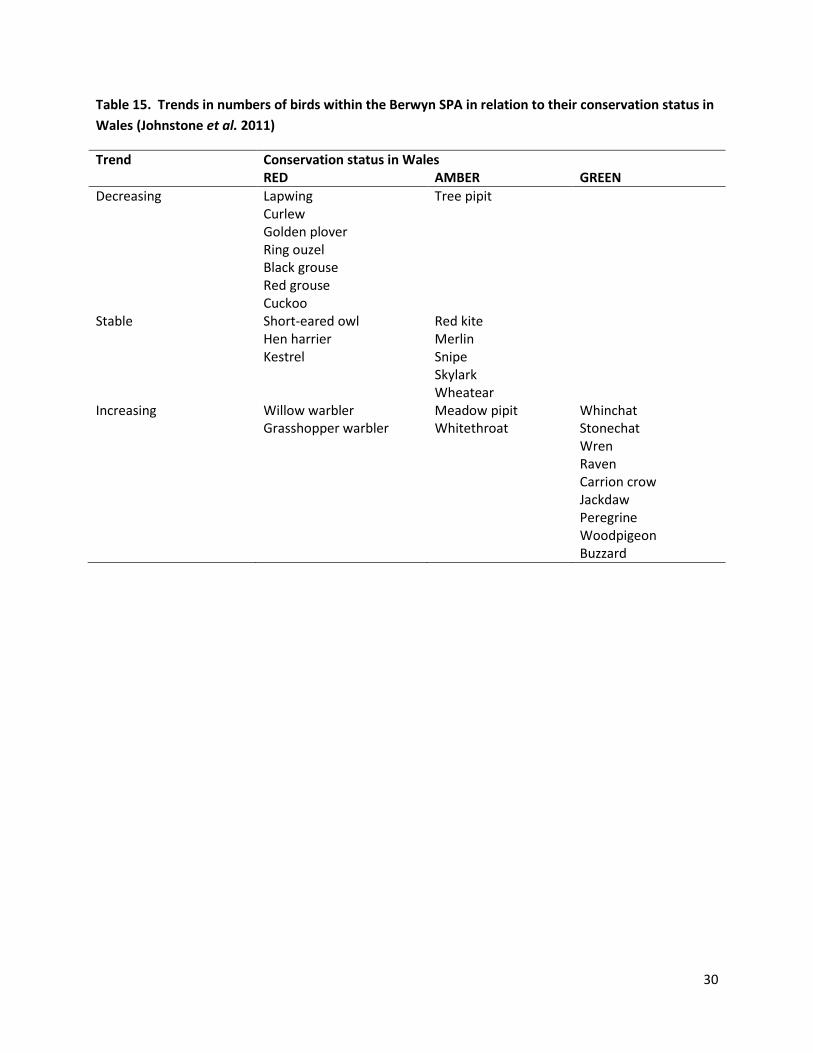
Trends in relation to conservation status
Between 1983-5 and 2002 two thirds of Red-listed species (those which are globally threatened
according to International Union for Conservation of Nature and Natural Resources (IUCN)
criteria) declined in abundance in the Berwyn SPA (Table 15). Short-eared owl and kestrel
remained stable whilst there were increases in the numbers of willow warbler and grasshopper
warbler.
30
Table 15. Trends in numbers of birds within the Berwyn SPA in relation to their conservation status in
Wales (Johnstone et al. 2011)
Trend Conservation status in Wales RED AMBER GREEN
Decreasing Lapwing Tree pipit Curlew Golden plover Ring ouzel Black grouse Red grouse Cuckoo Stable Short-eared owl Red kite Hen harrier Merlin Kestrel Snipe Skylark Wheatear Increasing Willow warbler Meadow pipit Whinchat Grasshopper warbler Whitethroat Stonechat Wren Raven Carrion crow Jackdaw Peregrine Woodpigeon Buzzard
31
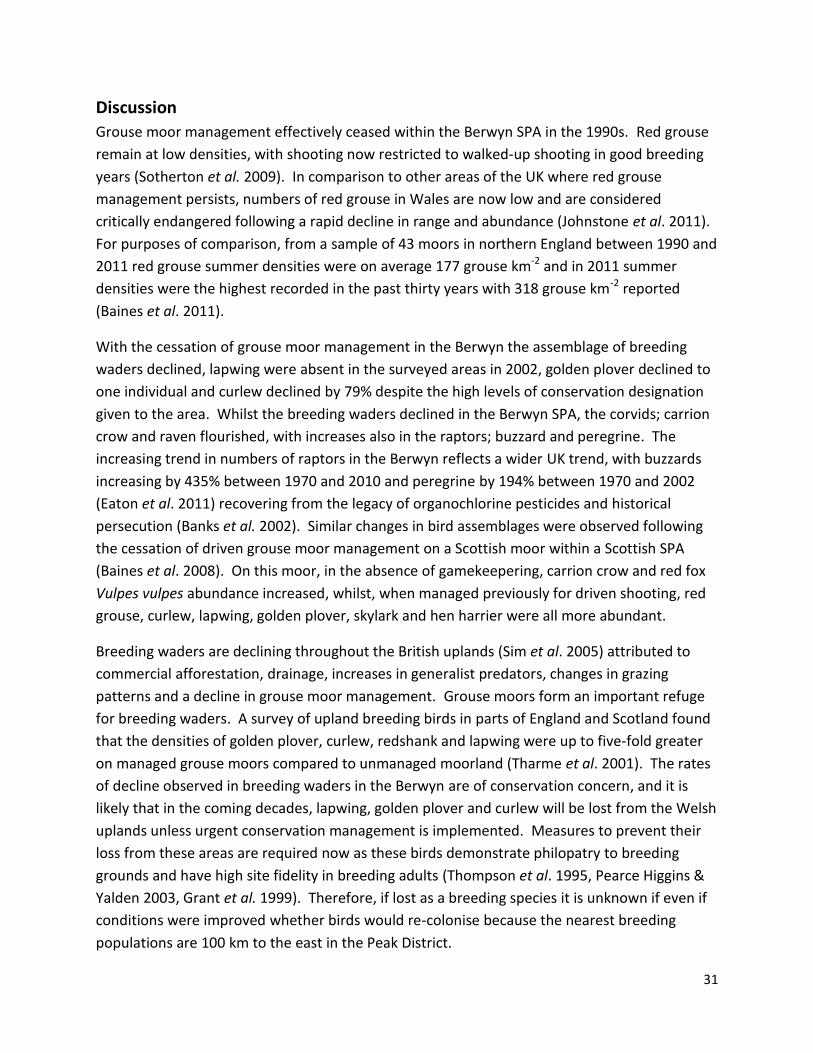
Discussion
Grouse moor management effectively ceased within the Berwyn SPA in the 1990s. Red grouse
remain at low densities, with shooting now restricted to walked-up shooting in good breeding
years (Sotherton et al. 2009). In comparison to other areas of the UK where red grouse
management persists, numbers of red grouse in Wales are now low and are considered
critically endangered following a rapid decline in range and abundance (Johnstone et al. 2011).
For purposes of comparison, from a sample of 43 moors in northern England between 1990 and
2011 red grouse summer densities were on average 177 grouse km-2 and in 2011 summer
densities were the highest recorded in the past thirty years with 318 grouse km-2 reported
(Baines et al. 2011).
With the cessation of grouse moor management in the Berwyn the assemblage of breeding
waders declined, lapwing were absent in the surveyed areas in 2002, golden plover declined to
one individual and curlew declined by 79% despite the high levels of conservation designation
given to the area. Whilst the breeding waders declined in the Berwyn SPA, the corvids; carrion
crow and raven flourished, with increases also in the raptors; buzzard and peregrine. The
increasing trend in numbers of raptors in the Berwyn reflects a wider UK trend, with buzzards
increasing by 435% between 1970 and 2010 and peregrine by 194% between 1970 and 2002
(Eaton et al. 2011) recovering from the legacy of organochlorine pesticides and historical
persecution (Banks et al. 2002). Similar changes in bird assemblages were observed following
the cessation of driven grouse moor management on a Scottish moor within a Scottish SPA
(Baines et al. 2008). On this moor, in the absence of gamekeepering, carrion crow and red fox
Vulpes vulpes abundance increased, whilst, when managed previously for driven shooting, red
grouse, curlew, lapwing, golden plover, skylark and hen harrier were all more abundant.
Breeding waders are declining throughout the British uplands (Sim et al. 2005) attributed to
commercial afforestation, drainage, increases in generalist predators, changes in grazing
patterns and a decline in grouse moor management. Grouse moors form an important refuge
for breeding waders. A survey of upland breeding birds in parts of England and Scotland found
that the densities of golden plover, curlew, redshank and lapwing were up to five-fold greater
on managed grouse moors compared to unmanaged moorland (Tharme et al. 2001). The rates
of decline observed in breeding waders in the Berwyn are of conservation concern, and it is
likely that in the coming decades, lapwing, golden plover and curlew will be lost from the Welsh
uplands unless urgent conservation management is implemented. Measures to prevent their
loss from these areas are required now as these birds demonstrate philopatry to breeding
grounds and have high site fidelity in breeding adults (Thompson et al. 1995, Pearce Higgins &
Yalden 2003, Grant et al. 1999). Therefore, if lost as a breeding species it is unknown if even if
conditions were improved whether birds would re-colonise because the nearest breeding
populations are 100 km to the east in the Peak District.
32
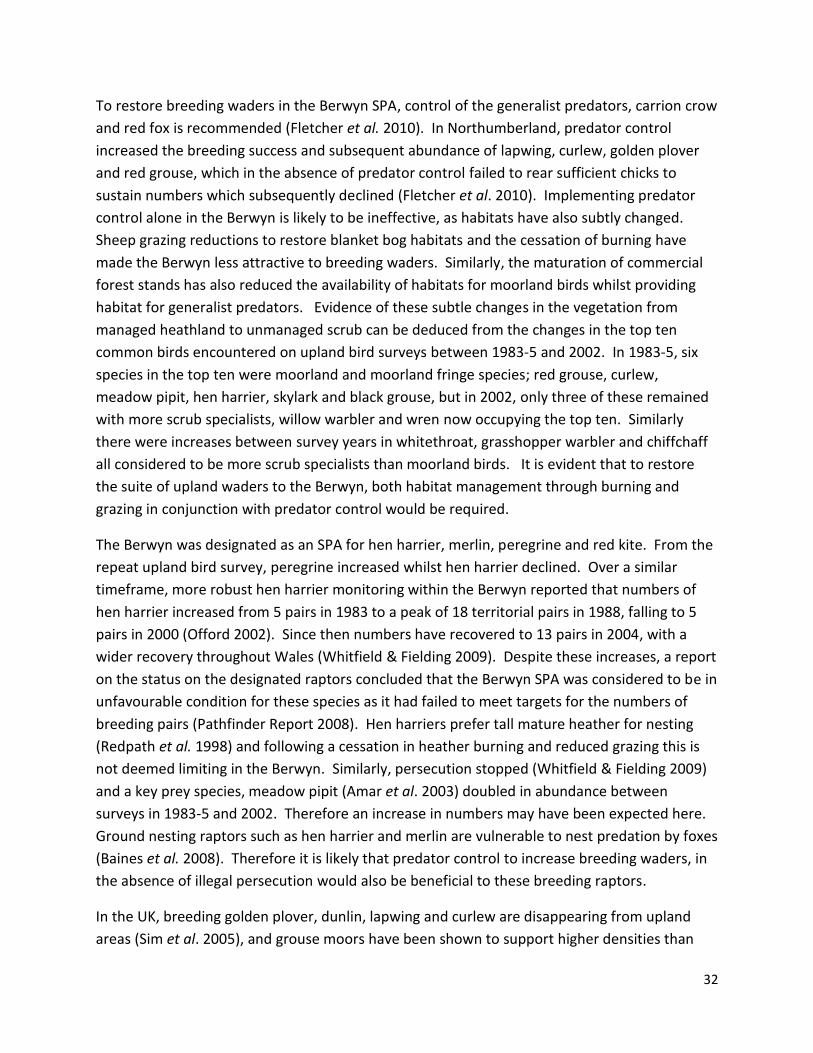
To restore breeding waders in the Berwyn SPA, control of the generalist predators, carrion crow
and red fox is recommended (Fletcher et al. 2010). In Northumberland, predator control
increased the breeding success and subsequent abundance of lapwing, curlew, golden plover
and red grouse, which in the absence of predator control failed to rear sufficient chicks to
sustain numbers which subsequently declined (Fletcher et al. 2010). Implementing predator
control alone in the Berwyn is likely to be ineffective, as habitats have also subtly changed.
Sheep grazing reductions to restore blanket bog habitats and the cessation of burning have
made the Berwyn less attractive to breeding waders. Similarly, the maturation of commercial
forest stands has also reduced the availability of habitats for moorland birds whilst providing
habitat for generalist predators. Evidence of these subtle changes in the vegetation from
managed heathland to unmanaged scrub can be deduced from the changes in the top ten
common birds encountered on upland bird surveys between 1983-5 and 2002. In 1983-5, six
species in the top ten were moorland and moorland fringe species; red grouse, curlew,
meadow pipit, hen harrier, skylark and black grouse, but in 2002, only three of these remained
with more scrub specialists, willow warbler and wren now occupying the top ten. Similarly
there were increases between survey years in whitethroat, grasshopper warbler and chiffchaff
all considered to be more scrub specialists than moorland birds. It is evident that to restore
the suite of upland waders to the Berwyn, both habitat management through burning and
grazing in conjunction with predator control would be required.
The Berwyn was designated as an SPA for hen harrier, merlin, peregrine and red kite. From the
repeat upland bird survey, peregrine increased whilst hen harrier declined. Over a similar
timeframe, more robust hen harrier monitoring within the Berwyn reported that numbers of
hen harrier increased from 5 pairs in 1983 to a peak of 18 territorial pairs in 1988, falling to 5
pairs in 2000 (Offord 2002). Since then numbers have recovered to 13 pairs in 2004, with a
wider recovery throughout Wales (Whitfield & Fielding 2009). Despite these increases, a report
on the status on the designated raptors concluded that the Berwyn SPA was considered to be in
unfavourable condition for these species as it had failed to meet targets for the numbers of
breeding pairs (Pathfinder Report 2008). Hen harriers prefer tall mature heather for nesting
(Redpath et al. 1998) and following a cessation in heather burning and reduced grazing this is
not deemed limiting in the Berwyn. Similarly, persecution stopped (Whitfield & Fielding 2009)
and a key prey species, meadow pipit (Amar et al. 2003) doubled in abundance between
surveys in 1983-5 and 2002. Therefore an increase in numbers may have been expected here.
Ground nesting raptors such as hen harrier and merlin are vulnerable to nest predation by foxes
(Baines et al. 2008). Therefore it is likely that predator control to increase breeding waders, in
the absence of illegal persecution would also be beneficial to these breeding raptors.
In the UK, breeding golden plover, dunlin, lapwing and curlew are disappearing from upland
areas (Sim et al. 2005), and grouse moors have been shown to support higher densities than

33
unmanaged moorland (Tharme et al. 2001, Tapper et al. 2005). In the Berwyn and wider Welsh
uplands no driven grouse shooting is now practised. The Berwyn has a history of producing
good grouse bags, but despite significant investment in heather moorland in northern England
and Scotland, this has not occurred in Wales. Restoring grouse moor management in Wales
would be difficult and very expensive due to a number and combination of factors which
include the fragmentation of heather habitats due to commercial afforestation, the presence of
the disease Louping ill, high densities of breeding raptors and heather burning restricted on
blanket bog. To restore breeding wader populations within the Berwyn, we suggest that
predator control is incorporated as a general tool within agri-environment schemes, particularly
where habitat enhancements through heather burning and appropriate grazing are being
practised.

34
References
Amar, A., Redpath, S., & Thirgood, S. 2003. Evidence for food limitation in the declining Hen Harrier population on the Orkney Islands, Scotland. Biological Conservation, 111: 377-384. Baines, D., Redpath, S., Richardson, M. & Thirgood, S. 2008. The direct and indirect effects of predation by Hen Harriers Circus cyaneus on trends in breeding birds on a Scottish grouse moor. Ibis, 150 (Suppl 1): 27-36. Baines, D., Newborn, D., & Howarth, D. 2011. Uplands monitoring in 2011. Annual Review of the Game & Wildlife Conservation Trust, 43: 46-49. Banks, A.N., Coombes, R.H. & Crick, H.Q.P. 2002. The Peregrine Falcon breeding population of the UK and Isle of Man in 2002. BTO Research Report No. 330. Core Management Plan (including conservation objectives) for Berwyn & South Clwyd Mountains SAC & Berwyn SPA. 2008. Countryside Council for Wales. Countryside Council for Wales. Grouse Moors in Wales 1994. Unpublished CCW report. Eaton, M.A., Balmer, D.E., Cuthbert, R., Grice, P.V., Hall, J., Hearn R.D., Holt, C.A., Musgrove, A.J., Noble, D.G., Parsons, M., Riseley, K., Stroud, D.A. & Wotton S. 2011. The State of the UK’s Birds 2011. RSPB, BTO, WWT, CCW, JNCC, NE, NEIA & SNH. Sandy, Bedfordshire. European Economic Community (EEC). 1979. Council directive 79/409/EEC of 2 April 1979 on the conservation of wild birds: Official Journal L103: 1-25. Fletcher, K., Aebischer, N.A., Baines, D., Foster, R & Hoodless, A. 2010. Changes in breeding success and abundance if ground-nesting moorland birds in relation to the experimental deployment of legal predator control. Journal of Applied Ecology, 47: 263-272. Grant, M. C., Orsman, C., Easton, J., Lodge, C., Smith, M., Thompson, G., Rodwell, S. & Moore, N. 1999. Breeding success and causes of breeding failure of curlew Numenius arquata in Northern Ireland. Journal of Applied Ecology, 36: 59–74 Hudson, P.J. 1992. Grouse in Space and Time: The Population Biology of a Managed Gamebird. Game Conservancy Ltd. Fordingbridge, Hampshire. Johnstone, I.G., Thorpe, R.I. & Noble, D.G. 2011. The State of Birds in Wales 2011. RSPB Cymru, Cardiff. Lovegrove, R., Shrubb, M. & Williams, I. 1995. Silent Fields Gwlad Tawel: The status of farmland birds in Wales. RSPB, Sandy, Bedfordshire.
35
Offord, K. 2002. Review of raptor data on Berwyn and Migneint-Dduallt SPAs. CCW Contract Science Report no.479. Pathfinder-An evaluation of issues impacting upon special qualities. Annex 5- Review of management condition and key management issues for designated sites within the study area. 2008. Prepared for CCW by Land Use Consultants Pearce-Higgins JW, Yalden DW. 2003. Golden Plover Pluvialis apricaria breeding success on a moor managed for shooting Red Grouse Lagopus lagopus. Bird Study, 50: 170-177.
Redpath, S.M., Madders, M., Donnelly, E., Anderson, B., Thirgood, S., Martin, A., & McLeod, D. 1998. Nest site selection by Hen Harriers in Scotland. Bird Study, 45: 51-61. Reed, T.M., Barrett, C., Barrett, J., Hayhow, S. & Minshull, B. 1985. Diurnal variability in the detection of waders on their breeding grounds. Bird Study, 32: 71-74. Sim, I.M.W., Gregory, R.D., Hancock, M.H. & Brown, A.F. 2005. Recent changes in the abundance of British upland breeding birds. Bird Study, 52: 261-275. Sotherton, N., Tapper, S. & Smith, A. 2009. Hen harriers and red grouse: economic aspects of red grouse shooting and the implications for moorland conservation. Journal of Applied Ecology, 46: 955-960. Tapper, S.C 1992. Game Heritage. The Game Conservancy Trust, Fordingbridge, Hampshire, 140 pp. Tapper, S. 2005. Nature’s Gain. The Game Conservancy Trust, Fordingbridge, UK. Tharme, A. P., Green, R.E., Baines, D., Bainbridge, I.P. & O’Brien, M. 2001. The effect of management for red grouse shooting on the population density of breeding birds on heather-dominated moorland. Journal of Applied Ecology, 38: 439-457. Thompson, P. S., Baines, D., Coulson, J. C. and Longrigg, G. 1994, Age at first breeding, philopatry and breeding site-fidelity in the Lapwing Vanellus vanellus. Ibis, 136: 474–484. Thompson, D.B.A., MacDonald, A.J., Marsden, J.H. & Galbraith, C.A. 1995. Upland heather moorland in Great Britain: a review of international importance, vegetation change and some objectives for nature conservation. Biological Conservation, 71: 163-178. Whitfield, P. & Fielding, A. 2009. Hen harrier population studies in Wales. CCW Contract Science No. 879.