changing paradigms of indian foodtech landscape - impact
TRANSCRIPT

Available online at www.centmapress.org Int. J. Food System Dynamics 11 (2), 2020, 139-152 DOI: http://dx.doi.org/10.18461/ijfsd.v11i2.46
139
Changing Paradigms of Indian Foodtech Landscape - Impact of Online Food Delivery Aggregators
M. Senthil1, N. Gayathri1, and K.S.Chandrasekar2
1Department of Logistics Management, Alagappa University, Karaikudi-630003, Tamilnadu, India 2Institute of Management in Kerala, University of Kerala, Kariyavattom, Thiruvananthapuram – 695581, Kerala, India, [email protected]; [email protected]; [email protected] Received November 2019, accepted March 2020, available online April 2020
ABSTRACT
The purpose of this study is to depict the perception of consumers on the discount factor, future of food tech
applications, tampering of family values, dine-out culture, technological anxiety and their impact on satisfaction
behaviour. Millennials are the precedence audience for the online food aggregators. Generation X is different from
other generations in perceiving discount factors. Future of food applications rely on the Discounts. Restaurant
operators can focus on giving their customers an increased level of convenience and more discounts since these
tend to be the reason for them to choose ordering food online. Optimisation is vital as increase in Tech nological
anxiety increases the perceived future of food application and decreases the satisfaction behaviour.
Keywords: Online food delivery; Aggregators; Food applications; Deep Discounting; Dine-out; Future of food apps.
brought to you by COREView metadata, citation and similar papers at core.ac.uk
provided by Food System Dynamics (E-Journals)

M. Senthil et al. / Int. J. Food System Dynamics 11 (2), 2020, 139-152
140
1 Introduction
Rapid change and growth is witnessed in the business of delivery of food to customers as new players are on the race to seize the markets across the nation. (Carsten et al., 2016). An Indian spends around 25% of his earnings on food and beverages. In the physical retail outlets, it is found that 50% of the revenue is generated through food alone. On the contrary, good food is not omnipresent (Lenina, 2017). The increase in disposable earnings, westernisation and change in people lifestyles are the main reason behind the robust growth of online food delivery market. Intensified usage of the Internet and smart phones has supplemented to make easy the progress of the market. Moreover, rising participation of women counterparts in the labour force have also elevated the preference for primed meals and a huge youth population has stretched the customer base. Primarily the urban areas of the country are concentrated as a prospect market. The major players are Swiggy and Zomato followed by Food panda, Uber eats, Dominos, etc. Novelty and expediency are the essence of the growth behind the online delivery services. As a result, many players have surfaced to offer this service in India. (Pigatto et al., 2017).
The delivery-only model which is quite equipped with kitchen but has no dine-in provision called as cloud kitchen is now regarded as the future of food industry (“Young Turks”, 2019). The e -commerce has made a shift from the traditional dine out to order online is also due to the convenience, economic and a wide variety of dishes. The ordering food through online has become fashioned due to the steeped usage of Internet-enabled devices. (“Online On-demand”, 2019) A single online portal which offers access to multiple restaurants is the conventional model of food delivery on which the aggregators are built. This enables the consumers to log in and decide on the menus by looking into the prices and reviews. (Carsten et al., 2016). The aggregators collect a fixed margin for the orders and hence there is no additional cost to the consumer as the margin is paid by the restaurants.
India being the world’s biggest youth masses and progressive number of youngsters entering the workforce each day, economic progress, increasing female work participation, extended portability among shoppers raised the need for the assorted menu (Priyadharshini 2017). As per the data of the Government of India, youth in the age group of 15 to 24 will have about 34.33% of the total population by 2020. A study expresses that 50. 8% of people order food onl ine as they don't like to cook and as it facilitates clients to have food delivered straight to their home or office within 60 minutes (Rathore et al. 2018). Studies say that generation Y are more keened to spend for quick service restaurants and ordering food through online applications. As these people are more tech- savvy they expect good experience from the delivery platforms. Delivery platforms are expected to make ease the process and enrich the user experience by introducing the new delivery channels. The disrupting is already done to the ordering and delivery process of the restaurants. To streamline the experience of the consumers and the system the restaurants are promptly incorporates the mobile food ordering app. A study says that 70% of all food delivery or takeout orders are done through mobiles as mobile phones are the most chosen mode for internet browsing. (“Why mobile”, 2018). Food delivery has turned out to be more of an obligation than optional add-ons for consumer food service operators. The sphere that used to contain only Chinese food items and pizza now incorporates all cuisine variety. (“The future of food”, 2019)
The users’ gets most obsessed on orders with discount rates; furthermore it is more expedient, consistent and hassle-free. Discounts and special offer are the most influencing factor for online food ordering. (Jacob et al., 2019). This deep discounting practice of the aggregators leads more than 1000 restaurants to delist themselves from the online platforms. The head of the National Restaurant Association of India expressed that the restaurants are ready to pay for reservation and delivery but are not cosy letting the aggregators to command on the discount terms (John & Amin, 2019) In the first taskforce meeting between the National Restaurant Association of India and food aggregators, one of the important deliberations was about deep discounting. Restaurants have come out wavering in opposition to startups that are transforming consumers into discount addicts (Ratna, 2019). The aggregators are apparently playing on the discounting and are now subject to bile and protect by the restaurant owners that they lose money in the process. The havoc this persistent culture of discount and its effect on the economies may not be realised by the customary restaurant frequenters. Many seem to encourage this thrive on offers and discounts and there are profound cultural grounds behind this. Restaurants are looking for enriching the quality of the dine-out culture to be away from the discounting factor to bring the customers in and to be depending on the aggregators manifesto. (Anoothi, 2019).

M. Senthil et al. / Int. J. Food System Dynamics 11 (2), 2020, 139-152
141
When we fall short of time for preparing food for the family we fall into the trap of temptation to get into these apps and order food in just a few taps. Hence when the life goes tiring and hectic these applications tend to takeover and may become dangerous in the long go. The strive for the hearts and stomachs of the consumers attained a different intensity (“Sydney food scene”, 2019)
It is understood that the controlling of customer experience will become near to impossible for a restaurant when the food are delivered through third party driver. The new integration system may pave way for restaurants to maintain the third party platforms as well as the loyalty system without forgoing the customer flow. (Miranda lambert, 2019). Though the foods are carried in insulated bags by the third -party drivers, receiving a warm food is quite below par of expectation comparing to the dine -in restaurant experience. They might have a prior positive experience with the restaurant when the same expectations are carried over to the delivery platforms too it gets hit there. The apprehension of the restaurants is that the advent of delivery platforms is leading to the majo r fall of in dine-in sales as the charge for delivery is high.
People with higher levels of Technological anxiety use less self service technologies. It is likely to influence the satisfaction levels and intention to reuse. (Meuter, 2003). A mobile consum er survey (Deloitte, 2016) put forward that one third of Smartphone users uses phones as mobile computers, for read-through email, shopping online, reading news, downloading music and videos, slotting in social media, ordering food, view maps and the catalogue prolongs. We factually have the internet in our pocket at every time and can apparently search and find anything with a touch away. Even then all these astounding advancements roll up with a cost. Studies shows that some individuals experience substan tial stress and anxiety on using these technological advancements and some are even seen with the symptoms of those with addictions (“Stress and Anxiety”, 2018).
2 Methodology
The population for the study is the users of mobile food applications. The empir ical part of this study was conducted using an online survey. Since the population is unknown, Sample size is calculated based on desired accuracy using Cochran’s(1977)sample size formula. With confidence level of 95 % and 5 % margin of error for an unknown population the sample size is 384 (Bartlett et al., 2001). The required data was collected from a convenience sample size of 410 users of mobile food applications out of which N=388 responses were found useful.
In the first part of the questionnaire, the main purpose of the study was explained, the second part was devoted to demographic questions, third part was for the multiple choice questions, while the last part was for the main construct items. Five-point Likert scales were adopted to measure the main scale items.
Table 1. Questionnaire Construct and Validity
Variables Constructs α N of Items
FFA
Food apps will be the most preferred tool for ordering food in the future
0.688 3 In future there will be less cooking at home and more online orders
I wish to see a customized menu catering to my taste and dietary
DIS
I prefer online food orders than going for restaurants as they give more discounts
0.631 3 I would rather choose to dine out to restaurants if there is no discount and offers by food delivery apps
I'm loyal to the specific food brands, for such orders discounts are immaterial for me
TFV
I order Online independently without the interference of my family members
0.549 3 This online ordering system may disturb the traditional family values
I feel that I need not depend on my mother or spouse for food needs
DOC
Restaurants can give discounts to dine-in as mobile apps provide for online orders
0.655 4 This takeaway culture is ruining the feel good factor of enjoying hospitality at restaurants
Restaurant dining at home is slowly killing the model of dine-in Restaurants
Personal contact with a restaurant employee makes ordering food more enjoyable for me
TA I hesitate to use online ordering for fear of making a mistake I cannot correct
0.750 2 I've avoided online ordering because it is unfamiliar to me
SB
I'm happy with the service of online ordering and delivery
0.821 3 I'll continue to use online ordering in the future
I'll recommend my friends to use online ordering
FFA= Future of food apps; DIS = Discount Factor; TFV= Tampering of Family values; DOC = Dine-out Culture; TA= Technological
Anxiety; SB= Satisfaction Behaviour

M. Senthil et al. / Int. J. Food System Dynamics 11 (2), 2020, 139-152
142
The acceptable internal consistency is ensured by Cronbach’s alpha coefficient. The values for TA and SB are above 0.7 and 0.8 respectively. Hence ensures the strong reliability (Hair et al. 2006). Cronbach’s alpha coefficient showed acceptable internal consistency for the scores (Table 1).
Even though the values of variables like FFA, DIS, TFV and DOC were <0.7, according to Di Iorio (Di Iorio, 2005), 0.7 should not be the only standard used to assess reliability, whereby the shorter scale, with the lower alpha value, actually demonstrates higher interrelatedness among items. Moreover, the value of ‘Cronbach’s alpha if item deleted’ for each item was less than the corresponding Cronbach’s alpha coefficient of the dimension, depicting that there should be no item to be removed or altered.
The study variables are continuous and hence were analysed to verify that they satisfy the normality assumptions. The skewness and kurtosis analysis was conducted. Tabachnick & Fidell (2001) and Garson (2006) suggest that values of skewness and kurtosis should be within the 2 to -2 range when the data are normally distributed. The distribution in the table 2 shows that all scales have skewness and kurtosis within the ± 2 range, hence the normality of the data was ensured. The mean value of SB (3.89) and FFA (3.86) is higher than other variables whereas the mean value of Technological anxiety is very less which implies there is no much anxiety in using the technology for ordering foods.
Table 2. Normality
Variables FFA DIS TFV DOC TA SB
x 3.86 3.63 3.43 3.69 2.55 3.89
σ 0.69 0.73 0.83 0.64 1.08 0.72
Skewness -0.17 -0.11 -0.43 0.04 0.59 -0.55
Kurtosis -0.13 -0.38 0.05 -0.47 -0.34 0.38
Note: S.E for Skewness =0.245, S.E. for Kurtosis =0.485
3 Analyses
Out of 388 Participants 64.9% are Male and 35.1% are Female. Majority of the respondents belongs to the age of 25 – 29 (52.6%). 57.7% of the respondents are married, 40.2% are single and 2.1% are under forced singularship. Majority of the respondents live in Metro and Urban areas holding 46.4% and 40 .2% respectively.

M. Senthil et al. / Int. J. Food System Dynamics 11 (2), 2020, 139-152
143
Table 3. Respondents Profile
S.No Demographic
Profile
Number of Respondents
(N=388) Percent (%)
1 Gender
Male
Female
252
136
69.4
35.1
2 Age of the Respondents
21-24
25-29
30-39
40-54
55 and above
44
204
108
20
12
11.3
52.6
27.8
5.2
3.1
3 Marital Status
Single
Married
Forced Singularship
156
224
8
40.2
57.7
2.1
4 Place of Living
Metro
Urban
Semi Urban
Rural
180
156
36
16
46.4
40.2
9.3
4.1
5 Income
No Income
Below Rs.10000
Rs.10001 to Rs.25000
Rs.25001 to Rs.50000
Rs.50001 to Rs.100000
Rs.100001 and above
20
16
80
124
68
80
5.2
4.1
20.6
32.0
17.5
20.6
6 Education
Graduation
Post-Graduation
144
244
37.1
62.9
7 Occupation
Student
Self Employed
Professional
Employee
Housewife
Retired
4
48
140
144
48
4
1.0
12.4
36.1
37.1
12.4
1.0
Almost 32% of the respondents belong to the income group of 25000 INR to 50000 INR per month. It is to be noted that 62.9% of the respondents are postgraduate and 37.1% are graduates. No respondent was below the level of graduation. The majority of the respondents were employees (37.1%) and professionals (36.1%).
With regard to the convenient mode of ordering through online, multiple restaurant app/site stands foremost with 60.2% of the respondents opting for it. Regarding the most used de livery apps Swiggy stands top with 31.6%, followed by Zomato with 26.8%, Uber eats with 16.7% and Dominos with 16%.

M. Senthil et al. / Int. J. Food System Dynamics 11 (2), 2020, 139-152
144
Figure 1. Delivery App used Figure 2.. Time of order
In an attempt to study the occasions for which the respondents order online, 3 3.3% of the respondents order food online when they have lack of interest to cook, followed by the occasion of get -together and special occasion with 18.6% and 16.9% respectively.
Figure 3. Foods ordered the most Figure 4. Orders are made for
Parallel to the result in the article “The Discount Dilemma” given in “The Food Issue – Forbes India” Biriyani is the most ordered dish with 288 number of respondents opting for it, Pizza, Tandoori chicken and BBQs with 176, 172 and 128 respondents opting for those respectively. Orders are mostly made for family members (35.8%) and for self (33.5%). Mostly the online orders are made for dinner with 43.5% of the respondents opting for it.

M. Senthil et al. / Int. J. Food System Dynamics 11 (2), 2020, 139-152
145
Table 4. Multiple responses
Particulars Responses
Percent of Cases N Percent
Delivery App used Zomato 288 26.8% 74.2%
Swiggy 340 31.6% 87.6%
Food Panda 76 7.1% 19.6%
Uber eats 180 16.7% 46.4%
Just eat 4 0.4% 1.0%
Ola eats 4 0.4% 1.0%
Domino's Pizza 172 16.0% 44.3%
Others 12 1.1% 3.1%
Total 1076 100.0% 277.3%
Occassion to make an order Business Event 44 6.0% 11.3%
Special Occasion 124 16.9% 32.0%
Get together 136 18.6% 35.1%
Romantic 48 6.6% 12.4%
Social 60 8.2% 15.5%
Lack of interest to cook 244 33.3% 62.9%
Routine 76 10.4% 19.6%
Total 732 100.0% 188.7%
Type of food ordered the most Biriyani 288 22.4% 74.2%
Masala Dosa 60 4.7% 15.5%
Pizza 176 13.7% 45.4%
Panner Butter Masala 88 6.9% 22.7%
Dal Makhani 32 2.5% 8.2%
Chicken Fried rice 124 9.7% 32.0%
Butter Chicken 60 4.7% 15.5%
Tandoori Chicken 172 13.4% 44.3%
Snacks items 108 8.4% 27.8%
BBQs 128 10.0% 33.0%
Other foods 48 3.7% 12.4%
Total 1284 100.0% 330.9%
Orders are made for Self 240 33.5% 61.9%
Family 256 35.8% 66.0%
Friends 180 25.1% 46.4%
Official 40 5.6% 10.3%
Total 716 100.0% 184.5%
Time of making an order Forenoon 24 3.6% 6.2%
Afternoon 132 19.6% 34.0%
Evening 144 21.4% 37.1%
Dinner 292 43.5% 75.3%
Midnight orders 80 11.9% 20.6%
Total 672 100.0% 173.2%
Reasons to use Mobile food apps Convenience 304 33.0% 78.4%
Time saving 200 21.7% 51.5%
Variety of Menu 116 12.6% 29.9%
Speed of Delivery 88 9.6% 22.7%
Discounts and Offers 212 23.0% 54.6%
Total 920 100.0% 237.1%
Difficulty in using Mobile food apps Technically difficult to use 32 5.5% 8.2%
Reduced Freshness 116 20.0% 29.9%
Waiting time 144 24.8% 37.1%
Inability to revise the order placed 144 24.8% 37.1%
Inability to return the dish spoilt 144 24.8% 37.1%
Total 580 100.0% 149.5%
Future acceptable channel of ordering Tweet 60 9.4% 15.5%
Smart watch 140 22.0% 36.1%
Google voice 252 39.6% 64.9%
Eye Movements 52 8.2% 13.4%
Smart TV 128 20.1% 33.0%
Not sure 4 0.6% 1.0%
Total 159 100.0% 163.9%
Future acceptable mode of Delivery Drones 53 37.1% 54.6%
Robots 24 16.8% 24.7%
Parachute 12 8.4% 12.4%
Electric Vehicles 54 37.8% 55.7%
Total 143 100.0% 147.4%
It is also worth noting almost 12% of the respondents make midnight orders. Regarding the reasons for using mobile food apps convenience stands foremost with 33%, followed by Dis counts and offers with 23% and time saving reason with 21.7%. Waiting time, Inability to revise the orders placed and inability to return the dish spoilt are found by the respondents as difficulty in using mobile food applications with

M. Senthil et al. / Int. J. Food System Dynamics 11 (2), 2020, 139-152
146
24.8% each. Google voice is chosen by the respondents as the most acceptable channel of ordering in the future with 39.6%, Smart watch and Smart TV follows it with 22% and 20.1% respectively. Electric vehicles and Drones marks as the widely acceptable mode of delivery in the future.
Figure 5. Future acceptable channel of ordering Figure 6. Future acceptable mode of delivery
In an attempt to study the association between the variables it is found that there is no association between gender and frequency of ordering (X2=4.805, d.f.=5, p>0.05), Mode of payment (X2=4.4925, d.f.=3, p>0.05), average monthly spent to order food online (X2=5.062, d.f.=4, p>0.05). There is a significant association between marital status and average monthly spent to order food online (X2=18.479, d.f.=8, p<0.05), and no association between marital status and frequency of ordering (X2=14.906, d.f.=10, p>0.05), Mode of payment (X2=6.706, d.f.=6, p>0.05). It is also found that there is no association between age of the respondents and frequency of order ing (X2=24.066, d.f.=20, p>0.05), Mode of payment (X2=11.234, d.f.=12, p>0.05), average monthly spent to order food online (X 2=19.083, d.f.=16, p>0.05). There is a significant association between Place of living and mode of payment (X2=17.513, d.f.=9, p<0.05), and no association between place of living and frequency of ordering (X2=14.162, d.f.=15, p>0.05) and average monthly spent to order food online (X 2=14.342, d.f.=12, p>0.05). There is a significant association between Income of the respondents and the mode of payment for the online order(X2=24.558, d.f.=15, p<0.05) and no association between the income of the respondents and frequency of ordering (X2=23.559, d.f.=25, p>0.05) and average monthly spent to order food online (X2=23.863, d.f.=20, p>0.05). It is also found from the analysis that there is no association between education of the respondents and frequency of ordering (X2=8.369, d.f.=5, p>0.05), Mode of payment (X2=4.682, d.f.=3, p>0.05), average monthly spent to order food online (X 2=4.554, d.f.=4, p>0.05). There is no association between the occupation of the respondents and frequency of ordering (X 2=19.668, d.f.=25, p>0.05), Mode of payment (X2=18.225, d.f.=15, p>0.05), average monthly spent to order food online (X2=9.746, d.f.=20, p>0.05).
The Correlation Coefficient among the independent and dependent variables indicates a substantial significant correlation with each other shown in the table 5 the values in the correlation table are standardized and range from 0-1. The second column and the third column of the table depict the mean values and standard deviation values of the variables.
It is understood from the table V that the variable FFA has significant positive relationship with the variables like DIS and SB and has a moderate relationship with TFV. Discount factor has a significant relationship with TFV, DOC and SB and has moderate relationship with TA. Technological anxiety has a significant positive correlation with TFV and DOC and a moderate relationship with DIS. Dine -out culture has a moderate relationship with the variable TFV.
M. Senthil et al. / Int. J. Food System Dynamics 11 (2), 2020, 139-152
147
Table 5. Correlation
Variables _
X σ FFA DIS TFV DOC TA SB
FFA 3.86 0.69 1 .602** .220* 0.18 0.053 .514**
DIS 3.63 0.73
1 .326** .313** .215* .390**
TFV 3.43 0.83
1 .213* .335** 0.136
DOC 3.69 0.64
1 .537** 0.06
TA 2.55 1.08
1 -0.146
SB 3.89 0.72
1
FFA=Future of Food Apps; DIS= Discount factor; TFV= Tampering of Family Values; DOC= Dine-Out Culture; TA= Technological Anxiety; SB=
Satisfaction Behavior;
** Correlation is significant at the 0.01 level (2-tailed).
*. Correlation is significant at the 0.05 level (2-tailed).
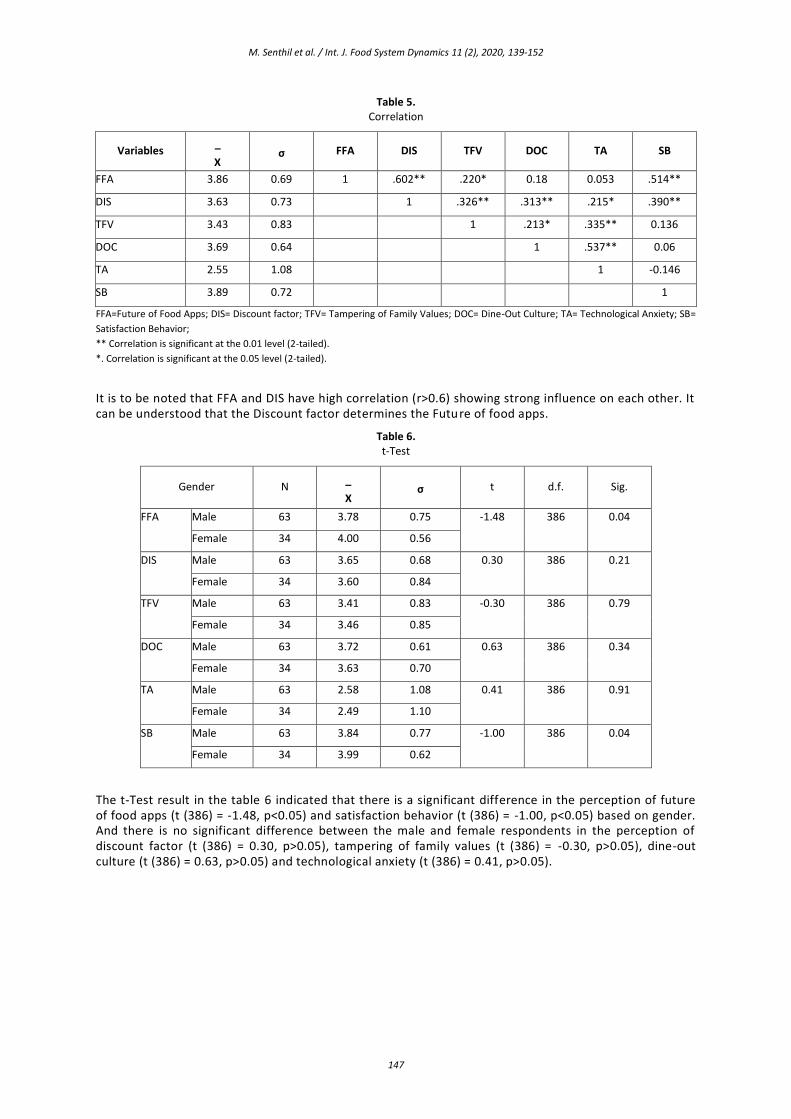
It is to be noted that FFA and DIS have high correlation (r>0.6) showing strong influence on each other. It can be understood that the Discount factor determines the Future of food apps.
Table 6. t-Test
Gender N _
X σ t d.f. Sig.
FFA Male 63 3.78 0.75 -1.48 386 0.04
Female 34 4.00 0.56
DIS Male 63 3.65 0.68 0.30 386 0.21
Female 34 3.60 0.84
TFV Male 63 3.41 0.83 -0.30 386 0.79
Female 34 3.46 0.85
DOC Male 63 3.72 0.61 0.63 386 0.34
Female 34 3.63 0.70
TA Male 63 2.58 1.08 0.41 386 0.91
Female 34 2.49 1.10
SB Male 63 3.84 0.77 -1.00 386 0.04
Female 34 3.99 0.62
The t-Test result in the table 6 indicated that there is a significant difference in the perception of future of food apps (t (386) = -1.48, p<0.05) and satisfaction behavior (t (386) = -1.00, p<0.05) based on gender. And there is no significant difference between the male and female respondents in the perception of discount factor (t (386) = 0.30, p>0.05), tampering of family values (t (386) = -0.30, p>0.05), dine-out culture (t (386) = 0.63, p>0.05) and technological anxiety (t (386) = 0.41, p>0.05).

M. Senthil et al. / Int. J. Food System Dynamics 11 (2), 2020, 139-152
148
Figure 7. Mean Plot Age Vs Discount Factor Figure 8. Mean Plot of Place of Living Vs Perception on
Future of Food Apps
ANOVA results for the indicated significant differences with the different age groups for the discount factor (F (4, 383) = 3.899, p<0.05), Post hoc test using LSD method shows that the age group of 4 0 – 54 differs significantly from other age groups. Whereas there are no significant differences among the different age groups for the factors like FFA (F(4, 383) = 1.934, p>0.05), TFV (F(4, 383) = 2.298, p>0.05), DOC (F(4, 383) = 1.113, p>0.05), TA (F(4, 383) = 0.652, p>0.05) and SB (F(4, 383) = 0.832, p>0.05). There are no significant differences among the married, single and forced singularship in the perception of variables like FFA (F(2, 385) = 1.361, p>0.05), DIS(F(2, 385) = 0.448, p>0.05), TFV (F(2, 385) = 1.997, p>0.05), DOC (F(2, 385) = 2.667, p>0.05), TA (F(2, 385) = 1.021, p>0.05)and SB (F(2, 385) = 0.382, p>0.05).
Table 7. ANOVA
Particulars FFA DIS TFV DOC TA SB
D.f. F P F P F P F P F P F P
Age 4,383 1.934 0.111 3.899 0.006 2.298 0.065 1.113 0.355 0.652 0.627 0.832 0.509
Relationship
status 2,385 1.361 0.261 0.448 0.640 1.997 0.141 2.667 0.075 1.021 0.364 0.382 0.683
Place of
Living 3,384 2.669 0.048 2.351 0.077 1.540 0.209 0.455 0.714 2.303 0.082 0.242 0.867
Income
Level 5,382 0.708 0.619 1.142 0.344 0.479 0.791 1.353 0.250 2.235 0.057 0.681 0.639
Occupation 5,382 1.612 0.165 1.102 0.365 1.140 0.345 1.564 0.178 1.746 0.132 1.103 0.364
Educational
Qualification 1,386 0.145 0.704 0.454 0.502 0.111 0.740 0.960 0.330 1.076 0.302 0.472 0.494
When considering the respondents from various places of living, there is no significant differences among the respondents from Metro, Urban, Semi-urban and rural areas in the perception of variables like DIS(F(3, 384) = 2.351, p>0.05), TFV (F(3, 384) = 1.540, p>0.05), DOC(F(3, 384) = 0.455, p>0.05), TA (F(3, 384) = 2.303, p>0.05)and SB (F(3, 384) = 0.242, p>0.05). There is a significant difference among the respondents from various places of living in the perception of the variable FFA (F(3, 384) = 2.669, p<0.05). There are no significant differences among the different income level groups in the perception of variables like FFA (F(5, 382) = 0.708, p>0.05), DIS (F(5, 382) = 1.142, p>0.05), TFV (F(5, 382) = 0.479, p>0.05), DOC (F(5, 382) = 1.353, p>0.05), TA (F(5, 382) = 2.235, p>0.05)and SB (F(5, 382) = 0.681, p>0.05). On the different grounds of occupation also, there are no significant differences among the groups in the perception of variables like FFA (F(5, 382) = 1.612, p>0.05), DIS (F(5, 382) = 1.102, p>0.05), TFV (F(5, 382) = 1.140, p>0.05), DOC (F(5, 382) = 1.564, p>0.05), TA (F(5, 382) = 1.746, p>0.05)and SB (F(5, 382) = 1.103, p>0.05). On the grounds of educational qualifications there are no significant differences among the respondents from different qualification on the perception of variables like FFA (F(1, 386) = 0.145, p>0.05), DIS (F(1, 386) = 0.454, p>0.05), TFV (F(1, 386) = 0.111, p>0.05), DOC (F(1, 386) = 0.960, p>0.05), TA (F(1, 386) = 1.076, p>0.05)and SB (F(1, 386) = 0.472, p>0.05).

M. Senthil et al. / Int. J. Food System Dynamics 11 (2), 2020, 139-152
149
The regression analysis is performed by having satisfaction behavior (SB) as dependent variable and Technological Anxiety (TA), Future of Food applications (FFA), Discount factor (DIS), Tampering of family values (TFV) and Dine-out culture (DOC) as the independent variables. The multiple R value is 0.567, R square value stands to 0.321, F value is 8.614 and P value is less than 0.001.
The multiple correlation coefficient is 0.567 measures the degree of relationship between the actual values and the predicted values of the Satisfaction behaviour. Because the predicted values are obtained as a linear combination of Technological Anxiety (TA), Future of Food applications (FFA), Discount factor (DIS), Tampering of family values (TFV) and Dine-out culture (DOC) the coefficient value of 0. 567 indicate that the relationship between Satisfaction Behaviour and the five independent variables is reasonably strong and positive.
Table 8. Regression
Variables Unstandardized Co-efficient
SE of B Standardized Co-efficient
t value P value
TA (X1) -0.173 0.072 -0.258 -2.408 0.018
FFA (X2) 0.424 0.114 0.405 3.711 0.000
DIS (X3) 0.159 0.113 0.161 1.400 0.165
TFV (X4) 0.059 0.083 0.068 0.712 0.478
DOC (X5) 0.069 0.120 0.061 0.573 0.568
Constant 1.663 0.492 3.379 0.001
The value of R square is 0.321 simply means that about 32.1% of the variation in satisfaction behaviour is explained by the estimated SRP (Sample Regression Plane) that uses Technological Anxiety, Future of Food applications, Discount factor, Tampering of family values and Dine-out culture as the independent variables and R square value is significant at 1% level.
The multiple regression equation is
Y = 1.663 -0.173X1 + 0.424X2 + 0.159X3 +0.059X4 +0.069X5
Here the coefficient of X1 is -0.173 represents the partial negative effect of Technological anxiety on Satisfaction behaviour, holding other independent variables as constant. The estimated negative sign implies that such effect is negative that satisfaction behavior would decrease by 17.3% for every unit increase in technological anxiety and this coefficient value is significant at 5% level. The coefficient of X2
is 0.424 which represents the strong positive effect of Future of food apps on satisfaction behaviour holding other independent variables as constant. It implies that the satisfaction behaviour increases by 42.4% for every unit increase in perception on future of food applications.
Figure 9. Histogram - Regression Standardised Residual

M. Senthil et al. / Int. J. Food System Dynamics 11 (2), 2020, 139-152
150
4 Implications
Millennials seems to be the precedence audience for food delivery services as they spend a chief share of their budget on prepared food compared to that of the other generations. They have privileged demands like effortless ordering, instant delivery, one-step checkout, etc. A millennial customer gives more value for convenience and speed. Growing technology and increase in dual-career families made cooking the least in the priority list and it is important to note that most orders are placed for families. Hence families should be taken as the privileged targeted customers by the aggregators. Orders are mostly placed for dinner and to the surprise considerable percentage of respondents make the midnight orders too which depicts the lack of qualms in ordering food 24*7. More attention can be given to boost the sale of the breakfast and lunch.
People use mobile food apps because of the convenience and discounts. Hence it is the aggregators’ accountability to ensure that the application is user-friendly. Inability to revise the order placed or to return the spoilt dish perceived as the difficulty. Even Amazon and Flipkart faced with the similar issue. Food aggregators can adopt the strategy that the e-commerce giants already adopted, but need amendments as they deal with food products. There was a hostile war between the National Restaurant association of India and the food delivery aggregators over the deep discounting row. Though the aggregators have made the restaurants to come closer to the customer’s door steps through the benefit of digitalisation but thereby it also makes the customers as addicts of discounts. A new feature which is proposed by Google is ordering through voice is the most expected and acceptable mode of ordering. Interest in smart watches has got increased and thereby using it as a channel of ordering is also shown interest. Food delivery platforms can get integrated with the iOS and android smart watches which enable users to order food from their wrists with just a few taps.
Drones as the channel of delivery can avoid traffic congestion and traffic lights and thereby reduces the time of delivery and distance. Electric vehicles are also viewed as a promising mode of delivery in future with the aim of consistency and sustainability. Future of food applications is highly correlate d with the factor of discounting and satisfaction behaviour. Hence it can be understood that discounts, offers and satisfied customers has a strong hold in the future of food application. Generation X people tend to differ from other generations in the perception of discount factors. Hence they may tend to be having a preference to the healthy and traditional foods items specific rather than appealing discounts. Aggregators need not give a gender based promotional target as there is no significant differenc e between male and female in perceiving the discount factor. The differential approach can be given to the customers from various places of living like metro, urban, semi-urban and rural as they perceive the future of food apps differently.
Restaurant operators can focus on giving their customers an increased level of convenience and more discounts since these tend to be the reason for them to choose ordering food online. Letting customer to choose what, when and how to order is what desired. Customers with technological anxiety perceive that the food ordering culture tampers the family values and also they plump towards the dine -out culture. Optimisation process is vital as increase in Technological anxiety increases the perceived future of food application and decreases the satisfaction behaviour. The customers with technological anxiety are less likely to use it or to recommend it. Aggregators may take steps to reduce the technological anxiety by making more user friendly and ensuring that the orders are received and will be delivered at the place and time as promised.
5 Conclusion
This study found that online ordering is quite popular among the masses of India. Future of food applications rely on the discounting factor. Technological anxiety can have a negative effect on the satisfaction behaviour. Deep discounting and the drift between NRAI and aggregators are the recent topics which hits all the news forums. Hence the study is contemporary and novel in its nature. Researchers are yet to explore the present trends and future of Foodtech industry and hence left with the lot of scopes for future studies. As the limitation this study was conducted in only India and findings may not be generalized to the other countries. As the survey was conducted online there might be systematic differences among the respondents.

M. Senthil et al. / Int. J. Food System Dynamics 11 (2), 2020, 139-152
151
Acknowledgement
This research work was sponsored by Alagappa University for the theme based research project under the theme “E-Logistics and supply chain Management” from MHRD (Ministry of Human Resource Development), India through RUSA 2.0.
References
Arji Mariam, J., Sreedharan, N.V., and Sreena, K. (2019). Consumer Perception of Online Food Delivery Apps in Kochi. International Journal of Innovative Technology and Exploring Engineering. 8(752) Available at https://www.ijitee.org/wp-content/uploads/papers/v8i7s2/G10520587S219.pdf.
Bartlett, J.E., Kotrlik, J.W., and Higgins, C.C. (2001). Organizational Research: Determining Appropriate Sample Size in Survey Research. Information Technology, Learning, and Performance Journal, 19: 43-50.
CNBCTV18 (2019). Young Turks: Experts discuss cloud kitchen & the latest disruptions in online food delivery. Available at https://www.cnbctv18.com/videos/young-turks/young-turks-experts-discuss-cloud-kitchen-the-latest-disruptions-in-online-food-delivery-4547871.htm.
Cochran, W.G. (1977). Sampling Techniques. 3rd Edition, John Wiley & Sons, New York.
Deloitte Global Mobile Consumer Survey (2016). Trends from around the world. Available at https://www2.deloitte.com/mu/en/pages/technology-media-and-telecommunications/articles/global-mobile-consumer-survey.html
Di Iorio, C.K. (2005). Measurement in health behaviour: methods for research evaluation. Chapter 10. Jossey-Bass, San Francisco, USA: 176–210.
Economics times (2019). Ratna Bhushan. Food aggregators like Swiggy, Zomato making consumers discount addicts. Available at https://economictimes.indiatimes. com/industry/services/hotels-/-restaurants/food-aggregators-like-swiggy-zomato-making-consumers-discount-addicts/articleshow/67447097.cms.
Euromonitor International Market research blog (2019). Miranda Lambert. The Future of Food is Delivery. Available at https://blog.euromonitor.com/the-future-of-food-is-delivery/.
Forbes India (2019) (Sep). The Food Issue, The Discount Dilemma: 34-39.
Garson, G.D., (2006). Validity. In statnotes: Topics in multivariate analysis. North Carolina State University (NCSU).
Global Newswire New york (2019). Online On-Demand Food Delivery Services Market by Business Model and Geography - Global Forecast & Analysis 2019-2023 – Infinity Research Limited. Available at https://www.reportlinker.com/p05823461/Online-On-Demand-Food-Delivery-Services-Market-by-Business-Model-and-Geography-Global-Forecast-Analysis.html?utm_source=GNW.
Hair J.F., Black W.C., Babin B.J., Anderson R.E., and Tatham R.L. (2006). Multivariate data analysis 6th Edition. Pearson Prentice Hall. New Jersey.
IMARC (2019). India Online Food Delivery Market: Industry Trends, Share, Size, Growth, Opportunity and Forecast 2019-2024. Available at https://www.imarcgroup.com/india-online-food-delivery-market.
Lenina, Svb. (2017). eatlex.com: Online Food Delivery Service. Available at https://www.researchgate.net/publication/327222415_eatlexcom_Online_Food_Delivery_Service.
McKinsey & Company (2016). Carsten Hirschberg, Alexander Rajko, Thomas Schumacher, and Martin Wrulich, The changing market for food delivery. Available at https://www.mckinsey.com/industries/technology-media-and-telecommunications /our-insights/the-changing-market-for-food-delivery.
Meuter, M., Ostrom, A., Bitner, M., and Roundtree, R. (2003). The Influence of Technology Anxiety on Consumer Use Experiences With Self-Service Technologies. Journal of Business Research, 56: 899-906. Available at https://doi.org/10.1016/S0148-2963(01)00276-4 .

M. Senthil et al. / Int. J. Food System Dynamics 11 (2), 2020, 139-152
152
Pigatto, G., Machado, J., Negreti, A. and Machado, L. (2017). Have you chosen your request? Analysis of online food delivery companies in Brazil. British Food Journal, 119(3): 639-657. Available at https://doi.org/10.1108/BFJ-05-2016-0207.
Priyadharshini., R. (2017). Consumer perception towards MNC fast food outlets in Coimbatore. International Journal of Applied Research, 3(3). Available at http://www.allresearchjournal.com/archives/-2017/vol3issue3/PartD/3-3-54-357.pdf.
Rathore, S.S., Chaudhary, M. (2018). Consumer's Perception on Online Food Ordering. International Journal of Management & Business Studies, 8(4). Available at http://www.ijmbs.com/Vol8/issue4/2-suryadev-singh-rathore.pdf.
Samsudin, N.A., Khalid, S.K., Kohar, M.F., Senin, Z., and Ihkasan, M.N. (2011). A customizable wireless food ordering system with realtime customer feedback. IEEE Symposium on Wireless Technology and Applications (ISWTA): 25-28. Available at https://core.ac.uk/download/pdf/12007817.pdf.
Stress and anxiety in the digital age: The dark side of technology (2018). Available at https://www.open.edu/openlearn/health-sports-psychology/mental-health/managing-stress-and-anxiety-the-digital-age-the-dark-side-technology.
Sydney Food Scene Dying Because of Delivery Culture (2019). Available at https://vision.org.au/radio/news/sydney-food-scene-dying-because-of-delivery-culture/.
Tabachnick, B.G., Fidell, L.S. (2019), Seventh Edition Using Multivariate Statistics. Pearsons education inc. Available at https://www.pearsonhighered.com/assets/preface /0/1/3/4/0134790545.pdf.
Telegraph India (2019). Anoothi Vishal. Discount culture needs to go for quality eating out. https://www.telegraphindia.com/culture/food/discount-culture-needs-to-go-for-quality-eating-out/cid/1698855.
The Restaurant times (2019). Why Mobile Food Ordering Apps are the Future of Food Delivery. Available at https://www.posist.com/restaurant-times/posist-product/why-mobile-ordering-apps-are-the-future-of-food-delivery.html.
Times of India (2019). John Sarkar and Amin Ali. Food apps can't set discounts: Restaurants. Available at https://timesofindia.indiatimes.com/business/india-business/food-apps-cant-set-discounts-restaurants/articleshow/70744149.cms.