changing students’ knowledge, … report_9-22...final report september 2010 ... removing vending...
TRANSCRIPT

Cu
ltiv
ati
ng
A N
ew G
ener
ati
on
September 2010
CHANGING STUDENTS’ KNOWLEDGE, AT TITUDES AND BEHAVIOR IN RELATION TO FOOD
AN EVALUATION OF THE
SCHOOL LUNCH INITIATIVE
A REPORT BY THE DR. ROBERT C. AND VERONICA ATKINS
CENTER FOR WEIGHT AND HEALTH, UNIVERSITY OF CALIFORNIA AT BERKELEY
COMMISSIONED BY THE CHEZ PANISSE FOUNDATION

AN EVALUATION OF THE SCHOOL LUNCH INITIATIVE
Final Report
September 2010
Authors: Suzanne Rauzon,a May Wang,a,b Natalie Studer,a Pat Crawforda
Principal Investigator: May Wanga University of California at Berkeley—The Dr. Robert C. and Veronica Atkins Center for
Weight and Health, College of Natural Resources and School of Public Healthb University of California at Los Angeles—School of Public Health
Funding for this report provided by
The Chez Panisse Foundation through the generous support of the Rodale Inc.
and the Rosalinde and Arthur Gilbert Foundation
The School Lunch Initiative is a project of the Chez Panisse Foundation,
the Center for Ecoliteracy, and the Berkeley Unified School District
A B O U T T H E S C H O O L L U N C H I N I T I AT I V E
The School Lunch Initiative was created in 2004 to connect formal academic subjects with experiential
learning in instructional gardens, kitchen classrooms and the school classroom. It was formed as a
public-private partnership among:
The Chez Panisse Foundation
Founded by Alice Waters in 1996, the Chez Panisse Foundation develops and supports educational
programs that use food traditions to teach, nurture, and empower young people. The Foundation envisions
a curriculum, integrated with the school lunch service, in which growing, cooking, and sharing the food at
the table give students the knowledge and values to build a humane and sustainable future.
The Center for Ecoliteracy
The Center for Ecoliteracy, a leader in the green schools movement, has worked with schools and
organizations in more than 400 communities during the past 15 years. Best known for its work with school
gardens, lunches, and integrating sustainability into the curricula, the Center also offers books, teaching
guides, professional development seminars, a sustainability leadership academy, and consulting services.
The Berkeley Unified School District
The mission of the Berkeley Unified School District, a diverse community deeply committed to public
education, is to ensure that all students discover and develop their special talents, achieve their educational
and career goals, become life-long learners, and succeed in a rapidly changing society.
Table of Contents
S U M M A R Y O F F I N D I N G S
Home and Family Influences page 1
School Lunch Initiative Impacts page 2
Conclusions page 3
Section one: I N T R O D U C T I O N
Food in Schools page 4
History of Food and Garden Programs in the Berkeley Unified School District page 5
The School Lunch Initiative page 7
Section two: T H E E VA LUAT I O N
Evaluation Goals and Research Questions page 9
Evaluation Research Design page 9
Research Methods page 12
Research Participants page 14
School Settings page 18
Section three: R E S U LT S
How the School Lunch Initiative Evolved Over Three Years page 19
Influence of the School Lunch Initiative page 23
Impacts of the School Lunch Initiative on Students page 26
Limitations page 40
Section four: C O N C L U S I O N S page 41
Section five: R E C O M M E N D AT I O N S
Program Enhancements page 42
Policy page 43
Research page 43
Section six: A C K N O W L E D G M E N T S page 44
A P P E N D I C E S page 45
Appendix A: Research Methodology
Appendix B: Data Collection Method and Timeline
Appendix C: Student and Household Questionnaires
Appendix D: Detailed Results
R E F E R E N C E S page 94


{ 1 }
Summary of Findings
S U M M A R Y O F F I N D I N G S
The Dr. Robert C. and Veronica Atkins Center for Weight and Health at U.C.
Berkeley conducted a prospective study of fourth and fifth graders over
three years (2006-2009) with the aim of evaluating the School Lunch Initiative
in the Berkeley Unified School District, California. The School Lunch Initiative,
a collaborative partnership among the Chez Panisse Foundation, the Center for
Ecoliteracy, and the Berkeley Unified School District, is a comprehensive program
featuring hands-on cooking and gardening classes, system-wide changes in food
and dining services, and integration of school lunch and hands-on learning with regular classroom
lessons. The goal of the evaluation was to determine the effects of student exposure to the School
Lunch Initiative on students’ knowledge about nutrition, food and the environment; attitudes toward
healthy eating and environmental responsibility; and eating behaviors.
The evaluation compared fourth- and fifth-grade students over three years from elementary and
middle schools with highly developed School Lunch Initiative components to students at schools with
lesser-developed School Lunch Initiative components. Schools with highly developed School Lunch
Initiative components had more exposure to cooking and garden classes and made greater attempts to
integrate all the components. The following describes the main findings.
Home and Family In!uences
• Families say they eat dinner together, but few involve their child in meal preparation
at home. More than half of the families of students in the study reported eating dinner
together (in and outside the home) every day. However, fewer than 30% of households reported
involving their child in preparing these meals.
• Parents say the School Lunch Initiative affects their child’s eating habits. Parents with children
in schools with highly developed School Lunch Initiative components were more likely than
parents with children in schools with lesser-developed School Lunch Initiative components to
agree that school had changed their child’s knowledge about making healthy food choices (60%
versus 36%) and their child’s attitudes about food (42% versus 19%), and had improved their
child’s eating habits (35% versus 16%).
Th
e C
hez
Pan
isse
Fou
nda
tion
| S
choo
l L
un
ch I
nit
iati
ve /
Eva
lua
tion
Pro
ject

{ 2 }
Summary of Findings
School Lunch Initiative Impacts
• Student Knowledge
Nutrition knowledge scores were higher. Fourth-grade students attending elementary schools
with highly developed School Lunch Initiative components had higher nutrition knowledge
scores in Year One than those attending schools with lesser-developed School Lunch Initiative
components. By Year Three, seventh-grade students attending the middle school with the most
highly developed School Lunch Initiative program had increased their nutrition knowledge scores
by 5% over the previous year, while students attending the other two middle schools, which had
lesser-developed components, had decreased their knowledge scores by 6% in one school and 14%
in the other.
• Student Food Preferences
Younger students had a higher preference for fruits and vegetables. In Year One, preference
for a variety of fruits and vegetables, especially green leafy vegetables, was clearly greater among
students from schools with highly developed School Lunch Initiative components.
• Student Attitudes
Middle school students had positive attitudes about school food, fresh produce and the
environment. Students attending the middle school with highly developed School Lunch Initiative
components in Year Three showed more positive attitudes toward eating the food served at school,
liking the cafeteria, agreeing that produce tastes better in-season, and agreeing that eating choices
can help or hurt the environment compared to students attending the other two middle schools,
which had lesser-developed School Lunch Initiative components.

{ 3 }
Summary of Findings
• Student Eating Behaviors
Younger students increased fruit and vegetable intake by more than one serving daily.
Fourth-grade students in the fifth grade in Year Two who attended the schools with highly
developed School Lunch Initiative components had changed their eating behavior in the
following ways:
• Increased their eating of vegetables by nearly 1 serving, and increased their eating of both
fruits and vegetables by about 1.5 servings, while those attending schools with lesser-
developed School Lunch Initiative components had decreased their eating of both fruits
and vegetables by 0.4 serving;
• Increased their eating of fruits during out-of-school eating by 0.3 serving, while students
attending schools with lesser-developed components decreased eating fruits by 0.4 serving;
• Increased their eating of vegetables during in-school eating by 0.6 serving, while students
attending schools with lesser-developed components decreased eating vegetables by 0.2
serving.
Continued exposure in middle school may sustain fruit and vegetable intake. Seventh-grade
students in the two middle schools with higher exposure to the School Lunch Initiative showed
small increases in total fruit and vegetable consumption from the year before when they were
in the sixth grade. Seventh-grade students in the other middle school, where the School Lunch
Initiative exposure was less, showed a decrease in total fruit and vegetable consumption of about
one serving per day.
Conclusions
The School Lunch Initiative is a comprehensive effort to integrate cooking and gardening education
into the academic school day in Berkeley elementary and middle schools while revamping the school
meal offerings and dining environment. The School Lunch Initiative is effective in increasing student
nutrition knowledge, as well as preference for and consumption of healthy foods, particularly fruits
and vegetables among elementary school students. Students’ attitudes about the taste and health value
of school lunch improved as the changes were put into place. Continued School Lunch Initiative
exposure into middle school may be important in mitigating negative changes in eating behaviors in
the middle school period.

{ 4 }
Section one: Introduction
I N T R O D U C T I O N
Food in Schools
Initiated in the 1940s, the U.S. National School Lunch Act has enabled public
and non-profit private schools to serve free or low-cost meals to more than 30
million children a year [1].
Over the last decade, there has been a growing concern about the quality of food
available to children at school. The dramatic rise in childhood obesity—nearly
18% of U.S. children ages 12 to 19 are obese [2]—coupled with a concern about
the environmental impact of our food choices, have fueled an interest in teaching
children about the entire food production cycle and introducing changes in school meals to help
students make better eating decisions. The school setting can play an important role in reinforcing
lifelong positive food choices and physical activity habits [3-9].
Schools around the country have attempted to make changes to the food served in schools. Some
changes have shown promise, such as improving the nutritional quality of foods served in school,
removing vending machines and sugar-sweetened beverages, reducing the presence of low-quality
foods (e.g., high-calorie processed foods of low nutritional value) [10-11], or serving school breakfast
to all students, which may help maintain a child’s healthy weight [12]. However, these changes to
school food have often been partial or incremental and not well integrated with environmentally
themed or regular classroom lessons.
Schools in the Berkeley Unified School District made early attempts to comprehensively change the
relationship children have with food and make the connection between food, health and academic
achievement. The Edible Schoolyard, founded by Alice Waters, creator of the Chez Panisse Restaurant,
is the most widely known among these efforts. The goal of programs like this is to expose children
to the experience and techniques of growing and preparing food, with the objective of increasing
children’s willingness to try new foods, especially grains and peak-season produce grown in gardens
at school.
Changing children’s eating behaviors in this way may have potential health benefits. Eating ample
whole grains, fruits and vegetables is thought to reduce the risk of developing diabetes and heart
disease, and may reduce the risk of developing obesity [13-14]. But adolescents in the United States eat
only about 3.5 servings of fruit and vegetables a day, compared to the recommended 7 to 8 servings
[15-16], and fruit and vegetable consumption often declines during the teen years [17-18].

{ 5 }
Section one: Introduction
Today, gardens have become a popular addition to school campuses, and there are indications that
garden programs may positively influence children’s eating patterns. Studies that have looked at
garden-based programs suggest that they may increase children’s food knowledge and their preference
for or comsumption of fruits and vegetables [19-23], although the effect seems to be more likely with
fruits than with vegetables [24-26].
Efforts building upon the nascent work in Berkeley of the Edible Schoolyard, the Food Systems Project,
and the subsequent School Lunch Initiative, the comprehensive program that is the subject of this
evaluation study, are taking place across the country in an attempt to change school food choices or
offer education about nutrition, gardening and cooking in schools. But there are few research reports
of successful multi-component, community-driven, school-based programs that integrate lessons
about food, the environment and nutrition taught in garden and cooking classes within the academic
school day while simultaneously making extensive changes to the school food environment. This report
attempts to answer some of the questions about the effectiveness of such a program.
History of Food and Garden Programs in the Berkeley Uni"ed School District
The Berkeley Unified School District in Berkeley, California has a long history of environmental
education in its schools. Efforts can be traced back to the innovative 1970s WEY Project (Washington
Environmental Yard) at Washington Elementary School. That project removed the asphalt-dominated
playground and renewed the site’s ecological diversity, creating opportunities for hands-on
environmental curricula in the school [27].
The Edible Schoolyard at Martin Luther King Middle School was started by Alice Waters in 1994 to
address food in a whole-systems way in the curriculum. Support from Alice Waters and the Chez
Panisse Foundation led to the installation of an extensive school garden and a large, well-equipped
cooking classroom as well as the incorporation of regularly scheduled garden and cooking classes into
the school day at Martin Luther King Middle School.
In 1998, the Center for Ecoliteracy convened 17 Berkeley community-based organizations to develop
the Food Systems Project (FSP), a USDA-funded project. They introduced food policies at the school
district and city levels, established salad bars and gardens at each of Berkeley’s elementary schools, and
brought fresh, organic produce to the lunchroom. The Berkeley Unified School District food policy
was the first school district food policy in the nation. It informed the federal mandate for every school
district participating in USDA’s National School Lunch or School Breakfast Programs to implement a
wellness policy.
{ 6 }
Section one: Introduction
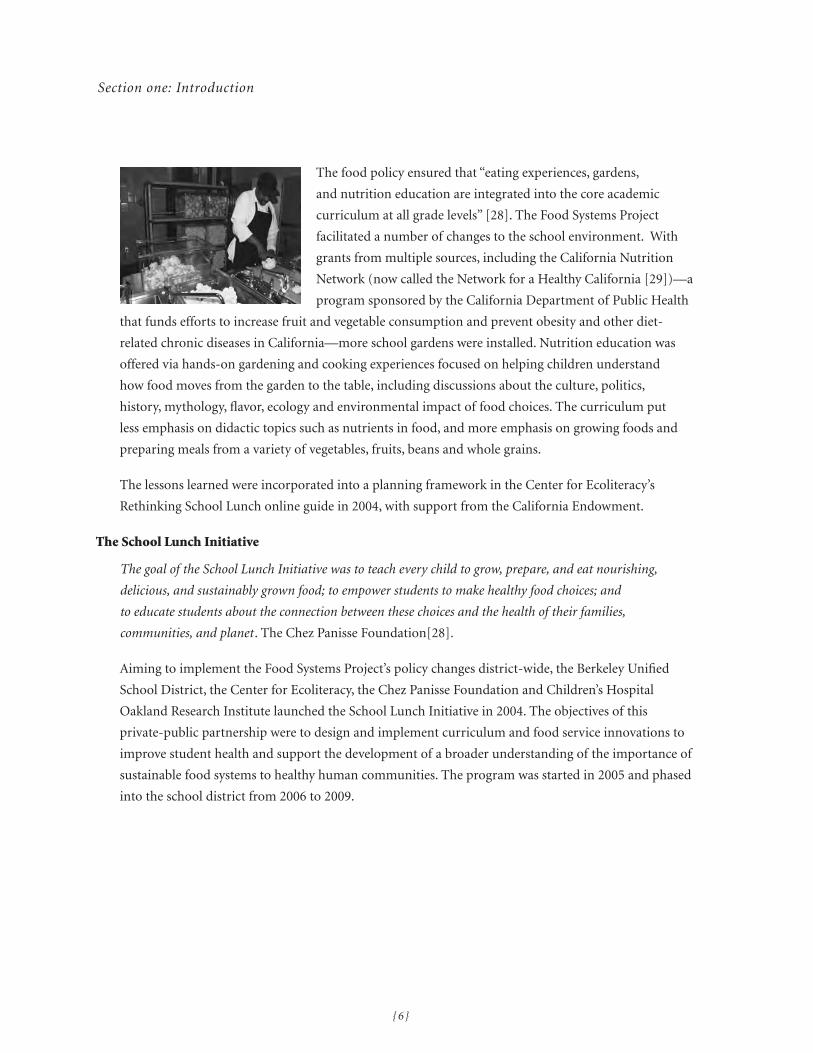
The food policy ensured that “eating experiences, gardens,
and nutrition education are integrated into the core academic
curriculum at all grade levels” [28]. The Food Systems Project
facilitated a number of changes to the school environment. With
grants from multiple sources, including the California Nutrition
Network (now called the Network for a Healthy California [29])—a
program sponsored by the California Department of Public Health
that funds efforts to increase fruit and vegetable consumption and prevent obesity and other diet-
related chronic diseases in California—more school gardens were installed. Nutrition education was
offered via hands-on gardening and cooking experiences focused on helping children understand
how food moves from the garden to the table, including discussions about the culture, politics,
history, mythology, flavor, ecology and environmental impact of food choices. The curriculum put
less emphasis on didactic topics such as nutrients in food, and more emphasis on growing foods and
preparing meals from a variety of vegetables, fruits, beans and whole grains.
The lessons learned were incorporated into a planning framework in the Center for Ecoliteracy’s
Rethinking School Lunch online guide in 2004, with support from the California Endowment.
The School Lunch Initiative
The goal of the School Lunch Initiative was to teach every child to grow, prepare, and eat nourishing,
delicious, and sustainably grown food; to empower students to make healthy food choices; and
to educate students about the connection between these choices and the health of their families,
communities, and planet . The Chez Panisse Foundation[28].
Aiming to implement the Food Systems Project’s policy changes district-wide, the Berkeley Unified
School District, the Center for Ecoliteracy, the Chez Panisse Foundation and Children’s Hospital
Oakland Research Institute launched the School Lunch Initiative in 2004. The objectives of this
private-public partnership were to design and implement curriculum and food service innovations to
improve student health and support the development of a broader understanding of the importance of
sustainable food systems to healthy human communities. The program was started in 2005 and phased
into the school district from 2006 to 2009.

{ 7 }
Section one: Introduction
The School Lunch Initiative was designed to address health, environmental and social issues by
bringing young people into a new relationship with food as part of their educational experience in
school. It was based on the hypothesis that if young people are involved in the growing, cooking and
sharing of food at the table—as well as learning about it in the curriculum—and it is reinforced with
a healthy, nutritious school lunch, they will develop not only lifelong habits of healthy eating but also
values that support a sustainable future.
The School Lunch Initiative offers hands-on cooking and gardening classes throughout the district
along with system-wide changes in food services. The approach is to demonstrate the entire “farm to
table” process to students. For example, the school lunch is not only healthy, but it is also procured
from local and sustainable sources, freshly prepared so it tastes good and entices students with aromas
and appealing presentations and, where possible, is served in a relaxed and enjoyable social setting. To
achieve these outcomes, professional development was offered to both teachers and food service staff.
Other activities put in place included sending an annual menu calendar with recipes to the home of
each student and coordinating food harvested from the garden with recipes that are both taught in
cooking class and served for school lunch during the same month.
Each community partner played a role in the School Lunch
Initiative. The Center for Ecoliteracy engaged Berkeley Unified
teachers in a training to integrate environmental, gardening and
cooking concepts into the curriculum. The Chez Panisse Foundation
focused on overhauling the school nutrition services department by
engaging professional chef Ann Cooper and integrating the garden
and cooking curriculum with the school lunch service. The Network
for a Healthy California provided funding for kitchen and garden staff in schools with greater than
50% of students eligible for free or reduced-price meals in the school food program. The garden and
cooking program at one middle school was funded by the Chez Panisse Foundation and was enhanced
with a new dining facility funded by a bond measure passed in 2000.

{ 8 }
Section one: Introduction
Figure 1 shows the five main components of the School Lunch Initiative. These components—school
food, school dining, cooking programs, gardening programs and academic curriculum integration—
were designed to change the way children learn about food and what they eat for lunch in school.
Over the course of the project, the school food services department went from using prepared meals
to a scratch-cooking model, began serving meals buffet-style, and installed a procurement system
focused on obtaining organic, local and seasonal foods. Breakfast was provided and salad bars were
installed in all schools. Improvements were planned to make the dining environments, where possible,
more conducive to relaxed, sit-down dining. Gardens were installed in all 11 elementary and 3 middle
schools. Facilities for 13 instructional kitchens (classrooms or portable cooking carts) were also put
in place. Professional development and a conceptual framework for an integrated curriculum linking
food, culture, health and the environment were offered to district teachers.
Integrated curriculum tools and teacher training were developed to link garden, cooking and academic
subject lessons together. The Center for Ecoliteracy piloted a food and environment curriculum,
developed a guide based on science standards called Big Ideas: Linking Food, Culture, Health and the
Environment, created an instructional unit for the sixth grade on nutrition and food systems called
What’s On Your Plate, paid for a teacher liaison, and offered teacher training and coaching. The Chez
Panisse Foundation produced The Kitchen Companion: Inside the Edible Schoolyard Classroom and The
Garden Companion: Inside the Edible Schoolyard Classroom to connect school gardens and cooking
classes with the curriculum, and created Making Math Delicious, a guide for middle school hands-on
math activities, based on California Department of Education’s mathematics content standards.
Garden ClassroomHands-onEducation
Cooking ClassroomHands-onEducation
Academic CurriculumIntegration
Student ImpactKnowledge
AttitudeBehaviors
School Dining
School Food
Figure 1: School Lunch Initiative Components

{ 9 }
Section two: The Evaluation
T H E E VA L U AT I O N
Evaluation Goals and Research Questions
In 2005, the School Lunch Initiative partners engaged the University of
California Berkeley’s Dr. Robert C. and Veronica Atkins Center for Weight and
Health to evaluate the student impact of the Berkeley School Lunch Initiative.
The evaluation took place over a period of three years during implementation of
the School Lunch Initiative (2006-2009). The evaluation’s main goal was to
determine the effects of exposure to the School Lunch Initiative on students in
the following ways:
• Knowledge about nutrition, food and the environment;
• Attitudes toward healthy eating and environmental responsibility; and
• Behaviors with regard to food choices.
Secondary goals of the evaluation were to contribute to discussions about program enhancement over
the three years of implementation and to develop recommendations for future program changes and
replication. In addition, a further secondary goal was to explore possible impacts of the School Lunch
Initiative on Body Mass Index and academic performance of students.1
Specifically, the hypotheses for the evaluation were that students most exposed to the School Lunch
Initiative would show the following changes:
• Greater increases in food, nutrition and environmental knowledge;
• Positive changes in attitudes toward healthy eating behaviors and sustainable ways of procuring
food; and
• Positive changes in foods consumed, specifically, more fruits and vegetables eaten in and out of
school.
Evaluation Research Design
The evaluation hypotheses were tested using data collected in a three-year prospective study of
fourth and fifth graders in the Berkeley Unified School District. This prospective design was chosen
instead of a traditional randomized controlled trial to take advantage of the wide variability in the
implementation of the School Lunch Initiative in district schools. The evaluation compared changes in
the outcomes of interest among students who were differentially exposed to the School Lunch Initiative
due to variation in program development at individual schools. This design allowed for the evolution
1 The evaluation design was not powered to detect small changes in Body Mass Index or academic scores due to the limited number of students participating in the study.

{ 1 0 }
Section two: The Evaluation
of the School Lunch Initiative to take place “naturally” during the evaluation. Also, given the dynamic
nature of school food changes and related policy changes at both the state and school levels, it is very
difficult to establish “control” schools that do not also change over the course of a three-year study. The
reason fourth and fifth graders were selected was to assess the cumulative impact of exposure to the
School Lunch Initiative as elementary students make the transition into middle school, a critical period
of change in children’ eating habits.
The School Lunch Initiative differed in the degree to which the components were rolled out and
developed at each school site. Varying levels of student exposure to the components of the Initiative—
school food, hands-on gardening and cooking classrooms, and academic curriculum integration—
were found from one school environment to another within the Berkeley Unified School District over
the three years of the evaluation, from school year 2006-07 to school year 2008-09.
To measure this degree of variability, a review of all the elementary and middle schools in the district
was conducted in school year 2005-06. Each elementary school in the district was ranked by the degree
to which the School Lunch Initiative was developed. In Year One of the evaluation (school year 2006-
07), students were recruited from the fourth and fifth grades in four elementary schools—two at which
the School Lunch Initiative was considered “highly developed” and two at which it was considered
of “lesser development.” In the following school year, the same students were followed into the fifth
grade (in an elementary school) and sixth grade (in a middle school). In Year Three (school year 2008-
09), students continued in the study, now in the sixth and seventh grades in one of the three middle
schools. Table 1 shows a brief description of the status of the School Lunch Initiative components at
each of the study schools.

Section two: The Evaluation
{ 1 1 }
Section two: The Evaluation
Table 1: School Lunch Initiative Exposure Categories by Study Schools
Level of Exposure to School Lunch Initiative by School
Components of Exposure
Lesser-Developed School Lunch Initiative (Elementary Schools A and B)
• School Food: healthy food served
• School Dining: cafeteria seating present
• Garden: no paid staff for study grades; garden area with minimal programming; time spent in garden none to < 9 hours/year
• Cooking: no paid staff; no cooking classroom
• Lesson Integration: few teachers integrate concepts into academic curriculum
Highly Developed School Lunch Initiative (Elementary Schools C and D)
• School Food: healthy food served
• School Dining: cafeteria seating present
• Garden and Cooking: dedicated classrooms with paid staff, students attend classes 22-56 hours/year
• Lesson Integration: some teachers integrate concepts into academic curriculum
Middle School(School X)
• School Food: healthy food served
• School Dining: new dining area opened in Year Three
• Garden and Cooking: dedicated classrooms with paid staff, students attend classes 40-45 hours/year
• Lesson Integration: most teachers integrate concepts into academic curriculum
Middle School(School Y)
• School Food: healthy food served
• School Dining: cafeteria seating present
• Garden and Cooking: dedicated classrooms with paid staff, students attend classes 48 hours/year (except in seventh grade – elective only)
• Lesson Integration: few teachers integrate concepts into academic curriculum
Middle School(School Z)
• School Food: healthy food served
• School Dining: cafeteria seating present
• Garden and Cooking: dedicated classrooms with paid staff, students attend classes 20-26 hours/year
• Lesson Integration: few teachers integrate concepts into the academic curriculum

{ 1 2 }
Section two: The Evaluation
Research Methods
A mix of qualitative and quantitative methods was used in this evaluation. What follows is a
summary of the data-collection instruments for each level of evaluation—student, school and family/
community. For a more detailed description of the research methodology, see Appendix A. For details
on data collection and timeline, see Appendix B. Summaries of student and family questionnaires
discussed below are included in Appendix C.
Student Level
For each of the three years of the evaluation, participating students completed an annual three-day
food diary and a questionnaire about knowledge, attitudes and behaviors related to the objectives of
the School Lunch Initiative. Annual student academic performance scores2 and Body Mass Index from
Fitnessgram3 reports were obtained from the district. In the third year of the evaluation, a similar,
anonymous questionnaire was administered to seventh graders in the district to provide a larger
sample of students for a cross-sectional examination of the effects of exposure to the School Lunch
Initiative in the middle school years.
School Level
Semi-structured interviews were conducted annually with four to five school staff (including school
food service staff, cooking and gardening teachers, and regular classroom teachers) at each of the four
study elementary schools in Year One and Year Two of the evaluation and in all three of the middle
schools in Year Two and Year Three. The same researchers completed these interviews each year. In
addition, annual observational site visits were made to the food service environments at each study
school. Interview and observation guides were used to standardize data collection. The purpose of the
observations and interviews was to assess and record annually the length and breadth of a student’s
exposure to the School Lunch Initiative components that varied from one school to another in their
School Lunch Initiative development. Figure 2 summarizes how the intervention components were
ranked to indicate the degree of development. School rankings were confirmed with district and
community partners.
2 http://www.cde.ca.gov/ta/tg/sr/.3 http://www.cde.ca.gov/ta/tg/pf/pftprogram.asp.

{ 1 3 }
Section two: The Evaluation
Figure 2: How the Degree of School Lunch Initiative Exposure Was Assessed
Attributes of each School Lunch Initiative component were determined and then rated using a
Likert scale. Ratings for each attribute were summed to provide a total assessment score. Examples
of attributes rated for each component are shown below. The number of attributes rated varied from
fourteen for School Food to six for Lesson Integration.
Degree of implementation = N1 + N
2 + N
3 + N
4 + N
5 is the sum of the ratings for all attributes for each component.
Family/Community Level
Parents or guardians of participating students were asked to complete a one-time household
questionnaire about family socioeconomic characteristics, family food and physical activity patterns,
and related neighborhood characteristics. Most parents or guardians completed the questionnaire
in the first year of the study; however, some completed it in Year Two or Year Three. These data were
included in the analysis to provide a context for interpreting the findings.
LessonIntegration
Cooking Classes
GardenClasses
SchoolDining
SchoolFood
N1
N2
N3
N4
N5

{ 1 4 }
Section two: The Evaluation
Research Participants
The Berkeley Unified School District is a medium-sized, urban public school district, with an
enrollment of about 9,000 students in grades K-12. The students are more diverse in terms of
race/ethnicity and income than the city itself. Located in the San Francisco Bay Area of California,
Berkeley’s population is 108,000 and is 63% White, 10% African American, 18% Asian and 11%
Hispanic/Latino; among children, more than 50% are non-White [30]. Berkeley’s poverty rate is
about 20%, compared to California’s poverty rate of 14%. Table 2 shows that the enrollment of
students in the schools participating in the evaluation is similar to the enrollment in the entire
school district. The heterogeneity of the student population is due to Berkeley’s long-standing
efforts at integrating its schools. In 1968, the Berkeley Unified School District became the first
major school district in the nation to voluntarily integrate its schools. Today, a school assignment
plan based upon race, ethnicity, parent education and parent income level aims to bring a diverse
mix of students into each Berkeley school [31].
Table 2: Race/Ethnicity and Free and Reduced-Price Meal Enrollment of School Lunch Initiative Research Schools and School District at Baseline (2006-07 School Year)
Race/Ethnicity Percent in Research Schools Percent in School District***
White 27.2 29.6
African American 21.4 29.1
Hispanic/Latino 12.8 16.9
Asian 7.7 7.9
Mixed* and Other/Unknown** 31.0 16.5
Enrollment in Free and Reduced-Price Meal Program 33.1 – 65.3 40.1
* Mixed-race students defined themselves as being a member of more than one of the other categories.** Students who checked “Other” but provided a race/ethnic group defined by the U.S. Census Bureau were reclassified into the appropriate category. Remaining “Other/Unknown” students are those who either checked “Don’t Know” or defined themselves as a group that was not classified as a race by the U.S. Census Bureau. Students who checked “Native American” (n=4) were combined with “Other” category due to small numbers. ***Source: California Dept. of Education, Dataquest for 2006-07 school year. http://www.cde.ca.gov/ds/sd/cb/dataquest.asp.
Section two: The Evaluation
{ 1 5 }
Section two: The Evaluation
Four of the eleven elementary schools
in the Berkeley Unified School District
were selected for participation in the
School Lunch Initiative evaluation. At
the beginning of the evaluation, the
School Lunch Initiative components
were highly developed at two of these
schools (referred to as “schools with
highly developed School Lunch Initiative
components”) and minimally developed
at the two other schools (“schools with
lesser-developed School Lunch Initiative components”). All 414 fourth- and fifth-grade students at
these four elementary schools were invited to participate in the School Lunch Initiative evaluation
that began during the 2006-07 school year; they were followed for three years as they moved from
elementary to middle school. In the first year of the evaluation, 327 fourth- and fifth-grade students
agreed to participate. Of this sample, 134 (about 40%) of these students attended the two schools
with highly developed School Lunch Initiative components. The other 193 students attended the two
schools with lesser-developed School Lunch Initiative components. At the end of three years, 238
(73%) of the students remained in the study. The majority of students (75%) who did not complete
the evaluation did so because they left the school district; only 6% of the original participants (who
remained in the school district) chose not to complete the evaluation. Figure 3 displays the details of
student participation in the study over time.

{ 1 6 }
Section two: The Evaluation
There were no differences in the distributions of gender and parents’ educational levels between the
schools with highly developed components and those with lesser-developed components. However,
there were proportionately more students from non-Hispanic White and higher-income families in the
schools with lesser-developed components than in those with highly developed components. This is
due to the availability of funding from the Network for a Healthy California4 for greater development
of the School Lunch Initiative garden and cooking class components in schools with lower-income
children. Table 3 shows sociodemographic and neighborhood characteristics of participating students
at the beginning of the study.
* BUSD = Berkeley Unified School District
Students in study—Year Two269
Students invited to participate414
Students in study—Year One327
Students in study who declined to participate in Year 2 (6)
Students in study who declined to participate in Year 3 (13)
Students in study who left BUSD (49) or who were chronically truant (3)
Students in study who left BUSD (18)
Students in study—Year Three238
Students left BUSD* in Spring (3) or declined due to special needs (3)
Declined to participate in the study (55) or did not respond to invitation (26)
Figure 3: School Lunch Initiative Evaluation Project Participant Recruitment and Retention
4 http://www.cdph.ca.gov/programs/cpns/Pages/AboutUs.aspx.
Year Two
Year Three
Year One

Section two: The Evaluation
{ 1 7 }
Section two: The Evaluation
Table 3: Sociodemographic and Neighborhood Characteristics at Baseline (2006-07 School Year)
TotalN=3271
Schools with Lesser-Developed
Components(N=193)
Schools with Highly Developed
Components(N=134)
Significant difference2
Grade (% distribution)
FourthFifth
52.947.1
51.848.2
54.545.5 NS
Gender (% distribution)
MaleFemale
41.658.4
40.459.6
43.356.7 NS
Race/ethnicity (% distribution)
WhiteAfrican AmericanLatinoAsianMixed/Other/Unknown
26.6 21.413.5 7.930.6
31.114.013.56.7
34.7
20.232.113.49.7
24.6
**
Mother’s/female guardian’s education (% distribution)
Not living with childHigh school or lessSome collegeCollege degreeGraduate school
1.017.327.318.336.0
1.115.423.127.242.1
0.920.334.232.726.6
*
Father’s/male guardian’s education (% distribution)
Not living with childHigh school or lessSome collegeCollege degreeGraduate school
8.921.818.819.930.6
7.518.118.119.436.9
10.827.019.820.721.6
NS
Household income (% distribution)
< $40,000$40,000-$79,999$80,000
39.121.439.5
29.922.547.6
53.319.627.1
***
Number of stores that sell fresh produce within 10 minutes’ walking distance from home (Mean ±S.D.)
4.33±2.78 4.56±2.77 3.94±2.77 NS
Number of safe parks within 10 minutes’ walking distance from home(Mean ±S.D.)
3.21±2.16 3.55±2.43 2.60±1.41 ***
1 Ns may vary slightly due to missing values.2 Differences in distributions between schools with highly developed components and schools with lesser-developed components were assessed using the Chi-square test; significant differences are indicated by: *p<.05, **p<.01, ***p<.001.

{ 1 8 }
Section two: The Evaluation
School Settings
Schools have defining physical features and elements that may indirectly have an effect on the School
Lunch Initiative outcomes. For example, new food offerings at a school where there is a brightly lit and
spacious cafeteria may seem more appealing than at a school where the cafeteria is dark and cramped.
Differences in the settings of the study schools should be considered in the interpretation of the
results. Table 4 provides a description of the schools that were included in the School Lunch Initiative
evaluation.
Table 4: School Setting of School Lunch Initiative Evaluation Schools
Approximate percentage of
children enrolled in Free or Reduced-
Price Meal Program1
Approximate student
enrollment1School setting
Elementary Schools
A* 35% - 40% 260 - 280 Older buildings, redesigned playground; K-2 Chinese bicultural program
B* 35% - 40% 390 - 420 Newly built campus; arts program; K-5 Spanish Immersion program
C** 60% - 65% 300 - 320 Older building; K-5 Spanish Immersion program; extensive gardens
D** 50% 230 - 250Older, quaint buildings in a creek-side setting; some mixed-grade classrooms; programs for the deaf and the hard of hearing
Middle Schools
X 30% - 40% 900 - 980Remodeled buildings; no dining area until new dining and central kitchen opened in Year Three of evaluation
Y 50% - 60% 460 - 470 Older buildings; strong volunteer base from surrounding community and university
Z 55% - 60% 430 - 450Older buildings; Spanish Immersion program; performing arts program; this is the only middle school where families can request enrollment***
1 Source: California Dept. of Education, Dataquest. http://www.cde.ca.gov/ds/sd/cb/dataquest.asp.* Elementary schools with lesser-developed School Lunch Initiative components. ** Elementary schools with highly developed School Lunch Initiative components.***The Berkeley Unified School District has a school assignment plan based upon race, ethnicity, parent education and parent income level.

Section two: The Evaluation
{ 1 9 }
Section three: Results
R E S U LT S
How the School Lunch Initiative Evolved Over Three Years
The School Lunch Initiative implemented the components of the program
across the Berkeley Unified School District over a three-year period. The
components incorporated in the study schools are presented in Table 6 on page 22.
At the elementary school level, enrollment in the schools with the most highly
developed School Lunch Initiative components included more low-income
students. This situation reflects the fact that funding was available to hire staff to
teach cooking and gardening in schools where at least 50% of students qualified as low-income; other
schools did not have such outside funding. In comparison, at the middle school level, all three middle
schools had funding to hire staff to teach cooking and gardening.
Based on school staff interviews and annual school site-visit observations during the evaluation,
the School Lunch Initiative and student exposure to its five components—school food, school dining,
garden classroom, cooking classroom and academic curriculum integration—developed in the
following ways:
School Food
The school food service component evolved quickly. By the first year of the evaluation, all students in
elementary schools were receiving free breakfast; salad bars featuring fresh fruits and vegetables were
installed in all cafeterias; swipe-card readers were installed in all cafeterias to ensure confidentiality for
students who received free or reduced-price meals; and the meal service changed from heated meals in
packaged containers to buffet-style service of freshly prepared meals. Other changes included offering
only water and organic milk in all elementary and middle schools, and offering made-from-scratch
soups in all middle schools. Accompanying these program changes were operational changes such as
staff reorganization; equipment purchasing; staff training; and bulk, in-season food purchasing from
local sources. Since these changes began in school year 2005-06, the number of total meals served
increased by about 140%, largely due to the expansion of breakfast to all students and adding the snack
service (Table 5). Overall meal participation rates increased slightly by the end of school year 2008-09
due to an increase of 67% among students buying school lunch at full price compared to school year
2005-06. However, there were also small decreases in free and reduced-price meal participation during
the same time period. It is important to note that total meals served went up even though enrollment
in the school district went down. The Chez Panisse Foundation discusses the story of the food service
changes in more detail in their publication, Lunch Matters: How to Feed our Children Better. The Story
of the Berkeley School Lunch Initiative [28].
{ 2 0 }
Section three: Results
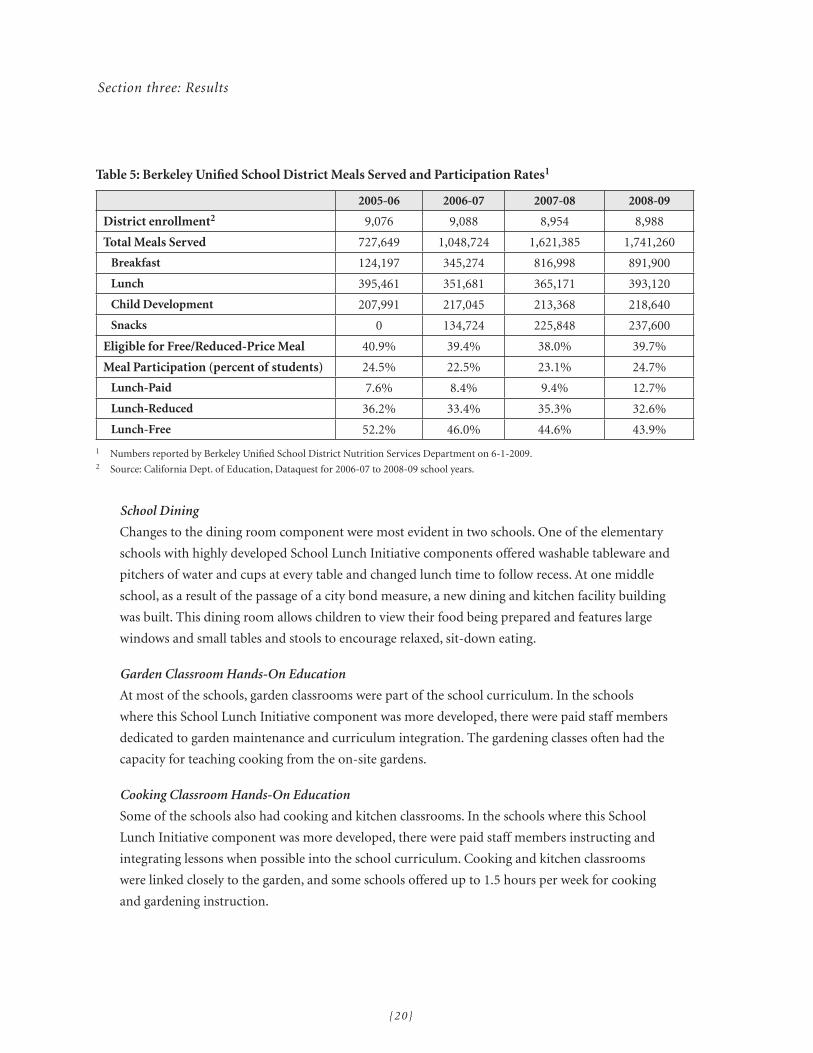
Table 5: Berkeley Unified School District Meals Served and Participation Rates1
2005-06 2006-07 2007-08 2008-09
District enrollment2 9,076 9,088 8,954 8,988
Total Meals Served 727,649 1,048,724 1,621,385 1,741,260
Breakfast 124,197 345,274 816,998 891,900
Lunch 395,461 351,681 365,171 393,120
Child Development 207,991 217,045 213,368 218,640
Snacks 0 134,724 225,848 237,600
Eligible for Free/Reduced-Price Meal 40.9% 39.4% 38.0% 39.7%
Meal Participation (percent of students) 24.5% 22.5% 23.1% 24.7%
Lunch-Paid 7.6% 8.4% 9.4% 12.7%
Lunch-Reduced 36.2% 33.4% 35.3% 32.6%
Lunch-Free 52.2% 46.0% 44.6% 43.9%
1 Numbers reported by Berkeley Unified School District Nutrition Services Department on 6-1-2009.2 Source: California Dept. of Education, Dataquest for 2006-07 to 2008-09 school years.
School Dining
Changes to the dining room component were most evident in two schools. One of the elementary
schools with highly developed School Lunch Initiative components offered washable tableware and
pitchers of water and cups at every table and changed lunch time to follow recess. At one middle
school, as a result of the passage of a city bond measure, a new dining and kitchen facility building
was built. This dining room allows children to view their food being prepared and features large
windows and small tables and stools to encourage relaxed, sit-down eating.
Garden Classroom Hands-On Education
At most of the schools, garden classrooms were part of the school curriculum. In the schools
where this School Lunch Initiative component was more developed, there were paid staff members
dedicated to garden maintenance and curriculum integration. The gardening classes often had the
capacity for teaching cooking from the on-site gardens.
Cooking Classroom Hands-On Education
Some of the schools also had cooking and kitchen classrooms. In the schools where this School
Lunch Initiative component was more developed, there were paid staff members instructing and
integrating lessons when possible into the school curriculum. Cooking and kitchen classrooms
were linked closely to the garden, and some schools offered up to 1.5 hours per week for cooking
and gardening instruction.

{ 2 1 }
Section three: Results
Academic Curriculum Integration
The curriculum integration component had some successes, but was not fully developed by the third
year of the evaluation. Several teachers at two elementary schools participated in a year of planning
meetings and curriculum workshops to bring cooking and gardening into the regular academic
curriculum. In one elementary school, a classroom teacher collaborated with the cooking and gardening
teachers to integrate gardening, food and ecologically based learning throughout the day. A few
sixth-grade teachers at Middle School X implemented selected lessons from a food-related applied
mathematics curriculum, Making Mathematics Delicious, produced by the Chez Panisse Foundation.
In addition, the sixth-grade teachers at this middle school implemented some lessons from What’s On
Your Plate that integrate classroom, cooking and gardening experiences with other projects, homework
and field trips.
An example of integration and coordination across components occurred in one of the elementary
schools with highly developed School Lunch Initiative components and one of the middle schools. Food
grown in the garden was harvested and then used in a recipe taught in cooking class; this same dish was
also served within the same month at lunch in the cafeteria.
Integration across academics, gardens, cooking,
dining, and school meals did occur in the middle
school with the most highly developed School
Lunch Initiative components. Cooking and
gardening classes were taught by paid staff on a
regular basis, meals in the cafeteria were prepared
from fresh foods in a dining area conducive to
relaxed eating, and teachers integrated selected
lessons in regular subjects with lessons in the
cooking and gardening classes. Table 6 shows
how the features of the School Lunch Initiative
components developed in all the study schools
over three years.

{ 2 2 }
Section three: Results
Table 6: School Lunch Initiative Component Development in Evaluation Schools Over Three Years
Paid cooking and gardening
staff
Hours in cooking and gardening annually
Dining environment
improvements
Curriculum integration
Food Service Changes1
YEAR 1 2 3 1 2 3 1 2 3 1 2 3 1 2 3
Elementary Schools with Lesser-Developed School Lunch Initiative
School A n/a2 0 0 n/a n/a
School B n/a 8.5 0 n/a n/a
Elementary Schools with Highly Developed School Lunch Initiative
School C n/a 24 24 n/a n/a
School D n/a 22 56 n/a
(minor) n/a
Middle Schools
School X n/a n/a
40.5 (6th
grade)
45(6th
grade)
30 (7th
grade)
(new
dining room)
n/a
School Y n/a n/a
48 (6th
grade)
48 (6th
grade)
0 (7th
grade)3
n/a
School Z n/a n/a
19.5 (6th
grade)
26 (6th
grade)
19.5 (7th
grade)
n/a
1 Food service changes included salad bars, universal breakfast and freshly prepared meals served buffet style.2 “n/a” = not applicable. By the third year, these students were in middle school.3 Cooking and gardening in the seventh grade at this school was an elective. Two students in the study took this elective, but were not included in the data analysis.

{ 2 3 }
Section three: Results
In!uence of the School Lunch Initiative
Data collected from each student’s parent or guardian regarding the home environment and from
students’ food diaries and questionnaires show that the School Lunch Initiative had positive results.
More detailed results and data tables are in Appendix D.
Influences of the Home Environment
Parents are powerful influencers on a child’s experiences with food because they shape their children’s
eating environments in a variety of ways. Parental feeding practices have been found to be associated
with child obesity [32-33]. Findings from the household questionnaire indicated that families dine
together and often eat fresh produce. The more developed the School Lunch Initiative was in a child’s
school, the more families reported these behaviors.
Parents’ perception of neighborhood safety is associated with children’s physical activity [34]; lower-
income neighborhoods tend to have fewer safe parks for children to play in and children living
in these neighborhoods may spend more of their waking hours engaged in sedentary behaviors
such as watching television [35]. Findings of the household questionnaire revealed that parents’
encouragement of their child’s physical activity in outdoor play was impeded by fear for their
children’s safety.
Families are eating dinner together.
More than half of the families of students in the study reported eating dinner together (in and
outside the home) every day. Fewer than 5% of families reported eating takeout or restaurant food
“several times a week.” This pattern is not inconsistent with a study looking at dinner preparation
in the United States that found that 70% of dinners were prepared at home [36]. About half of the
families said that dinner is prepared using mostly fresh ingredients every day and fewer than 10%
said they used mostly processed foods. However, fewer than 30% of households report involving their
child in preparing these meals (Figure 4).

{ 2 4 }
Section three: Results
Figure 4. Parent-Reported Characteristics of Family Dinner (N = 257-258)1,2
Parents value eating fresh produce each day.
More than 90% of all the parents reported that it was “very important” to serve their child fresh
fruits and vegetables every day, more than 75% thought it was very important to serve whole grains,
and almost half thought it was very important to serve locally grown foods. Parents with children in
schools with highly developed School Lunch Initiative components were more likely to think it was
very important to serve whole grains and in-season fruits and vegetables (Appendix D, Table 2).
Most families say they purchase fresh, local and seasonal foods.
About 90% of the parents said they purchased whole grains and fresh fruits and vegetables on a weekly
basis. More than 70% said they purchased locally grown food and more than 80% said they purchased
seasonal foods, but there were no differences in these reported behaviors between parents of children
attending schools with highly developed School Lunch Initiative components and parents of children
attending schools with lesser-developed School Lunch Initiative components (Appendix D, Table 3).
Fig 4
Family eats dinner together (in or outside the home) every day
Dinner prepared using mostly fresh ingredients every day
Dinner prepared using mostly processed foods several times a week or every day***Child helps prepare meals several times a week or every day
Eat takeout food or at restaurant several times a week
0 20 100 %40 60 80
Total
Schools with Lesser-Developed Components
Schools with HighlyDeveloped Components
1 The numbers of respondents vary by question.2 For more detail, see Appendix D, Table 1.Significant difference between schools with lesser-developed School Lunch Initiative components and those with highly developed School Lunch Initiative components at ***p<.001.

{ 2 5 }
Section three: Results
More parents with children in schools with highly developed School Lunch Initiative
components noticed changes in their child’s eating habits.
Parents with children in schools with highly developed School Lunch Initiative components were more
likely to strongly agree that their child’s school had changed their child’s knowledge about making
healthy food choices and their child’s attitude about what he/she eats, and had improved their child’s
eating habits. For example, about 35% of parents with children from schools with highly developed
School Lunch Initiative components felt that the school had improved their child’s eating habits and
food choices in contrast to about 16% of parents with children in schools with lesser-developed School
Lunch Initiative components (Figure 5).
Figure 5. Parent’s Attitudes Regarding Child’s Learning About Food, Health and the Environment: Percent Who Answered “Very Important” or “Strongly Agree” (N=253-258)1,2
Parents say their children are physically active, but there are barriers.
More than 65% of parents reported that their child participated in organized physical activity, such
as dance and sports. However, fewer than 50% encouraged their child to play outside every day and
fewer than 60% set limits on sedentary behaviors such as watching television. A potential barrier to
physical activity is neighborhood safety—nearly 40% of families from schools with highly developed
components and about 20% of families from schools with lesser-developed components had concerns
about neighborhood safety for outdoor play (Appendix D, Table 5).
1 The numbers of respondents vary by question.2 For more detail, see Appendix D, Table 4.Significant difference between schools with lesser-developed components and those with highly developed components at ***p<.001; ****p<.0001.
0 20 40 60 80 100 %
Fig 5
Child’s school has improved my child’s eating habits and food choices***
Child’s school has changed child's attitude about what he/she eats****
Child’s school has increased child's knowledge about making healthy food choices***
Child’s school teaches about food and the environment
Child’s school teaches about the impact of food on his/her health
Total
Schools with Lesser-Developed Components
Schools with HighlyDeveloped Components

{ 2 6 }
Section three: Results
Impacts of the School Lunch Initiative on Students
The most positive findings are related to students’ increased nutrition knowledge and a higher
preference for and consumption of fruits and vegetables, especially for the children in earlier grades
from the schools with highly developed School Lunch Initiative components. These elementary schools
happen to be those with more lower-income students and therefore qualify for funding sources for
regular cooking and gardening classes with paid teachers.
Student Knowledge
Greater exposure to the School Lunch Initiative was associated with higher nutrition knowledge
scores among fourth graders and seventh graders.
Fourth-grade students attending the elementary schools with highly developed School Lunch Initiative
components had higher nutrition knowledge scores than those attending the schools with the lesser-
developed School Lunch Initiative components (Figure 6). This difference was also observed among
fifth-grade students, but the difference was not statistically significant. As the fifth-grade students
moved to the next grade, their nutrition knowledge scores generally stayed the same or showed small
increases. By Year Three, seventh-grade students who had attended Middle School X, the middle school
with the most highly developed School Lunch Initiative components (where students spent more time
in cooking and gardening programs), had increased their nutrition knowledge scores by 5% over the
previous year, while students attending the other two middle schools with lesser-developed School
Lunch Initiative components had decreased their knowledge scores by 6% and 14%, respectively
(Appendix D, Table 8). In addition, the cross-sectional survey of seventh-grade students conducted in
Year Three showed that mean knowledge scores about food and the environment were higher among
students attending Middle School X (Figure 7).
Figure 6. Student Knowledge Scores by Grade in Year One1,2,3
0
5
10
15
20
4th * 5th 4th 5th 4th * 5th
Schools with Highly Developed Components
Schools with Lesser- Developed Components
Nutrition Food & Environment Total
1 Adjusted for race and education.2 Maximum scores possible = 20: nutrition knowledge = 8; food and environment = 12.3 For more detail, see Appendix D, Table 6.Significant difference between schools with highly developed components and those with lesser-developed components in Year One at *p<.05.

{ 2 7 }
Section three: Results
Figure 7. Nutrition and Food and Environment Knowledge Scores Among All Seventh Graders in Year Three1,2,3,4,5
Student Food Preference
Elementary school students from the schools with highly developed School Lunch Initiative
components clearly expressed a higher preference for fruits and vegetables, but by seventh grade,
preference for fruits and vegetables was similar among the various exposure groups.
In Year One, preference for fruits and vegetables was clearly greater among students from schools with
highly developed School Lunch Initiative components (Figure 8). Fourth-grade students from schools
with highly developed School Lunch Initiative components showed significantly greater increases in
preference for green leafy vegetables in particular as they moved into fifth grade, compared to fourth-
grade students from schools with lesser-developed School Lunch Initiative components (Appendix
D, Table 11). Fifth-grade students from schools with highly developed School Lunch Initiative
components also increased their preference for green leafy vegetables as they moved into the sixth
grade but, statistically, this increase was not significant. By seventh grade, preference for fruits and
vegetables was similar among the various exposure groups, except preference for green leafy vegetables
was associated with higher exposure to School Lunch Initiative components (Figure 9).
0
2
4
6
8
1012
14
16
18
20
Nutrition Total
School Z
School Y
School Xa a
bb
Food & Environment
1 Maximum scores possible = 20: nutrition knowledge = 8; food and environment = 12.2 The School Lunch Initiative was most highly developed at School X.3 Adjusted for gender, race and whether participating in the School Lunch Initiative evaluation study.4 Data were gathered in a one-time cross-sectional survey of all seventh graders willing to participate.5 For more detail, see Appendix D, Table 26.a,b Matching alphabetic superscripts indicate significant difference at p<.05.

{ 2 8 }
Section three: Results
Figure 8. Mean Student Food Preference Scores by Grade in Year One1,2,3,4
Figure 9. Food Preferences Among all Seventh Graders in Year Three1,2,3,4,5
1 Adjusted for race and education.2 Students were asked how much they liked certain fruits and vegetables; responses were scored on a scale of 0-3 (the higher the score, the greater the preference).3 Sample sizes in Year One differ from those used in examining changes in outcomes.4 For more detail, see Appendix D, Table 10.Significant difference between schools with highly developed components and those with lesser-developed components in Year One at *p<.05; **p<.01; ***p<.001; ****p<.0001.
0
1
2
3
4th **** 5th *** 4th ** 5th **** 4th * 5th** 4th *** 5th ****
Schools with Highly Developed Components
Schools with Lesser- Developed Components
Other VegetablesFruits Green Leafy Vegetables
Total
0
0.5
1
1.5
2
2.5
3
Other Vegetables
Figure 9
Fruits Green Leafy Vegetables
All Fruits & Vegetables
School Z
School Y
School X
1 Adjusted for gender, race and whether participating in the School Lunch Initiative evaluation.2 Students were asked how much they liked certain fruits and vegetables; responses were scored on a scale of 0-3 (the higher the score, the greater the preference).3 The School Lunch Initiative was most highly developed at School X.4 Data were gathered in a one-time cross-sectional survey of all seventh graders willing to participate.5 For more detail see Appendix D, Table 28.a,b Matching alphabetic superscripts indicate significant difference at p<.01.
a,b
a b

{ 2 9 }
Section three: Results
Student Attitudes
Students attending the middle school with highly developed School Lunch Initiative components in
Year Three tended to show positive trends in attitudes about food, the environment and school food.
There were no consistent differences in attitudes about food, health, the environment or school
between students attending schools with highly developed School Lunch Initiative components and
students attending schools with lesser-developed School Lunch Initiative components over the three
years of the evaluation. However, proportionately more students attending Middle School X, with
highly developed School Lunch Initiative components, in Year Three tended to show positive
attitudes toward eating the food served at school and liking the cafeteria at school, as well as agreeing
that produce tastes better in-season and that eating choices can help or hurt the environment
(Appendix D, Table 9).
Student Eating Behaviors
Elementary school students from schools with lesser-developed School
Lunch Initiative components reported eating dinner with family every day
and bringing lunch from home.
Significantly more elementary school students from schools with lesser-
developed School Lunch Initiative components said they eat family
dinner nearly every day, bring lunch from home at least 3 to 4 times a
week, eat fresh fruits and vegetables at least 3 to 4 times a week, and eat
fast food less than 3 or 4 times a week (Figure 10). This observation may
be related to students’ socioeconomic backgrounds, which were higher
among students in the schools with lesser-developed School Lunch
Initiative components. However, increases in the proportion of students
reporting these healthy behaviors were observed consistently from Year One to Year Two among
students attending schools with highly developed School Lunch Initiative components (Appendix D,
Tables 14 and 15).

{ 3 0 }
Section three: Results
There were positive trends in student-reported home dinner behaviors among elementary students
from schools with highly developed School Lunch Initiative components.
As they became fifth-grade students in Year Two, fourth-grade students from schools with highly
developed School Lunch Initiative components showed upward trends in family dinner prepared from
scratch, eating family dinner nearly every day, using recipes from school at home and helping prepare
dinner (Figure 11). In contrast, fourth-grade students from schools with lesser-developed School
Lunch Initiative components did not show increasing trends in these behaviors from the fourth to fifth
grade, although more students from these schools said they ate family dinner nearly every day and this
remained consistent from Year One to Year Two (Figure 12).
Figure 10. Student-Reported Food-Related Activities/Behaviors in Year One1,2
1 Ns vary from 286-313 due to missing values.2 For more detail, see Appendix D, Table 13.Significant difference between schools with lesser-developed components and those with highly developed components in Year One at *p<.05; ***p<.001; ****p<.0001.
Figure 10
0 10 20 30 40 50 60 70 80 90 100 %
Total
Schools with Lesser-Developed Components
Schools with HighlyDeveloped Components
Eat family dinner nearly every day*
Bring lunch from home at least 3-4 times/wk***Eat lunch served at school at least 3-4 times/wkEat fresh fruits and vegetables at least 3-4 times/wk*
Eat fast food less than 3-4 times/wk*
Uses recipes brought home fromschool at least once a monthSometimes have family conversations about healthy eating
Bring home recipes from school at least a few times a year****
Student helps prepare dinner at least 3-4 times/wkFamily prepares dinner from scratch at least 3-4 times/wk

{ 3 1 }
Section three: Results
Figure 11. Schools with Highly Developed School Lunch Initiative Components: Trends in Student-Reported Family Dinner and Home Cooking Behaviors from Year One to Year Two (Fourth Grade to Fifth Grade)1
1 For more detail, see Appendix D, Table 14.
020406080
100
Eat family dinners nearly every day
perc
ent
Year 2Year 1
Uses recipes brought home fromschool at least once/monthStudent helps prepare dinnerat least 3-4 times/wkFamily prepares dinner from scratch at least 3-4 times/wk
0
20
40
60
80
100
Eat family dinners nearly every day
perc
ent
Year 2Year 1
Uses recipes brought home fromschool at least once/monthStudent helps prepare dinnerat least 3-4 times/wkFamily prepares dinner from scratch at least 3-4 times/wk
Figure 12. Schools with Lesser-Developed School Lunch Initiative Components: Trends in Student-Reported Family Dinner and Home Cooking Behaviors from Year One to Year Two (Fourth Grade to Fifth Grade)1
Eat family dinners nearly every day020406080
100
perc
ent
Uses recipes brought home fromschool at least once/monthStudent helps prepare dinnerat least 3-4 times/wkFamily prepares dinner from scratch at least 3-4 times/wk
Year 2Year 1
Eat family dinners nearly every day0
20
40
60
80
perc
ent
Uses recipes brought home fromschool at least once/monthStudent helps prepare dinnerat least 3-4 times/wkFamily prepares dinner from scratch at least 3-4 times/wk
Year 2Year 1
100
1 For more detail, see Appendix D, Table 14.

{ 3 2 }
Elementary school students increased their fruit and vegetable consumption by more than one-half cup
(one serving) from fourth to fifth grade.
In Year One, fourth- and fifth-grade students in schools with highly developed School Lunch Initiative
components and those in schools with lesser-developed School Lunch Initiative components all ate
about the same amount of fruit and vegetable servings per day (about 4 servings, or 2 cups) (Appendix
D, Table 16). In Year Two, the younger students (fourth graders who had moved into fifth grade)
attending the schools with highly developed School Lunch Initiative components had increased their
consumption of vegetables by nearly 1 serving (0.4 cups), and for both fruits and vegetables by about
1.5 servings (0.7 cups), while those attending schools with lesser-developed School Lunch Initiative
components had decreased their consumption of both fruits and vegetables by nearly 0.4 servings (-0.2
cups) (Figure 13).
A related photography study of the contents and consumption of student lunches chosen at school
and brought from home was conducted for the Network for a Healthy California at the evaluation
elementary schools in Year Two.5 The Network funds the cooking and garden programs at the schools
with highly developed School Lunch Initiative components. Students at the schools with highly
developed School Lunch Initiative garden and cooking components had more vegetables on their plate
and consumed about 0.25 cup more vegetables than at the schools with lesser-developed School Lunch
Initiative garden and cooking components. Students who ate school lunch consumed more than three
times as many vegetables as students who brought lunch from home.
Section three: Results
5 Martin AC, Rauzon S, Wang M. Network for a Healthy California–BUSD Evaluation Report 2007-2008, October 2008.
Example of lunch chosen at school. Example of lunch brought from home.

{ 3 3 }
Section three: Results
Figure 13. Change in Mean Consumption of Fruits and Vegetables from Year One to Year Two1,2,3,4
cups
/day
cups
/day
Low (L-L) High (H-H) Low (L-L) High (H-H)
Fruits and Vegetables
Figure 13
Fourth to Fifth Grade
Fifth to Sixth Grade
a
a
b
b
SLI Exposure SLI Exposure
SLI Exposure
Low (L-Z) High (H-X)
SLI Exposure
-0.3
-0.1
0.1
0.3
0.5
0.7
-0.3
-0.1
0.1
0.3
0.5
0.7
-0.3
-0.1
0.1
0.3
0.5
0.7
Low (L-Z) High (H-X)
cups
/day
-0.3
-0.1
0.1
0.3
0.5
0.7
Fruits and VegetablesVegetables
Vegetables Fruits and Vegetables
cups
/day
cups
/day
1 Adjusted for race and education and relevant Year Two consumption; multiple comparisons were assessed using Bonferroni’s procedure.2 Standard cups/day (1 standard cup = 2 standard servings).3 H = elementary school with highly developed School Lunch Initiative components; L = elementary school with lesser- developed School Lunch Initiative components; X, Y and Z = middle schools as described. Middle schools shown had the greatest difference.4 For more detail, see Appendix D, Table 17.a,b Matching alphabetic superscripts indicate significant difference at p<.01.
cups
/day
cups
/day
Low (L-L) High (H-H) Low (L-L) High (H-H)
Fruits and Vegetables
Figure 13
Fourth to Fifth Grade
Fifth to Sixth Grade
a
a
b
b
SLI Exposure SLI Exposure
SLI Exposure
Low (L-Z) High (H-X)
SLI Exposure
-0.3
-0.1
0.1
0.3
0.5
0.7
-0.3
-0.1
0.1
0.3
0.5
0.7
-0.3
-0.1
0.1
0.3
0.5
0.7
Low (L-Z) High (H-X)
cups
/day
-0.3
-0.1
0.1
0.3
0.5
0.7
Fruits and VegetablesVegetables
Vegetables Fruits and Vegetables
cups
/day
cups
/day
Fourth to Fifth Grade
Fifth to Sixth Grade

{ 3 4 }
Section three: Results
About 80% of the increase in consumption of fruits and vegetables among elementary school
students came from in-season fruits and vegetables.
As the fourth-grade students from schools with highly developed School Lunch Initiative components
moved to the fifth grade, they increased their consumption of fruits and vegetables by nearly 1.5
servings (0.7 cups) (Figure 13). About 80% of this increase consisted of in-season fruits and vegetables,
with consumption of these foods increasing by more than 1 serving (0.6 cups). The increase in their
in-season consumption was particularly evident for fruit (Figure 14). Examples of fruits and vegetables
in season at the time students completed their food diaries (January-April) include asparagus, Brussels
sprouts, carrots, potatoes, grapefruit and navel oranges.
The increase in consumption of fruits and vegetables among fourth graders occurred both in-school
and out-of-school for fruits and in-school for vegetables.
Students in fourth grade attending schools with highly developed School Lunch Initiative components
increased their consumption of fruits by about 0.2 servings, or 0.1 cups, both in-school and out-of-
school from Year One to Year Two, compared to students attending the schools with lesser-developed
School Lunch Initiative components. The fourth-grade students in Year Two also showed increases
in their consumption of vegetables from Year One to Year Two, compared to students attending the
schools with lesser-developed School Lunch Initiative components.
Figure 14. Change in Mean Consumption of
Seasonal Fruits and Vegetables from Year One to Year Two 1, 2, 3
Schools with Highly Developed Components
Schools with Lesser- Developed Components
Cup
s/D
ay
0.3
0.2
0.1
0
-0.1
-0.2
0.4
Seasonal VegetableSeasonal Fruit
a
a
1 Adjusted for race and education and relevant baseline consumption; multiple comparisons were assessed using Bonferroni’s procedure.2 Standard cups/day (1 standard cup = 2 standard servings).3 For more detail, see Appendix D, Table 19.a Matching alphabetic superscripts indicate significant difference at p<.05.
Figure 14. Change in Mean Consumption of Seasonal Fruits and Vegetables from Year One to Year Two1,2,3

{ 3 5 }
Section three: Results
However, the increase in in-school vegetable consumption of about 0.6 servings, or 0.3 cups, was
significantly greater only in students attending schools with highly developed School Lunch Initiative
components. During this time, students attending schools with lesser-developed components
decreased their consumption of in-school vegetables by about -0.2 servings, or -0.1 cups (Figure 15).
Continued exposure to the School Lunch Initiative in middle school appears to be important to
sustain any increases in fruit and vegetable consumption achieved in fourth and fifth grades.
Sixth-grade students showed no significant increase in fruit and vegetable consumption compared to
the previous year, but seventh-grade students in the middle school with the most highly developed
School Lunch Initiative components showed small increases in total fruit and vegetable consumption,
putting them at a consumption level of about 4.5 servings of fruit and vegetables daily. Seventh-
grade students in the other middle school, where there was less exposure to School Lunch Initiative
components, showed a mean decrease in both fruit and vegetable consumption of about one serving
per day (Figure 16). The current recommendation is that adolescents consume 7 to 8 servings of
fruits and vegetables a day [15], but American children eat only an average of 3.5 servings of fruits
and vegetables daily [16]. The need for continued exposure to the School Lunch Initiative into middle
school is further supported by the observation that at the one middle school where seventh-grade
students showed a mean decrease in fruit and vegetable consumption of about one serving per day, the
cooking and garden programming was offered only as an elective.
Schools with Highly Developed Components
Schools with Lesser- Developed Components
Cup
s/D
ay
0.3
0.2
0.1
0
-0.1
-0.2 Out-of-SchoolVegetable
Out-of-SchoolFruit
In-SchoolVegetable
In-SchoolFruit
a§
a§
b**
b**
c*
c*
-0.1
-0.2
1 Adjusted for race and education and relevant baseline consumption; multiple comparisons were assessed using Bonferroni’s procedure.2 Standard cups/day (1 standard cup = 2 standard servings).3 For more detail, see Appendix D, Table 21.a-c Matching alphabetic superscripts indicate significant difference: §p<.10; *p<.05; **p<.01.
Figure 15. Change in Mean Fruits and Vegetables Eaten In-School and Out-of-School Among Fourth Graders from Year One to Year Two1,2,3

{ 3 6 }
Section three: Results
1 Adjusted for race and education and relevant Year Two consumption; multiple comparisons were assessed using Bonferroni’s procedure.2 Standard cups/day (1 standard cup = 2 standard servings).3 H = elementary school with highly developed School Lunch Initiative components; L = elementary school with lesser-developed School Lunch Initiative components; X, Y and Z = middle schools as described. Middle schools shown had the greatest difference.4 For more detail, see Appendix D, Table 18.
Vegetables
-0.6-0.4-0.2
00.20.40.6
Low (L-Y) High (H-X)
cups/day
Fruits and Vegetables
Low (L-Y) High (H-X)
cups/day
Figure 16. Change in Mean Consumption of Fruits and Vegetables from Year Two to Year Three
Low (Y) High (X)
cups/day
Low (Y) High (X)
cups/day
Vegetables
Fifth to Sixth Grade
Sixth to Seventh Grade
cups
/day
cups
/day
cups
/day
cups
/day
SLI Exposure SLI Exposure
SLI ExposureSLI Exposure
(sample size too small) (sample size too small)
-0.6-0.4-0.2
00.20.40.6
cups
/day
-0.6-0.4-0.2
00.20.40.6
-0.6-0.4-0.2
00.20.40.6
Fruits and Vegetables
Figure 16. Change in Mean Consumption of Fruits and Vegetables from Year Two to Year Three1,2,3,4
Vegetables
-0.6-0.4-0.2
00.20.40.6
Low (L-Y) High (H-X)
cups/day
Fruits and Vegetables
Low (L-Y) High (H-X)
cups/day
Figure 16. Change in Mean Consumption of Fruits and Vegetables from Year Two to Year Three
Low (Y) High (X)
cups/day
Low (Y) High (X)
cups/day
Vegetables
Fifth to Sixth Grade
Sixth to Seventh Grade
cups
/day
cups
/day
cups
/day
cups
/day
SLI Exposure SLI Exposure
SLI ExposureSLI Exposure
(sample size too small) (sample size too small)
-0.6-0.4-0.2
00.20.40.6
cups
/day
-0.6-0.4-0.2
00.20.40.6
-0.6-0.4-0.2
00.20.40.6
Fruits and Vegetables
Fifth to Sixth Grade
Sixth to Seventh Grade

{ 3 7 }
Section three: Results
Students liked the changes to the school lunch meals.
More students in Year Three said the school lunches, overall, were tastier than in Year One of the
evaluation. At the same time, fewer students in Year Three compared to Year One said the food was not
as tasty (Figure 17). More elementary school students attending schools with highly developed School
Lunch Initiative components thought the school lunches were tastier in Year Two compared to the year
before (Figures 18 and 19). Of note in Year Three, students who attended School X, the middle school
with highly developed School Lunch Initiative components, were more likely to report that the school
lunch was tastier in Year Three compared to the year before (Figure 20).
1 0
0
2 0
3 0
4 0
5 0
Year 2
Year 1
Year 3
Tastier
a,b
a,c
b,c
de
e,d
Perc
ent
Not as Tasty Healthier Not as Healthy
Figure 17. Student Perception of School Lunch from Year One, Year Two and Year Three1,2
1 The differences between years were assessed using the Chi square test or Fisher’s exact test based on the frequencies/counts.2 For more detail, see Appendix D, Table 30.a Matching superscripts indicate differences at p<.05. b-e Matching superscripts indicate differences at p<.01.

{ 3 8 }
Section three: Results
Year 2
Year 1
Figure 18. Student Perception of School Lunch
in Lesser Developed Elementary Schools from
Year One to Year Two 1,2
0
10
20
30
40
50
Tastier Not as Tasty Healthier Not as Healthy
Perc
ent
01020304050
Year 2
Year 1
Tastier
a
a
Not as Tasty Healthier Not as Healthy
Perc
ent
Figure 18. Student Perception of School Lunch in Elementary Schools with Lesser-Developed Components from Year One to Year Two1,2
Figure 19. Student Perception of School Lunch in Elementary Schools with Highly Developed Components from Year One to Year Two1,2
1 The differences between years were assessed using the Chi square test or Fisher’s exact test based on the frequencies/counts.2 For more detail, see Appendix D, Table 31.No significant differences were found.
1 The differences between years were assessed using the Chi square test or Fisher’s exact test based on the frequencies/counts. 2 For more detail, see Appendix D, Table 31.a Matching superscripts indicate differences at p<.01.

{ 3 9 }
Section three: Results
Associations of exposure to the School Lunch Initiative with increased academic test scores and
decreased Body Mass Index were not observed.
We examined change in test scores on California Standards Tests for English Language Arts and
Mathematics for students from schools with highly developed School Lunch Initiative components
versus students from schools with lesser-developed School Lunch Initiative components and did
not detect a difference (Appendix D, Table 34). An observed effect would likely require a larger
sample of study students followed over a longer period of time while controlling for other school
and family variables known to be associated with school achievement and standardized test scores,
such as school and home resources. In a recent review of the literature on children’s gardening, some
quantitative studies showed positive outcomes of school-based gardening initiatives in the areas of
science achievement [37]. However, we were unable to examine change in the California Standards
Test for Science because the test is administered starting in the fifth grade and then not again until
the eighth grade; therefore, it was only taken once by our study participants during the three-year
evaluation period.
We also examined change in Body Mass Index (BMI) using Fitnessgram assessment data for students
from schools with highly developed School Lunch Initiative components versus students from schools
with lesser-developed School Lunch Initiative components and were not able to detect a difference
(Appendix D, Table 35). The reported changes in food knowledge, food preferences and eating
behaviors between these groups does suggest that, over time, it might be possible to see a change in
BMI if the sample of study students was larger, the accuracy of Fitnessgram measurement of height
and weight was improved, and other risk factors for obesity were controlled for, such as physical
activity. A variety of strategies targeting the built environment and physical activity and eating
behaviors both in and out of school and working in concert throughout the day are likely needed to
reverse the obesity trend.
F ig u re 20 . S tu d e n t P e rc e p tio n o f S c h o o l L u n c h a t Mid d le
S c h o o l X fro m Ye a r Tw o to Ye a r Th re e 1,2
0
1 0
2 0
3 0
4 0
5 0
Year 3
Year 2
Tastier
a
a
bb
Not as Tasty Healthier Not as Healthy
Perc
ent
Figure 20. Student Perception of School Lunch at Middle School X from Year Two to Year Three 1,2
1 The differences between years were assessed using the Chi square test or Fisher’s exact test based on the frequencies/counts.2 For more detail, see Appendix D, Table 32.a Matching superscripts indicate differences at p<.01.b Matching superscripts indicate differences at p<.05.

{ 4 0 }
Section three: Results
Limitations
As in all research studies, there are limitations to consider when interpreting the results of this
evaluation. There were limitations in four general areas. First, while the difference in the degree of
program development among schools (and therefore the amount of student exposure to it) was
considerable at the elementary school level, it was smaller among middle schools. These differences
in the variability of program development may have affected the ability to detect differences at the
middle school level. Second, the food diaries kept by students did not include weekend days, when
students often change eating patterns, and therefore represent only school-day intake. Third, some
students in younger grades had difficulty completing the food diaries. This limitation was somewhat
ameliorated, however, by the fact that a trained researcher reviewed the diaries with each student in a
one-on-one session. Fourth, the measures of student height and weight used to assess changes in Body
Mass Index may not be accurate. Measurements are done by school teachers during physical fitness
testing called the Fitnessgram. Although the evaluation offered training, equipment and assistance
in taking these measurements to improve measurement accuracy, these efforts were not sufficient
to have produced research-quality data. The Fitnessgram was designed to monitor broad changes in
the physical fitness of California students, not to gather measures for research purposes. Similarly, in
exploring associations with academic performance, the use of the state’s academic test scores limited
the evaluation’s ability to track changes over time, as the tests are not designed to compare test score
results from one grade to the next [38].

{ 4 1 }
Section four: Conclusions
C O N C L U S I O N S
The School Lunch Initiative is a comprehensive effort to integrate cooking
and gardening education into the academic school day while revamping
the school meal offerings and dining environment. The results from this three-
year evaluation of the School Lunch Initiative are encouraging. The School
Lunch Initiative is effective in increasing elementary school students’ nutrition
knowledge and broadening their taste preferences for and consumption of fruits
and vegetables, especially vegetables. Students’ attitudes about the taste and health
value of school lunch became more positive as the food service and dining environment changes
were put into place. It is important to note that this evaluation detected these positive changes among
elementary school students with more exposure to the School Lunch Initiative and that these same
schools serve more low-income students.
A fully developed School Lunch Initiative program that provides cooking and gardening classes taught
by paid and trained staff, serves freshly cooked meals and offers fresh fruits and vegetables served in an
appealing way during lunch, and to some degree integrates learning about food and the environment
into the academic curriculum, is effective in increasing food knowledge and preference for and
consumption of healthy foods, in particular fruits and vegetables, especially among elementary school
students.
The transition into middle school is a challenging time for many students. Consumption of fruits and
vegetables may decline during this period. Continued School Lunch Initiative exposure into middle
school during this critical developmental period may be important in mitigating negative changes in
eating behaviors during the middle school period.

{ 4 2 }
Section five: Recommendations
R E C O M M E N D AT I O N S
Based on the School Lunch Initiative evaluation findings, the following
recommendations are offered for use in discussions about program
enhancements or replication of the School Lunch Initiative in other school
districts, for policy implications, and for further research needed.
Program Enhancements
• Sustain an integrated approach. Continue to create synergies between school food and garden
and cooking classes. Further develop curriculum integration with core academic subjects.
• Ensure teaching and regular student attendance in school gardens and kitchen classrooms.
It is not enough to build a school garden or kitchen classroom. Paid staff to conduct hands-on
learning in these environments with children attending regularly is critical for effective program
implementation.
• Maintain School Lunch Initiative programming into middle school. Middle school is often a
time when eating habits worsen as children move into adolescence. To sustain gains in healthy
eating made by program exposure in the younger grades, continued learning and availability of
healthy food options can help overcome the pull toward poor habits.
• Add a program component to reach parent and community members. Integrating a parent-
involvement component into the School Lunch Initiative is a strategy to support healthy food
choices for students away from school and at home. More insight is needed to understand why
children are not helping with cooking meals at home and about how dinner meals are prepared at
home. Most families report having home-cooked meals versus take-out or fast foods for dinner;
however, what is not known is the extent to which they rely on packaged convenience foods, which
are often higher in fat and salt, to make those meals rather than use fresh ingredients.
• Devise ways to improve the quality of food brought from home to school. It is important to
learn more about what foods are brought from home to school and the extent to which parents
and students are each involved in the decisions about food brought to school—not just for lunch,
but also for celebrations, fundraisers and other events.
• Explore ways to increase student physical activity during garden and cooking classes. Assess
the amount of physical activity children engage in while gardening and cooking at school, and
consider building in modeling and lessons about the value of physical activity and how to be
active every day, which has the potential to improve students’ physical fitness—a key factor in
preventing obesity. Consider ways to integrate with the school’s physical education program.

{ 4 3 }
Section five: Recommendations
• Reinforce a wide variety of healthy eating behaviors. Inherent in gardening and cooking with
foods harvested from the garden is a focus on fresh fruits and vegetables. Increasing the emphasis
on reducing the consumption of low-quality processed foods and sweetened beverages along with
practical tips about obtaining and choosing high-quality foods in a society with an abundance of
inexpensive, low-quality food options would complement these lessons.
Policy
• Increase student participation in the school meal program. It is important to know more about
how students and parents view the school meals, the characteristics of the students choosing
these meals, and what and how much of the school meal students are actually eating. Then, pilot
strategies to change school practices and policies aimed at increasing school meal participation.
Research
• Assess the cost and replicability of the School Lunch Initiative. Conducting a retrospective
analysis of the costs of implementing the School Lunch Initiative over the three years of this
evaluation and identifying the program components most important for replicability will help
determine the financial feasibility of replication and build the case for increasing the federal and
state meal reimbursement rate. The model should be tested in other settings with a diverse student
population.
• Evaluate program effects at younger ages and young adulthood. Assess the impact of the School
Lunch Initiative in the early grades (K-3) to determine whether the impact at these ages is greater
than with older children. Explore how exposure to the School Lunch Initiative in elementary and
middle school affects eating behaviors in high school and young adulthood.
{ 4 4 }
Section six: Acknowledgements
A C K N O W L E D G M E N T S
Thank you to the many staff, student and other contributors to this evaluation: staff Launa Craig,
Kelly Fung, Deniz Kursunoglu, Anna Martin, Caitlin Merlo; student assistants Vivian Helena
Alfonso, Jennifer Arias, Janice Ma, Prashana Mudyari, Weimin Peng, Muyun Shangguan; editor Nancy
Adess and designer Franca Bator. A special thanks to the many administrators, teachers and staff at
the Berkeley Unified School District; the participating students and their families; the School Lunch
Initiative community partners, especially the Chez Panisse Foundation and the Center for Ecoliteracy,
for making it possible to conduct this evaluation; and the Rodale, Inc. and the Rosalinde and Arthur
Gilbert Foundation for supporting this project.

{ 4 5 }
A P P E N D I X A . R E S E A R C H M E T H O D O L O G Y page 47
A detailed description of the research methods used, data management
and analysis, and sample size and research approvals.
A P P E N D I X B . D ATA C O L L E C T I O N M E T H O D A N D T I M E L I N E page 50
A summary description of how the research was conducted, including the sequence
and frequency of data collection for both qualitative and quantitative measures.
A P P E N D I X C . S T U D E N T A N D H O U S E H O L D Q U E S T I O N N A I R E S page 52
An abridged list of the questions asked in the student and household questionnaires.
A P P E N D I X D. D E TA I L E D R E S U LT S page 55
Detailed data tables for the household and student questionnaires, student food
diaries, academic test scores and student weight status.
A P P E N D I C E S


{ 4 7 }
A P P E N D I X A . R E S E A R C H M E T H O D O L O G Y
Student Knowledge, Attitudes and Preference
Student knowledge about and attitudes toward nutrition, food and the environment, and student
preference for fruits and vegetables were evaluated using a student questionnaire that was developed
in collaboration with school staff and project partners responsible for the relevant curricula; this
questionnaire was administered during class time. Curricular learning objectives provided the
basis for developing the knowledge and attitude questions (see questions in Appendix C). Students’
preferences for a list of 12 fruits and vegetables used or introduced in cooking or gardening classes
were assessed using a 4-point scale (never tasted=0, don’t like it=1; like it a little=2; like it a lot=3). The
questionnaire was reviewed by school staff and pretested for wording among students of similar age as
the participants.
Student Food Behavior
Food behavior was assessed annually in spring using a three-day food diary previously developed for
similar-aged children for the National Heart, Lung and Blood Institute Growth and Health Study.1 To
achieve quality food records and a high response rate, trained research staff met with participating
students in the classroom for about 45 minutes on a Monday to train the students to record their food
intake for the following three days (Tuesday through Thursday); classroom teachers reminded the
students daily to record their food intake. On the Friday of the same week, during another 45-minute
classroom session, individuals from a research team of about five to eight members reviewed the food
diary with each student individually and collected the diaries. During this time, the participants also
completed the student questionnaire. To address language barriers, at least one bilingual assistant was
present. To support the timely return of food records, participants received appropriate incentives each
year and reminders from their teachers during class and from research staff via phone.
Family Characteristics
Parents or guardians of students were asked to complete a questionnaire (English or Spanish) that
sought information about sociodemographic characteristics and home environment, including family
attitudes and behaviors with regard to food preparation and eating patterns. The questionnaire was
reviewed for wording clarity and relevance by research and school staff, and by a small convenience
sample of parents.
Student Exposure
Student exposure to the various components of the School Lunch Initiative was assessed using two
methods. In the first method, students were asked to recall their exposure to school cooking and garden
programs from first through third or fourth grade in order to obtain exposure history. However,
the reliability of these self-reported data was questionable and these data were not used in further
1 Crawford PB, Obarzanek E, Morrison J, et al. Comparative Advantage of 3-Day Food Records over 24-Hour Recall and 5-Day Food Frequency Validated by Observation of 9- and 10-year-old Girls. J Am Diet Assoc 1994; 94:626-630.

{ 4 8 }
analysis. The second method assessed the development of the School Lunch Initiative at each grade in
participating schools. Specifically, site observations and interviews with school staff were conducted
annually over the three years of the study to determine exposure to the various types of kitchen, garden
and food-related programs by participating students at each grade and at each school. Information
obtained from these site observations and interviews with school staff was used to categorize the
groups by levels of development of the School Lunch Initiative components.
Operationalizing Variables
Student knowledge about and attitudes toward nutrition, food and the environment, and student
preference for fruits and vegetables were operationalized by giving scores to relevant questions and
summing the scores. The nutrition and food environment knowledge scores were derived by summing
the number of correct answers, while attitude and fruit and vegetable preference scores were derived by
appropriately summing Likert-scale responses.
Student food behavior was determined by averaging three days of student food diary entries. Foods
were quantified by the average number of standard eight-ounce cups of fruits, vegetables and other
food groups, and the average number of ounces of grains consumed per day.
Family sociodemographic and home environment characteristics were represented by categorical
responses to relevant questions administered to parents/guardians or students. Parent’s education
was represented by mother’s (female guardian’s) education except when only father’s education was
available.
Student exposure to the School Lunch Initiative was operationalized by categorizing the participating
elementary schools as having “highly developed” or “lesser-developed” components of the School
Lunch Initiative in place and then tracking movement of the participating students into the three
middle schools (X, Y and Z). For example, a student who attended an elementary school with highly
developed School Lunch Initiative components in Year One was tracked as he/she moved to School Y in
Year Two and then stayed in School Y in Year Three. The School Lunch Initiative was highly developed
at School X, but varied from year to year at the other two middle schools.
Data Management and Analysis
All questionnaire data were double-entered using Epidata (v2.1, Denmark). Food diary data were
managed using a customized relational database (Access, 2003; Microsoft Corporation, Redmond,
WA) designed for analyzing dimensions of foods not usually considered in standard nutrient analysis
programs (e.g. seasonal versus non-seasonal fruits and vegetables). Nutrition students were trained
and closely supervised by a registered dietitian to enter the food diaries. For quality control purposes,
each year at least 25 food diaries were randomly selected by the dietitian, who checked the entered data
against the food diaries. An additional layer of data quality control was imposed by detecting outlying
values, which were checked against raw data and then omitted from analysis after discussion among

{ 4 9 }
senior research team members. These outlying values were determined by visually inspecting box
plots of fruits and vegetables, dairy food, and grain intakes. The statistical software SAS, version 9.1
(SAS Institute, Cary, NC), was used to analyze the data. A total of 21 food diaries were re-examined.
Of these, two diaries were incorrectly entered, and one (estimating 25 cups of vegetable intake) was
considered questionable and dropped from analysis.
Food groups (fruits and vegetables, dairy foods, and grains) were defined to be consistent with USDA’s “My
Pyramid” food groupings2; fruit juice was included in the estimation of fruit servings. Controversial
plant-based items such as potato chips and ketchup were not included in the vegetable estimates.
Student characteristics were summarized using means and standard deviations for continuous
variables and frequency distributions for categorical variables. Two approaches were used to compare
changes in knowledge, attitudes and behavior and relate them to exposure to the School Lunch
Initiative. One approach employed multivariate procedures to examine the association of cumulative
years of exposure with cooking or gardening programs, controlling for school history (same school
from kindergarten vs. different schools). The second approach grouped the students according to the
schools attended (schools with highly or lesser-developed School Lunch Initiative components) and
used analysis of covariance to examine group differences in changes in knowledge and attitude scores
and in food consumption. Both approaches controlled for baseline values and sociodemographic
characteristics. Multiple comparisons were adjusted for using Bonferroni’s test at a procedure-wise error
rate of 5%. The first approach yielded few associations between School Lunch Initiative exposure and
the outcomes of interest. Only findings resulting from the second approach are described in this report.
Sample Size and Approvals
Power calculations estimated that a final sample of 174 participants would be needed to detect
a difference of 0.5 servings in fruit and vegetable consumption between two groups, assuming a
standard deviation of 1.15, type I error of 0.05, and type II error of 0.20. Based on past experiences
with other longitudinal studies of elementary and middle school children, we anticipated an average
yearly attrition rate of 22.5% and an exclusion rate of 10% (due to incomplete or poor-quality data),
resulting in a targeted initial sample size of 330.
The protocol for this evaluation project was approved by the University of California at Berkeley’s
Committee for the Protection of Human Subjects.
2 U.S. Department of Health and Human Services and U.S. Department of Agriculture. Dietary Guidelines for Americans, 2005. 6th Edition, Washington, DC: U.S. Government Printing Office, January 2005.

{ 5 0 }
A P P E N D I X B . D AT A C O L L E C T I O N M E T H O D A N D T I M E L I N E
Table 1 contains a summary description of how the research was conducted, including the sequence and
frequency of data collection for qualitative and quantitative measures.

{ 5 1 }
Tabl
e 1.
Dat
a C
olle
ctio
n T
imel
ine
Wha
tW
hyW
hen
Who
Whe
reH
ow L
ong
How
C
ondu
cted
Stak
e-ho
lder
In
terv
iew
s an
d Si
te
Obs
erva
-ti
ons
Ass
ess
and
reco
rd
the
proc
ess
and
proc
edur
es fo
r th
e Sc
hool
Lun
ch In
itia
-ti
ve (
SLI)
pro
ject
an
d st
uden
t par
tici
-pa
tion
in a
ctiv
itie
s.
Year
1: O
ct-
June
200
6/07
Year
2: A
ug-
June
200
7/08
Year
3: A
ug-
June
200
8/09
App
roxi
mat
ely
50 p
eopl
e –
prin
-ci
pals
, foo
d se
rvic
e em
ploy
ees,
sc
hool
org
aniz
atio
n le
ader
s,
scho
ol b
oard
, adm
inis
trat
ors,
te
ache
rs, p
aren
ts, p
rinc
ipal
s an
d cu
stod
ians
and
oth
er p
roje
ct
part
ners
from
the
scho
ol d
istr
ict
and
the
stud
y sc
hool
s.
Ber
kele
y U
nifie
d Sc
hool
Dis
tric
t sc
hool
s an
d sc
hool
dis
tric
t of
fice
App
rox.
30
min
utes
to
1 ho
ur p
er
pers
on
Tele
phon
e or
in-
pers
on in
terv
iew
s in
clud
ing
site
ob
serv
atio
ns;
cond
ucte
d by
tr
aine
d st
udy
staf
f
Stud
ent
Food
R
ecor
ds
Ass
ess
the
food
be-
havi
ors
of s
tude
nts
expo
sed
to v
aria
-ti
ons
in S
LI p
rogr
am
expo
sure
.
Year
1: J
an-
June
200
7Ye
ar 2
: Jan
-Ju
ne 2
008
Year
3: J
an-
June
200
9
App
roxi
mat
ely
300
four
th-
and
fifth
-gra
de s
tude
nts
from
four
st
udy
scho
ols
in y
ear
one.
Stu
-de
nts
com
plet
ed th
e sa
me
reco
rd
in Y
ear
2 an
d Ye
ar 3
.
Ber
kele
y U
nifie
d Sc
hool
Dis
tric
t sc
hool
cla
ss-
room
s
App
rox.
1
hour
tra
inin
g,
follo
wed
by
30
min
to 1
hou
r m
eeti
ng to
re
view
and
col
-le
ct r
ecor
ds
In-p
erso
n; c
on-
duct
ed b
y tr
aine
d st
udy
staf
f
Stud
ent
Que
stio
n-na
ire
Ass
ess
the
SLI-
rela
t-ed
kno
wle
dge,
att
i-tu
des
and
beha
vior
s of
stu
dent
s ex
pose
d to
var
iati
ons
in S
LI
prog
ram
exp
osur
e.
Year
1: J
an-
June
200
7Ye
ar 2
: Jan
-Ju
ne 2
008
Year
3: J
an-
June
200
9
App
roxi
mat
ely
300
four
th-
and
fifth
-gra
de s
tude
nts
from
fo
ur s
tudy
sch
ools
in y
ear
one.
St
uden
ts c
ompl
eted
the
sam
e or
si
mila
r qu
esti
onna
ire
in Y
ear
2 an
d Ye
ar 3
.
Ber
kele
y U
nifie
d Sc
hool
Dis
tric
t sc
hool
cla
ss-
room
s
App
rox.
20-
30
min
utes
In-p
erso
n; c
on-
duct
ed b
y tr
aine
d st
udy
staf
f
Seve
nth-
Gra
de
Que
stio
n-na
ire
Ass
ess
SLI-
rela
ted
know
ledg
e, a
ttit
udes
an
d be
havi
ors
of a
ll se
vent
h-gr
ade
scho
ol
stud
ents
.
Year
3: S
ept-
June
200
8/09
App
roxi
mat
ely
450
seve
nth-
gr
ade
stud
ents
from
thre
e m
iddl
e sc
hool
s in
Yea
r T
hree
.
Ber
kele
y U
nifie
d Sc
hool
Dis
tric
t sc
hool
cla
ss-
room
s
App
rox.
20-
30
min
utes
In-p
erso
n; c
on-
duct
ed b
y tr
aine
d st
udy
staf
f
Hou
seho
ld
Que
stio
n-na
ire
Ass
ess
the
de-
mog
raph
ic a
nd
neig
hbor
hood
cha
r-ac
teri
stic
s of
sub
ject
ho
useh
olds
.
Year
s 1-
3:
Jan
2007
- M
ay 2
009
App
roxi
mat
ely
300
pare
nts/
gu
ardi
ans
of fo
urth
- an
d fif
th-
grad
e st
uden
ts in
the
stud
y fr
om
the
4 st
udy
scho
ols.
At h
ome
or
scho
olA
ppro
x. 1
5-30
m
inut
esSe
lf-ad
min
iste
red
at h
ome,
at
scho
ol o
r vi
a te
le-
phon
e in
terv
iew
by
trai
ned
stud
y st
aff
Bod
y M
ass
Inde
x an
d A
cade
mic
Pe
rfor
-m
ance
Expl
ore
SLI
asso
-ci
atio
ns w
ith
wei
ght
stat
us a
nd a
cade
mic
te
st s
core
s.
Year
1: S
prin
g 20
07Ye
ar 2
: Spr
ing
2008
Year
3: S
prin
g 20
09
All
fifth
- an
d se
vent
h-gr
ade
stud
ents
in th
e sc
hool
dis
tric
t ha
ve h
eigh
t and
wei
ght m
easu
re-
men
ts ta
ken.
All
Cal
iforn
ia s
tude
nts
com
plet
e st
anda
rdiz
ed te
sts
to a
sses
s ac
a-de
mic
per
form
ance
eac
h ye
ar.
Ber
kele
y U
nifie
d Sc
hool
Dis
tric
t sc
hool
cla
ss-
room
s
Var
ied
Teac
hers
trai
ned
by s
tudy
sta
ff
on h
eigh
t and
w
eigh
t mea
sure
s;
stan
dard
ized
test
s ad
min
iste
red
by
scho
ol s
taff

{ 5 2 }
S T U D E N T Q U E S T I O N N A I R E ( A B R I D G E D )
Knowledge QuestionsNutrition
How many servings of fruits and vegetables are healthy to eat each day?
Which food has the most sugar?
Which food has the most fat?
Which food has the most fiber?
Which lunch has the most variety of healthy foods?
Which statements are true about high fiber food?
Which statements are true about trans fats?
Which food would be the healthiest to give you energy you need for exercise?
Food/Environment
Where does corn in a corn tortilla come from?
How do fresh tomatoes become canned tomato soup?
Which food is the best for the environment; which food is least “processed?”
What does a plant use to capture energy from the sun?
Apples and pumpkins are ripe in California in which season?
Peas and asparagus are ripe in California in which season?
Lemons and oranges are ripe in California in which season?
Peaches and zucchini are ripe in California in which season?
What do plants need to survive?
What is the first thing you should do to make a salad?
How do you think people can help make less trash and waste?
Pollinators in the garden include which of the following?
Which of the following is the best example of sustainable agriculture?
Attitude Questions(Agreement Scale: minimum = 0; maximum = 3)
Food
I like to eat fruits and vegetables.
I like to try new foods.
I like whole grain foods.
I like to eat homemade meals.
Health
There are people in my life who encourage me to eat healthy.
What I eat can help or hurt my health.
Students who eat breakfast do better in school.
It is important to be physically active on most days of the week.
Environment
I know what plant or animal my food comes from.
Fruits and vegetables taste better when they are in season.
Taking care of the environment is important to me.
What I eat can help or hurt the environment.
I try to recycle, compost, and pick up trash.
School
How has the food served during lunch by your school changed this school year? (tastier, healthier)
I enjoy eating the food served at school.
I look forward to going to school.
I like the cafeteria where food is served at school.
Behavior Questions
Physical Activity
How often do you play sports, run, dance, do martial arts or do any activity that makes you sweat or breathe hard?
How many hours do you usually watch TV?
How many hours do you usually use a computer?
How often do you talk with your family about getting physical exercise?
A P P E N D I X C . S T U D E N T A N D H O U S E H O L D Q U E S T I O N N A I R E S

{ 5 3 }
How tasty do you think the breakfast meals served at your child’s school are?
How often does your child usually eat lunch served by the school?
What are the reasons that your child does not eat lunch served by the school every day or nearly every day?
In general, how healthy do you think the lunch meals served at your child’s school are?
How tasty do you think the lunch meals served at your child’s school are?
Home Meals QuestionsHow often does your child eat fresh fruit?
How often does your child eat fresh vegetables?
How often does your child eat whole grains (100% whole wheat bread, brown rice, whole wheat pasta, oatmeal)?
How often do you encourage your child to try new foods?
How many stores and markets close to where you live sell fresh fruits and vegetables (within a 5-minute drive)?
How often is dinner at your home prepared using mostly processed food (frozen dinners, boxed macaroni and cheese, instant potatoes)?
How often is dinner at your home prepared using mostly fresh ingredients?
How often does your child help prepare meals at home?
Family Practice QuestionsHow often does your family sit down and eat dinner together in or outside the home?
How often does your family eat dinner from takeout food or at a restaurant (including fast food)?
Were there any days last month when your family didn’t have enough food to eat or enough money to buy food?
How often do you limit the amount of time your children watch TV?
How often do you encourage your child to play outside?
How many parks and playgrounds are close to where you live?
How many of these parks and playground (close to where you live) would you let your child play in?
How physically active are you compared to your friends?
Family Eating Habits
How often does your family prepare dinner from scratch?
How often do you help prepare food at home?
How often does your family eat fresh fruit and vegetables?
How often does your family eat fast food?
How often do you talk with your family about healthy eating?
How often do you eat dinner with your family?
School Eating Habits
How often do you eat the lunch food served at your school?
How often do you bring lunch from home to eat at school?
Other
How often do you bring recipes home from school?
How often do you or your family make these recipes?
Preference Questions(Likeability Scale: Lowest score = 0–never tasted; Maximum score = 3–like a lot)
FruitHow much do you like: strawberries, persimmons, pears?
Green Leafy VegetablesHow much do you like: chard, spinach, kale?
Other VegetablesHow much do you like: beets, winter squash, peas, bell peppers, radishes, green beans?
H O U S E H O L D Q U E S T I O N N A I R E ( A B R I D G E D )
School Meal QuestionsHow often does your child usually eat breakfast served by the school?
What are the reasons that your child does not eat breakfast served by the school every day or nearly every day?
In general, how healthy do you think the breakfast meals served at your child’s school are?

{ 5 4 }
How important is it to you that your child’s school teaches about the relationship between physical activity and health?
(Agreement Scale: Strongly Agree to No Opinion on a 5-point scale)
My child’s school has increased my child’s knowledge about the relationship between food and the environment.
My child’s school has increased my child’s knowledge about making healthy food choices.
My child’s school has changed my child’s attitude about what he/she eats.
My child’s school has improved my child’s eating habits and food choices.
My child’s school has increased my child’s interest in taking care of the environment.
My child’s school has improved my child’s team work and social skills.
Household Questions
How many people live in your household at this time, including yourself, the child in the study, and all other adults and children?
Who lives in the household where the child in the study lives most of the time?
In addition to this home, are there other households where the child in this study usually lives part of the time?
What is the highest grade of school completed by the mother (or female guardian) living with the child in this study?
What is the highest grade of school completed by the father (or male guardian) living with the child in this study?
How many hours does the mother (or female guardian) living with the child in this study work?
How many hours does the father (or male guardian) living with the child in this study work?
What was the approximate total income, before taxes, of your household last year?
How safe do you think your neighborhood is for your child to play outside?
How easy would it be for you to find affordable and convenient sports, dance, and other physical activity programs for your child?
How often does your child play sports, run, dance, do martial arts or any physical activity that makes him or her sweat and breathe hard?
Compared to other kids the same age as your child, how physically active would you say he/she is?
Food Attitudes
(Very Important to Not Important on a 4-point scale)
How important do you think it is to serve children fresh fruits and vegetables every day?
How important do you think it is to serve children foods that are locally grown?
How important do you think it is to serve children fruits and vegetables at the time of year that they are usually grown in California?
How important do you think it is to serve children whole grains (brown rice, whole wheat bread, oatmeal)?
(Yes/No)
I purchase fresh fruits and vegetables at least once a week
I purchase foods that are locally grown.
I purchase fruits and vegetables at the same time of year that they are grown in California.
I purchase whole grain foods for my child (brown rice, whole wheat bread, oatmeal).
School Attitudes
(Very Important to Not Important on a 5-point scale)
How important is it to you that your child’s school teaches math, science, English and reading?
How important is it to you that your child’s school teaches about the impact of food on his/her health?
How important is it to you that your child’s school teaches about the relationship between food and the environment?

{ 5 5 }
1 . T H E H O M E E N V I R O N M E N T page 57
Table 1. Parent-Reported Characteristics of Family Dinner
Table 2. Parents’ Attitudes Toward Serving Healthy Foods to Child
Table 3. Parents’ Food-Purchasing Behavior
Table 4. Parents’ Attitudes Regarding Child’s Learning About Food, Health and the Environment
Table 5. Parents’ Attitudes and Perceptions Regarding Child’s Physical Activity
2 . S T U D E N T S ’ K N O W L E D G E , AT T I T U D E S A N D P R E F E R E N C E S A B O U T F O O D A N D T H E E N V I R O N M E N T page 61
Table 6. Student Knowledge Scores by Grade in Year One
Table 7. Change in Adjusted Mean Knowledge Scores from Year One to Year Two
Table 8. Change in Adjusted Mean Knowledge Scores from Year Two to Year Three
Table 9. Students’ Attitudes Toward Food, Health, Environment and School from Year One to Year Three
Table 10. Mean Student Food Preference Scores by Grade in Year One
Table 11. Change in Adjusted Mean Food Preference Scores from Year One to Year Two
Table 12. Change in Adjusted Mean Food Preference Scores from Year Two to Year Three
3 . S T U D E N T S ’ E AT I N G B E H AV I O R S page 70
Table 13. Student-Reported Food-Related Activities/Behaviors in Year One
Table 14. Trends in Student-Reported Family Dinner and Home Cooking Behaviors from Year One to Year Three
Table 15. Trends in Student-Reported Eating Behaviors/Family Conversations About Healthy Eating Year One to Year Three
Table 16. Student Consumption of Fruits and Vegetables by Grade (cups/day) in Year One
Table 17. Change in Mean Consumption of Fruits and Vegetables from Year One to Year Two
Table 18. Change in Mean Consumption of Fruits and Vegetables from Year Two to Year Three
Table 19. Mean Consumption of Seasonal Fruits and Vegetables from Year One to Year Two
Table 20. Mean Consumption of Seasonal Fruits and Vegetables from Year Two to Year Three
Table 21. Change in Mean Consumption of Fruits and Vegetables Eaten In-School and Out-of-School Year One to Year Two
Table 22. Mean Consumption of Fruits and Vegetables Eaten In-School and Out-of-School Year Two to Year Three
Table 23. Student Consumption of Sweetened Beverages (fluid ounces/day) by Grade in Year One
Table 24. Mean Consumption of Sweetened Beverages (fluid ounces/day) from Year One to Year Two
Table 25. Mean Consumption of Sweetened Beverages (fluid ounces/day) from Year Two to Year Three
A P P E N D I X D . D E T A I L E D R E S U LT S
This appendix presents more detail on the data collected in the School Lunch Initiative Evaluation,
including the household and student questionnaires, student food diaries, academic test scores and Body
Mass Index data from Fitnessgram physical fitness assessments.

{ 5 6 }
4 . S E V E N T H - G R A D E S U R V E Y A B O U T K N O W L E D G E , AT T I T U D E S A N D P R E F E R E N C E S A B O U T F O O D A N D T H E E N V I R O N M E N T page 84
Table 26. Nutrition and Food and Environment Knowledge Scores Among All Seventh Graders in Year Three
Table 27. Attitudes Toward Food, Health, the Environment and School Among All Seventh Graders in Year Three
Table 28. Food Preferences Among All Seventh Graders in Year Three
Table 29. Student-Reported Food-Related Activities/Behaviors Among All Seventh Graders in Year Three
5 . P E R C E P T I O N O F T H E S C H O O L L U N C H P R O G R A M page 88
Table 30. Student Perception of School Lunch from Year One, Year Two and Year Three
Table 31. Student Perception of School Lunch from Year One to Year Two
Table 32. Student Perception of School Lunch from Year Two to Year Three
Table 33. Student Perception of School Lunch by All Seventh Graders in Year Three
6 . S T U D E N T A C A D E M I C P E R F O R M A N C E page 90
Table 34. Mean Academic Performance Test Scores
7 . S T U D E N T W E I G H T S T AT U S page 92
Table 35. Overweight and Obesity Rates by Sex, Grade and School in Year Two and Year Three

{ 5 7 }
1. The Home Environment
The outcomes of school programs to change children’s food behaviors may be affected by home
environments and family influences. Tables 1-5 show how parents of children participating in the
School Lunch Initiative evaluation responded to questions about aspects of the home environment
and their own attitudes that may affect student knowledge, attitudes and behaviors regarding food,
nutrition, the environment and physical activity.
Eating and Preparing Family Dinner
With the exception of the use of mostly processed foods for dinner, there were no significant
differences in behaviors related to preparing or eating family dinner between parents whose children
attended schools with highly developed School Lunch Initiative components and those whose children
attended schools with lesser-developed School Lunch Initiative components (Table 1).
Table 1. Parent-Reported Characteristics of Family Dinner (N=257-2581) (percent)
Eat takeout food or at restaurant
several times a week
Child helps prepare meals several times
a week or everyday
Dinner prepared
using mostly processed
foods several times a week or
everyday
Dinner prepared using
mostly fresh ingredients
everyday
Family eats dinner together
(in or outside the home) everyday
Schools with-lesser developed components
5.6 25.6 1.2*** 52.2 64.4
Schools with highly developed components
5.3 33.0 11.6*** 48.4 50.5
Total All Schools 5.5 28.3 5.1 50.8 59.3
1 The numbers of respondents vary by question.Significant difference denoted by ***p<.001.

{ 5 8 }
Parents’ Attitudes Toward Serving Healthy Foods and Food-Purchasing Behaviors
Proportionately more parents of children attending schools with highly developed School Lunch
Initiative components thought it was “very important” to serve seasonal fruits and vegetables and
whole grains than did parents of children attending schools with lesser-developed School Lunch
Initiative components (Table 2). However, in terms of purchasing whole grains as well as seasonal,
fresh, locally grown foods or serving fresh produce, there were no differences in attitudes between
parents of children attending schools with highly developed School Lunch Initiative components
and parents of children attending schools with lesser-developed School Lunch Initiative
components (Tables 2 and 3).
Table 2. Parents’ Attitudes Toward Serving Healthy Foods to Child–Percent Who Answered “Very Important” (N=252-2551)
“I think it is very important to…”
Serve children whole grains
Serve children fruits and vegetables at the time of year that they are usually grown in
California
Serve foods that are locally grown
Serve children fresh fruits and vegetables every
day
Schools with lesser-developed components
69.6*** 48.5*** 42.5* 95.0
Schools with highly developed components
88.3*** 71.3*** 55.4* 96.8
Total All Schools 76.5 56.9 47.2 95.7
1 The numbers of respondents vary by question.Significant difference denoted by *p<.05; ***p<.001.
Table 3. Parents’ Food-Purchasing Behavior (N=244-2591) (percent)
Purchase whole grains
Purchase seasonal produce
Purchase locally grown foods
Purchase fresh fruits and
vegetables weekly
Schools with lesser- developed components 89.3 84.6 72.9 96.3
Schools with highly developed components 92.5 81.7 71.9 97.9
Total All Schools 90.5 83.5 72.5 96.9
1 The numbers of respondents vary by question.No significant difference found.
Appendices

{ 5 9 }
Parents’ Attitudes Toward Learning About Food, Health and the Environment
About 80% of parents think it is very important that their child’s school teaches about the impact
of food on his/her health and about the relationship between food and the environment. However,
proportionately more parents of children attending schools with highly developed School Lunch
Initiative components strongly agree that their child’s school had changed their child’s knowledge
about making healthy eating choices, changed their child’s attitude about what he/she eats, and
improved their child’s eating habits and food choices (Table 4).
Table 4. Parents’ Attitudes Regarding Child’s Learning About Food, Health and the Environment– Percent Who Answered “Very Important” or “Strongly Agree” (N=253-2581)
Child’s school teaches about the impact of
food on his/her health
Child’s school teaches about food and the environment
Child’s school has increased
child’s knowledge
about making healthy food
choices
Child’s school has changed
child’s attitude about what he/
she eats
Child’s school has improved
my child’s eating habits
and food choices
Schools with lesser- developed components
79.8 74.2 36.2*** 19.0**** 16.1***
Schools with highly developed components
87.4 81.1 60.2*** 41.8**** 34.8***
Total All Schools 82.6 76.7 44.9 27.2 22.9
1 The numbers of respondents vary by question.Significant difference denoted by ***p<.001; ****p<.0001.

{ 6 0 }
Appendices
Parents’ Attitudes and Perceptions Regarding Their Child’s Physical Activity
Parents’ attitudes about their child’s physical activity were generally positive, regardless of the school
attended by the child (Table 5). However, fewer than 50% of parents said they encouraged their
children to play outside nearly every day and fewer than 60% reported that they set limits on television
watching by their children. These percentages did not differ between parents whose children attended
schools with highly developed School Lunch Initiative components and those whose children attended
schools with lesser-developed School Lunch Initiative components. However, a higher percentage of
parents with children attending schools with highly developed School Lunch Initiative components
believed that their neighborhood was not very safe for their children to play outside compared to
parents with children attending schools with lesser-developed School Lunch Initiative components
(38% versus 18%, p<.01).
Table 5. Parents’ Attitudes and Perceptions Regarding Child’s Physical Activity (N=254-2591) (percent)
“Very important” that child’s
school teaches
about the relationship
between physical
activity and health
Child is “more active”
or “a lot more
active” than other
kids the same age
Child plays sports, dances,
does martial
arts or any physical activity
that makes him or her sweat and
breathe hard “4-5
times a week” or “(nearly) everyday”
“Very easy” to find
affordable and
convenient sports, dance
and other physical activity
programs for child
Think neighborhood
is “not very safe” or “not
safe” for child to play
outside
Encourage child
to play outside nearly
everyday
Families that “set limits” on the
amount of time
their children
watch TV
Schools with lesser- developed components
86.5 42.9 68.7 38.4 18.4** 46.9 59.6
Schools with highly developed components
85.3 42.6 65.2 28.4 38.1** 48.4 53.8
Total All Schools 86.1 42.7 67.5 34.8 25.5 47.5 57.5
1 The numbers of respondents vary by question.Significant difference denoted by **p<.01.

{ 6 1 }
2. Students’ Knowledge, Attitudes and Preferences About Food and the Environment
Student Knowledge
At baseline
At the beginning of the evaluation in Year One (baseline), differences in nutrition knowledge were
observed; nutrition knowledge scores were significantly higher among fourth-grade students attending
elementary schools with highly developed School Lunch Initiative components (p<.05) (Table 6).
Table 6. Student Knowledge Scores by Grade in Year One1
Nutrition(maximum score = 14)
Food and Environment(maximum score = 12)
Total(maximum score = 26)
4th Grade 5th Grade 4th Grade 5th Grade 4th Grade 5th Grade
Schools with lesser-developed components
6.9* 7.4 6.3 6.3 13.2* 13.6
Schools with highly developed components
7.6* 7.8 6.9 5.7 14.5* 14.6
1 Adjusted for race and education.Significant difference denoted by *p<.05.

{ 6 2 }
Change from Year One to Year Two
In the second evaluation year, mean knowledge scores increased among all fourth-grade students
moving to fifth grade. Change in knowledge scores about food and the environment appeared to be
twice as great in students attending schools with highly developed School Lunch Initiative components
as in students attending schools with lesser-developed School Lunch Initiative components (p<.10).
However, there was no evidence to suggest that exposure to the School Lunch Initiative improved
knowledge scores among fifth-grade students moving to sixth grade (Table 7).
Table 7. Change in Adjusted1 Mean Knowledge Scores from Year One to Year Two
N Nutrition(maximum score = 14)
Food and Environment
(maximum score = 12)
Total(maximum score = 26)
Year 1Score
Change by Year 2
Year 1 Score
Change by Year 2
Year 1Score
Change by Year 2
4th to 5th grade
Elementary schools with lesser-developed components
85 6.86 0.57 6.31 0.67§ 13.16 1.35
Elementary schools with highly developed components
61 7.58 0.58 6.91 1.29§ 14.49 1.77
5th to 6th grade
Elementary schools with lesser-developed components to Middle School X or Y
54 7.55 0.20 6.39 1.27 13.94 1.50
Elementary schools with lesser-developed components to Middle School Z
18 7.07 -0.17 5.57 0.58 12.64 0.85
Elementary schools with highly developed components to Middle School X
9 6.91 -1.01 7.25 1.04 14.16 0.21
Elementary schools with highly developed components to Middle School Y or Z
28 7.99 0.24 6.60 0.83 14.59 1.02
1 Adjusted for race and education and relevant baseline knowledge.Marginal difference denoted by §p<.10.

{ 6 3 }
Change from Year Two to Year Three
As in the second evaluation year, there was no association between School Lunch Initiative exposure
and change in knowledge scores among fifth-grade students moving into sixth grade in the third year
of the evaluation. However, among sixth-grade students moving into seventh grade, students attending
the middle school with the most highly developed School Lunch Initiative components (Middle
School X) showed an increase in adjusted mean nutrition knowledge scores, while students attending a
school with lesser-developed School Lunch Initiative components showed decreases in adjusted mean
nutrition knowledge scores (Table 8). Changes in food and environment knowledge scores were not
different among exposure groups.
Table 8. Change in Adjusted1 Mean Knowledge Scores from Year Two to Year Three2
N Nutrition(maximum score = 14)
Food and Environment
(maximum score = 12)
Total(maximum score = 26)
Year 2Score
Change by Year 3
Year 2Score
Change by Year 3
Year 2Score
Changeby Year 3
5th to 6th grade
Elementary schools with lesser-developed components to Middle School X or Z
57 7.51 0.23 7.14 0.45 14.65 0.70
Elementary schools with lesser-developed components to Middle School Y
13 8.56 0.62 6.44 0.70 15.00 1.03
Elementary schools with highly developed components to Middle School X
--3 -- -- -- -- -- --
Elementary schools with highly developed components to Middle School Y or Z
50 7.91 0.18 8.10 0.10 16.01 0.28
6th to 7th grade
Middle School X 49 7.60 0.39* 7.76 0.53 15.36 0.99§
Middle School Y 17 8.28 -1.17* 7.75 0.52 16.02 -0.77
Middle School Z 32 7.82 -0.49 7.02 0.10 14.85 -0.50§
1 Adjusted for race and education and relevant knowledge in year 2.2 From Year 2 to Year 3, two of the middle schools traded rankings in terms of School Lunch Initiative development. The school that was ranked at the middle level of development in Year 2 changed its programming activities and was ranked least developed in Year 3.3 Unstable estimates for this group of students due to small sample size.Marginal and significant differences denoted by §p<.10; *p<.05.

{ 6 4 }
Student Attitudes
There were no consistent, significant differences in attitudes about food, health, the environment
or school between students from highly developed School Lunch Initiative schools and those from
lesser-developed schools over three years. However, proportionately more students attending the highly
developed Middle School X in Year Three tended to show positive attitudes about eating food served at
school, liking the school cafeteria, and agreeing that produce tastes better in-season and eating choices
can help or hurt the environment (Table 9).

{ 6 5 }
Year One Year Two Year Three
Elementary1 Elementary1 Middle Schools Middle Schools
Agree a little/Agree a lot High(N=127)
Low(N=185)
High(N=59)
Low(N=85)
X(N=52)
Y(N=18)
Z(N=34)
X(N=99)
Y(N=54)
Z(N=76)
Food
I like to eat fruits and vegetables.
98.4 96.8 100.0 97.6 96.4 94.7 100.0 97.0 94.4 98.7
I like to try new foods. 87.4 90.3 93.4 88.2 94.6a§ 79a§ 91.2 86.0 79.6b§ 92.1b§
I like whole grains foods. 84.9 83.6 83.3 84.7 82.1 84.2 78.8 80.0 85.2 81.6
I like to eat homemade meals.
97.6 97.8 98.3 100.0 100.0 100.0 100.0 97.0 100.0 98.7
Health
There are people in my life who encourage me to eat healthy.
98.4c§ 94c§ 98.3 95.3 96.4 100.0 97.1 94.0 88.9 34.0
What I eat can help or hurt my health.
84.8 85.3 83.3 83.3 85.7 79.0 85.3 94.0 88.9 86.8
Students who eat break-fast do better in school.
87.3 87.9 85.3 90.6 92.9 79.0 91.2 89.9 87.0 88.2
It is important to be physically active most days of the week.
93.7d§ 97.8d§ 98.4 96.5 98.2 100.0 94.1 94.0 94.4 97.4
Environment
I know what plant or ani-mal my food comes from.
85.8 89.7 91.5 91.8 89.3 88.9 91.2 94.0 92.6 90.8
Fruits and vegetables taste better when they are in season.
93.7 91.1 93.4 97.6 98.2 100.0 97.1 98e* 90.6e*f* 100f*
Taking care of the environment is important to me.
93.7 95.7 96.7 98.8 96.2 88.9 94.1 97.0 92.6g* 100g*
What I eat can help or hurt the environment.
70.1h* 81.3h* 75.4 77.7 78.6 66.7 81.8 90i*j* 75.5i* 76j*
I try to recycle, compost, and pick up trash.
86.6k* 93.5k* 90.2 91.8 91.1 94.7 82.4 90.9 76.6 86.8
School
I enjoy eating the food served at school.
48.0 38.8 47.5 35.3 40.0 33.3 41.2 56.6l**m* 30.2l** 40.8m*
I look forward to going to school.
84.3 82.1 85.3 82.4 80.4 84.2 91.2 74n* 75.9o§ 89.5n*o§
I like the cafeteria at school.
59.8p§ 48.9p§ 59.0 45.9 44.2 55.6 50.0 69.0q**r** 40.7q** 46.0r**
1 “High” refers to schools with highly developed School Lunch Initiative components. Low refers to schools with lesser-developed School Lunch Initiative components.a-r Matching alphabetic superscripts indicate marginal and significant difference at §p<.10;*p<.05;**p<.01.
Table 9. Students’ Attitudes Toward Food, Health, Environment and School from Year One to Three (percent)

{ 6 6 }
Appendices
Student Food Preferences
At baseline
Students’ preferences for fruit, green leafy vegetables and other vegetables were consistently greater
among both fourth- and fifth-grade students attending elementary schools with highly developed
School Lunch Initiative components than similar-grade students attending schools with lesser-
developed School Lunch Initiative components (Table 10).
Table 10. Mean Student Food Preference Scores by Grade in Year One1,2,3
Fruit Green Leafy Vegetables
Other Vegetables
Total Fruits and Vegetables
4th Grade
5th Grade
4th Grade
5th Grade
4th Grade
5th Grade
4th Grade
5th Grade
Schools with lesser-developed components
2.13**** 2.21*** 1.1** 0.8**** 1.5* 1.58** 1.56*** 1.55****
Schools with highly developed components
2.59**** 2.53*** 1.46** 1.47**** 1.8* 1.91** 1.91*** 1.98****
1 Adjusted for race and education.2 Students were asked how much they liked certain fruits and vegetables; responses were scored on a scale of 0-3 (the higher the score, the greater the preference).3 Sample sizes in Year One differ from those used in examining changes in outcomes.Significant difference denoted by *p<.05; **p <.01; ***p <.001; ****p <.0001.

{ 6 7 }
Change from Year One to Year Two
From Year One to Year Two, fourth-grade students attending schools with highly developed School
Lunch Initiative components moving into fifth grade clearly showed an increased preference for
fruit and vegetables, and especially green leafy vegetables, while their counterparts in schools with
lesser-developed School Lunch Initiative components showed no increase in preference for fruit
and vegetables. This tendency for a change in (increased) preference for fruit and vegetables among
students attending schools with highly developed School Lunch Initiative components was also
observed among fifth-grade students moving into sixth grade; however, these increased preferences
were not statistically significant (Table 11).
Table 11. Change in Adjusted1 Mean Food Preference Scores2 from Year One to Year Two
N Fruits Green Leafy Vegetables
Other Vegetables
Total Fruits and Vegetables
4th to 5th grade Year 1Score
Change by
Year 2
Year 1Score
Change by
Year 2
Year 1Score
Change by
Year 2
Year 1Score
Change by
Year 2
Elementary schools with lesser-developed components
85 2.12 0.01a* 1.15b* -0.19c** 1.55 0.04 1.59d** -.04e**
Elementary schools with highly developed components
61 2.61 0.24a* 1.43b* 0.35c** 1.80 0.17 1.91d** 0.23e**
5th to 6th grade
Elementary schools with lesser-developed components to Middle School X or Y
54 2.20f* 0.17 0.69g** 0.40 1.46 0.13 1.45i** 0.22
Elementary schools with lesser-developed components to Middle School Z
18 2.17 0.10 0.63h** 0.32 1.57 0.14 1.51 0.17
Elementary schools with highly developed components to Middle School X
9 2.33 0.25 1.25 0.62 1.88 0.28 1.92 0.34
Elementary schools with highly developed components to Middle School Y or Z
28 2.58f* 0.08 1.37g,h** 0.24 1.82 0.03 1.91i** 0.07
1 Adjusted for race and education and relevant baseline preference score.2 Students were asked how much they liked certain fruits and vegetables; responses were scored on a scale of 0-3 (the higher the score, the greater the preference).a-i Matching alphabetic superscripts indicate marginal and significant differences denoted by §p<.10; *p<.05; **p<.01.
{ 6 8 }
Change from Year Two to Year Three
In Year Two and Year Three of the evaluation, fifth-grade students in elementary schools with highly
developed School Lunch Initiative components moving into sixth grade did not show a similar increase
in preference for fruit and vegetables as they did moving from fourth to fifth grade a year earlier. At the
same time, sixth-grade students moving into seventh grade showed little change in preference for fruits
or vegetables. Students attending the middle school with the most highly developed School Lunch
Initiative components showed an increase in preference for green leafy vegetables, but this increase was
not significantly different from the change in preference for green leafy vegetables observed among the
other middle school students (Table 12).

{ 6 9 }
Table 12. Change in Adjusted1 Mean Food Preference Scores2 from Year Two to Year Three
N Fruits Green Leafy Vegetables
Other Vegetables
Total Fruits and Vegetables
Year 2Score
Changeby
Year 3
Year 2Score
Changeby
Year 3
Year 2Score
Changeby
Year 3
Year 2Score
Changeby
Year 3
5th to 6th grade
Elementary schools with highly developed components to Middle School X
--3 -- -- -- -- -- -- -- --
Elementary schools with highly developed components to Middle School Y or Z
50 2.79*** 0.11 1.61*** 0.16 1.88 0.00 2.04*** 0.02
Elementary schools with lesser-developed components to Middle School X or Z
57 2.15*** 0.04 0.87*** 0.01 1.61 0.06 1.55*** 0.05
Elementary schools with lesser-developed components to Middle School Y
13 2.35 0.05 1.49 0.02 1.90 0.04 1.92 0.05
6th to 7th grade
Middle School X 49 2.53 0.03 1.32 0.39 1.76 -0.05 1.84 0.08
Middle School Y 17 2.50 -0.04 1.41 0.05 1.88 -0.13 1.90 -0.07
Middle School Z 32 2.37 0.15 1.26 0.01 1.78 0.17 1.80 0.13
1 Adjusted for race and education and relevant preference in Year 2.2 Students were asked how much they liked certain fruits and vegetables; responses were scored on a scale of 0-3 (the higher the score, the greater the preference).3 Unstable estimates for this group of students due to small sample size.Significant difference at ***p<.001.

{ 7 0 }
3. Students’ Eating Behaviors
Information was collected from students about their food-related activities and behaviors that could
influence the effects of the School Lunch Initiative. In Year One, proportionately more students
from the elementary schools with lesser-developed School Lunch Initiative components said they eat
family dinner nearly every day, bring lunch from home at least 3 to 4 times a week, eat fresh fruits
and vegetables at least 3 to 4 times a week, and eat fast food less than 3 or 4 times a week compared to
students from the elementary schools with highly developed School Lunch Initiative components. In
contrast, proportionately more students from the elementary schools with highly developed School
Lunch Initiative components brought home recipes from school at least a few times a year compared
to students from the elementary schools with lesser-developed School Lunch Initiative components
(Table 13).
Table 13. Student-Reported Food-Related Activities/Behaviors in Year One (percent)1
Eat fast
food less
than 3-4
times/wk
Eat fresh fruits and
vegeta-bles at least 3-4
times/wk
Eat lunch served
at school at least
3-4 times/
wk
Bring lunch from home
at least 3-4
times/wk
Eat family dinner nearly every day
Family prepares dinner from
scratch at least
3-4 times/
wk
Student helps
prepare dinner at least
3-4 times/
wk
Some-times have
family conver-sations about
healthy eating
Bring home
recipes from
school at least a few
times a year
Uses recipes
brought home from
school at least once a month
Schools with lesser-developed compo-nents
97.3* 89.0* 24.9 73.0*** 76.8* 75.1 33.5 59.3 27.6**** 20.3
Schools with highly developed compo-nents
91.4* 78.1* 29.9 53.1*** 64.1* 68.8 34.7 64.8 51.2**** 26.8
Total All Schools 94.9 84.5 26.9 64.9 71.6 72.5 34.0 61.5 37.2 23.1
1 Ns vary from 286-313 due to missing values.Significant difference denoted by *p<.05; ***p <.001; ****p <.0001.

{ 7 1 }
Table 13. Student-Reported Food-Related Activities/Behaviors in Year One (percent)1
Eat fast
food less
than 3-4
times/wk
Eat fresh fruits and
vegeta-bles at least 3-4
times/wk
Eat lunch served
at school at least
3-4 times/
wk
Bring lunch from home
at least 3-4
times/wk
Eat family dinner nearly every day
Family prepares dinner from
scratch at least
3-4 times/
wk
Student helps
prepare dinner at least
3-4 times/
wk
Some-times have
family conver-sations about
healthy eating
Bring home
recipes from
school at least a few
times a year
Uses recipes
brought home from
school at least once a month
Schools with lesser-developed compo-nents
97.3* 89.0* 24.9 73.0*** 76.8* 75.1 33.5 59.3 27.6**** 20.3
Schools with highly developed compo-nents
91.4* 78.1* 29.9 53.1*** 64.1* 68.8 34.7 64.8 51.2**** 26.8
Total All Schools 94.9 84.5 26.9 64.9 71.6 72.5 34.0 61.5 37.2 23.1
1 Ns vary from 286-313 due to missing values.Significant difference denoted by *p<.05; ***p <.001; ****p <.0001.
Trends in student-reported, food-related activities and behaviors following the fourth-grade students
in Year One (younger cohort) and fifth-grade students in Year One (older cohort) for all three years of
the evaluation are shown in Tables 14 and 15. There were no consistent, statistically significant trends
noted for either cohort group over all three years.

{ 7 2 }
Table 14. Trends in Student-Reported Family Dinner and Home Cooking Behaviors from Year One to Year Three (percent)
N1 Family prepares dinner from
scratch at least 3-4
times/wk
Student helps
prepare dinner at least 3-4
times/wk
Eat family dinner nearly every day
Bring home recipes
from school at
least a few times/yr
Uses recipes
brought home from
school at least once/
month
YOUNGER COHORT
Year 1
Schools with lesser- developed components
86-96 70.2 32.6 75.0a§ 31.3b** 24.4
Schools with highly developed components
68-72 63.9 40.3 62.5a§ 54.9b** 27.9
Year 2
Schools with lesser- developed components
84-85 74.1 32.9 76.5 29.4c**** 19.1d*
Schools with highly developed components
57-61 77.2 47.5 68.9 65.0c**** 38.3d*
Year 3
Middle School X 47-50 80.0 22.0e** 69.4 16.0f* 10.6
Middle School Y 32-33 78.1 31.3 72.7 25.0 15.2
Middle School Z 44 72.7 47.7e** 70.5 38.6f* 18.2
OLDER COHORT
Year 1
Schools with lesser- developed components 77-89 80.4 34.5 78.7 23.6g** 15.6
Schools with highly developed components 55-56 75.0 27.3 66.1 46.4g** 25.5
Year 2
Middle School X 56 83.9 30.4 80.4 32.1 30.4
Middle School Y 19 78.9 36.8 78.9 38.2 21.1
Middle School Z 32-34 73.5 26.5 70.6 31.6 15.6
Year 3
Middle School X 50-51 90.0 33.3 68.0 39.2h* 16.0
Middle School Y 20-21 71.4 23.8 80.0 9.5h* 9.5
Middle School Z 32 84.4 31.3 68.8 25.0 12.5
1 Ns vary due to missing values.a-h Matching alphabetic superscripts indicate marginal and significant differences denoted by §p<.10; *p<.05; **p<.01; ****p<.0001.

{ 7 3 }
Table 15. Trends in Student-Reported Eating Behaviors/Family Conversations About Healthy Eating Year One to Year Three (percent)
N1 Eat fast food less
than 3-4 times/
wk
Eat fresh fruits and vegetables at least 3-4 times/wk
Bring lunch from home at least 3-4 times/wk
Eat lunch served at school at least 3-4
times/wk
Sometimes have family
conversations about healthy
eating
YOUNGER COHORT
Year 1
Schools with lesser- developed components 95-96 94.7 82.3 68.8 32.3 58.3
Schools with highly developed components 72 90.3 77.8 55.6 36.1 58.3
Year 2
Schools with lesser- developed components 85 98.8 91.8a* 76.4b*** 17.7 74.1c§
Schools with highly developed components 58-61 96.6 79.3a* 47.5b*** 55.7 59.3c§
Year 3
Middle School X 49-50 91.8 82.0 38.8 51.0 49.0
Middle School Y 31-32 97.0 78.1 53.1 33.3 45.2
Middle School Z 44 97.7 84.1 54.6 29.5 63.6
OLDER COHORT
Year 1
Schools with lesser- developed components
86-89 100d* 96.5e** 77.5f*** 16.9 60.2
Schools with highly developed components
56 92.9d* 78.6e** 50.0f*** 23.2 73.2
Year 2
Middle School X 55-56 100g§ 94.6h§ 71.4i* 25.0 61.8
Middle School Y 34 100 82.4h§ 55.9 47.4 61.8
Middle School Z 18-19 89.5g§ 89.5 36.8i* 35.3 61.1
Year 3
Middle School X 50-51 100 92.2 52.0 27.5 68.6j,k**
Middle School Y 21 90.5 81.0 42.9 28.6 33.3j**
Middle School Z 32 100 84.4 46.9 37.5 34.4k**
1 Ns vary due to missing values.a-k Matching alphabetic superscripts indicate marginal and significant differences denoted by §p<.10; *p<.05; **p<.01; ***p<.001.

{ 7 4 }
At baseline
Consumption of fruits and vegetables recorded in the student food records was similar between
students attending schools with highly developed School Lunch Initiative components and students
attending schools with lesser-developed School Lunch Initiative components (Table 16).
Table 16. Student Consumption of Fruits and Vegetables by Grade (cups/day) in Year One
N1 Fruits Vegetables Fruits and Vegetables
4th Grade
5th Grade
4th Grade
5th Grade
4th Grade
5th Grade
4th Grade
5th Grade
Elementary schools with lesser-developed components
56 88 1.21 1.18 0.87 0.86 2.07 2.04
Elementary schools with highly developed components
70 96 1.19 1.23 0.78 0.93 1.98 2.17
1 Numbers shown are means adjusted for race and education.No significant differences found.

{ 7 5 }
Change from Year One to Year Two
From Year One to Year Two, increases in fruit and vegetable consumption were observed among
fourth-grade students attending the schools with highly developed School Lunch Initiative
components as they moved into fifth grade. In particular, after adjusting for differences in race and
parent’s education, fruit and vegetable consumption increased by nearly 0.7 cups (1.4 standard
servings) per day, with vegetables accounting for more of this change than fruit, among students
attending schools with highly developed School Lunch Initiative components. Among fifth-grade
students moving into sixth grade, fruit and vegetable consumption stayed the same or even decreased
in all schools (Table 17).
Table 17. Change in Mean Consumption of Fruits and Vegetables from Year One to Year Two1,2
N Fruit Vegetable Fruit and Vegetables
Year 1(cups)
Changeby
Year 2
Year 1(cups)
Changeby
Year 2
Year 1(cups)
Changeby
Year 2
4th to 5th grade
Elementary schools with lesser- developed components 85 1.26 -0.20a* 0.89 -0.01b** 2.16 -0.21c**
Elementary schools with highly developed components 61 1.21 0.25a* 0.76 0.44b** 1.98 0.69c**
5th to 6th grade
Elementary schools with lesser- developed components to Middle School X or Y
54 1.32 -0.03 0.80 0.03 2.12 -0.01
Elementary schools with lesser- developed components to Middle School Z
18 1.06 -0.24 0.87 0.16 1.93 -0.09
Elementary schools with highly developed components to Middle School X
9 1.56 -0.10 0.89 0.00 2.46 -0.09
Elementary schools with highly developed components to Middle School Y or Z
28 1.14 -0.41 0.90 0.18 2.04 -0.23
1 Adjusted for race and education and relevant baseline consumption; multiple comparisons were assessed using Bonferroni’s procedure.2 Standard cups/day (1 standard cup = 2 standard servings).a-c Matching alphabetic superscripts indicate significant differences denoted by *p<.05; **p<.01.

{ 7 6 }
Change from Year Two to Year Three
From Year Two to Year Three of the study, mean consumption of fruits and vegetables stayed the same or
decreased for fifth-grade students moving to sixth grade. For sixth-grade students moving into seventh
grade, a decrease in fruit and vegetable consumption was observed only among students attending School
Y, where School Lunch Initiative cooking and garden components were only offered as an elective in Year
Three; this decrease was significantly different from the increase observed at Middle School Z, where
students did attend cooking and gardening classes. At Middle School X and Middle School Z, mean
increases in fruit and vegetable consumption were 0.11 cups and 0.27 cups, respectively (Table 18).
Table 18. Change in Mean Consumption of Fruits and Vegetables from Year Two to Year Three1,2
Year 2(cups)
Changeby
Year 3
Year 2(cups)
Changeby
Year 3
Year 2(cups)
Changeby
Year 3
5th to 6th grade
Elementary schools with lesser-developed components to Middle School X or Z
57 0.86a** -0.19 0.69b**c* 0.12 1.56 0.01
Elementary schools with lesser-developed components to Middle School Y
13 1.08 -0.47 1.38c* -0.03 2.46 -0.56
Elementary schools with highly developed components to Middle School X
--3 -- -- -- -- -- --
Elementary schools with highly developed components to Middle School Y or Z
50 1.51a** 0.12 1.13b** -0.07 2.64 0.02
6th to 7th grade
Middle School X 49 1.40 -0.09 0.92 0.17 2.32 0.11
Middle School Y 17 0.89 -0.40 1.04 -0.10 1.94 -0.54d§
Middle School Z 32 1.03 -0.09 1.18 0.39 2.20 0.27d§
1 Adjusted for race and education and relevant Year Two consumption; multiple comparisons were assessed using Bonferroni’s procedure.2 Standard cups/day (1 standard cup = 2 standard servings).3 Unstable estimates for this group of students due to small sample size.a-d Matching alphabetic superscripts indicate marginal and significant differences denoted by §p<.10; *p<.05; **p<.01.

{ 7 7 }
Trends in seasonal fruit and vegetable consumption
Fourth-grade students from highly developed School Lunch Initiative schools increased their
consumption of fruits and vegetables by 0.69 cups per day when they moved to the fifth grade (see
Table 17); about 80% of this increase was attributable to consumption of in-season produce, which
increased by 0.57 cups per day (Table 19). However, positive trends in in-season fruit and vegetable
consumption were not as clear as fifth-grade students moved into the sixth grade from Year One to
Year Two or from Year Two to Year Three (Table 19 and 20). In Year Three, a small increase in seasonal
fruit and vegetable consumption was observed among sixth-grade students attending Schools X and Z
(but not School Y) as they moved into the seventh grade.
Table 19. Mean Consumption of Seasonal Fruits and Vegetables from Year One to Year Two1,2
N Seasonal Fruit Seasonal Vegetable Seasonal Fruit and Vegetable
Year 1(cups)
Change byYear 2
Year 1(cups)
Change byYear 2
Year 1(cups)
Change byYear 2
4th to 5th grade
Elementary schools with lesser-developed components
85 0.15 0.02* 0.33 0.11 0.48 0.13
Elementary schools with highly developed components
56 0.11 0.34* 0.27 0.23 0.38 0.57
5th to 6th grade
Elementary schools with highly developed components to Middle School X or Y
48 0.10 -0.02 0.26 0.12 0.36 0.1
Elementary schools with lesser-developed components to Middle School Z
18 0.12 0.12 0.31 0.01 0.43 0.13
Elementary schools with highly developed components to Middle School X
9 0.36 0.00 0.40 0.31 0.76 0.31
Elementary schools with highly developed components to Middle School Y or Z
27 0.10 -0.02 0.34 0.03 0.44 0.01
1 Adjusted for race and education and relevant baseline consumption; multiple comparisons were assessed using Bonferroni’s procedure.2 Standard cups/day (1 standard cup = 2 standard servings).Significant difference at *p<.05.
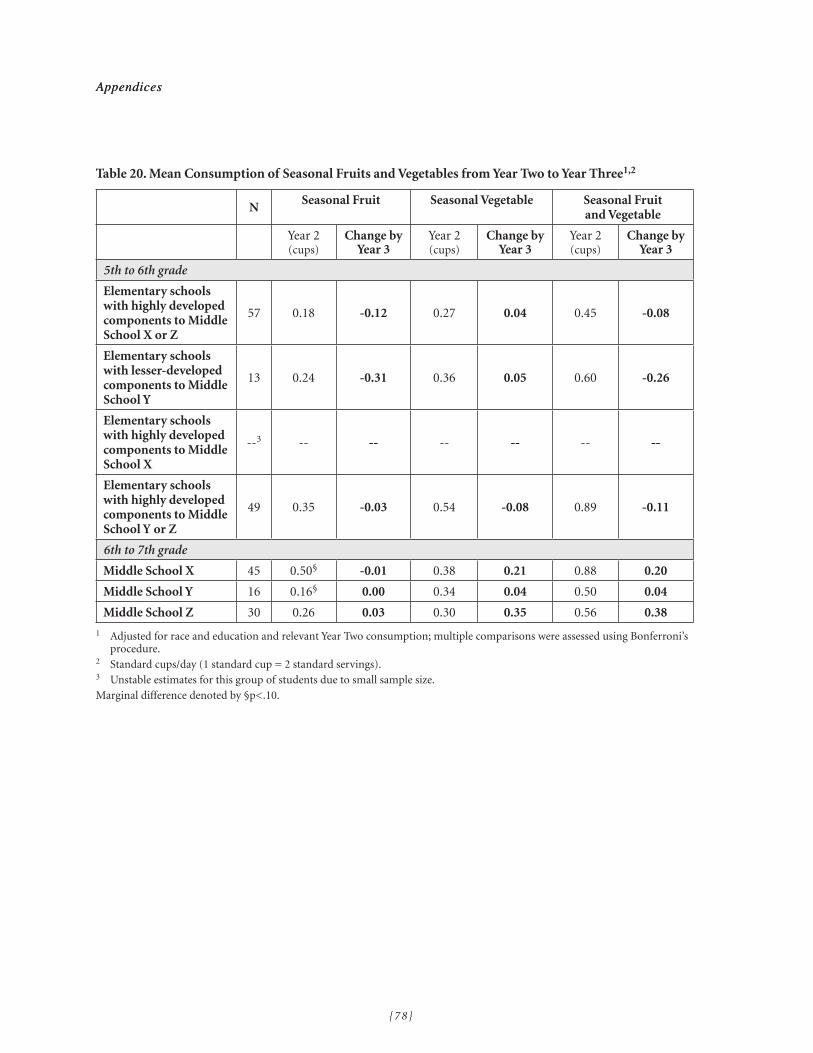
{ 7 8 }
Table 20. Mean Consumption of Seasonal Fruits and Vegetables from Year Two to Year Three1,2
N Seasonal Fruit Seasonal Vegetable Seasonal Fruit and Vegetable
Year 2(cups)
Change byYear 3
Year 2(cups)
Change byYear 3
Year 2(cups)
Change byYear 3
5th to 6th grade
Elementary schools with highly developed components to Middle School X or Z
57 0.18 -0.12 0.27 0.04 0.45 -0.08
Elementary schools with lesser-developed components to Middle School Y
13 0.24 -0.31 0.36 0.05 0.60 -0.26
Elementary schools with highly developed components to Middle School X
--3 -- -- -- -- -- --
Elementary schools with highly developed components to Middle School Y or Z
49 0.35 -0.03 0.54 -0.08 0.89 -0.11
6th to 7th grade
Middle School X 45 0.50§ -0.01 0.38 0.21 0.88 0.20
Middle School Y 16 0.16§ 0.00 0.34 0.04 0.50 0.04
Middle School Z 30 0.26 0.03 0.30 0.35 0.56 0.38
1 Adjusted for race and education and relevant Year Two consumption; multiple comparisons were assessed using Bonferroni’s procedure.2 Standard cups/day (1 standard cup = 2 standard servings).3 Unstable estimates for this group of students due to small sample size.Marginal difference denoted by §p<.10.

{ 7 9 }
Trends in in-school and out-of-school consumption
The increased consumption of vegetables among fourth-grade students from Year One to Year Two was
due mostly to in-school consumption of vegetables. There was an increase of 0.28 cups compared to
a decrease of 0.08 cups in schools with lesser-developed School Lunch Initiative components (p<.01)
(Table 21). Out-of-school consumption of vegetables and fruit was greater among students attending
schools with highly developed School Lunch Initiative components, but the difference was statistically
significant only for fruit (an increase of 0.14 cups of fruit compared to a decrease of 0.15 cups among
students in schools with lesser-developed School Lunch Initiative components) (Table 21).
The trends were less clear from Year Two to Year Three when fifth-grade students went to the sixth
grade and sixth-grade students went into the seventh grade. The amount of in-school and out-of-
school fruit and vegetable consumption dropped or stayed about the same (Table 22).

Table 21. Change in Mean Consumption of Fruits and Vegetables Eaten In-School and Out-of-School from Year One to Year Two1,2
Year 1(cups)
ChangeBy
Year 2
Year 1(cups)
ChangeBy
Year 2
Year 1(cups)
ChangeBy
Year 2
Year 1(cups)
ChangeBy
Year 2
4th to 5th grade
Elementary schools with lesser-developed components
85 0.61 -0.05§ 0.66 -0.15* 0.28 -0.08** 0.61 0.07
Elementary schools with highly developed components
56 0.55 0.12§ 0.66 0.14* 0.21 0.28** 0.55 0.15
5th to 6th grade
Elementary schools with lesser-developed components to Middle School X or Y
48 0.50 -0.10 0.82 0.06 0.23 0.00 0.58 0.01
Elementary schools with lesser-developed components to Middle School Z
18 0.61 -0.28 0.45 0.06 0.30 0.04 0.57 0.08
Elementary schools with highly developed components to Middle School X
9 0.82 -0.12 0.75 0.02 0.40 0.03 0.50 -0.08
Elementary schools with highly developed components to Middle School Y or Z
27 0.74 -0.34 0.40 -0.06 0.22 0.16 0.68 0.03
1 Adjusted for race and education and relevant baseline consumption; multiple comparisons were assessed using Bonferroni’s procedure.2 Standard cups/day (1 standard cup = 2 standard servings) Year Two to Year Three.1, 2
3 Ns may be different from those in earlier tables showing mean consumption of fruits and vegetables due to missing information needed for distinguishing in-school from out-of-school consumption.Marginal and significant differences denoted by §p<.10; *p<.05; **p<.01.
{ 8 0 }

{ 8 1 }
Table 22. Mean Consumption of Fruits and Vegetables Eaten In-school and Out-of-school from Year Two to Year Three1,2
N3 In-School Fruit
Out-of- SchoolFruit
In-SchoolVegetable
Out-of-SchoolVegetable
Year 2(cups)
Changeby
Year 3
Year 2(cups)
Changeby
Year 3
Year 2(cups)
Changeby
Year 3
Year 2(cups)
Changeby
Year 3
5th to 6th grade
Elementary schools with lesser-developed components to Middle School X or Z
57 0.48 -0.22 0.38 0.00 0.18 -0.04 0.51 0.15
Elementary schools with lesser-developed components to Middle School Y
13 0.55 -0.31 0.48 -0.19 0.1 -0.12 0.69 0.11
Elementary schools with highly developed components to Middle School X
--4 -- -- -- -- -- -- -- --
Elementary schools with highly developed components to Middle School Y or Z
49 0.71 0.08 0.80 0.07 0.45 -0.09 0.68 0.03
6th to 7th grade
Middle School X 45 0.61 -0.05 0.73 -0.05 0.37 0.02 0.57 0.16
Middle School Y 16 0.37 -0.08 0.50 -0.30 0.40 -0.18* 0.73 0.06
Middle School Z 30 0.52 -0.06 0.79 -0.05 0.25 0.20* 0.68 0.19
1 Adjusted for race and education and relevant Year Two consumption; multiple comparisons were assessed using Bonferroni’s procedure.2 Standard cups/day (1 standard cup = 2 standard servings).3 Ns may be different from those in earlier tables showing mean consumption of fruits and vegetables due to missing information needed for distinguishing in-school from out-of-school consumption.4 Unstable estimates for this group of students due to small sample size.Significant difference denoted by *p<.05.

{ 8 2 }
Student Consumption of Sweetened Beverages
At baseline
Consumption of sweetened beverages tended to be greater among students attending the schools with
highly developed School Lunch Initiative components (Table 23).
Table 23. Student Consumption of Sweetened Beverages (fluid ounces/day) by Grade in Year One
4th Grade* 5th Grade
Schools with lesser-developed components 2.82 2.32
Schools with highly developed components 4.89 3.01
Significant difference denoted by *p<.05.
Change from Year One to Year Two
Fourth-grade students attending the schools with highly developed School Lunch Initiative
components decreased their mean consumption of sweetened beverages slightly. Interestingly, although
sweetened beverage consumption increased for most students, it decreased among students who had
attended an elementary school with highly developed School Lunch Initiative components and moved
to the middle school with highly developed School Lunch Initiative components (Middle School
X). However, this decrease was not significantly different from the increases in sweetened beverage
consumption observed among other students (Table 24).
Table 24. Mean Consumption of Sweetened Beverages (fluid ounces/day) from Year One to Year Two1
NSweetened Beverages
Year 1(fluid ounces)
Change by Year 2
4th to 5th grade
Elementary schools with lesser-developed components 85 2.91 1.10
Elementary schools with highly developed components 61 4.67 -0.51
5th to 6th grade
Elementary schools with lesser-developed components to Middle School X or Y 54 2.44 1.95
Elementary schools with lesser-developed components to Middle School Z 18 2.86 3.09
Elementary schools with highly developed components to Middle School X 9 1.65 -3.66
Elementary schools with highly developed components to Middle School Y or Z 28 4.61 2.77
1 Adjusted for race and education and relevant baseline consumption; multiple comparisons were assessed using Bonferroni’s procedure.

{ 8 3 }
Change from Year Two to Year Three
Changes in sweetened beverage consumption were not significantly associated with the School Lunch
Initiative development due in part to the wide variation in consumption (Table 25).
Table 25. Mean Consumption of Sweetened Beverages (fluid ounces/day) from Year Two to Year Three1
NSweetened Beverages
Year 2(fluid ounces)
Change by Year 3
5th to 6th grade
Elementary schools with lesser-developed components to Middle School X or Z 57 3.93 1.35
Elementary schools with lesser-developed components to Middle School Y 13 4.18 1.61
Elementary schools with highly developed components to Middle School X --2 -- --
Elementary schools with highly developed components to Middle School Y or Z 50 3.37 3.17
6th to 7th grade
Middle School X 49 4.00 0.34
Middle School Y 17 5.42 -0.49
Middle School Z 32 7.39 -0.13
1 Adjusted for race and education and relevant Year Two consumption; multiple comparisons were assessed using Bonferroni’s procedure.2 Unstable estimates for this group of students due to small sample size.No significant difference found.

{ 8 4 }
4. Seventh-Grade Survey: Knowledge, Attitudes and Preferences About Food and the Environment
In the 2008-09 school year, the third year of the evaluation, a survey of seventh graders was conducted
asking questions similar to those asked annually in the three-year longitudinal study. Findings from
this survey mostly confirmed the findings from the longitudinal analysis or revealed associations
between School Lunch Initiative exposure and food-related activities and behaviors that were not
observed with the longitudinal cohort.
Seventh-Grade Student Knowledge
Mean knowledge scores about food and the environment (adjusted for race, gender, and participation
in the longitudinal cohort) were higher among students attending the middle school with highly
developed School Lunch Initiative components (Middle School X) (Table 26).
Table 26. Nutrition and Food and Environment Knowledge Scores Among All Seventh Graders in Year Three1,2
Nutrition Food & Environment Total
7.26 7.12a* 14.38b*
7.08 6.89 13.97
6.89 6.42a* 13.31b*
1 Maximum scores possible = 26: nutrition knowledge = 14; food and environment = 12.2 Adjusted for gender, race and whether participating in the School Lunch Initiative evaluation study.3 The School Lunch Initiative was most highly developed at School X.a,b Matching alphabetic superscripts indicate significant differences denoted by *p<.05.

{ 8 5 }
Seventh-Grade Student Attitudes
Attitudes toward food and health did not differ among students attending the three middle schools.
Attitudes toward the environment-related statements were more positive at Middle School X, the
middle school with the most highly developed School Lunch Initiative components, compared to
Middle School Y, where cooking and gardening activities were offered as an elective course for seventh
graders in Year Three. Attitudes toward school were also more positive among students attending the
Middle School X compared to those attending the other two middle schools (Table 27).
Table 27. Attitudes Toward Food, Health, the Environment and School Among All Seventh Graders in Year Three1,2
Food Health Environment School
School X3 2.41 2.55 2.42a* 1.79b,c**
School Y 2.41 2.45 2.24a* 1.35b**
School Z 2.43 2.54 2.35 1.42c**
1 Students were asked if they agreed with relevant statements and were given 4 responses on a Likert scale which were scored on a 0-3 scale (the greater the score, the more positive the attitude).2 Adjusted for gender, race and whether participating in the School Lunch Initiative evaluation study.3 The School Lunch Initiative was most highly developed at School X.a-c Matching alphabetic superscripts indicate significant difference at *p<.05;**p<.01.

{ 8 6 }
Seventh-Grade Student Food Preferences
Student food preferences among all seventh-grade students are consistent with those in the
longitudinal cohort. In particular, higher exposure to School Lunch Initiative components is associated
with greater preference for green leafy vegetables (Table 28).
Table 28. Food Preferences Among All Seventh Graders in Year Three1,2
Fruits Green Leafy Vegetables
Other Vegetables All Fruits & Vegetables
School X3 2.47 1.74a,b** 1.79 1.95
School Y 2.57 1.36a** 1.82 1.89
School Z 2.41 1.30b** 1.84 1.85
1 Adjusted for gender, race and whether participating in the School Lunch Initiative evaluation study. 2 Students were asked how much they liked certain fruits and vegetables; responses were scored on a scale of 0-3 (the higher the score, the greater the preference).3 The School Lunch Initiative was most highly developed at School X.a,b Matching alphabetic superscripts indicate significant differences denoted by **p<.01.

{ 8 7 }
Eat fast food less
than 3-4
times/wk****
Eat fresh fruits and
vegeta-bles at
least 3-4 times/wk**
Bring lunch from home
at least 3-4
times/wk*
Eat school lunch
at least 3-4
times/week
Eat family dinner nearly every
day***
Family prepares dinner from
scratch at least
3-4 times/
wk*
Student helps
prepare dinner at least
3-4 times/
wk
Sometimes have fam-
ily con-versations
about healthy eating*
Uses recipes
brought home from
school at least a few
times/yr*
Bring home
recipes from
school at least a few
times/yr**
School X1
96.3 85.5 48.7 36.3 73.0 85.5 33.0 52.9 33.7 35.5
School Y90.2 75.9 33.2 29.6 64.6 77.0 33.9 31.9 30.4 30.4
School Z96.4 76.4 34.5 28.2 58.2 77.3 29.9 39.0 17.3 17.3
1 The School Lunch Initiative was most highly developed at School X.Significant difference denoted by *p<.05; **p<.01; ***p<.001; ****p<.0001.
Seventh-Grade Student Food-Related Activities and Behaviors
Students at the middle school with highly developed School Lunch Initiative components (Middle
School X) were more likely to report engaging in positive food-related behaviors than students at the
other middle schools (Table 29). For example, a higher percentage of students at Middle School X
reported eating fresh fruits and vegetables at least 3 or 4 times a week, eating family dinner nearly every
day, preparing dinner from ”scratch,” and having family conversations about healthy eating.
Table 29. Student-Reported Food-Related Activities/Behaviors Among All Seventh Graders in Year Three (N=413) (percent)

{ 8 8 }
5. Perception of the School Lunch Program
When asked about how school lunch had changed, students who took part in the three-year study
thought that school lunches were tastier over the three years. At the same time, the percentage of
students who found school lunches to be not as tasty decreased (Table 30). More elementary school
students attending schools with highly developed School Lunch Initiative components thought
the school lunches were tastier in Year Two compared to the year before (Table 31). More students
attending Middle School X, the middle school with the most highly developed School Lunch Initiative
components, thought school lunch was tastier in Year Three compared to the year before (Table 32).
This was also the year that Middle School X opened a new dining facility on campus.
Table 30. Student Perception of School Lunch from Year One, Year Two and Year Three (percent)1
Tastier Not as Tasty Healthier Not as Healthy
Year 1 (N= 313) 7.7a*, b** 18.5d** 30.7 3.5
Year 2 (N=255) 16.1a*, c** 15.3e** 30.2 3.9
Year 3 (N=231) 27.3b**, c** 9.1d**, e** 31.2 1.3
1 The differences between years were assessed using the Chi square test and Fisher’s exact test based on the frequencies/counts.a-e Matching alphabetic superscripts indicate significant difference at *p<.05; **p<.01.
Table 31. Student Perception of School Lunch from Year One to Year Two (percent)1
Tastier Not as Tasty Healthier Not as Healthy
Elementary schools with lesser-developed components
Year 1 (N=185) 8.1 13.5 31.9 4.3
Year 2 (N=85) 11.8 16.5 30.6 2.4
Elementary schools with highly developed components
Year 1 (N=128) 7.0a** 25.8 28.9 2.3
Year 2 (N=61) 22.9a** 23.0 42.6 4.9
1 The differences between years were assessed using the Chi square test or Fisher’s exact test based on the frequencies/counts. a Matching alphabetic superscripts indicate significant difference at **p<.01.

{ 8 9 }
Table 32. Student Perception of School Lunch from Year Two to Year Three (percent)1
Tastier Not as Tasty Healthier Not as Healthy
Middle School X
Year 2 (N=56) 9.3a** 5.6 33.3 5.6b*
Year 3 (N=101) 30.7a** 6.9 45.5 0.0b*
Middle School Y
10.5 5.3 0.0 10.5
29.6 9.3 20.4 0.0
Middle School Z
26.5 20.6 17.7 0.0
21.1 11.8 19.7 4.0
1 The differences between years were assessed using the Chi square test or Fisher’s exact test based on the frequencies/counts.a -b Matching alphabetic superscripts indicate significant difference at *p<05; **p<.01.
Seventh-Grade Student Perception of School Lunch
Responses from seventh graders who participated in the cross-sectional survey also confirmed that
proportionately more students attending Middle School X, the middle school with the most highly
developed School Lunch Initiative components, thought school lunch was tastier and healthier (Table
33). This was also the year that Middle School X opened its new dining facility on campus.
Table 33. Student Perception of School Lunch by All Seventh Graders in Year Three (N=413) (percent)
Tastier Not as Tasty Healthier Not as Healthy
School X1 31.6a***b* 8.4cd§ 35.8e****f** 2.1
School Y 13.3a*** 15 c§ 8.9e****g* 4.4
School Z 19.1b* 15.5d§ 18.2f**g* 3.6
1 School X had the most highly developed School Lunch Initiative components compared to the other middle schools in Year Three. a-g Matching alphabetic superscripts indicate significant differences denoted by §p<.10; *p<.05; **p<.01; ***p<.001; ****p<.0001.

{ 9 0 }
6. Student Academic Performance
There were no consistent trends in School Lunch Initiative exposure and student academic
performance, suggesting that other powerful influences are affecting test score results. Table 34
shows that mean academic performance scores (English Language Arts and Mathematics) were
generally higher among students attending the schools with lesser-developed School Lunch Initiative
components, which had lower proportions of children from low-income families. This trend held
even after adjusting for parents’ education and race/ethnicity.

{ 9 1 }
Table 34. Mean Academic Performance Test Scores1,2
N English Language Arts (ELA)
Mathematics
Yr 1
Yr 2
Yr 3
Yr 1 Yr 2 Yr 3 Yr 1 Yr 2 Yr 3
YOUNGER COHORT3 4th grade
5th grade
6th grade
4th grade
5th grade
6th grade
Elementary Schools with Lesser-Developed Components
Elementary School A 41 41 -- 383a 391b -- 426r,s 445t --
Elementary School B 23 20 -- 372 369 -- 365r 444u --
Elementary Schools with Highly Developed Components
Elementary School C 28 28 -- 348a 339b -- 357s 354t,u --
Elementary School D 17 17 -- 381 371 -- 385 387 --
Middle Schools
Middle School X5 -- -- 42 -- -- 381c -- -- 400v
Middle School Y -- -- 36 -- -- 349c -- -- 362v
Middle School Z -- -- 30 -- -- 368 -- -- 376
OLDER COHORT4 5th grade
6th grade
7th grade
5th grade
6th grade
7th grade
Elementary Schools with Lesser-Developed Components
Elementary School A 35 -- -- 352 -- -- 394w -- --
Elementary School B 26 -- -- 389d -- -- 408x -- --
Elementary Schools with Highly Developed Components
Elementary School C 17 -- -- 333d -- -- 312w,x -- --
Elementary School D 8 -- -- 392 -- -- 397 -- --
Middle Schools
Middle School X5 -- 45 45 -- 360 356 -- 373 359
Middle School Y -- 27 25 -- 353 373 -- 357 383
Middle School Z -- 14 14 -- 367 380 -- 367 380
1 Adjusted for education and race.2 Test scores are California Standards Tests administered annually through the Standardized Testing and Reporting (STAR) program in California. The English Language Arts and Mathematics tests have a scaled score range from 150 to 600. The goal is for the scaled mean to be 350 or above (proficient or above).3 Fourth grade in Year 1, fifth grade (Year 2), sixth grade (Year 3).4 Fifth grade in Year 1, sixth grade (Year 2), seventh grade (Year 3).5 Middle school with highly developed School Lunch Initiative components.a-d, r-x Matching alphabetic superscripts indicate significant difference at p<.05.

{ 9 2 }
7. Student Weight Status
Height and weight measures from the school district’s Fitnessgram assessments taken in the fifth and
seventh grades were examined. Data collected during Year One of the study were questionable and
were not included in the analysis. Height and weight measures in Year Two and Year Three were used
to calculate Body Mass Index to assess weight status and rates of overweight and obesity, as shown in
Table 35. Caution must be used in interpreting these results due to potential measurement errors and
the lack of information on pubertal stage development, which naturally affects the rate of weight gain
among adolescents.

{ 9 3 }
Table 35. Overweight and Obesity Rates1 by Sex, Grade and School in Year Two and Year Three2
Year 2 (N=141) Year 3 (N=100)
Percentoverweight
Percentobese
Percentoverweightand obese
Percentoverweight
Percentobese
Percentoverweightand obese
BOYS
5th grade boys
Schools with highly developed components
26.67 16.67 43.34
Schools with lesser- developed components
16.13 16.13 32.26
7th grade boys
School X 11.11 22.22 33.33
School Y 14.29 28.57 42.86
School Z 11.11 22.22 33.33
GIRLS
5th grade girls
Schools with highly developed components
17.24 17.24 34.38
Schools with lesser-developed components
15.22 10.87 26.09
7th grade girls
School X 7.14 7.14 14.28
School Y 14.29 7.14 21.43
School Z 9.52 9.52 19.04
TOTAL
5th grade boys and girls
Schools with highly developed components
22.03 16.95 38.98
Schools with lesser- developed components
15.58 12.99 28.57
7th grade boys and girls
School X 8.70 13.04 21.74
School Y 14.29 14.29 28.58
School Z 10.00 13.33 23.33
1 Overweight and obesity are defined as a Body Mass Index [weight(kg/height(cm)2] at or above the 85th percentile and lower than the 95th percentile and a Body Mass Index at or above the 95th percentile for children of the same age and sex using CDC growth charts, respectively. http://www.cdc.gov/obesity/childhood/defining.html2 Data from Year One was not used in the analysis due to probable measurement errors. No significant difference found.

{ 9 4 }
R E F E R E N C E S
1. Gunderson, G. The National School Lunch Program: Background and Development. http://www.fns.usda.gov/cnd/lunch/AboutLunch/ProgramHistory_5.htm. Accessed February 26, 2010.
2. Centers for Disease Control and Prevention. Health, United States, 2008. http://www.cdc.gov/nchs/data/hus/hus08.pdf#070. Accessed February 26, 2010.
3. Story M, Nanney MS, Schwartz MB. Schools and Obesity Prevention: Creating School Environments and Policies to Promote Healthy Eating and Physical Activity. Milbank Q 2009; 87:71-100.
4. Foster GD, Sherman S, Borradaile KE, et al. A Policy-Based School Intervention to Prevent Overweight and Obesity. Pediatrics 2008; 121:e794-802.
5. Kropski JA, Keckley PH, Jensen GL. School-Based Obesity Prevention Programs: An Evidence-Based Review. Obesity 2008; 16:1009-1018.
6. Caballero B, Clay T, Davis SM, et al. Pathways: A School-Based, Randomized Controlled Trial for the Prevention of Obesity in American Indian Schoolchildren. Am J Clin Nutr 2003; 78:1030-1038.
7. Gortmaker SL, Peterson K, Wiecha J, et al. Reducing Obesity via a School-Based Interdisciplinary Intervention Among Youth. Arch Pediatr Adolesc Med 1999; 153:409-418.
8. Luepker RV, Perry CL, McKinlay SM, et al. Outcomes of a Field Trial to Improve Children’s Dietary Patterns and Physical Activity. J Am Diet Assoc 1996; 275:768-776.
9. Reniscow K. School-Based Obesity Prevention: Population versus High-Risk Intervention. Ann NY Acad Sci 1993; 699:154-166.
10. Briefel RR, Crepinsek MK, Cabili C, Wilson A, Gleason PM. School Food Environments and Practices Affect Dietary Behaviors of US Public School Children. Supp J Am Diet Assoc 2009; 109:2; S91-S107.
11. Center for Weight and Health. Linking Education, Activity and Food (LEAF) Accomplishments, Impacts and Lessons Learned, Executive Summary and Report. 2005. http://cwh.berkeley.edu/resource/reports-linking-education-activity-and-food-leaf.
12. Rampersaud GC. Benefits of Breakfast for Children and Adolescents: Update and Recommendations for Practitioners. Am J Lifestyle Med 2009; 3:86-103.
13. Newby PK. Plant Foods and Plant-Based Diets: Protective Against Childhood Obesity? Am J Clin Nutr 2009; 89:1572S-1578S.
14. Woodward-Lopez G, Ritchie LD, Gerstein DE, Crawford PB. Obesity: Dietary and Developmental Influences. Boca Raton, FL: CRC Press, 2006.
15. US Department of Agriculture. MyPyramid, http://www.mypyramid.gov. Accessed June 1, 2009.
16. Kimmons, J, Gillespie C, Seymour J, Serdula M, Blanck H. Fruit and Vegetable Intake Among Adolescents and Adults in the United States: Percentage Meeting Individualized Recommendations. Medscape J Med. 2009; 11(1):26. http://www.ncbi.nlm.nih.gov/pmc/articles/PMC2654704/. Accessed February 26, 2010.
17. Lytle LA, Seifert S, Greenstein J, et al. How Do Children’s Eating Patterns and Food Choices Change over Time? Results from a Cohort Study. Am J Health Prom 2000; 14:222–228.
18. Lien N, Lytle LA, Klepp KI. Stability in Consumption of Fruit, Vegetables, and Sugary Foods in a Cohort from Age 14 to Age 21. Prev Med 2001; 33:217-226.
19. Morris JL, Zidenberg-Cherr S. Garden-Enhanced Nutrition Curriculum Improves Fourth-Grade School Children’s Knowledge of Nutrition and Preferences for Some Vegetables. J Am Diet Assoc 2002; 102:91-93.
{ 9 5 }
20. Koch S, Waliczek W, Zajicek J. The Effect of a Summer Garden Program on the Nutritional Knowledge, Attitudes, and Behaviors of Children. Hort Technology 2006; 16:620-624.
21. Heim S, Stang J, Ireland M. A Garden Pilot Project Enhances Fruit and Vegetable Consumption Among Children. J Am Diet Assoc 2009; 109:1220-1226.
22. McAleese JD, Rankin LL. Garden-Based Nutrition Education Affects Fruit and Vegetable Consumption in Sixth-Grade Adolescents. J Am Diet Assoc 2007; 107:662-665.
23. Robinson-O’Brien R, Story M, Heim S. Impact of Garden-Based Youth Nutrition Intervention Programs: A Review. J Am Diet Assoc 2009; 109:273-280.
24. Davis EM, Cullen KW, Watson KB, et al. A Fresh Fruit and Vegetable Program Improves High School Students’ Consumption of Fresh Produce. J Am Diet Assoc 2009; 109:1227-1231.
25. Perry CL, Bishop DB, Taylor GL, et al. A Randomized School Trial of Environmental Strategies to Encourage Fruit and Vegetable Consumption Among Children. Health Educ Behav 2004; 31:65-76.
26. Hoffman JA, Franko DL, Thompson DR, et al. Longitudinal Behavioral Effects of a School-Based Fruit and Vegetable Promotion Program. J Pediatr Psychol 2009; 5:1-11.
27. Moore R. A WEY to Design. JAE 31:4:27-30.
28. Chez Panisse Foundation. Lunch Matters: How to Feed Our Children Better. The Story of the Berkeley School Lunch Initiative. 2008.
29. California Dept. of Public Health. About the Network for a Healthy California. http://www.cdph.ca.gov/programs/cpns/Pages/AboutUs.aspx. Accessed February 26, 2010.
30. Bay Area Census, City of Berkeley. http://www.bayareacensus.ca.gov/cities/Berkeley.htm. Accessed February 1, 2010.
31. Berkeley Unified School District. BUSD Student Assignment Plan/Policy. http://www.berkeley.net/index .php?page=student-assignment-plan. Accessed February 4, 2010.
32. Birch LL, Fisher JO. Development of Eating Behaviors Among Children and Adolescents. Pediatrics. 1998; 101:539-549.
33. Rockett HR. Family Dinner: More Than Just a Meal. J Am Diet Assoc 2007; 107:1498-1501.
34. Weir LA, Etelson D, Brand DA. Parents’ Perceptions of Neighborhood Safety and Children’s Physical Activity. Prev Med 2006; 43(3):212-217.
35. MacLeod K., Gee G, Crawford P, Wang MC. Neighborhood Environment as a Predictor of Television Watching in Black and White Girls. J Epidem and Comm Health 2008; 62:288-292.
36. Beck ME. Dinner Preparation in the Modern United States. British Food Journal. 2007; 109:7:531-547.
37. Blair D. The Child in the Garden: An Evaluative Review of the Benefits of School Gardening. J Envir Ed 2009; 40:2:15-38.
38. California Department of Education Standards and Assessment Division, Educational Testing Service (ETS), California Standards Tests (CSTs) Technical Report Spring 2007 Administration. February 2008.
