chantal travers head of investor relations · sydney airport corporation limited, central terrace...
TRANSCRIPT
Sydney Airport Corporation Limited, Central Terrace Building, 10 Arrivals Court, Locked Bag 5000, Sydney International Airport, NSW 2020 Australia ABN 62 082 578 809 T 1800 181 895 www.sydneyairport.com.au
17 October 2016
Sydney Airport Investor Day presentation Please find attached a presentation that will be provided at the Sydney Airport Investor Day today (also available on the Sydney Airport website at www.sydneyairport.com.au).
In addition, a webcast of the presentation will be available at the above link tomorrow.
Chantal Travers Head of Investor Relations
Laura Stevens Manager – Media and Communications
t +612 9667 9271 t +612 9667 6470 m +61 428 822 375 m +61 437 033 479 e [email protected]
Sydney Airport Limited (ACN 165 056 360) and The Trust Company (Sydney Airport) Limited (ACN 115 967 087) (AFSL 301162) as responsible entity for Sydney Airport Trust 1 (ARSN 099 597 921) (together SYD) Central Terrace Building, 10 Arrivals Court, Locked Bag 5000, Sydney International Airport, NSW 2020 Australia T 1800 181 895 or +61 2 9667 9871 F +61 2 9667 9296 www.sydneyairport.com.au
For
per
sona
l use
onl
y
Note:
To ensure the image placeholder
retains its size.
Delete the current image then click
in the middle icon to insert picture.
Then right click>send to back
SYDNEY AIRPORT
2016 INVESTOR DAY
17 OCTOBER 2016
For
per
sona
l use
onl
y

Note:
To ensure the image placeholder
retains its size.
Delete the current image then click
in the middle icon to insert picture.
Then right click>send to back
KERRIE MATHER MANAGING DIRECTOR AND CHIEF EXECUTIVE
OFFICER
OVERVIEW AND STRATEGY
For
per
sona
l use
onl
y

This presentation has been prepared by Sydney Airport Limited (ACN
165 056 360) (“SAL”) in respect of ASX-listed Sydney Airport (“SYD”).
SYD is comprised of the stapled entities SAL and Sydney Airport Trust
1 (ARSN 099 597 921) (“SAT1”). The Trust Company (Sydney Airport)
Limited (ACN 165 967 087/ASFL 301662) (“TTCSAL”) is the
responsible entity of SAT1.
This presentation is not an offer or invitation for subscription or
purchase of or a recommendation of securities. It does not take into
account the investment objectives, financial situation and particular
needs of the investor. Before making an investment in SYD, the
investor or prospective investor should consider whether such an
investment is appropriate to their particular investment needs,
objectives and financial circumstances and consult an investment
adviser if necessary.
Information, including forecast financial information, in this presentation
should not be considered as a recommendation in relation to holding,
purchasing or selling shares, securities or other instruments in SYD or
any other entity. Due care and attention has been used in the
preparation of forecast information. However, actual results may vary
from forecasts and any variation may be materially positive or negative.
Forecasts by their very nature are subject to uncertainty and
contingencies, many of which are outside the control of SAL and
TTCSAL. Past performance is not a reliable indication of future
performance.
Sydney Airport advises that on 28 September 2016 foreign ownership
was 30.4%.
Disclaimer
General securities warning
3
For
per
sona
l use
onl
y
Icon note:
The icons are currently in an icon
placeholder. To swap this,
Delete the current one and click in
the middle to insert icon.
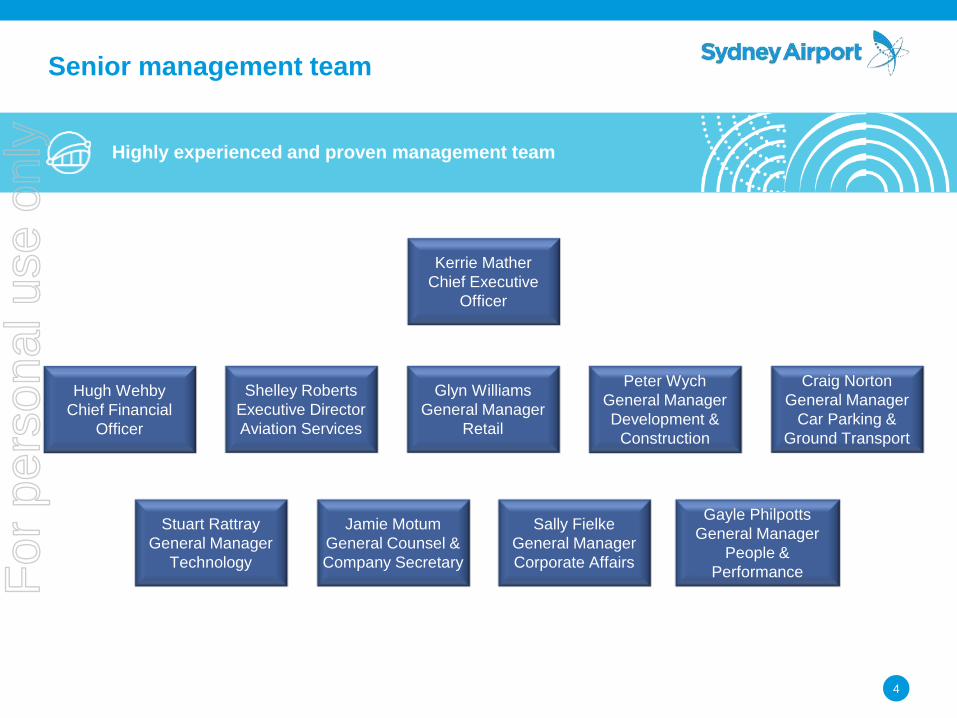
Senior management team
4
Highly experienced and proven management team
Kerrie Mather
Chief Executive
Officer
Shelley Roberts
Executive Director
Aviation Services
Glyn Williams
General Manager
Retail
Craig Norton
General Manager
Car Parking &
Ground Transport
Hugh Wehby
Chief Financial
Officer
Peter Wych
General Manager
Development &
Construction
Stuart Rattray
General Manager
Technology
Jamie Motum
General Counsel &
Company Secretary
Gayle Philpotts
General Manager
People &
Performance
Sally Fielke
General Manager
Corporate Affairs For
per
sona
l use
onl
y

Icon note:
The icons are currently in an icon
placeholder. To swap this,
Delete the current one and click in
the middle to insert icon.
Key themes for today
5
Our strategy for delivering sustainable and growing cash flows
to investors
Aviation,
passenger
and capacity
development
Capital
management
strategy
Ground
transport,
the evolution
Retail
strategy
Innovation driving
passenger
experience and
asset utilisation
90
140
190
240
290
340
Dec-11 Jun-12 Dec-12 Jun-13 Dec-13 Jun-14 Dec-14 Jun-15 Dec-15 Jun-16
Index
SYD accumulation S&P/ASX100 accumulation
Delivering sustainable and growing cash flow
For
per
sona
l use
onl
y

Icon note:
The icons are currently in an icon
placeholder. To swap this,
Delete the current one and click in
the middle to insert icon.
Note:
To ensure the image placeholder
retains its size.
Delete the current image then click
in the middle icon to insert picture.
Then right click>send to back
Our airport
The business
• Balanced and diverse airlines, nationalities and revenues
from aeronautical, retail, car parking and property
businesses
• High quality, surplus aviation capacity
• Supportive ‘monitoring based’ regulatory environment
The performance
• Proven track record of traffic, EBITDA and distribution
growth
• Reliable, resilient cash flows
• Robust, low risk business
• Operational leverage and high EBITDA margin
6
Strong investment characteristics of Sydney Airport
For
per
sona
l use
onl
y

Icon note:
The icons are currently in an icon
placeholder. To swap this,
Delete the current one and click in
the middle to insert icon.
Sydney Airport strategy
7
Our four strategic priorities
Aviation, tourism and
community partnerships
driving passenger growth
Investment delivering
sustainable growth and yield
expansion across all
businesses
Broad stakeholder
engagement and focus to
deliver an improved
experience for customers
Strengthen balance sheet
Strict investment criteria
Long term contracts
Business diversity
Safety and security
Partnering for growth
Investing in capacity, product and efficiency
Delivering a superior customer experience
Managing risk
Strong sustainable investor value growth over time
For
per
sona
l use
onl
y

Icon note:
The icons are currently in an icon
placeholder. To swap this,
Delete the current one and click in
the middle to insert icon.
o Low cost carriers offering
competitive fares, opening
markets and stimulates new
demand
o Airline partnerships are
improving route diversity and
viability
o Increased urbanisation and
increasing affluence
throughout Asia
o Aging population with
increasing disposable income
available for travel
o 1.5 million new seats
expected to be flown in
2016
o Load factors stable through
a period of strong capacity
growth
o Diverse growth from vast array of
markets
o Australians have a strong
propensity to travel internationally
Changing markets driving future traffic growth
8
Attractive markets and changing industry conditions
supporting strong passenger performance
Growing
population,
increasing
propensity to
travel
Real
airfares
continue
to decline
Diverse,
strong &
growing
markets Changing
airline
business
models and
partnerships
New generation technology,
making aircraft larger and
more efficient
Continued
bilateral
liberalisation
o New aircraft
technologies are
changing the economics
for airlines and lowering
airfares
o Next generation aircraft are opening
up new direct destinations
previously unviable
For
per
sona
l use
onl
y

Icon note:
The icons are currently in an icon
placeholder. To swap this,
Delete the current one and click in
the middle to insert icon.
Potential future growth markets
9
Target markets for expected future growth include emerging
economies and improving mature economies
For
per
sona
l use
onl
y

Icon note:
The icons are currently in an icon
placeholder. To swap this,
Delete the current one and click in
the middle to insert icon.
Capacity optimisation
10
Our strategic approach to facilitating long term demand
Optimising our existing infrastructure
- Innovation
- Embracing new technology
- Utilising existing facilities more efficiently
- Pinch point processing investment
Investing and expanding our infrastructure
- Airfield expansion
- Terminal expansion
- Commercial business expansion
For
per
sona
l use
onl
y
Icon note:
The icons are currently in an icon
placeholder. To swap this,
Delete the current one and click in
the middle to insert icon.
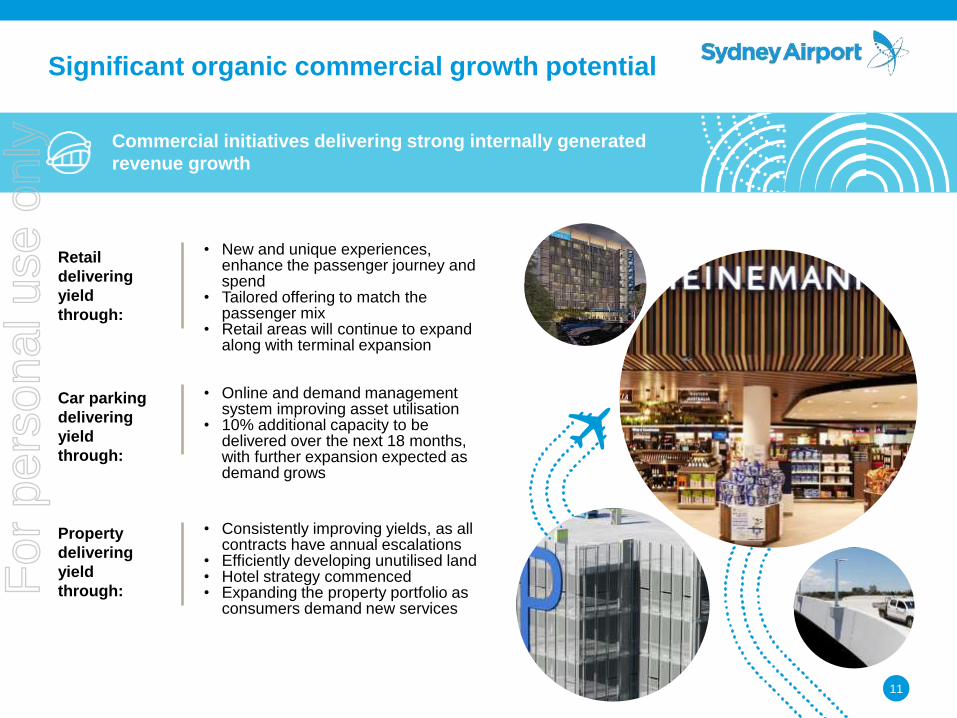
Significant organic commercial growth potential
11
Commercial initiatives delivering strong internally generated
revenue growth
• New and unique experiences, enhance the passenger journey and spend
• Tailored offering to match the passenger mix
• Retail areas will continue to expand along with terminal expansion
• Online and demand management system improving asset utilisation
• 10% additional capacity to be delivered over the next 18 months, with further expansion expected as demand grows
• Consistently improving yields, as all
contracts have annual escalations • Efficiently developing unutilised land • Hotel strategy commenced • Expanding the property portfolio as
consumers demand new services
Retail
delivering
yield
through:
Car parking
delivering
yield
through:
Property
delivering
yield
through: For
per
sona
l use
onl
y
Note:
To ensure the image placeholder
retains its size.
Delete the current image then click
in the middle icon to insert picture.
Then right click>send to back
Western Sydney Airport
12
For
per
sona
l use
onl
y

Icon note:
The icons are currently in an icon
placeholder. To swap this,
Delete the current one and click in
the middle to insert icon.
Western Sydney Airport process
13
Sydney Airport continues to examine the opportunity to
develop and operate the Western Sydney Airport (WSA)
Internal evaluation of the WSA opportunity is ongoing,
focus remains on key commercial and investment
parameters
• Broad-based community and bipartisan political support remains for the project
• The EIS and draft Airport Plan, are being considered by the Environment Minister to inform development of conditions or provisions
• Government has indicated it expects to deliver an NOI to Sydney Airport in 2016
• The first road projects of the 10 year $3.6 billion Western
Sydney Infrastructure Plan are now underway
• Australian and NSW governments have released a
discussion paper on Western Sydney's future rail needs
for community comment, they have indicated the final
report is expected first half of 2017
:
MAY - JUL 2016 Federal election called and
caretaker mode commences
OCT – DEC 2015 Australian government’s Western
Sydney Airport draft environmental impact statement and draft airport plan
on public exhibition
SEP 2014 – ONGOING Australian government
continues to examine Western Sydney opportunity and
engage with Sydney Airport
AUG 2014 Australian government issues notice to consult to Sydney Airport
APR 2014 The Australian government announces Badgerys Creek as the site for the proposed Western Sydney Airport
SEP 2016 EIS and draft Airport Plan revised, pending conditions or provisions
13
For
per
sona
l use
onl
y

Icon note:
The icons are currently in an icon
placeholder. To swap this,
Delete the current one and click in
the middle to insert icon.
Note:
To ensure the image placeholder
retains its size.
Delete the current image then click
in the middle icon to insert picture.
Then right click>send to back
Sydney Airport is best placed to deliver jobs and
economic growth at Western Sydney Airport
Sydney Airport has:
• The unique ability to deliver the jobs and growth for
Western Sydney, with the airports able to operate as a
system
• Demonstrated expertise in planning and financing an
airport to meet growing aviation demand
• Existing business relationships with key airline customers
and suppliers
• In-house expertise that can be effectively deployed to
ensure efficient execution of this project
• Global experience with airport operations and management
14
Sydney Airport has a deep and proven understanding of the
Sydney aviation market
For
per
sona
l use
onl
y

Icon note:
The icons are currently in an icon
placeholder. To swap this,
Delete the current one and click in
the middle to insert icon.
Evaluation principles
15
Key metrics and priorities for Sydney Airport when evaluating
any WSA proposal
Hurdle rates of
return
greenfield
premium
Cash flow and
yield Growth potential Downside
protections
operationally,
financially and
contractually
Impacts on KSA
For
per
sona
l use
onl
y

Note:
To ensure the image placeholder
retains its size.
Delete the current image then click
in the middle icon to insert picture.
Then right click>send to back
RAYMOND KWAN
HEAD OF STRATEGIC PROJECTS
AVIATION, GROWING PASSENGERS AND
ACCOMMODATING CAPACITY
For
per
sona
l use
onl
y
Icon note:
The icons are currently in an icon
placeholder. To swap this,
Delete the current one and click in
the middle to insert icon.
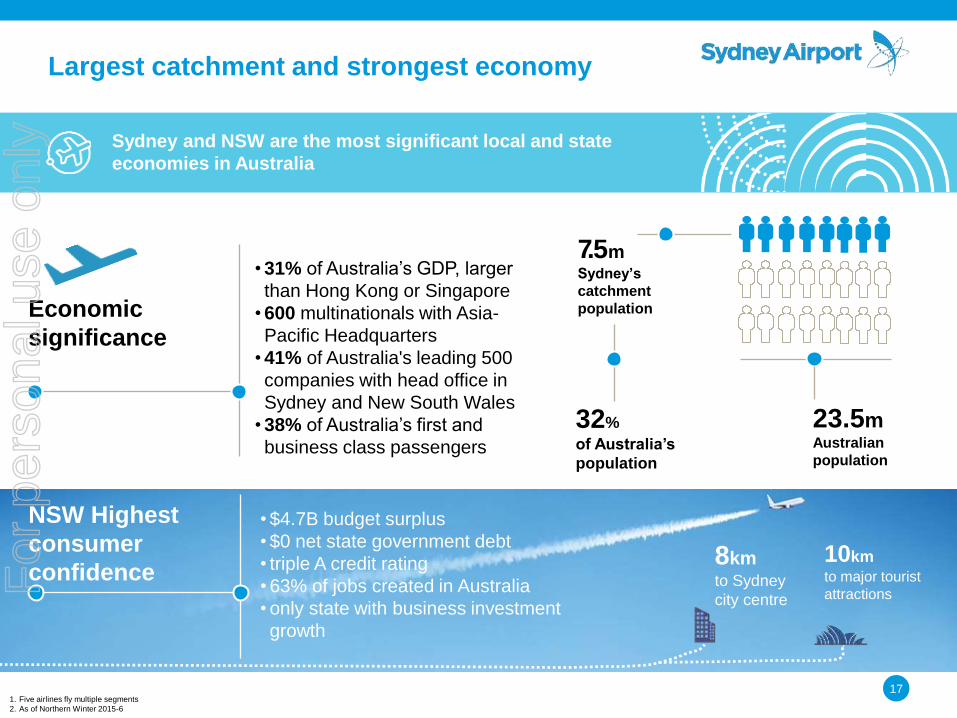
Largest catchment and strongest economy
17
Sydney and NSW are the most significant local and state
economies in Australia
7 . 5 m Sydney’s
catchment
population
32%
of Australia’s
population
23.5m Australian
population
Economic
significance
• 31% of Australia’s GDP, larger
than Hong Kong or Singapore
• 600 multinationals with Asia-
Pacific Headquarters
• 41% of Australia's leading 500
companies with head office in
Sydney and New South Wales
• 38% of Australia’s first and
business class passengers
8km to Sydney
city centre
10km
to major tourist
attractions
1. Five airlines fly multiple segments
2. As of Northern Winter 2015-6
NSW Highest
consumer
confidence
• $4.7B budget surplus
• $0 net state government debt
• triple A credit rating
• 63% of jobs created in Australia
• only state with business investment
growth
For
per
sona
l use
onl
y

Icon note:
The icons are currently in an icon
placeholder. To swap this,
Delete the current one and click in
the middle to insert icon.
Sydney is Australia’s busiest airport
18
Sydney Airport air traffic statistics for the 12 months to June
2016
Total Passengers
40.9m 5.3% International Passengers
14.3m 7.5%
Domestic Passengers
26.6m 4.1% Aircraft Movements
342,300 3.8%
For
per
sona
l use
onl
y

Icon note:
The icons are currently in an icon
placeholder. To swap this,
Delete the current one and click in
the middle to insert icon.
Sydney has significant geographical advantages
to attract continued growth
19
Daily flights from Asia can be served by a single aircraft – a
significant competitive advantage vs. Asia to Europe or North
America
• Sydney is the largest airport for long haul,
Chinese based airlines globally
• A major reason for this is that daily Asian flights can
be served by a single aircraft – a significant
competitive advantage vs. Asia to Europe or North
America
• For these reasons, the ~8-10 hour sector is also
ideal length for long haul, low-cost airlines
• Jetstar (SYD was Jetstar’s base for long-haul
flights)
• Scoot (SYD was the first global destination)
• Cebu Pacific (SYD was the first Australian
destination)
• AirAsia X
• Importantly, airlines can serve destinations
comprising 70% of the world’s population within the
range of a Boeing B787 and Airbus A350
~8-10
hour
flight
Aircraft returns to home
airport in ~20 hours
~8-10
hour
flight
Asia
Arrives in
Sydney
Departs
from
Sydney
Sydney
~2 hour
turnaround
For
per
sona
l use
onl
y

Icon note:
The icons are currently in an icon
placeholder. To swap this,
Delete the current one and click in
the middle to insert icon.
China has been one of Sydney’s growth drivers
20
China has been one of Sydney’s largest and fastest growth
markets
Sydney has 45% share of the 3.3 million O&D passenger movements between Australia and mainland China
13 Mainland cities served direct by 7 airlines vs. 3 Mainland cities served by 4 airlines just 6 years ago
Reasons for Chinese Passenger Growth
Sydney offers a Western experience in a safe and welcoming environment with a mild climate (particularly during Golden Week Holidays which is in China’s winter / Australia’s summer)
Australia ranks first or second on five of the top six criteria which Chinese consider most likely to motivate them to visit a country
NSW has Australia’s largest international student population with almost 250,000 international student enrolments, 27% (65,000) of which are Chinese Nationals
Sydney
Mainland
China
Source: based on Sydney Airport analysis of DIBP OAD Data YE June 2016 (sector passengers - millions)
20 • The Consumer Demand Project (CDP) international tourism research project printed by
Tourism Australia
• “Understanding the Chinese consumer May 2014”
388 400 407 401 436
576 672 758 892 1,041 135
172 195
178
209
11% 9%
11%
14%
0
500
1,000
1,500
YE JUN 2012 YE JUN 2013 YE JUN 2014 YE JUN 2015 YE JUN 2016Annual P
assengers
(000s)
Sydney-China Passenger Market
Australian Resident Chinese Visitors Transit Passengers
4 year CAGR +11%
For
per
sona
l use
onl
y

Icon note:
The icons are currently in an icon
placeholder. To swap this,
Delete the current one and click in
the middle to insert icon.
We’ve also seen strong growth from all of
Sydney’s other major markets
1,059,573
878,108
770,311
567,029
348,764 295,111
244,729 215,379 213,062
176,653 164,018 158,982 146,892 118,160 114,530
-
200,000
400,000
600,000
800,000
1,000,000
China NewZealand
USA UK S Korea Japan Singapore India Hong Kong Canada Germany Malaysia Indonesia Philippines France
21
All of Sydney’s major markets – new and traditional, mature
markets – have grown over the last 12 months
+17.7%
+1.2%
+13.6%
+5.9%
+17.4%
+13.4%
+9.6% +11.8% +18.9%
+3.7% +5.0% +6.7% +5.4% +25.7% +1.5%
Source: DIAC OAD Data YE July 2016, Tourism Australia, “Tourism Australia and Aviation” 2016.
% represents year on year growth of each market (12 months to July 2016 vs. July 2015).
USA visitors
• 13.6 million nights, +9%
• Average trip spend of $5,000+
• “Sydney, Melbourne, Reef”
Japanese visitors
• 8.7 million nights, +7%
• Majority are holiday visitors (67%)
• “Sydney, Gold Coast, Reef”
For
per
sona
l use
onl
y

Icon note:
The icons are currently in an icon
placeholder. To swap this,
Delete the current one and click in
the middle to insert icon.
Sydney is Australia’s highest yielding
international market
22
Sydney’s status as Australia's business and economic hub is
reflected in its 38% share of Australia’s international premium
passengers
Source: Sabre MIDT Data Year Ending Apr 2016
Sydney’s ability to attract the largest share of the premium market
provides airlines with a significant revenue premium compared to
other Australian airports
Sydney35%
Melbourne25%
Brisbane14%
Perth13%
Adelaide4%
Other9%
International Economy Passenger Share
Sydney38%
Melbourne28%
Brisbane12%
Perth13%
Adelaide3%
Other6%
International Premium Passenger Share
The premium traveller is critical for airlines’
profitability – airlines have made significant
improvements in premium products, in their
fleet as well as lounges at Sydney Airport
For
per
sona
l use
onl
y

Icon note:
The icons are currently in an icon
placeholder. To swap this,
Delete the current one and click in
the middle to insert icon.
Australia’s two-speed economy has meant a
return to the East Coast business hubs
23
Sydney Airport is benefiting from a re-focus on the East Coast
business hubs, and increasing LCC penetration rates
Despite strong market growth, Sydney Airport is
still significantly underrepresented by LCCs
Domestic airlines have re-focused on the East Coast
business hubs in a pursuit for Yield Growth
“Since the mining investment boom peaked in 2011, travel demand
has been tapering in mining-intensive markets – like Western
Australia and parts of Queensland – but stronger in other markets,
including east cost business and tourism routes”, Qantas 2016
Annual Review
Brisbane
Melbourne
Resources
markets
Sydney
• LCCs continue to gain market share
• The LCC market share at Sydney Airport
remains at levels well below LCC penetration in
more developed markets
• Airlines redirecting capacity and resources from mining
markets to business and tourism routes
Domestic
markets
International
markets 23% 26% 29% 31% 33%
77% 74% 71% 69% 67%
56%
40%
0%
10%
20%
30%
40%
50%
60%
0
5
10
15
20
25
30
35
40
2011 2012 2013 2014 2015
Pax (
mn
)
FSC
LCC
SouthEast Asia LCC penetration ¹
Western Europe LCC penetration¹
Source: Sydney Airport, CAPA 2016
¹ LCC share of available seats within a region (Jun-2016)
For
per
sona
l use
onl
y
Note:
To ensure the image placeholder
retains its size.
Delete the current image then click
in the middle icon to insert picture.
Then right click>send to back
Sydney Airport’s Plans to Leverage Our
Advantages
For
per
sona
l use
onl
y
Icon note:
The icons are currently in an icon
placeholder. To swap this,
Delete the current one and click in
the middle to insert icon.
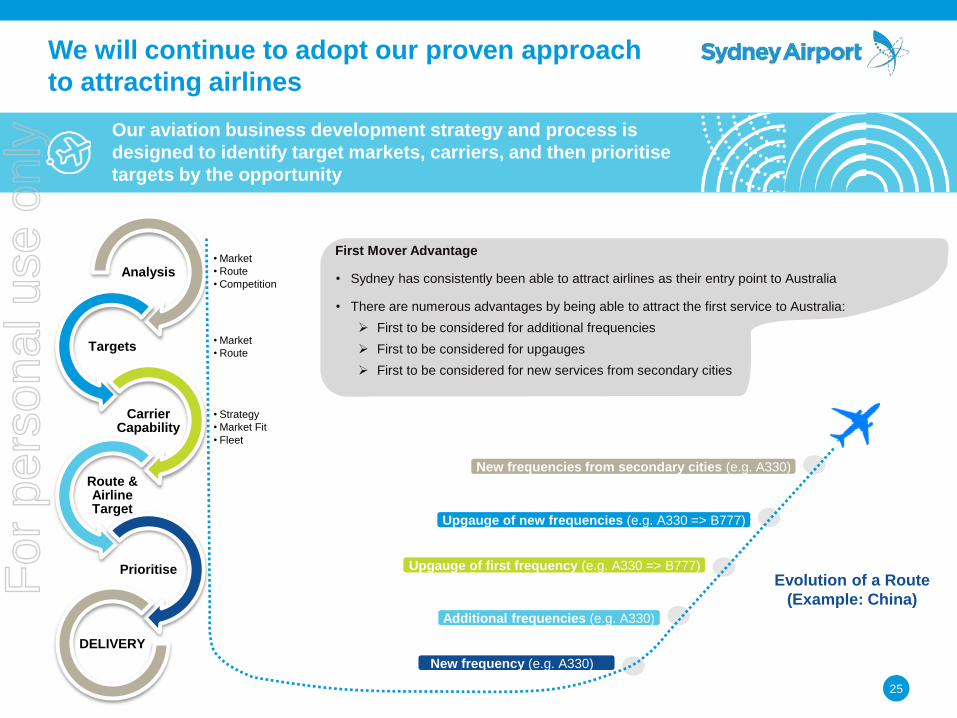
We will continue to adopt our proven approach
to attracting airlines
25
Our aviation business development strategy and process is
designed to identify target markets, carriers, and then prioritise
targets by the opportunity
Upgauge of new frequencies (e.g. A330 => B777)
Upgauge of first frequency (e.g. A330 => B777)
Additional frequencies (e.g. A330)
New frequency (e.g. A330)
• Market
• Route
• Competition Analysis
• Market
• Route Targets
• Strategy
• Market Fit
• Fleet
Carrier Capability
Route & Airline Target
Prioritise
DELIVERY
Evolution of a Route
(Example: China)
New frequencies from secondary cities (e.g. A330)
First Mover Advantage
• Sydney has consistently been able to attract airlines as their entry point to Australia
• There are numerous advantages by being able to attract the first service to Australia:
First to be considered for additional frequencies
First to be considered for upgauges
First to be considered for new services from secondary cities
For
per
sona
l use
onl
y

Icon note:
The icons are currently in an icon
placeholder. To swap this,
Delete the current one and click in
the middle to insert icon.
32%
13%
55% 68%
Unused slots International Domestic
Increased slot utilisation and continued aircraft
upgauging will support future traffic growth
32% of our slots remain unused. These unused slots are
primarily in the early morning and afternoon / evening periods,
which are ideal for the Asian and Middle Eastern growth regions
0
2
4
6
5:0
0
6:0
0
7:0
0
8:0
0
9:0
0
10
:00
11
:00
12
:00
13
:00
14
:00
15
:00
16
:00
17
:00
18
:00
19
:00
20
:00
21
:00
22
:00
Asian Hubs
0
2
4
6
5:0
0
6:0
0
7:0
0
8:0
0
9:0
0
10
:00
11
:00
12
:00
13
:00
14
:00
15
:00
16
:00
17
:00
18
:00
19
:00
20
:00
21
:00
22
:00
China
32% of Slots Remain Unused – Significant Growth Opportunities
Arrival / departure periods for our growth markets of Asia and specifically China are
spread through the day
Since 2000, passenger growth has outstripped growth in aircraft
movements by a factor of 5x
57%
12%
0
20
40
60
80
100
120
140
160
180 Growth in Pax/Mvts
Pax Movements
Growth of Aircraft Movements (Indicative of a Busy Day)
26
For
per
sona
l use
onl
y

Icon note:
The icons are currently in an icon
placeholder. To swap this,
Delete the current one and click in
the middle to insert icon.
Sydney Airport’s investments will be staged and
driven by demand
27
Expansion areas under consideration are shown below –
primarily to increase gate, apron and support infrastructure
capacity
T2 / Domestic
Aprons SSE Sector
SW Sector Aprons
Qantas Jetbase
T1 and Freight area
Northern Ponds
Aprons
For
per
sona
l use
onl
y
Icon note:
The icons are currently in an icon
placeholder. To swap this,
Delete the current one and click in
the middle to insert icon.
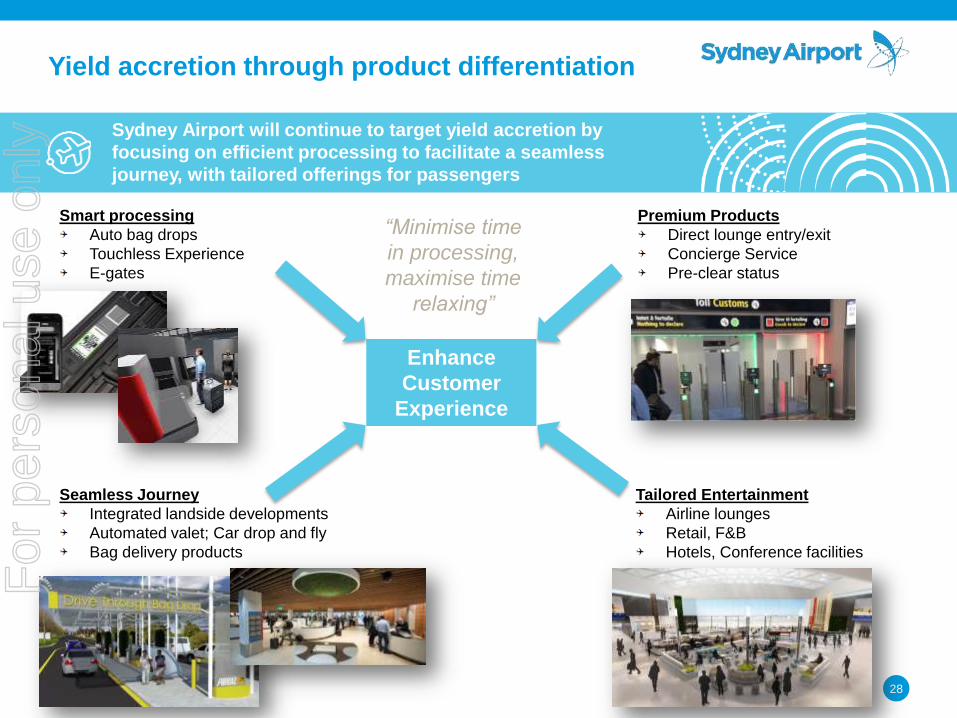
Smart processing
Auto bag drops
Touchless Experience
E-gates
Yield accretion through product differentiation
28
Sydney Airport will continue to target yield accretion by
focusing on efficient processing to facilitate a seamless
journey, with tailored offerings for passengers
Enhance
Customer
Experience
Premium Products
Direct lounge entry/exit
Concierge Service
Pre-clear status
Tailored Entertainment
Airline lounges
Retail, F&B
Hotels, Conference facilities
Seamless Journey
Integrated landside developments
Automated valet; Car drop and fly
Bag delivery products
“Minimise time
in processing,
maximise time
relaxing”
For
per
sona
l use
onl
y
Icon note:
The icons are currently in an icon
placeholder. To swap this,
Delete the current one and click in
the middle to insert icon.
Summary
29
Sydney’s Unique Advantages
• Sydney has significant geographic
advantages, resulting in strong growth from
China and other major markets
• Sydney is Australia’s highest yielding market
for airlines
• Sydney has an unrivalled domestic and
international network
Our Plans to Leverage our Advantages
• We will continue to adopt our proven
approach to attracting airlines
• Encouraging increased slot utilisation and
continued aircraft upgauging will support
future traffic growth
• A staged approach to investment, driven by
demand
• Driving yield accretion by investing in efficient
technologies and bespoke products
Sydney Airport has a clear strategy for Continued Growth
For
per
sona
l use
onl
y

Note:
To ensure the image placeholder
retains its size.
Delete the current image then click
in the middle icon to insert picture.
Then right click>send to back
HUGH WEHBY CHIEF FINANCIAL OFFICER
CAPITAL MANAGEMENT STRATEGY
For
per
sona
l use
onl
y

31
CAPITAL
MANAGEMENT INVESTMENT
Capital management strategy
Managing a capital structure optimised to effectively
fund investment and deliver stable and growing returns
CASH FLOW
& INVESTOR
RETURNS
Refinancing
DRP
DRP
& Debt
Aeronautical
& Commercial Aeronautical
Debt
EXPANDING THE BUSINESS MODEL
PASSENGERS EBITDA
For
per
sona
l use
onl
y

32
434
200
519
317545
751
445
725 719 750802
1,033
643
1,163
659
438
136
381
0
200
400
600
800
1,000
1,200
1,400
1,600
2016 2017 2018 2019 2020 2021 2022 2023 2024 2025 2026 2027 2028 2029 2030
A$
m
15%
30%45%
10%
Bank Debt (Undrawn) Bonds (Wrapped)
Bonds (Core) Bonds (Opportunistic)
FUNDING SOURCES
Managing the capital structure
Short term bank debt funds investment
Long term bonds refinance drawn bank debt and maturities
DEBT PORTFOLIO COMPOSITION3
1 As at 30 June 2016
2 Core and opportunistic market bonds only; excludes credit wrapped bonds
3 As at 30 June 2016; pro-forma repayment of drawn bank debt using DRP proceeds on 15 August 2016
BANK DEBT
BONDS
Refinance drawn debt and maturities
Core and opportunistic markets
10 years1,2 average issue tenor
Mid-20241 average maturity
BONDS
+ Funds investment
Domestic and foreign banks
4 years1 average issue tenor
Early-20181 average maturity
BANK DEBT
15% OF PORTFOLIO LEVEL
For
per
sona
l use
onl
y

33
Managing the capital structure
Proactively address funding needs while delivering on
funding objectives
MAINTAIN
CAPACITY
FOR FUTURE
RAISINGS
OPTIMISE
FUNDING
COSTS
DIVERSIFY
FUNDING
SOURCES
SPREAD &
LENGTHEN
MATURITY
PROFILE
MINIMISE
EXECUTION
RISK
MINIMUM
BBB/Baa2
CREDIT
RATING
FUNDING OBJECTIVES FUNDING STRATEGY
(2016 CASE STUDY)
1 As at 31 December 2015 2 As at 31 December 2015; over the following two year period from 31 December 2015 3 Illustrative range based on market guidance 4 Excludes bank debt and credit wrapped bonds 5 USPP bonds issued in AUD
$1.7bn PRO-FORMA
LIQUIDITY
POSITION
$0.5bn1
STARTING
LIQUIDITY
POSITION
CORE1,4
OPPORTUNISTIC1,4
US144A/RegS
Euro
USD1.8bn
EUR0.7bn
Australia
Canada
USPP
AUD0.1bn
CAD0.2bn
AUD0.6bn5
Determine
Funding Need
Proactively
Issue Bond
Select Market
Swiss
Sterling
Other PP
Nil
Nil
Nil
Consider Funding
Objectives
USD900M
(AUD1.2BN)
US144A/RegS
APRIL 2016
FORECAST
DRAWN DEBT
MATURITIES2
$0.5bn FORECAST
INVESTMENT2,3
$0.5-0.8bn
For
per
sona
l use
onl
y

34
6.0x
7.0x
8.0x
9.0x
10.0x
11.0x
12.0x
2002 2008 1H16
Net Debt to EBITDA Ratio
- x
0.5x
1.0x
1.5x
2.0x
2.5x
3.0x
2002 2008 1H16
Interest Coverage Ratio
Managing the capital structure
Commitment to maintaining at least a BBB/Baa2 credit rating
ANNUAL DEMAND
PRICING
HEADROOM
Attractive pricing within rating band
Attractive pricing relative to peers
Strong investor pricing tension
Low new issue concessions
1 Figure measured over a rolling 12 month period 2 Illustrative level of demand based on feedback from banks assuming no premium pricing to access greater volume; does not include private placement demand
AUD7.5bn of debt investor demand1,2
AUD1.6bn maximum drawn debt maturities1
“Aggressive”
BB Grade
FINANCIAL “Excellent”
AA Grade
OPERATIONAL
BBB/Baa2 CREDIT RATING 2.5 2.0 1.0 1.0 0.5 0.5
0.0 1.0 2.0 3.0 4.0 5.0 6.0 7.0 8.0
7.5
A$bn
US144A EUR AUD GBP CAD CHF
CREDIT RATING
“Resilience of passenger demand
to external shocks” – S&P
“Relatively high leverage compared
to regional peers” – S&P
“Proactive management of
debt refinancing” – S&P
“Significant metrics headroom that can
accommodate potential increased leverage” – S&P
“Strongly positioned
in Baa2 rating” – Moody’s
For
per
sona
l use
onl
y

35
-4.0
-3.0
-2.0
-1.0
0.0
1.0
2.0
3.0
4.0
0% 10% 20% 30% 40% 50% 60% 70% 80% 90% 100%
Cen
ts p
er
Se
cu
rity
(C
PS
)
% Fixed or Hedged
0%
10%
20%
30%
40%
50%
60%
70%
80%
90%
100%
Year 1 Year 2 Year 3 Year 4 Year 5
% F
ixe
d o
r H
ed
ge
d
9%
53%
38%
Unhedged Floating Hedged Floating Fixed
Managing the capital structure
Interest rate and currency hedging stabilise and de-risk cash
flows
INTEREST RATE
HEDGING
91% 30 JUN 16
1 Measured using floating drawn debt outstanding as at 30 June 2016; fixed rate debt may be refinanced with unhedged floating rate debt over time 2 USPP bonds issued in AUD
30 JUN 16
MINIMUM AVERAGE
INTEREST RATE HEDGING
(5 YEAR LOOKFORWARD)
ANNUAL INTEREST RATE
HEDGING TARGET BANDS
-1% FLOATING RATES
+1% FLOATING RATES
ANNUALISED
VARIANCE1
±0.3 CPS
(30 JUN 16)
5YR
AVG
CURRENCY
HEDGING
100% 30 JUN 16
US144A/RegS (’21)
US144A/RegS (’23)
US144A/RegS (’25)
US144A/RegS (’26)
Euro (’24)
Canadian (’18)
USPP (’28/29)
USD500m
USD825m
USD500m
USD900m
EUR700m
CAD225m
AUD519m
AUD802m
AUD643m
AUD1.2bn
AUD1.0bn
AUD217m
AUD574m2
55%
71%
24%
5%
Hedged US144A Hedged Euro Hedged Canadian
For
per
sona
l use
onl
y
36
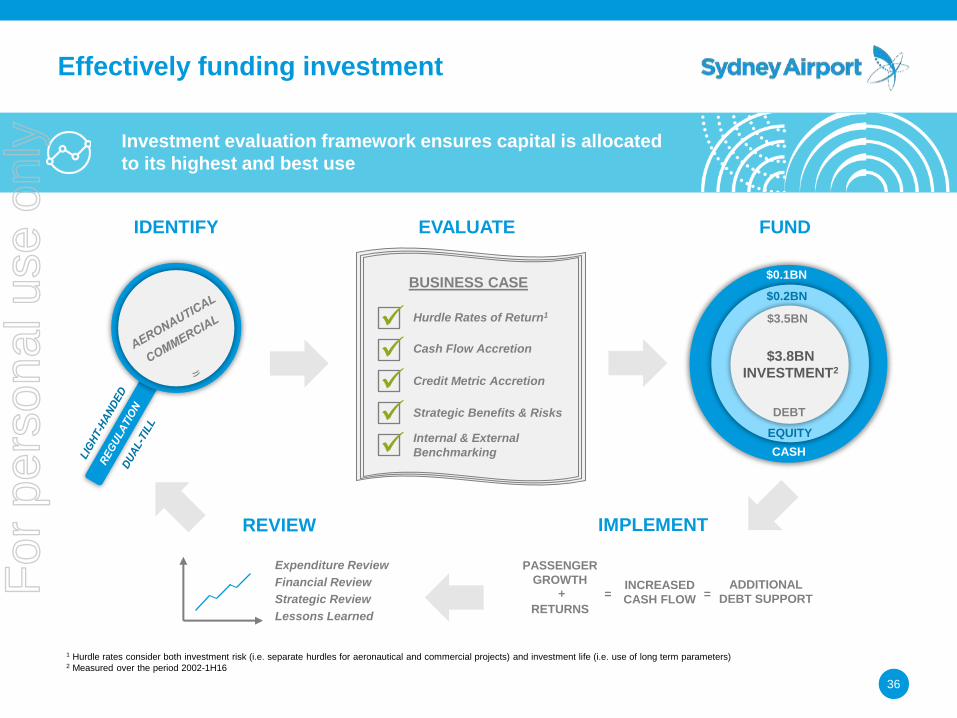
Effectively funding investment
Investment evaluation framework ensures capital is allocated
to its highest and best use
EVALUATE
REVIEW
FUND
Hurdle Rates of Return1
BUSINESS CASE
IDENTIFY
Strategic Benefits & Risks
Credit Metric Accretion
Cash Flow Accretion
Internal & External
Benchmarking
1 Hurdle rates consider both investment risk (i.e. separate hurdles for aeronautical and commercial projects) and investment life (i.e. use of long term parameters) 2 Measured over the period 2002-1H16
IMPLEMENT
PASSENGER
GROWTH
RETURNS
ADDITIONAL
DEBT SUPPORT INCREASED
CASH FLOW = = +
DEBT
EQUITY
CASH
$3.5BN
$3.8BN
INVESTMENT2
$0.2BN
$0.1BN
Expenditure Review
Financial Review
Strategic Review
Lessons Learned
For
per
sona
l use
onl
y

37
Effectively funding investment
Aeronautical and commercial investment generates
operational cash flow growth above passenger growth
AERONAUTICAL INVESTMENT COMMERCIAL INVESTMENT
Runways, taxiways, airfield lighting,
aprons, gates, baggage, terminals,
security, bussing, wayfinding, technology
Car parking, car rental, ground
transport, retail, offices, hotels,
lounges, advertising, technology
Domestic Precinct Hotel
est. completion mid-2017
Significant demand at two existing hotels
Shortfall in supply on and off-airport
Core component of airport experience
Strong returns, cash flow and credit metric accretion
Diverse occupant mix with increasing pax and airlines
Owner-operator strategy enhances return proposition
Early Bag Store
completed mid-2015
Contracted investment recovery
Increased baggage system efficiency
Increased baggage system capacity
Enhanced airline flexibility
Enhanced check-in capability
Reduction in operating expenses
For
per
sona
l use
onl
y

38
Delivering stable and growing returns
Sydney Airport’s business model provides significant
downside protection
100% distribution coverage
with net operating receipts
Robust interest rate hedging and
100% foreign currency hedging
Minimum BBB/Baa2 credit rating
Maintaining sufficient liquidity buffers
Ensuring minimum
counterparty credit ratings
Ensuring maximum
counterparty exposure limits
FINANCIAL
PROTECTIONS
Stable and resilient
passenger growth
Diverse passenger, airline
and destination mix
Contracted aeronautical
investment recovery
Minimum guaranteed rents
Strong commercial demand
with low vacancies and
long-term agreements
Non-passenger linked
revenue sources
Investment flexibility
OPERATING
PROTECTIONS
For
per
sona
l use
onl
y
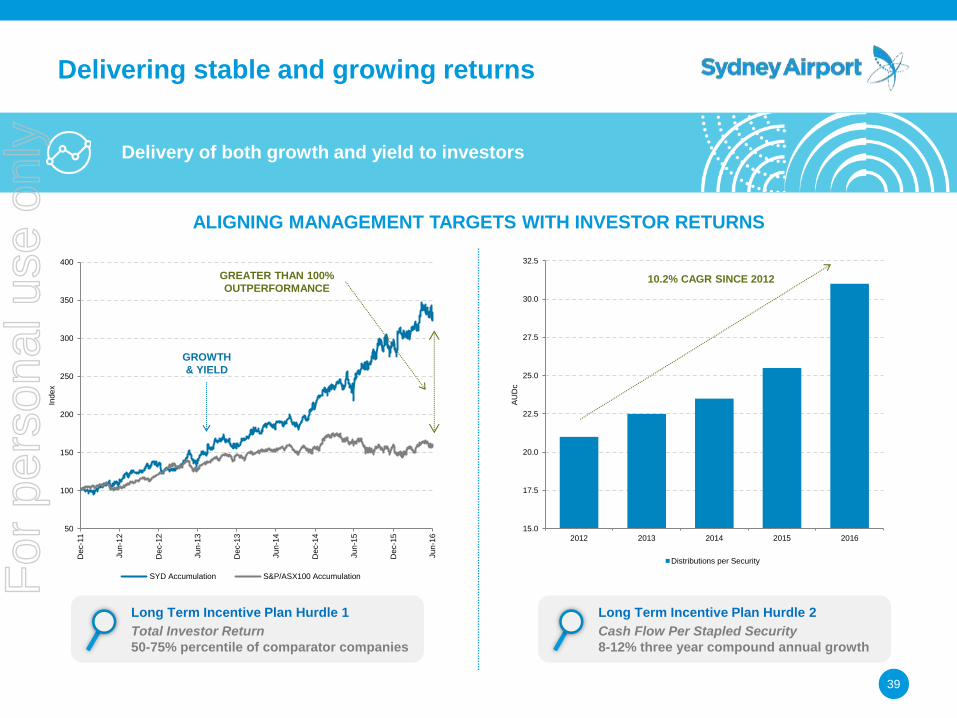
39
50
100
150
200
250
300
350
400
De
c-1
1
Ju
n-1
2
De
c-1
2
Ju
n-1
3
De
c-1
3
Ju
n-1
4
De
c-1
4
Ju
n-1
5
De
c-1
5
Ju
n-1
6
Ind
ex
SYD Accumulation S&P/ASX100 Accumulation
15.0
17.5
20.0
22.5
25.0
27.5
30.0
32.5
2012 2013 2014 2015 2016
AU
Dc
Distributions per Security
Delivering stable and growing returns
Delivery of both growth and yield to investors
ALIGNING MANAGEMENT TARGETS WITH INVESTOR RETURNS
GROWTH
& YIELD
GREATER THAN 100%
OUTPERFORMANCE 10.2% CAGR SINCE 2012
Long Term Incentive Plan Hurdle 1
Total Investor Return
50-75% percentile of comparator companies
Long Term Incentive Plan Hurdle 2
Cash Flow Per Stapled Security
8-12% three year compound annual growth
For
per
sona
l use
onl
y

Note:
To ensure the image placeholder
retains its size.
Delete the current image then click
in the middle icon to insert picture.
Then right click>send to back
CRAIG NORTON GENERAL MANAGER PARKING AND GROUND
TRANSPORT
GROUND TRANSPORT, THE EVOLUTION
For
per
sona
l use
onl
y
Icon note:
The icons are currently in an icon
placeholder. To swap this,
Delete the current one and click in
the middle to insert icon.
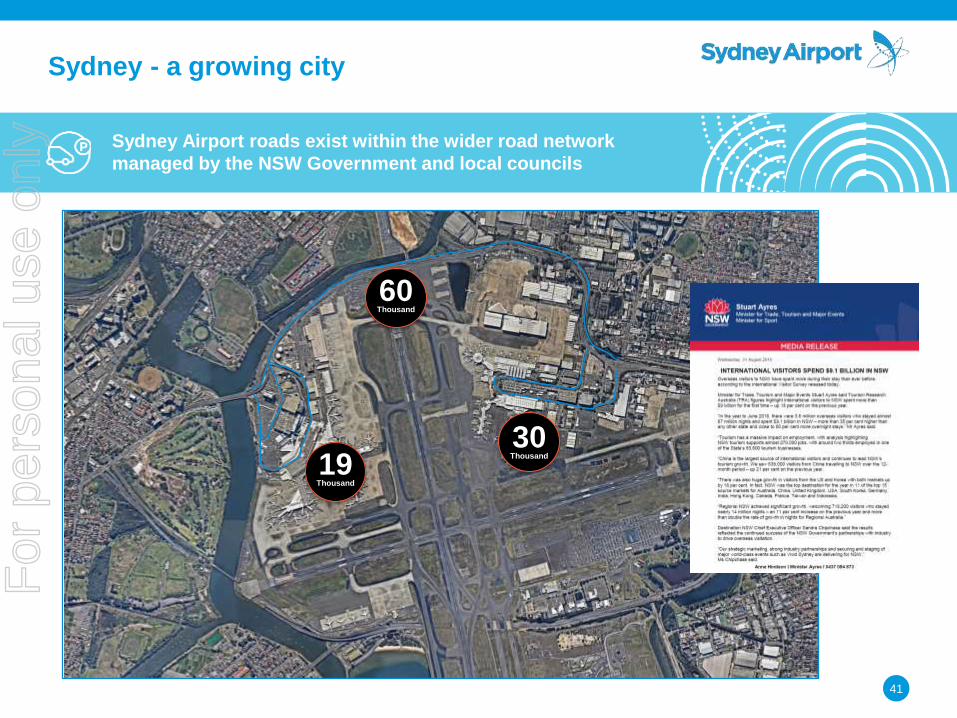
Sydney - a growing city
41
Sydney Airport roads exist within the wider road network
managed by the NSW Government and local councils
19 Thousand
30 Thousand
60 Thousand
For
per
sona
l use
onl
y

Icon note:
The icons are currently in an icon
placeholder. To swap this,
Delete the current one and click in
the middle to insert icon.
Immediate term – process improvements
42
Sydney Airport uses forecast passenger demand profiles to
model the likely extent of traffic queues
• The combination of the curfew
and global scheduling
connections drives the early
morning arrivals and departures
• Additional seat capacity
scheduled by airlines during the
peak is in response to passenger
demand
• During the peak on weekdays
airport traffic will mix with general
commuter traffic which may lead
to delays on roads leading to and
from the airport
• Many friends and family offer to
drop off or pick up on weekends
because they have the time. This
additional volume sometimes
means delays on roads to and
from the airport
For
per
sona
l use
onl
y

Icon note:
The icons are currently in an icon
placeholder. To swap this,
Delete the current one and click in
the middle to insert icon.
Immediate term – process improvements
Operational Principles:
43
Sydney Airport has clearly defined traffic management
processes which include close liaison with TMC and Police
Level 5
• Level 4+
• Maximum precinct resourcing
• KMOs active on the roadway
• P6 used as drop off overflow
• Arrivals Rd pedestrian crossings manned
Level 4
• Level 3+
• P6 used as drop off overflow
Level 3
• Level 2+
• Maximum effective kerbside resourcing
• Departures pedestrian crossing signals staffed
Level 2
• Level 1 +
• Moderate kerbside resourcing
• KMOs active on the roadway
Level 1
• Open operation
• Standard kerbside resourcing
Anticipated Passenger Demand
Maximise Minimise
User Safety Operational Disruption
Throughput Impacts on the local and
wider road network
Resilience
Customer Experience
Management Framework
• Defines levels of intervention
• Anticipated demand is assessed and a resourcing and
management plan to achieve operational principles is
selected and implemented.
• Management level can be escalated as required through
the Landside Operations Centre
• Through rigorous selection processes, training and
benchmarking, reliable kerbside management
performance is established and maintained
For
per
sona
l use
onl
y

Icon note:
The icons are currently in an icon
placeholder. To swap this,
Delete the current one and click in
the middle to insert icon.
Immediate term – process improvements
44
Landside operations centre is the hub for real time active control
of airport roads with seating for TMC and NSW Police as required
For
per
sona
l use
onl
y

Icon note:
The icons are currently in an icon
placeholder. To swap this,
Delete the current one and click in
the middle to insert icon.
Short term – infrastructure repurposing
45
The new pick up arrangements at T2/T3 re-purposed existing
infrastructure to adapt to legalisation of ride sharing
0 – 15 mins = $8.00
0 – 15 mins = $4.00
0 – 15 mins = Free
For
per
sona
l use
onl
y
Icon note:
The icons are currently in an icon
placeholder. To swap this,
Delete the current one and click in
the middle to insert icon.
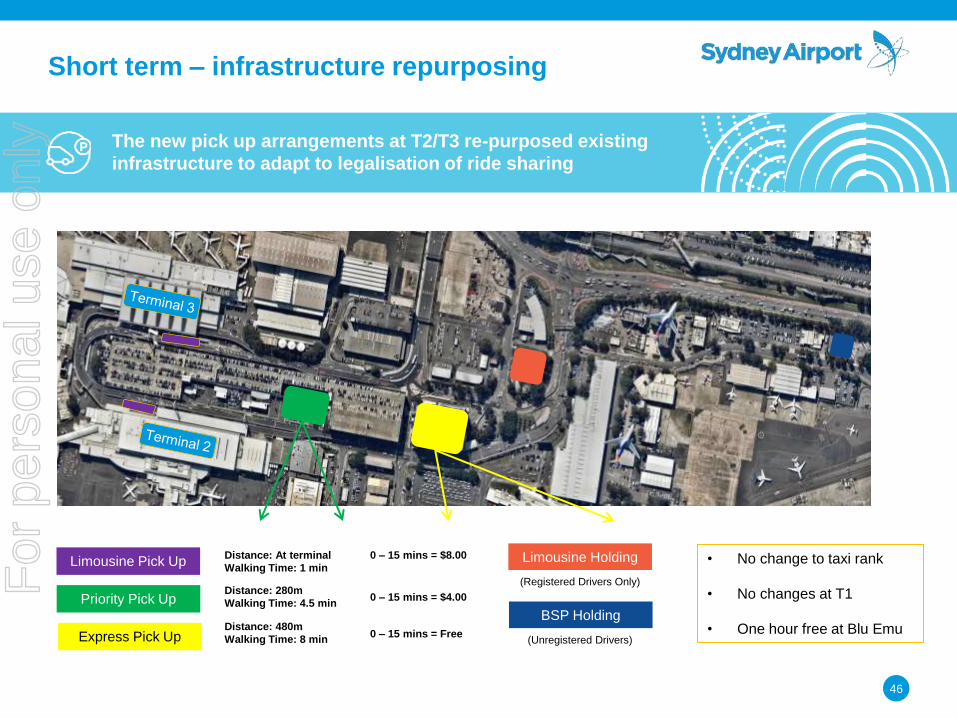
Short term – infrastructure repurposing
46
The new pick up arrangements at T2/T3 re-purposed existing
infrastructure to adapt to legalisation of ride sharing
Limousine Pick Up
Priority Pick Up
Express Pick Up
Distance: At terminal
Walking Time: 1 min
Distance: 280m
Walking Time: 4.5 min
Distance: 480m
Walking Time: 8 min
0 – 15 mins = $8.00
0 – 15 mins = $4.00
0 – 15 mins = Free
Limousine Holding
BSP Holding
• No change to taxi rank
• No changes at T1
• One hour free at Blu Emu
(Registered Drivers Only)
(Unregistered Drivers)
For
per
sona
l use
onl
y
Icon note:
The icons are currently in an icon
placeholder. To swap this,
Delete the current one and click in
the middle to insert icon.
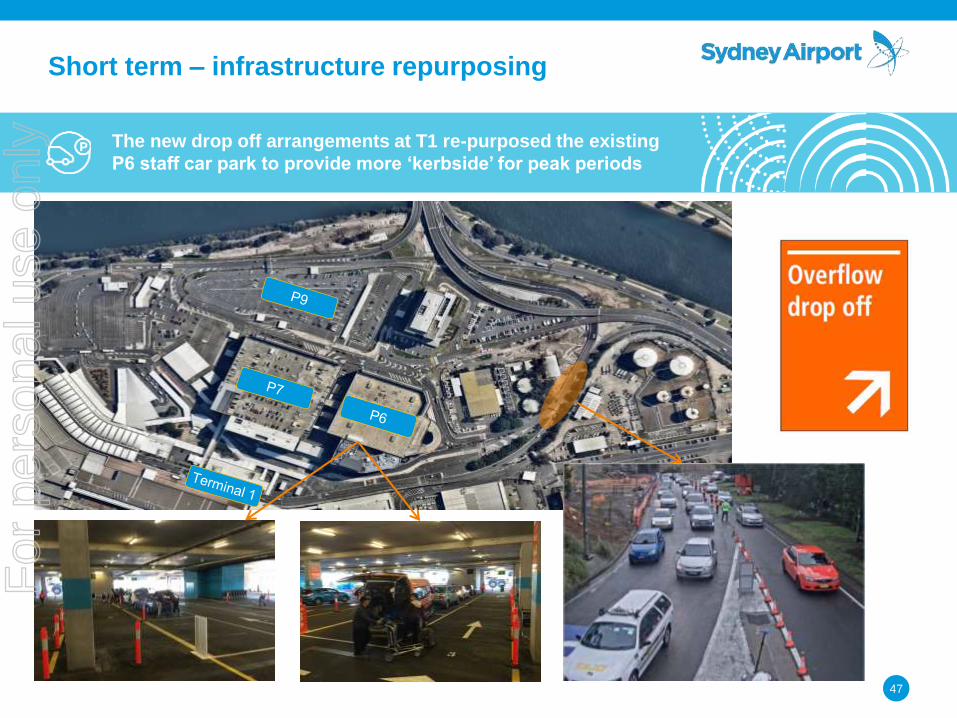
47
The new drop off arrangements at T1 re-purposed the existing
P6 staff car park to provide more ‘kerbside’ for peak periods
Short term – infrastructure repurposing
For
per
sona
l use
onl
y

Icon note:
The icons are currently in an icon
placeholder. To swap this,
Delete the current one and click in
the middle to insert icon.
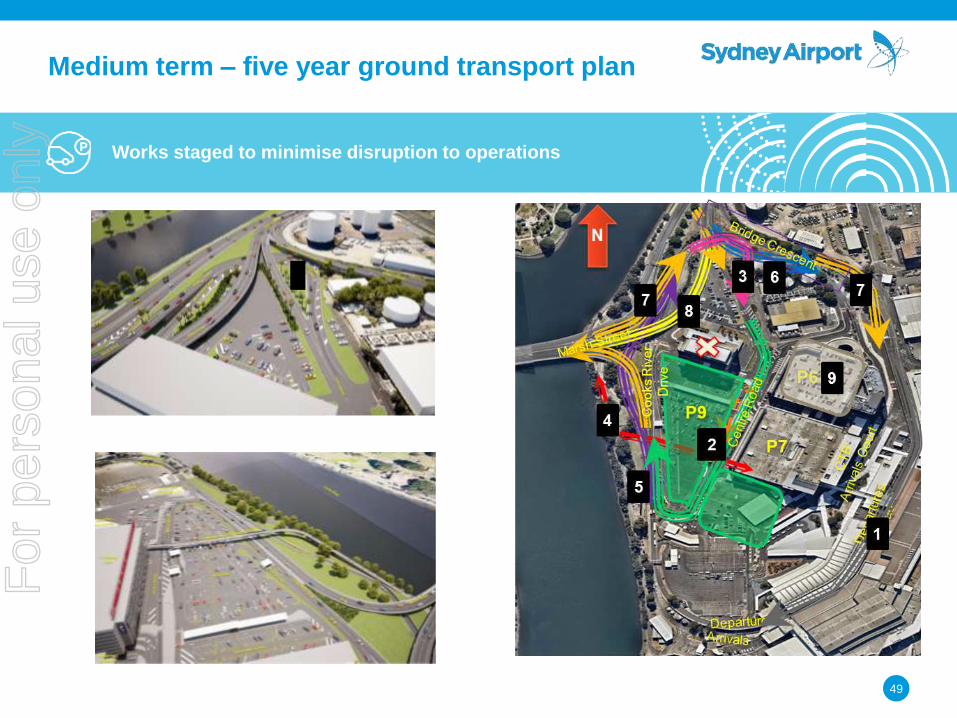
Description Operational
Sydney Airport Works
1 Widening of kerbside lane on Departures Rd & extend kerb by 120m
Link Rd entry reconfiguration on Airport Drive
Dedicated bus drop off zone at south end of terminal
Completed
2 Reconfigured parking entries and exits, including a new city bound
exit
Relocation and improvement of Express Pick-Up facility
New Centre Road & taxi holding area improvements
Completed
3 New Marsh Street exit to Centre Road entry Feb-17
4 Above grade pedestrian/cyclist shared path from the Alexandra
Canal Cycleway over roads and open air car park into the P7 at
Level 1
May-17
5 New dedicated exit road for Departures Road and Arrivals Court
traffic to Airport Drive
Sep-17
6 New Airport Drive flyover to Arrivals Court, eliminating weaving on
approach to Departures Ramp
Q4, 2017
7 Widening of Airport Drive link to Centre Road, Marsh Street off ramp
to Departures Road and Departures Road Up-ramp
Q4, 2019
8 Tidal lane configuration on Airport Drive/Marsh Street Q4, 2019
9 Expanding P6 car park with four extra floors adding 1,230 bays Nov-17
NSW Government Works
A Widening Marsh Street westbound with two extra lanes, one of which
being dedicated to cyclists.
Jul-17
48
Works staged to minimise disruption to operations
Medium term – five year ground transport plan
For
per
sona
l use
onl
y
Icon note:
The icons are currently in an icon
placeholder. To swap this,
Delete the current one and click in
the middle to insert icon.
49
Works staged to minimise disruption to operations
Medium term – five year ground transport plan
For
per
sona
l use
onl
y
Icon note:
The icons are currently in an icon
placeholder. To swap this,
Delete the current one and click in
the middle to insert icon.
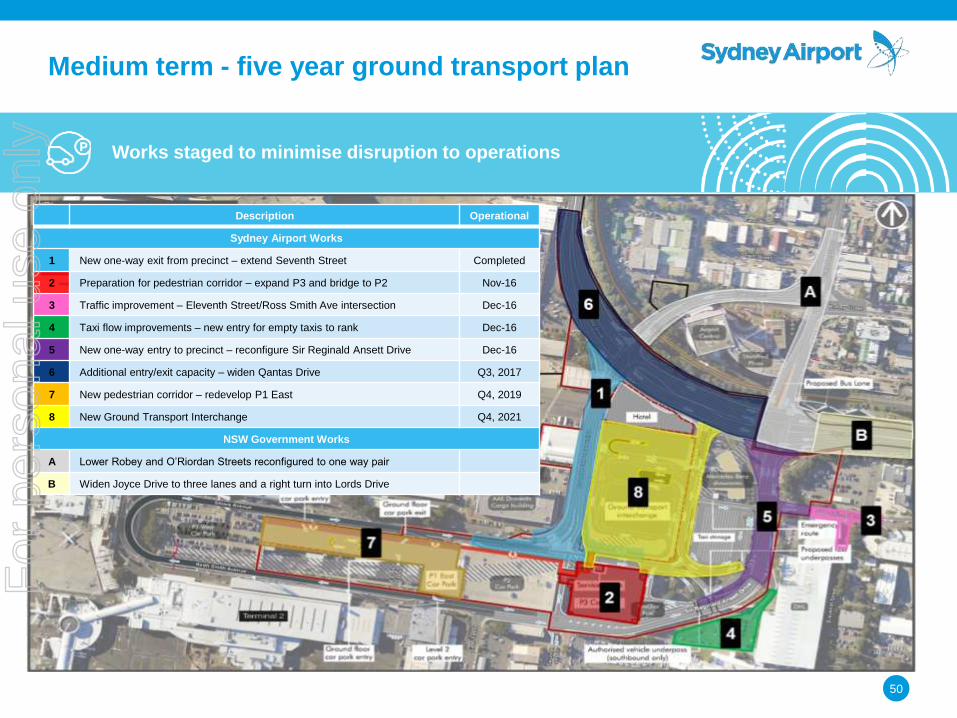
50
Works staged to minimise disruption to operations
Description Operational
Sydney Airport Works
1 New one-way exit from precinct – extend Seventh Street Completed
2 Preparation for pedestrian corridor – expand P3 and bridge to P2 Nov-16
3 Traffic improvement – Eleventh Street/Ross Smith Ave intersection Dec-16
4 Taxi flow improvements – new entry for empty taxis to rank Dec-16
5 New one-way entry to precinct – reconfigure Sir Reginald Ansett Drive Dec-16
6 Additional entry/exit capacity – widen Qantas Drive Q3, 2017
7 New pedestrian corridor – redevelop P1 East Q4, 2019
8 New Ground Transport Interchange Q4, 2021
NSW Government Works
A Lower Robey and O’Riordan Streets reconfigured to one way pair
B Widen Joyce Drive to three lanes and a right turn into Lords Drive
Medium term - five year ground transport plan
For
per
sona
l use
onl
y

Icon note:
The icons are currently in an icon
placeholder. To swap this,
Delete the current one and click in
the middle to insert icon.
Bring on the evolution!
51
Driverless cars, ticketless parking, road access charging
represent opportunities to make the customer journey easier
For
per
sona
l use
onl
y

Note:
To ensure the image placeholder
retains its size.
Delete the current image then click
in the middle icon to insert picture.
Then right click>send to back
GLYN WILLIAMS GENERAL MANAGER RETAIL
RETAIL STRATEGY
For
per
sona
l use
onl
y

Icon note:
The icons are currently in an icon
placeholder. To swap this,
Delete the current one and click in
the middle to insert icon.
Note:
To ensure the image placeholder
retains its size.
Delete the current image then click
in the middle icon to insert picture.
Then right click>send to back
Overview – retail strategy
When you think about great retail in Australia
you include Sydney Airport
• A tailored retail approach that caters to the
changing passenger mix
• A retail offering difficult to replicate at other
Australian airports
• Redefining the product offering to deliver the
best of local and best of global, as well as first to
airport and Australia brands
• Delivering a retail mix that increases passenger
spend and ATV across fashion, food and luxury
• Showcasing dedicated shopping and dining
precincts to enhance the experience across the
airport
• Driving strong pre-engagement with the
passenger on the new retail offer
53
Our vision is to deliver a world-class airport experience
offering customers enhanced choice and value
For
per
sona
l use
onl
y
Icon note:
The icons are currently in an icon
placeholder. To swap this,
Delete the current one and click in
the middle to insert icon.
Retail revenues
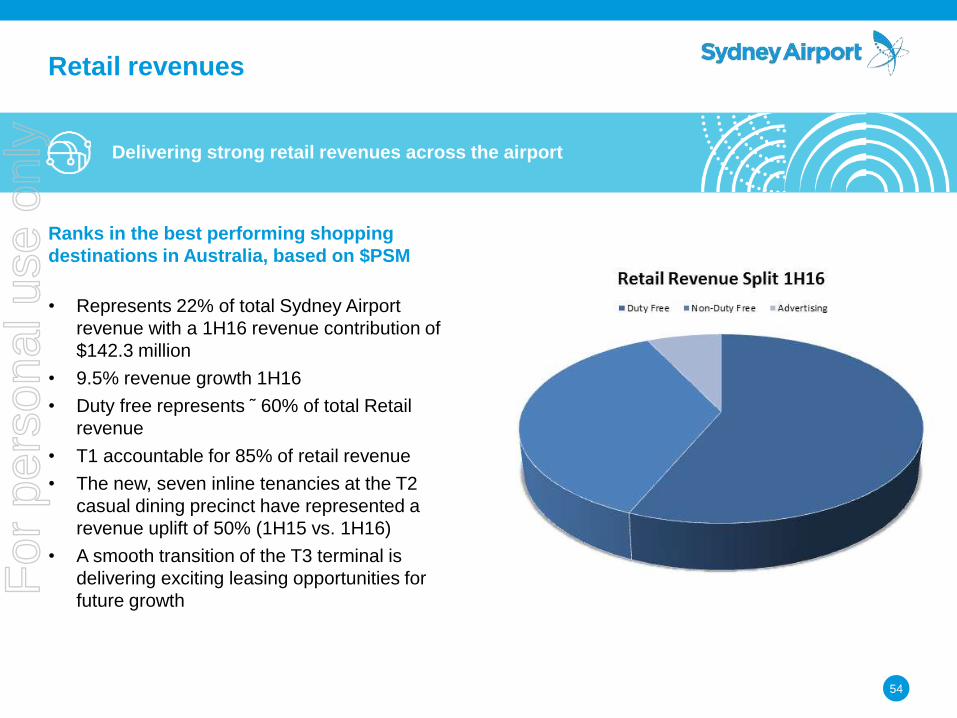
54
Ranks in the best performing shopping
destinations in Australia, based on $PSM
• Represents 22% of total Sydney Airport
revenue with a 1H16 revenue contribution of
$142.3 million
• 9.5% revenue growth 1H16
• Duty free represents ῀ 60% of total Retail
revenue
• T1 accountable for 85% of retail revenue
• The new, seven inline tenancies at the T2
casual dining precinct have represented a
revenue uplift of 50% (1H15 vs. 1H16)
• A smooth transition of the T3 terminal is
delivering exciting leasing opportunities for
future growth
Delivering strong retail revenues across the airport
For
per
sona
l use
onl
y

Icon note:
The icons are currently in an icon
placeholder. To swap this,
Delete the current one and click in
the middle to insert icon.
Note:
To ensure the image placeholder
retains its size.
Delete the current image then click
in the middle icon to insert picture.
Then right click>send to back
Duty free
• Approximately 60% of total retail
• Contract structure includes a high minimum
guarantee, increasing by CPI and passenger
growth
• Remains the highest and best use of retail
space by $/sqm
• Five of the duty free stores have now been
completed with the Mega B store launched in
May 2016
• Reviewing new opportunities to grow turnover
• Enhancing the customer experience through the
integration of technology to deliver a bespoke
web shop
55
A new contemporary duty free offering delivering a
world-class passenger experience
For
per
sona
l use
onl
y
Icon note:
The icons are currently in an icon
placeholder. To swap this,
Delete the current one and click in
the middle to insert icon.
Overview – retail spend
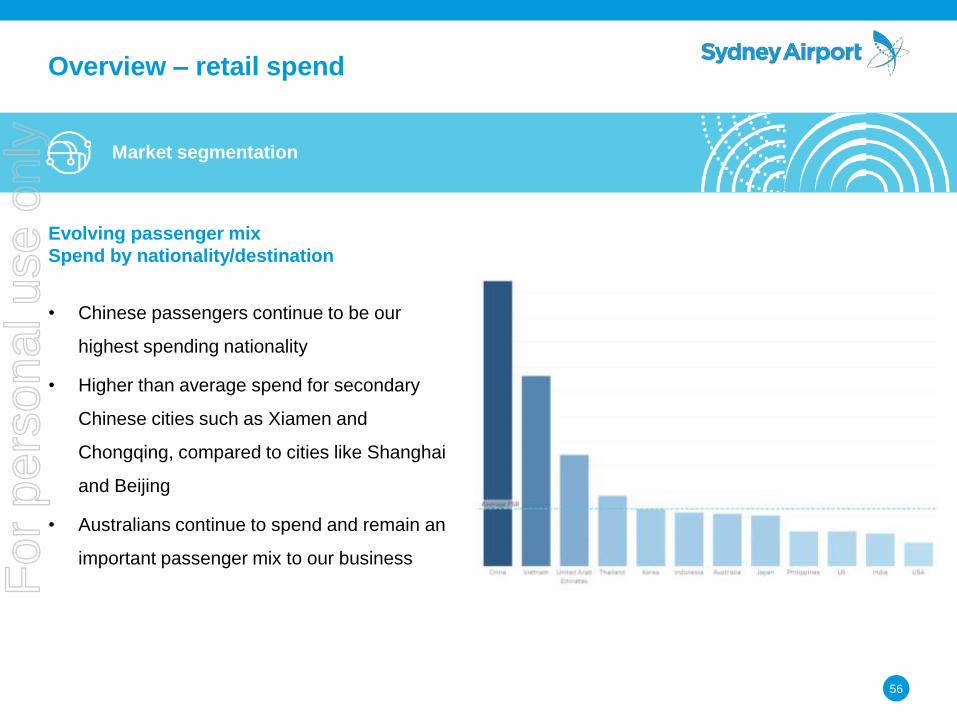
56
Evolving passenger mix
Spend by nationality/destination
• Chinese passengers continue to be our
highest spending nationality
• Higher than average spend for secondary
Chinese cities such as Xiamen and
Chongqing, compared to cities like Shanghai
and Beijing
• Australians continue to spend and remain an
important passenger mix to our business
Market segmentation
For
per
sona
l use
onl
y
Icon note:
The icons are currently in an icon
placeholder. To swap this,
Delete the current one and click in
the middle to insert icon.
Note:
To ensure the image placeholder
retains its size.
Delete the current image then click
in the middle icon to insert picture.
Then right click>send to back
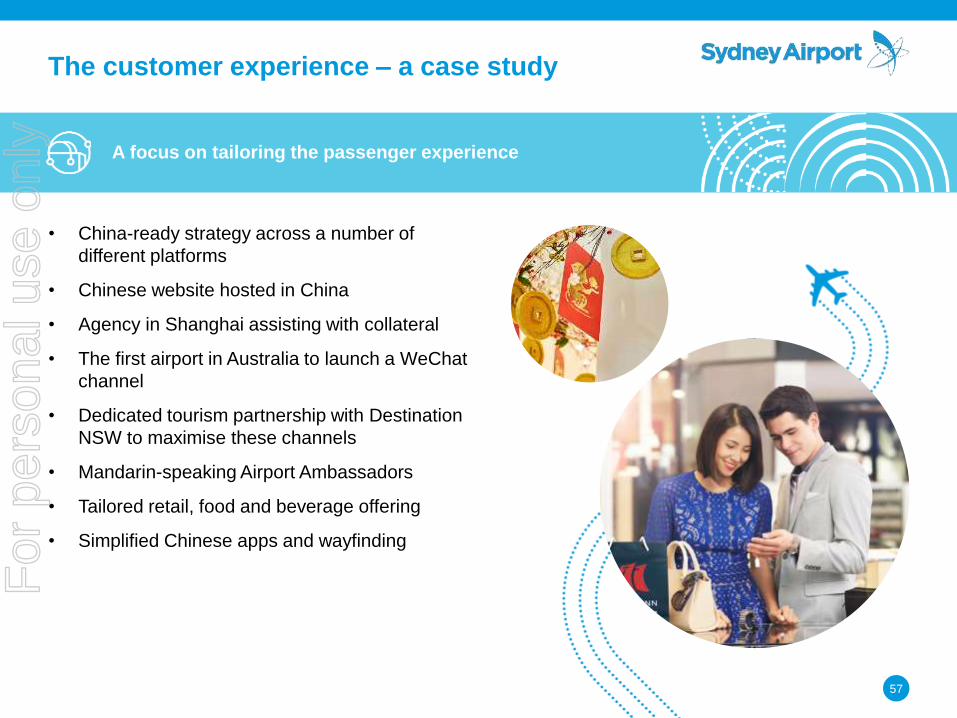
The customer experience – a case study
• China-ready strategy across a number of
different platforms
• Chinese website hosted in China
• Agency in Shanghai assisting with collateral
• The first airport in Australia to launch a WeChat
channel
• Dedicated tourism partnership with Destination
NSW to maximise these channels
• Mandarin-speaking Airport Ambassadors
• Tailored retail, food and beverage offering
• Simplified Chinese apps and wayfinding
57
A focus on tailoring the passenger experience
For
per
sona
l use
onl
y

Icon note:
The icons are currently in an icon
placeholder. To swap this,
Delete the current one and click in
the middle to insert icon.
The customer experience
58
• Consistently communicate with passengers
across owned, earned and bought channels
and drive excitement on the Sydney Airport
offering
• Sydney Airport app for passengers to check
updates and news
• Programmatic media buy for travel intenders,
delivering the right message at the right time
• Exciting, engaging and useful social media
content across a number of channels
• Leveraging user generated content to drive
positive sentiment
Omni-channel approach – pre-journey engagement
For
per
sona
l use
onl
y
Icon note:
The icons are currently in an icon
placeholder. To swap this,
Delete the current one and click in
the middle to insert icon.
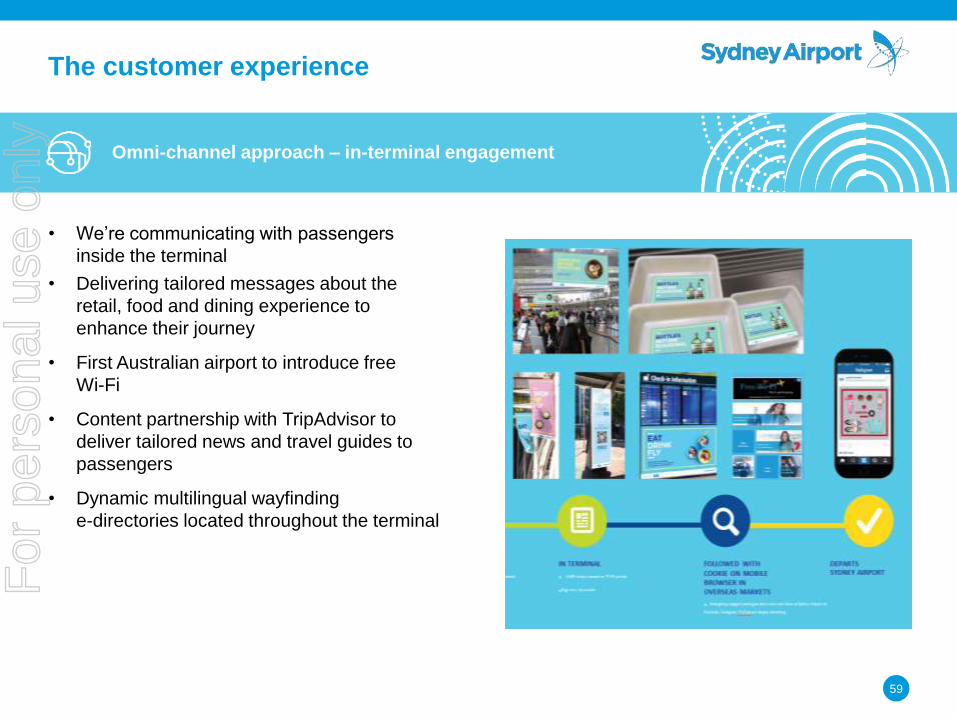
The customer experience
59
• We’re communicating with passengers
inside the terminal
• Delivering tailored messages about the
retail, food and dining experience to
enhance their journey
• First Australian airport to introduce free
Wi-Fi
• Content partnership with TripAdvisor to
deliver tailored news and travel guides to
passengers
• Dynamic multilingual wayfinding
e-directories located throughout the terminal
Omni-channel approach – in-terminal engagement
For
per
sona
l use
onl
y

Icon note:
The icons are currently in an icon
placeholder. To swap this,
Delete the current one and click in
the middle to insert icon.
Note:
To ensure the image placeholder
retains its size.
Delete the current image then click
in the middle icon to insert picture.
Then right click>send to back
The customer experience
• An enhanced food and beverage and speciality
retail offering that caters to a range of tastes and
budgets
• We’re capitalising on the modern traveller’s
propensity for impulse shopping through
innovative and interactive brand spaces
throughout Sydney Airport
• Working with compelling local brands, we’re
delivering powerful pop-ups that surprise and
delight our passengers and complement the
overall retail mix
60
Innovative and unique brands
For
per
sona
l use
onl
y
Icon note:
The icons are currently in an icon
placeholder. To swap this,
Delete the current one and click in
the middle to insert icon.
Note:
To ensure the image placeholder
retains its size.
Delete the current image then click
in the middle icon to insert picture.
Then right click>send to back
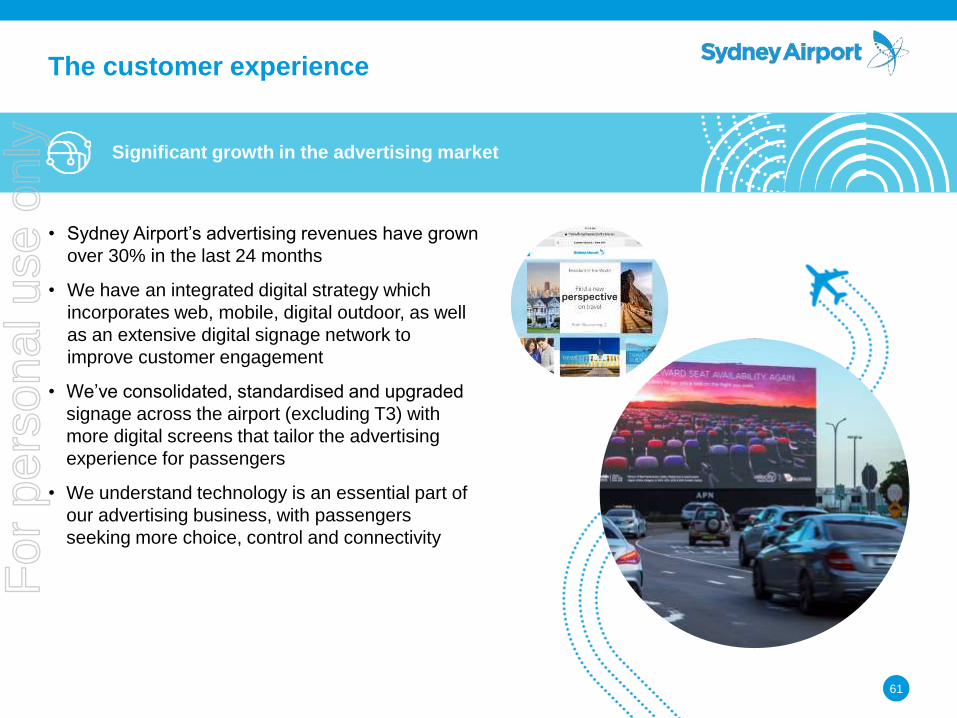
The customer experience
• Sydney Airport’s advertising revenues have grown
over 30% in the last 24 months
• We have an integrated digital strategy which
incorporates web, mobile, digital outdoor, as well
as an extensive digital signage network to
improve customer engagement
• We’ve consolidated, standardised and upgraded
signage across the airport (excluding T3) with
more digital screens that tailor the advertising
experience for passengers
• We understand technology is an essential part of
our advertising business, with passengers
seeking more choice, control and connectivity
61
Significant growth in the advertising market
For
per
sona
l use
onl
y

Note:
To ensure the image placeholder
retains its size.
Delete the current image then click
in the middle icon to insert picture.
Then right click>send to back
T2
For
per
sona
l use
onl
y

Note:
To ensure the image placeholder
retains its size.
Delete the current image then click
in the middle icon to insert picture.
Then right click>send to back
Icon note:
The icons are currently in an icon
placeholder. To swap this,
Delete the current one and click in
the middle to insert icon.
Overview – retail strategy
63
Lorem ipsum dolor sit amet, consectetuer
Lorem ipsum dolor sit amet, consectetuer
Lorem ipsum dolor sit amet, consectetuer
Lorem ipsum dolor sit amet, consectetuer
Lorem ipsum dolor sit amet, consectetuer
Lorem ipsum dolor sit amet, consectetuer
First to Australia and first to Australian airport brands
63
For
per
sona
l use
onl
y

Note:
To ensure the image placeholder
retains its size.
Delete the current image then click
in the middle icon to insert picture.
Then right click>send to back
64
Before
64
For
per
sona
l use
onl
y
Note:
To ensure the image placeholder
retains its size.
Delete the current image then click
in the middle icon to insert picture.
Then right click>send to back
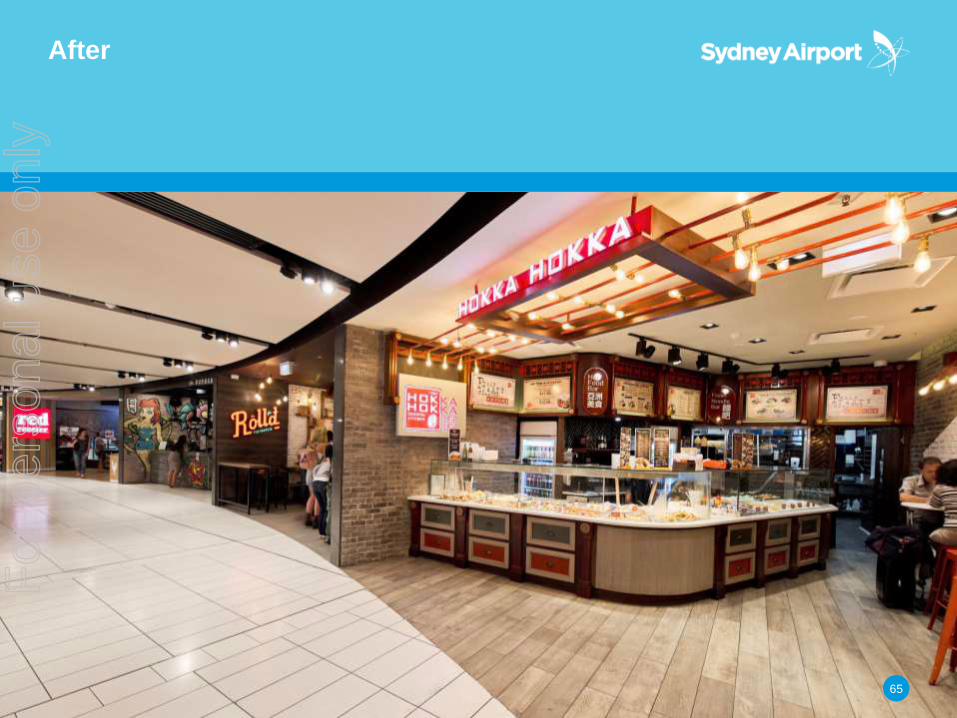
After
65
65
For
per
sona
l use
onl
y
Note:
To ensure the image placeholder
retains its size.
Delete the current image then click
in the middle icon to insert picture.
Then right click>send to back
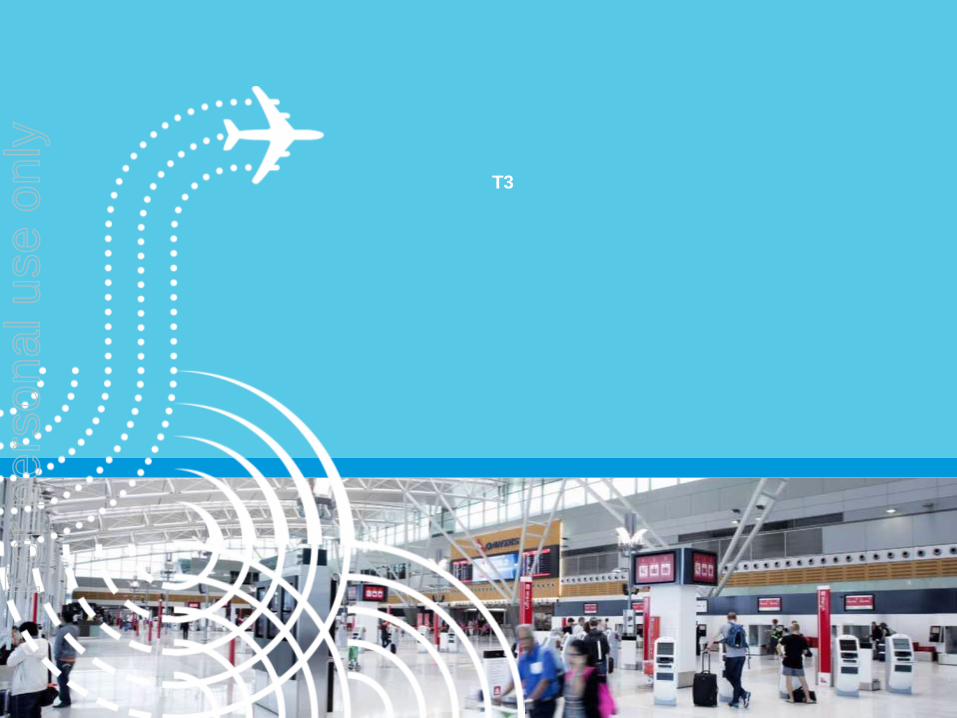
T3
For
per
sona
l use
onl
y
Icon note:
The icons are currently in an icon
placeholder. To swap this,
Delete the current one and click in
the middle to insert icon.
Note:
To ensure the image placeholder
retains its size.
Delete the current image then click
in the middle icon to insert picture.
Then right click>send to back
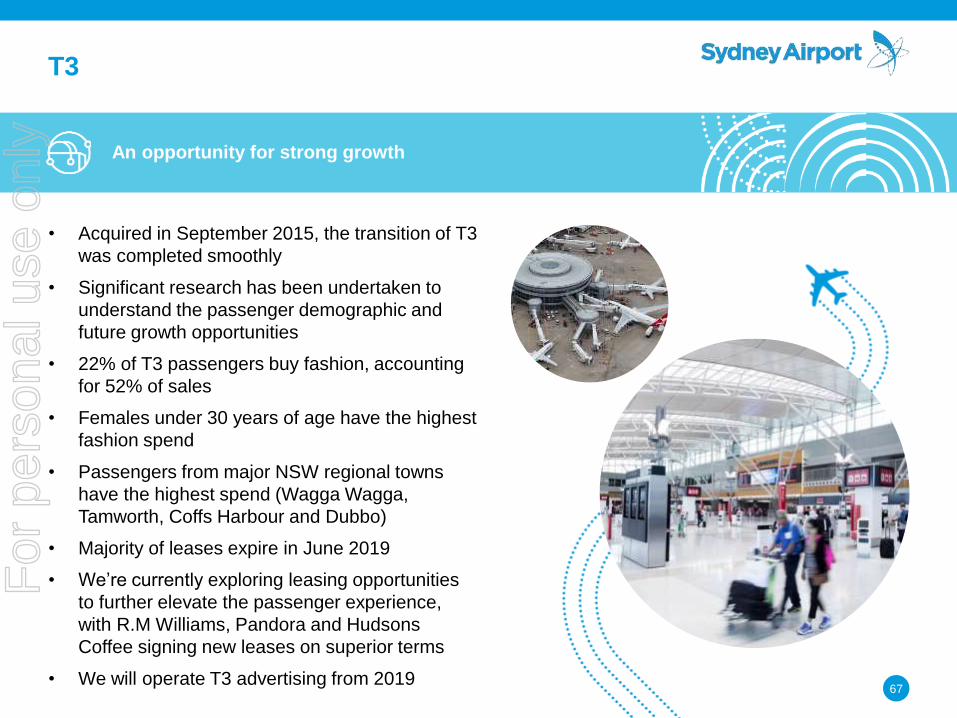
T3
• Acquired in September 2015, the transition of T3
was completed smoothly
• Significant research has been undertaken to
understand the passenger demographic and
future growth opportunities
• 22% of T3 passengers buy fashion, accounting
for 52% of sales
• Females under 30 years of age have the highest
fashion spend
• Passengers from major NSW regional towns
have the highest spend (Wagga Wagga,
Tamworth, Coffs Harbour and Dubbo)
• Majority of leases expire in June 2019
• We’re currently exploring leasing opportunities
to further elevate the passenger experience,
with R.M Williams, Pandora and Hudsons
Coffee signing new leases on superior terms
• We will operate T3 advertising from 2019
67
An opportunity for strong growth
For
per
sona
l use
onl
y

Icon note:
The icons are currently in an icon
placeholder. To swap this,
Delete the current one and click in
the middle to insert icon.
Note:
To ensure the image placeholder
retains its size.
Delete the current image then click
in the middle icon to insert picture.
Then right click>send to back
What’s next for Sydney Airport retail?
• Integrated strategy to continue to drive strong
sales growth
• Continued innovation and evolution of the
product offering, tailored to the changing
passenger demographic
• Delivering value and choice through exciting
new retail opportunities
• Looking to global markets to inform the local
offering, to ensure we continue to stay
on-trend
68
Looking to the future
For
per
sona
l use
onl
y

Note:
To ensure the image placeholder
retains its size.
Delete the current image then click
in the middle icon to insert picture.
Then right click>send to back
STUART RATTRAY GENERAL MANAGER, TECHNOLOGY
INNOVATION DRIVING CUSTOMER SERVICE
IMPROVEMENTS AND AIRPORT EFFICIENCY
For
per
sona
l use
onl
y

Icon note:
The icons are currently in an icon
placeholder. To swap this,
Delete the current one and click in
the middle to insert icon.
Technology innovation Opportunities
Mobile internet Unlimited connectivity everywhere
Operational data on people movements
Finding my way around the airport
Smart notifications, commercial offers & promotions
Big data Greater operational understanding from
pooled data
Predictive analytics & machine learning to power our business
Sharing data with airline stakeholders for common good
Feeding smart terminal design
Proactive operational issue avoidance
Who uses our terminals – optimising use of facilities
Cloud computing Optimising data storage, management and
processing
Resilient systems & applications
Reduced operational cost
Improved recoverability
Sustainable vehicles Smart vehicles, and smart use of vehicles
Electric Buses
Ride Sharing
Self driving vehicles
Biometrics Biological characteristics of a person
Operational data on people movements
SmartGates to drastically reduce processing times
Identify passengers once only
Internet of things Collecting data from networked devices
Facilities which report breakages before they occur
Bathrooms that report when they need cleaning
Lost luggage trolleys that ‘find’ themselves
Technology innovations are providing multiple
opportunities for airports
The potential is to greatly improve operational efficiency and
enhance the passenger experience
70
For
per
sona
l use
onl
y

Icon note:
The icons are currently in an icon
placeholder. To swap this,
Delete the current one and click in
the middle to insert icon.
Area Objective Innovation Benefits
Passenger
Journey
Relax – it just works
Spending time in shops and lounges
vs waiting in queues
Offering an integrated, seamless
passenger experience
Maximise Retail opportunities
Push information and commercial offers to
passengers when it is most useful
Guide passengers throughout their airport
journey via whichever digital medium is
most appropriate to them
Increase opportunities for passenger self
service
Operational
Efficiency
Streamline processes to achieve
better efficiencies
Optimise deployment of scarce and
costly resources
Capture and visualise operational data in
real time
Detect and address issues before they
occur with operational modelling
Minimise over and under servicing –
deploy resources only when needed
All airport stakeholders are introducing digital
tools
The challenge and the opportunity is to co-operate digitally for
the benefit of all stakeholders and for the passenger
71
For
per
sona
l use
onl
y

Icon note:
The icons are currently in an icon
placeholder. To swap this,
Delete the current one and click in
the middle to insert icon.
The end to end digital customer journey
Throughout the passenger journey, digital technologies
improve customer experience and make airport processes
more efficient
Getting to
the airport
Check-in and
baggage
Security and
immigration
Retail
experience Wayfinding
Aircraft
departure
72
For
per
sona
l use
onl
y
Icon note:
The icons are currently in an icon
placeholder. To swap this,
Delete the current one and click in
the middle to insert icon.
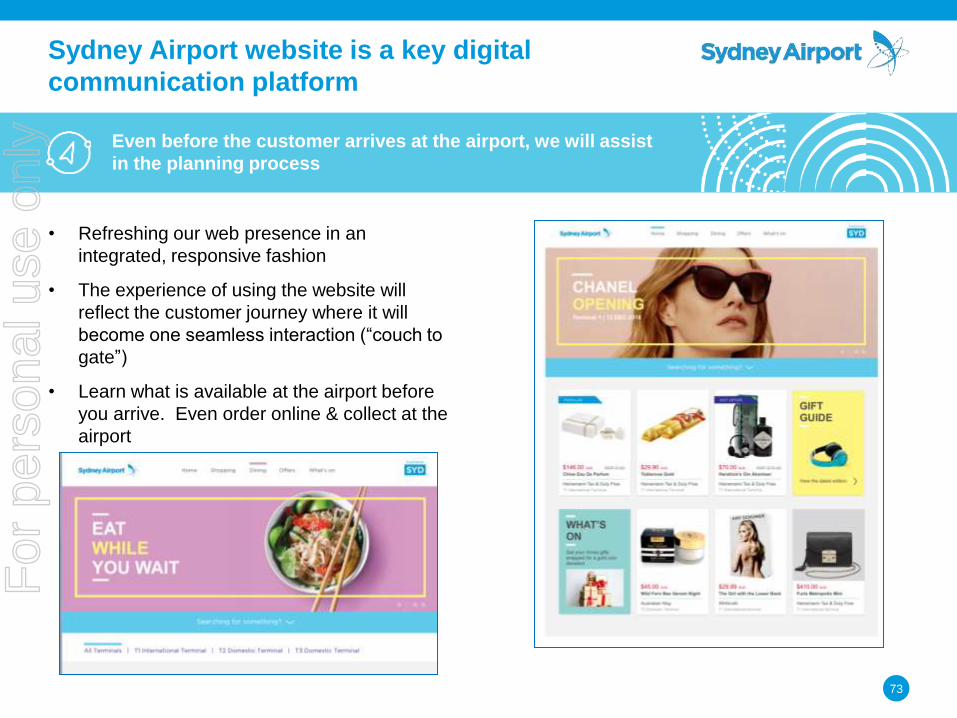
Sydney Airport website is a key digital
communication platform
73
• Refreshing our web presence in an
integrated, responsive fashion
• The experience of using the website will
reflect the customer journey where it will
become one seamless interaction (“couch to
gate”)
• Learn what is available at the airport before
you arrive. Even order online & collect at the
airport
Even before the customer arrives at the airport, we will assist
in the planning process
For
per
sona
l use
onl
y

Icon note:
The icons are currently in an icon
placeholder. To swap this,
Delete the current one and click in
the middle to insert icon.
Helping passengers find their way using a smart
device
74
Airlines are keen to incorporate Sydney Airport wayfinding in
their customer apps
Where in the Airport am I? Food options near my gate
Show me the path
• Customers become more relaxed and informed
• Less operational interventions required
For
per
sona
l use
onl
y

Icon note:
The icons are currently in an icon
placeholder. To swap this,
Delete the current one and click in
the middle to insert icon.
Using predictive analytics, machine learning and
technology to power airport operations
Operational intelligence delivered through alignment of
disparate data sets
75
Information Source
Weather forecast Bureau of
Meteorology
Historical rainfall actual
data
Bureau of
Meteorology
Staff car park volumes Parking system
Ground Handler staff
levels
Ground handler
data feeds
Actual vehicle volumes CCTV Analytics
Forecast vehicle volumes Car parking
bookings
Local precinct traffic data Google API feed For
per
sona
l use
onl
y
Icon note:
The icons are currently in an icon
placeholder. To swap this,
Delete the current one and click in
the middle to insert icon.
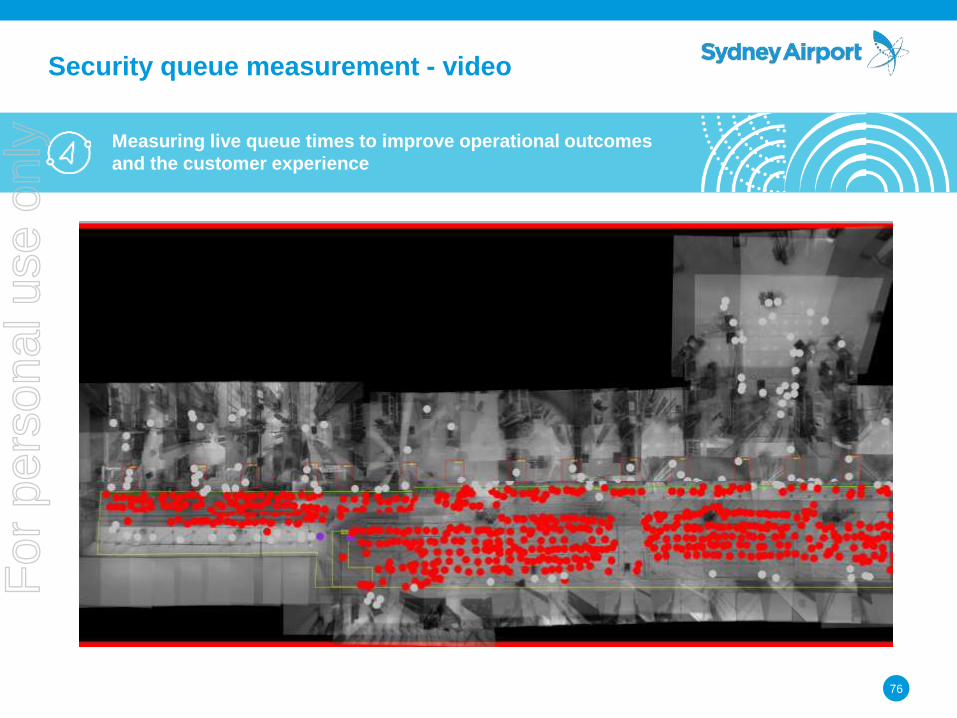
Security queue measurement - video
76
Measuring live queue times to improve operational outcomes
and the customer experience
For
per
sona
l use
onl
y

Icon note:
The icons are currently in an icon
placeholder. To swap this,
Delete the current one and click in
the middle to insert icon.
Security queue measurement – customer view
77
• In peak times, passengers entering security
may be confronted with a considerable
number of people in front of them
• The passenger experience is improved by
showing that the expected queue time is
actually quite short
• Provision of expected queue time in Airline
and third party apps is expected to be an
early candidate for sharing airport data
Information and communication is key to a positive passenger
experience
For
per
sona
l use
onl
y
Icon note:
The icons are currently in an icon
placeholder. To swap this,
Delete the current one and click in
the middle to insert icon.
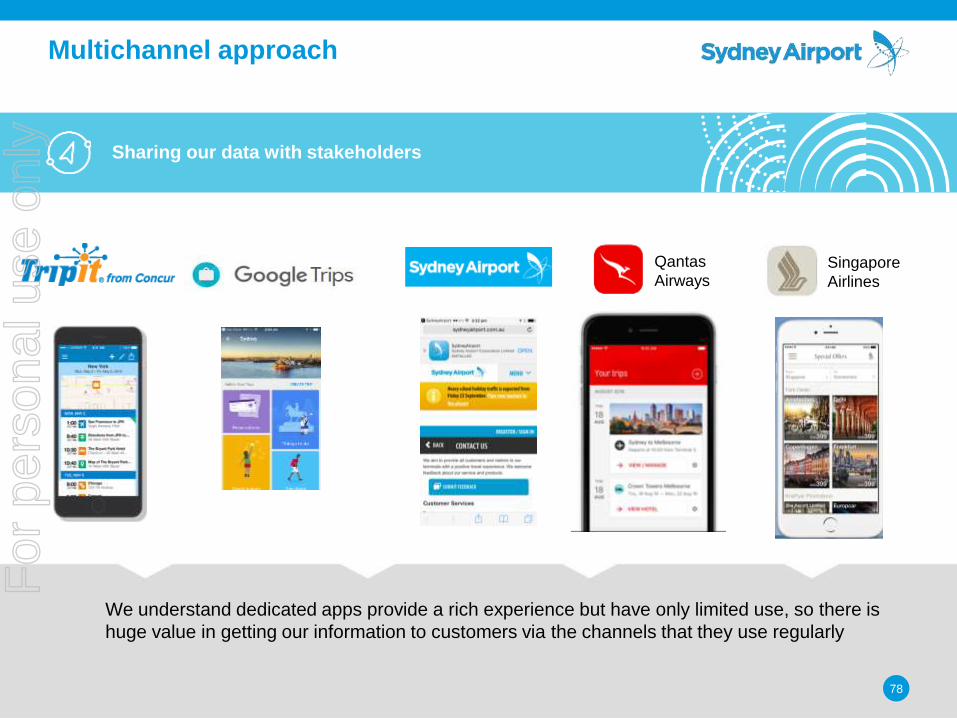
We understand dedicated apps provide a rich experience but have only limited use, so there is
huge value in getting our information to customers via the channels that they use regularly
Multichannel approach
78
Sharing our data with stakeholders
Singapore
Airlines
Qantas
Airways
For
per
sona
l use
onl
y

Icon note:
The icons are currently in an icon
placeholder. To swap this,
Delete the current one and click in
the middle to insert icon.
Interesting and promising future technology
79
Virtual reality and augmented reality
For
per
sona
l use
onl
y

Icon note:
The icons are currently in an icon
placeholder. To swap this,
Delete the current one and click in
the middle to insert icon.
Innovation driving an enhanced passenger experience and
improved airport operational efficiency
Using technology to optimise the value of airport assets
80
For
per
sona
l use
onl
y

Thank you
For
per
sona
l use
onl
y