chap. 9: the human population sect. 1: studying human populations key vocabulary demography &...
TRANSCRIPT
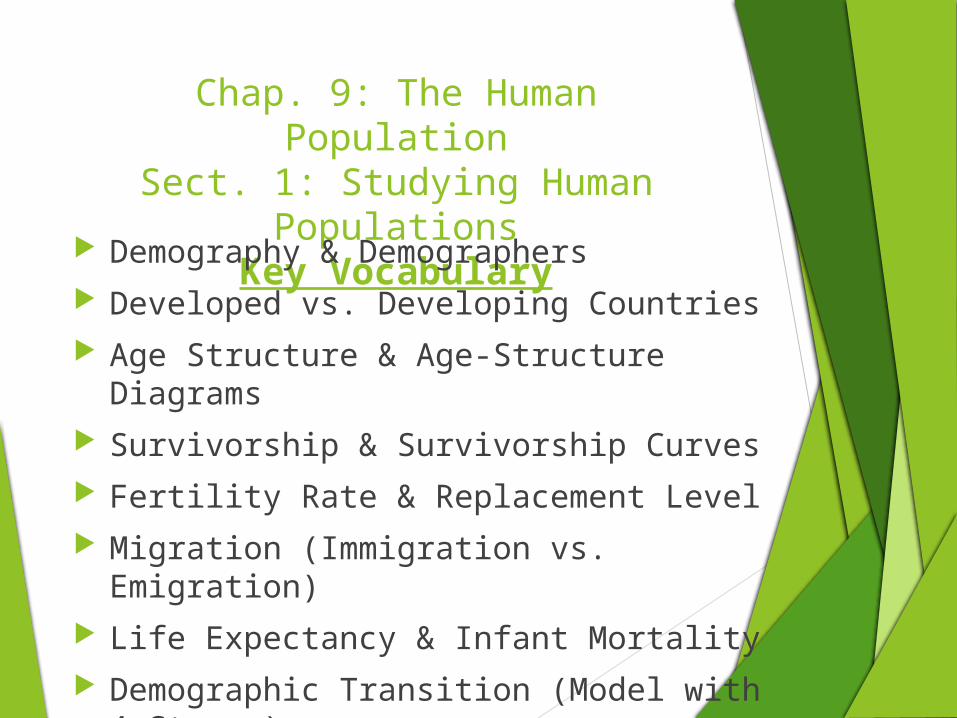
Chap. 9: The Human PopulationSect. 1: Studying Human
PopulationsKey Vocabulary
Demography & Demographers Developed vs. Developing Countries Age Structure & Age-Structure Diagrams Survivorship & Survivorship Curves Fertility Rate & Replacement Level Migration (Immigration vs. Emigration) Life Expectancy & Infant Mortality Demographic Transition (Model with 4
Stages)
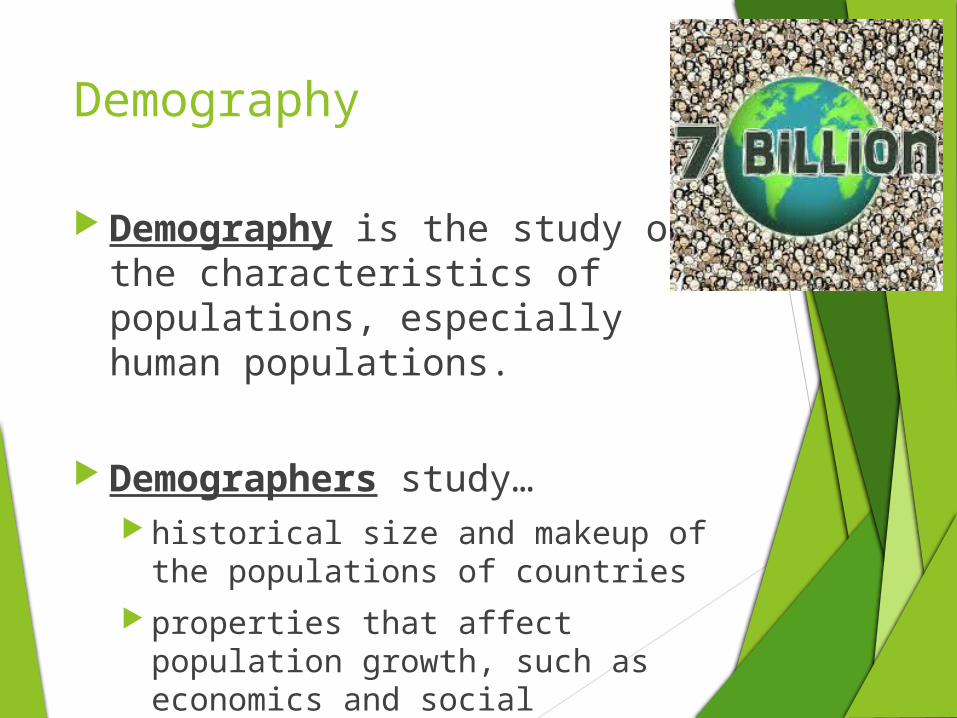
Demography
Demography is the study of the characteristics of populations, especially human populations.
Demographers study… historical size and makeup of the
populations of countries properties that affect population
growth, such as economics and social structure
Developed vs. Developing Countries Developed
countries higher average
incomes
slower population growth
diverse industrial economies
stronger social support systems
Ex: U.S.A., Canada, Japan
Developing countries lower average
incomes
rapid population growth
simple and agriculture-based economics
Ex: Afghanistan, Somalia, India
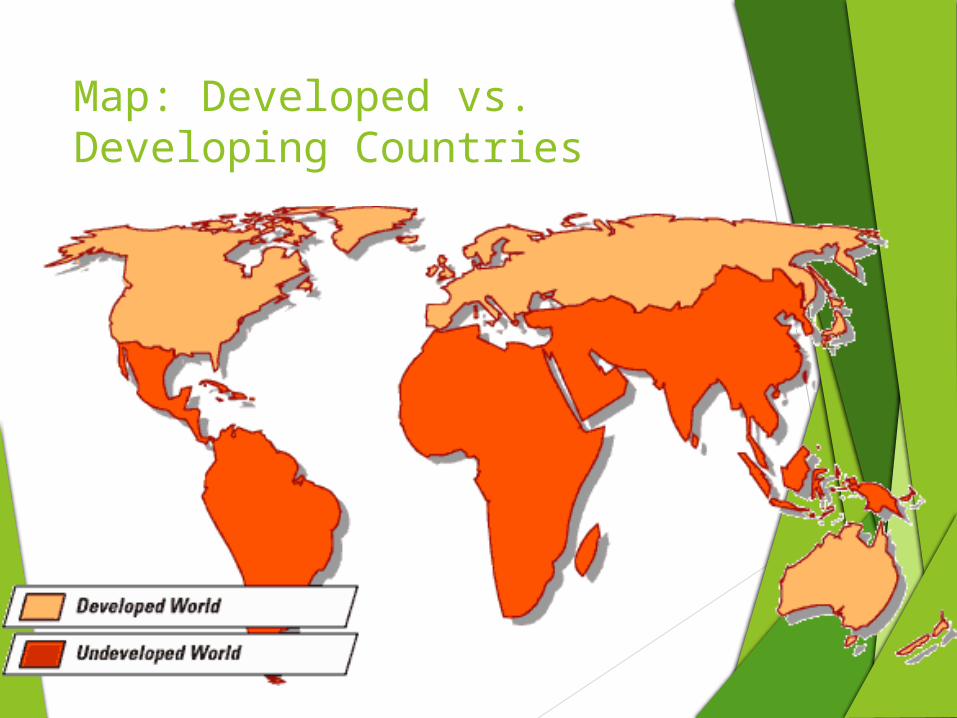
Map: Developed vs. Developing Countries
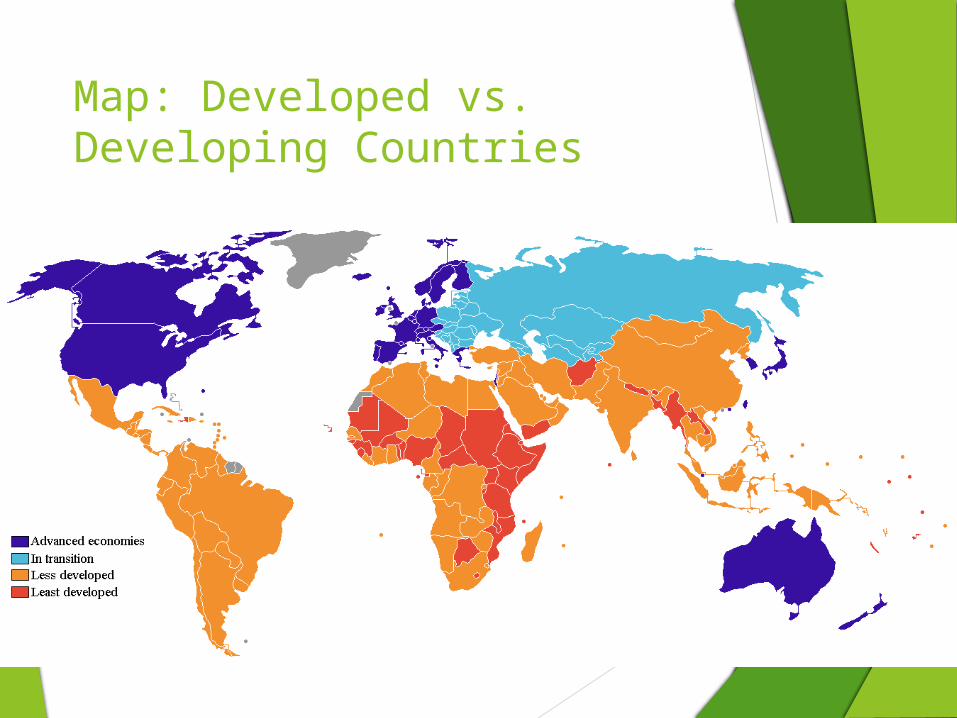
Map: Developed vs. Developing Countries
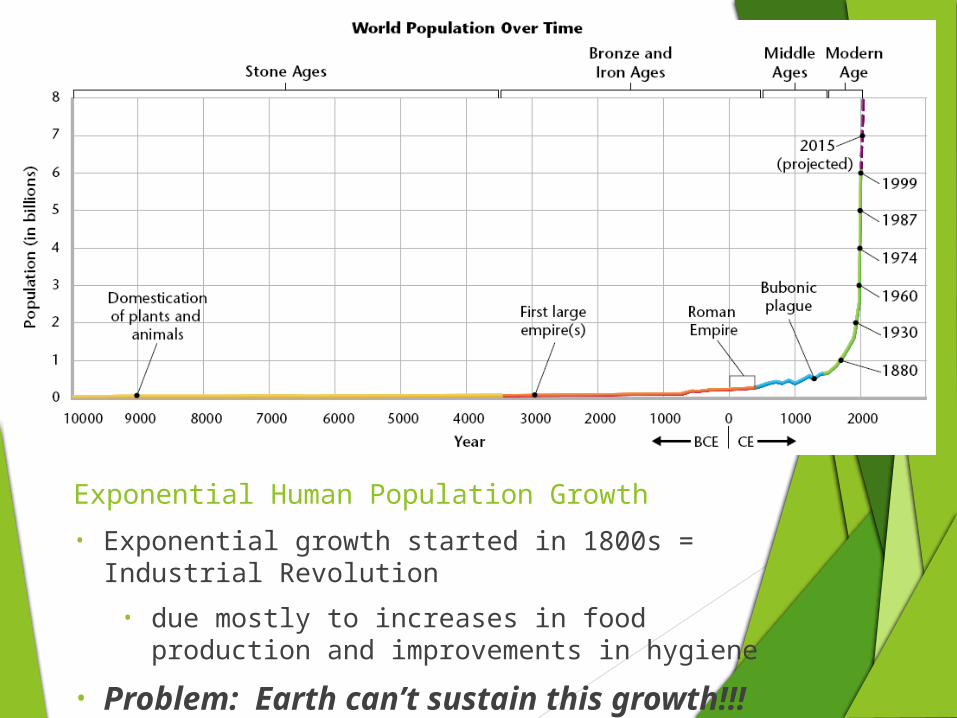
Exponential Human Population Growth• Exponential growth started in 1800s = Industrial
Revolution
• due mostly to increases in food production and improvements in hygiene
• Problem: Earth can’t sustain this growth!!!
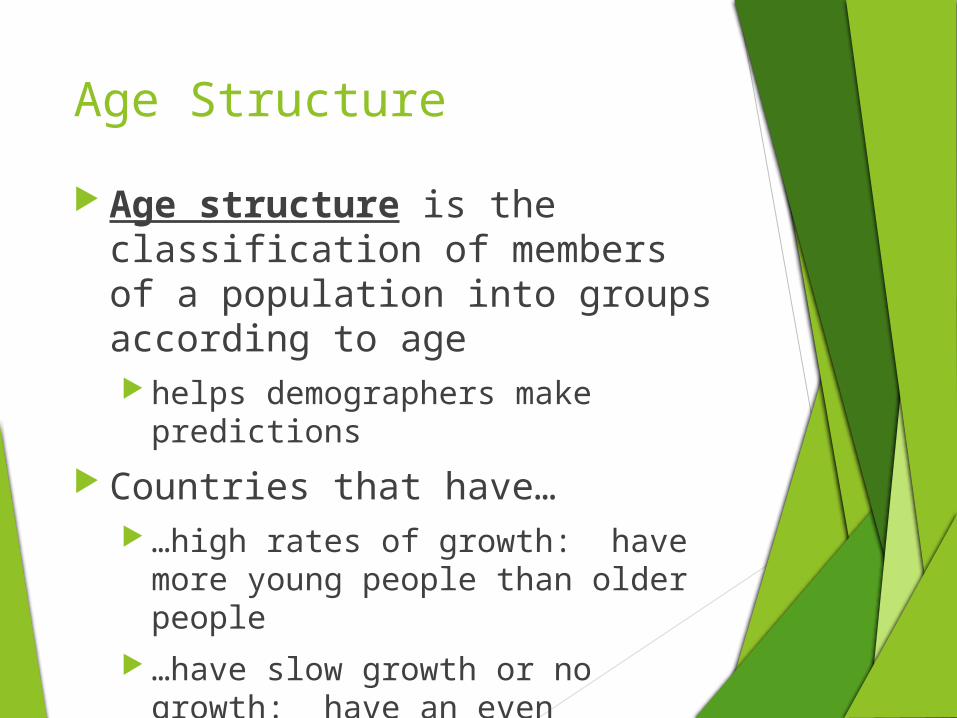
Age Structure
Age structure is the classification of members of a population into groups according to age helps demographers make
predictions
Countries that have… …high rates of growth: have more
young people than older people …have slow growth or no growth:
have an even distribution of ages in the population
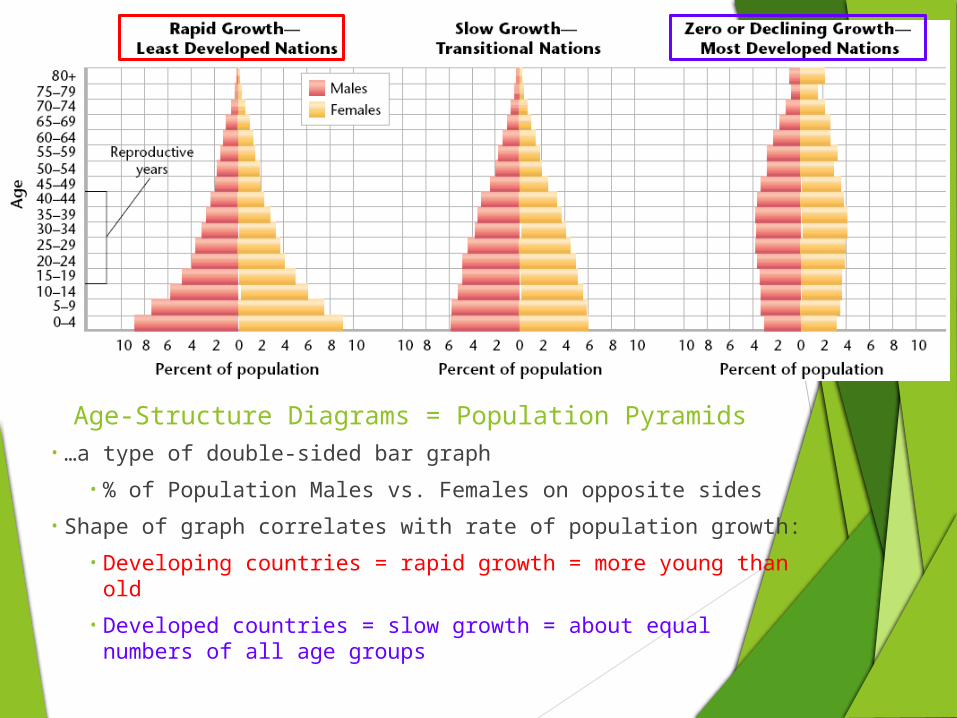
Age-Structure Diagrams = Population Pyramids• …a type of double-sided bar graph
• % of Population Males vs. Females on opposite sides
• Shape of graph correlates with rate of population growth:
• Developing countries = rapid growth = more young than old
• Developed countries = slow growth = about equal numbers of all age groups
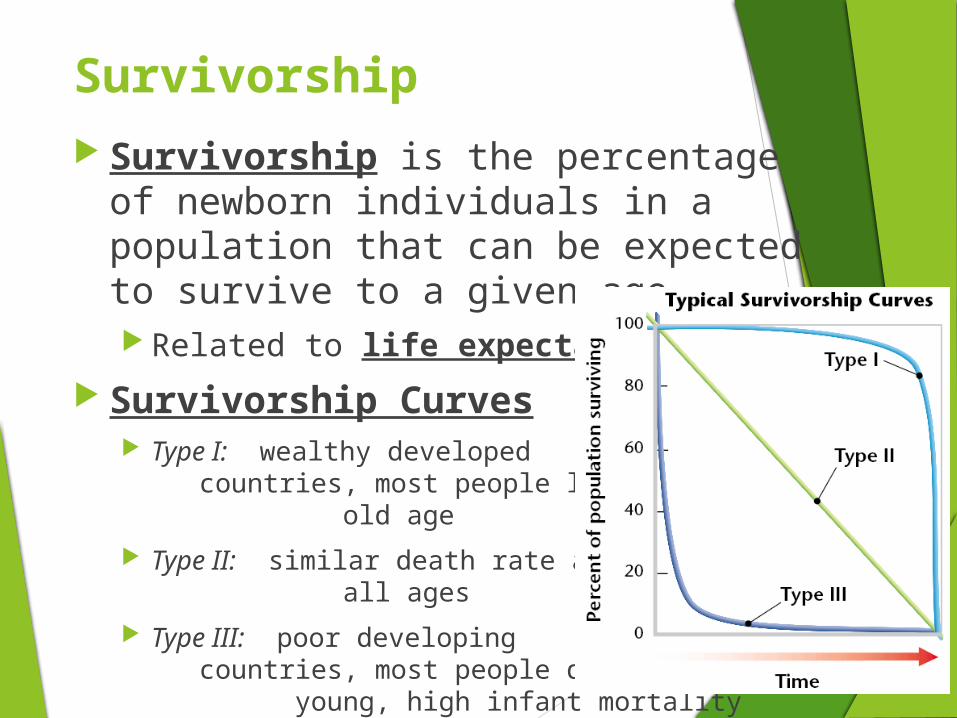
Survivorship Survivorship is the percentage of
newborn individuals in a population that can be expected to survive to a given age. Related to life expectancy
Survivorship Curves Type I: wealthy developed
countries, most people live to old age
Type II: similar death rate atall
ages
Type III: poor developingcountries, most
people die veryyoung, high infant mortality rate
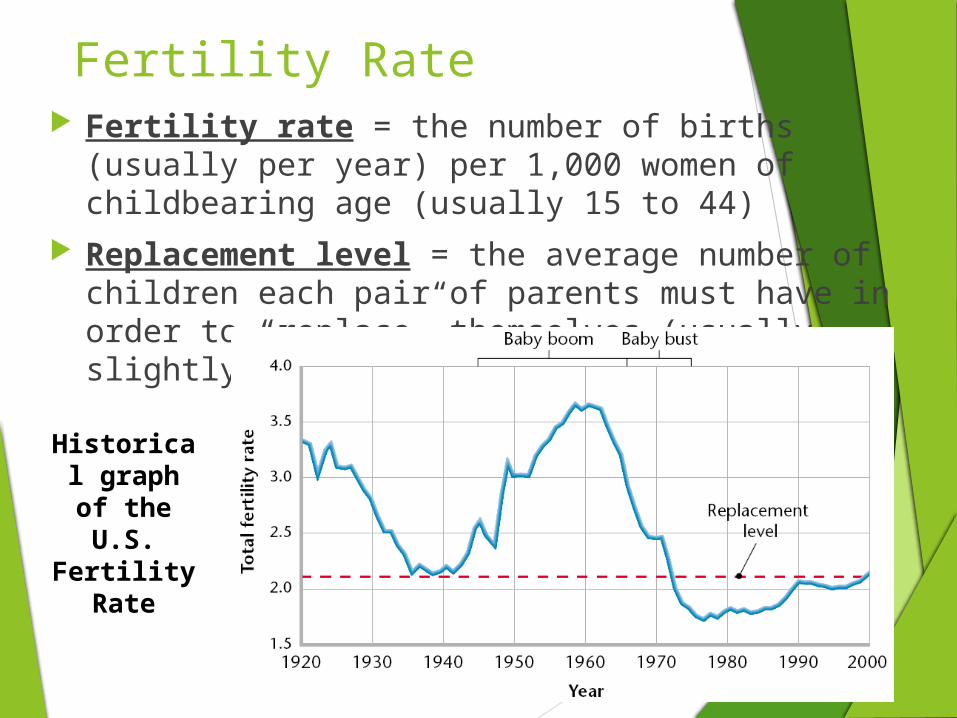
Fertility Rate Fertility rate = the number of births (usually per
year) per 1,000 women of childbearing age (usually 15 to 44)
Replacement level = the average number of children each pair of parents must have in order to “replace” themselves (usually slightly more than 2)
Historical graph of the U.S. Fertility
Rate
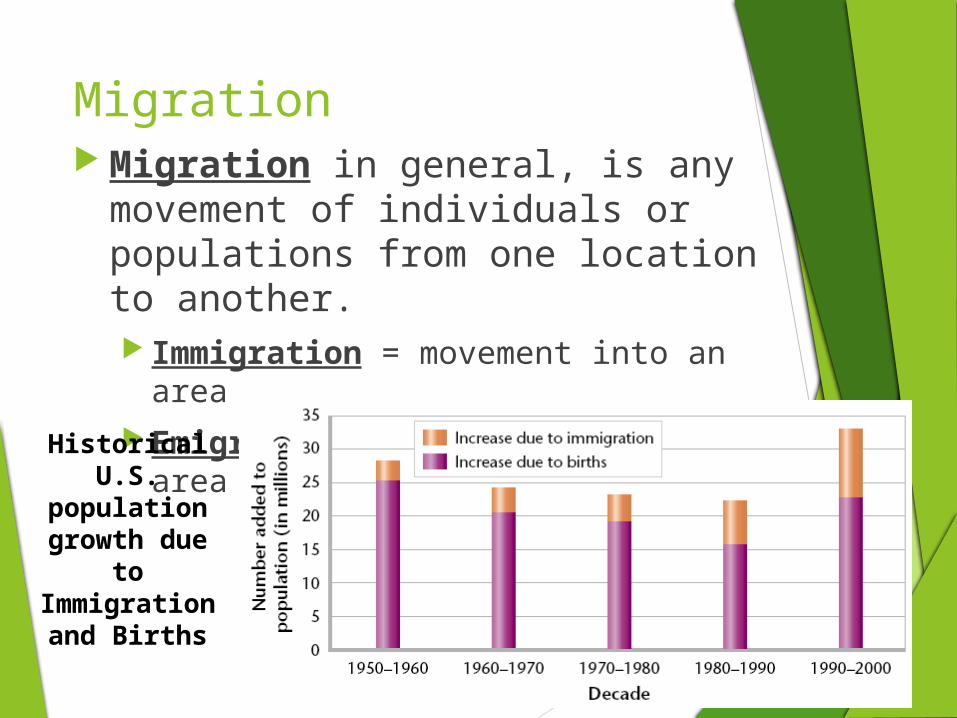
Migration Migration in general, is any
movement of individuals or populations from one location to another. Immigration = movement into an
area Emigration = movement out of an
areaHistorical
U.S. population growth due
to Immigration and Births
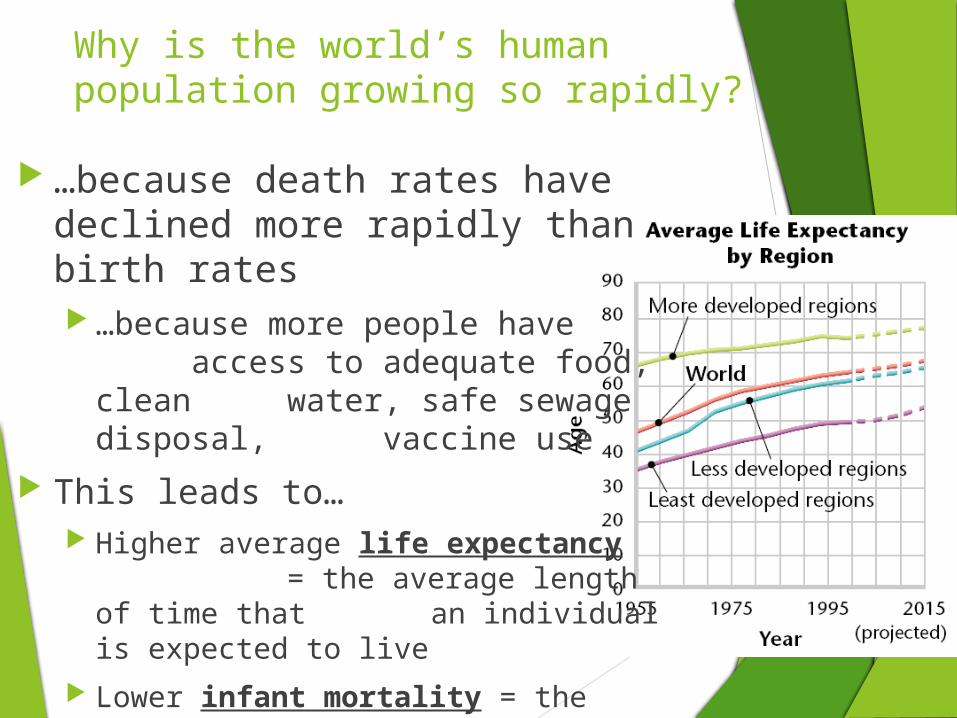
Why is the world’s human population growing so rapidly?
…because death rates have declined more rapidly than birth rates …because more people have
access to adequate food, clean water, safe sewage disposal, vaccine use
This leads to… Higher average life expectancy
= the average length of time that
an individual is expected to live
Lower infant mortality = the deathrate of infants less
than a year old
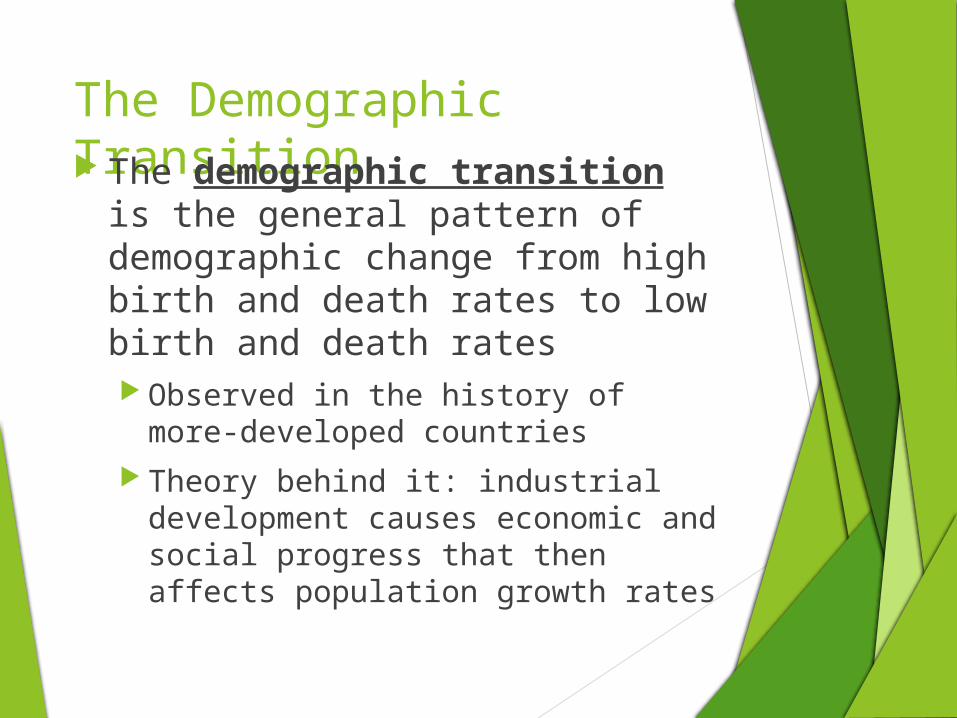
The Demographic Transition The demographic transition
is the general pattern of demographic change from high birth and death rates to low birth and death rates Observed in the history of more-
developed countries Theory behind it: industrial
development causes economic and social progress that then affects population growth rates
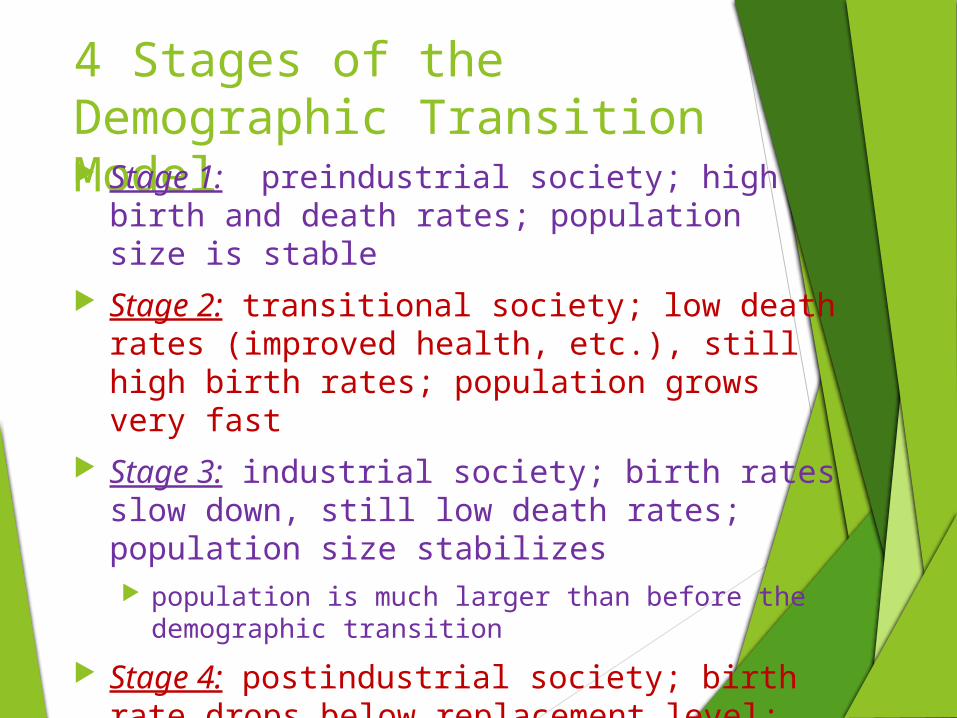
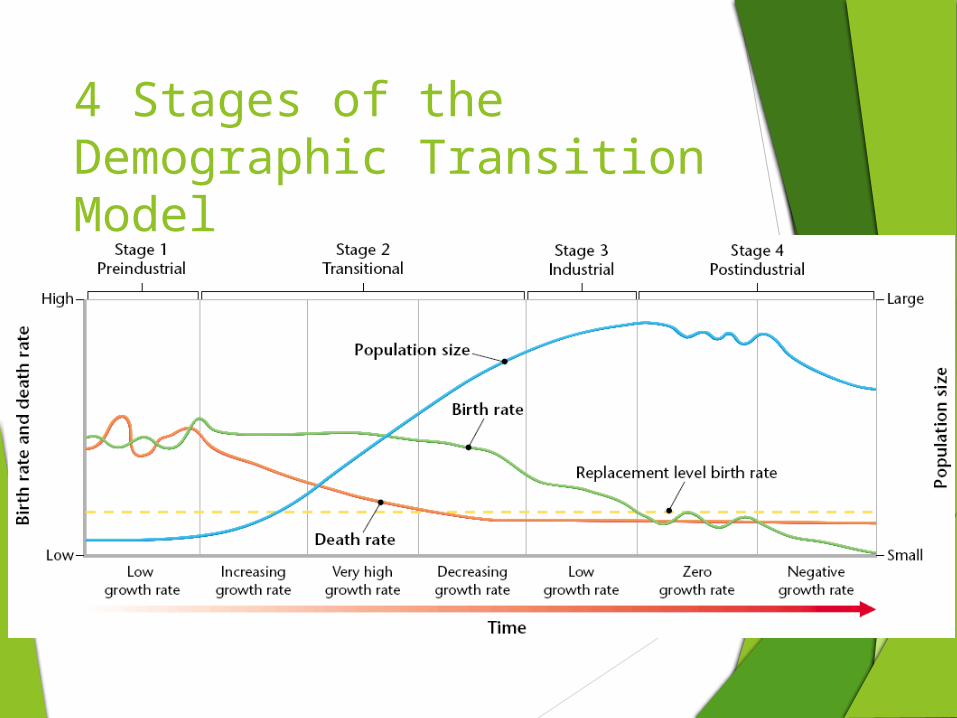
4 Stages of the Demographic Transition Model Stage 1: preindustrial society; high birth and
death rates; population size is stable Stage 2: transitional society; low death rates
(improved health, etc.), still high birth rates; population grows very fast
Stage 3: industrial society; birth rates slow down, still low death rates; population size stabilizes population is much larger than before the
demographic transition
Stage 4: postindustrial society; birth rate drops below replacement level; size of the population begins to decrease Demographic Transition takes 1-3 generations to
occur
4 Stages of the Demographic Transition Model
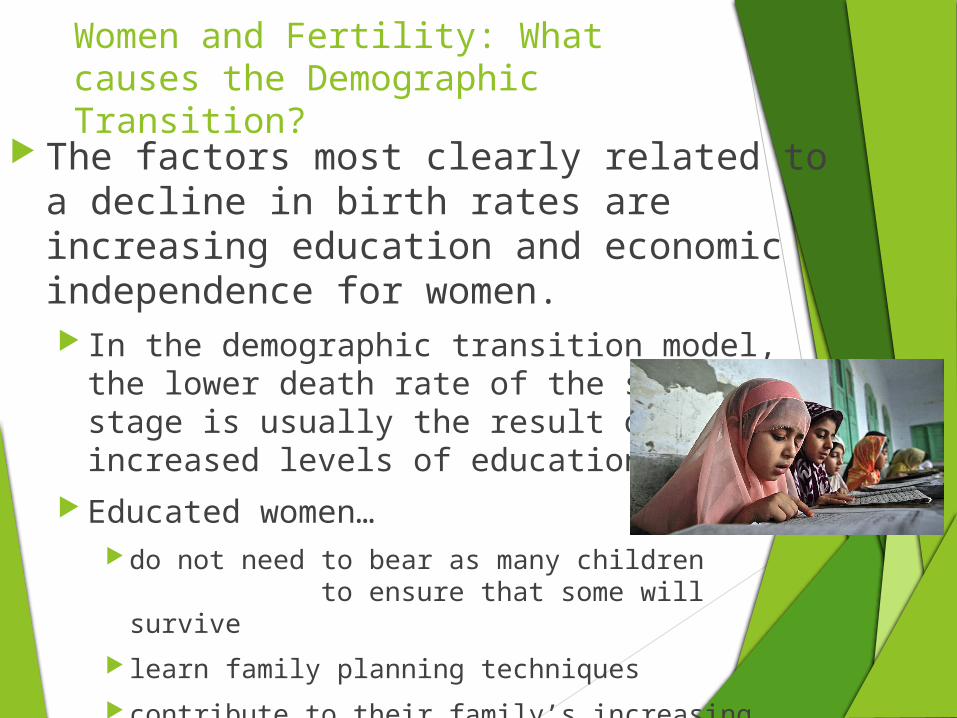
Women and Fertility: What causes the Demographic Transition?
The factors most clearly related to a decline in birth rates are increasing education and economic independence for women. In the demographic transition model, the
lower death rate of the second stage is usually the result of increased levels of education.
Educated women… do not need to bear as many children
to ensure that some will survive
learn family planning techniques
contribute to their family’s increasing prosperity
spend less energy bearing and caring for children