chapter 1 · figure 1.1. index maps and section of kïlauea volcano and its setting on the island...
TRANSCRIPT

Chapter 1 Introduction 3
Introduces Kïlauea Volcano and its history by means of index maps, a summary of previous work, a three-fold classification of eruptions and intrusions, explication of our methodology for presentation of seismic and tilt data, and a discussion of our approach to studying the historical data.
Appendix A at the end of the printed book supplements this chapter. Appendixes B–I are available only in the digital versions of this work—on the DVD accompanying the book and in the online version. Appendixes B–H provide for chapters 2–8 expanded views of time series and map plots of all earthquake swarms listed in event tables. Finally, appendix I outlines the Mogi method for determining inflation and deflation centers and presents many examples of its application.
Chapter 1
Introduction

4 Two Hundred Years of Magma Transport and Storage at Kïlauea Volcano, Hawai‘i, 1790–2008
Our present understanding of Kïlauea Volcano has been largely derived from 100 years of instrumental monitoring and detailed observations conducted at the Hawaiian Volcano Observatory (HVO), presently and through much of its history as part of the U.S. Geological Survey. Descriptions of Kïlauea, however, extend back more than 200 years, beginning with native Hawaiian accounts of the explosive eruption of 1790. One purpose of this paper is to join our modern understanding with these historical descriptions to determine magmatic, tectonic and seismic processes that have acted within Kïlauea subsequent to 1790.
Descriptions dating from the 19th century are qualitative, becoming more quantitative with the founding of HVO in 1912. Before 1912, we know the time and place of most eruptions, times of deflation of Kïlauea’s summit, as evidenced by draining of the active lava lake, and the times of occurrence of large, felt earthquakes, including some earthquake swarms associated with magma withdrawal and intrusion beneath Kïlauea’s rift zones. While recognizing the limitations imposed by the nature of these descriptions, the thesis of this paper is that the volcanic and seismic events, beginning with an explosive eruption in 1790 and ending with the east rift zone and summit eruption continuing today, can be connected by causes and effects inferred at Kïlauea using modern instrumental observations. Our interpretations are in large part original, being a synthesis of information from a range of time periods and not confined to a restatement of already published conclusions. Our interpretations are presented as hypotheses that, while not rigorously testable with additional data, can challenge present and future workers to think more broadly and synoptically about volcanic process at Kïlauea than can be done using only the more quantitative measurements being made today.
Previous Work on Kïlauea Volcano
Our study builds on a body of previously published work. For the period before the founding of HVO in 1912, we rely on original published accounts of volcanic activity compiled and annotated as part of the Hawaiian bibliographic database (Wright and Takahashi, 1998)3. This database includes information found in early newspapers and magazines, as well as references to missionary diaries and other unpublished accounts of volcanic and seismic activity in Hawaiÿi. Early observations of Kïlauea and Mauna Loa were summarized in books by Hitchcock and Brigham (Brigham, 1909; Hitchcock, 1909). Especially important to us in interpreting the volcanic and seismic history are the series of papers by J.D. Dana published in the American Journal of Science (Dana, 1887a; Dana, 1887b; Dana, 1888).
The early work of HVO has been compiled in two publications (Bevens and others, 1988; Fiske and others, 1987). These works were compiled from summaries of volcanic activity issued weekly or monthly between 1912 and 1955. Beginning in 1950 yearly summaries were published covering all activity of the Hawaiian volcanoes (Finch and Macdonald, 1953; Macdonald, 1954; Macdonald, 1955; Macdonald, 1959; Macdonald and Eaton, 1955; Macdonald and Eaton, 1957; Macdonald and Eaton, 1964; Macdonald and Wentworth, 1954). Seismic summaries were published as administrative reports from 1956 to 2006 and later; yearly summaries date from 1974 and deformation summaries were appended for 1988–90. The summaries are available as open-file reports that
can be downloaded from the U.S. Geological Survey publication warehouse at: http://pubs.er.usgs.gov/.
HVO’s monthly or bimonthly unpublished reports summarizing contemporary eruptive and intrusive activity began with a description of the early stages of the 1967–68 summit eruption. The reports have continued to the present and are a valuable unpublished archive of the results of instrumental monitoring and eruption observation, and we have used the monthly reports as an essential resource during preparation of this paper. The citations are formatted as personal communications.
In many instances our observations may include data overlooked in the monthly reports, and our interpretations may differ from those in the monthly reports. In writing about events close in time to the preparation of the report, the HVO staff at any given time (including the authors of this paper) cannot know what lies ahead and therefore necessarily focus on only the most obvious changes in seismic activity and ground deformation. Our synoptic view looks at the same periods of time with the added benefit of being able to interpret the same events within a context that recognizes both what happened after as well as what happened before. In cases where we can identify the differences between our summary and what is published in the monthly reports the differences reflect errors of omission, and our new interpretations build on rather than contradict anything published in the monthly reports.
The history of Kïlauea’s seismic network has been published (Klein and Koyanagi, 1980). Hawaiÿi earthquake data for the period prior to 1959 have been compiled and published by the present authors (Klein and Wright, 2000). Hawaiÿi earthquake data obtained by HVO since 1959 are available from the composite ANSS catalog: http://www.ncedc.org/anss/; http://www.ncedc.org/anss/anss-caveats.html.
3The database is available for download from ftp://ftpext.usgs.gov/pub/wr/=hi/Kïlauea/Hawaiÿibibliography.public. It is updated every four months and may be opened using the EndNote bibliographic database program. Instructions are given in the downloaded ReadMe and info files.

Chapter 1 Introduction 5
Kïlauea’s seismicity and tectonics have been interpreted in two landmark papers (Klein and Koyanagi, 1989; Klein and others, 1987). A recent paper covering the period between the 1967–68 summit eruption and the M7.2 south flank earthquake (Wright and Klein, 2008) introduced the classification of eruptions and intrusions and the methodology of plotting seismic datasets used in the present study. A new methodology for earthquake classification is adopted from a paper covering deep magma transport at Kïlauea (Wright and Klein, 2006).
History of Instrumental Monitoring at Kïlauea
Ground deformation data began to be acquired at Kïlauea in the early twentieth century, with triangulation of the east part of the Island of Hawaiÿi completed in 1914 (Swanson and others, 1976a). In 1912, a Bosch-Omori long-period seismometer that doubled as a tiltmeter was installed in the Whitney Vault on the northeast rim of Kïlauea Caldera (Mitchell, 1930; Powers, 1946). The great subsidence of Kïlauea Caldera in 1924 produced large ground motions and proved the utility of both tilt and triangulation to monitor such changes (Powers, 1946; Wilson, 1935).
In the modern era, surface deformation measurements are critical to our understanding of Kïlauea’s magmatic plumbing. Measurement of vertical uplift or subsidence, horizontal extension or contraction, and outward- or inward-directed ground tilt made during cycles of inflation and deflation define the depth(s) and location(s) of magma storage beneath Kïlauea’s summit. The same measurements can be used to infer whether Kïlauea’s magmatic system has changed over time. Finally, we use
deformation data to quantify rates of magma supply and seaward spreading.
Seismology in Hawai‘i began with installation of a seismometer at Honolulu in 1903 (Klein and Wright, 2000), followed within a decade by installation of a single seismometer of Bosch-Omori design housed in the Whitney Vault (Wood, 1912) coincident with the founding of HVO (Jaggar, 1912). Up until the mid-1950s the HVO network consisted of no more than five seismometers on the island, only three of which—Whitney Vault, Hilo, and Mauna Loa—were close enough to be useful in estimating locations of Kïlauea earthquakes. Earthquake locations and magnitudes were recorded in publications listed under “Previous work.”
A modern seismic network was established at Kïlauea in the mid-1950s (Eaton, 1986a; Eaton, 1986b; Klein and Koyanagi, 1980) Over the following decades the seismic network was expanded (Klein and Koyanagi, 1980). In the early 1960s, smoked paper recording of a handful of stations connected to the observatory by overland cable was the standard. In 1967, the expanding network with radio telemetry recorded data on 16-mm film with a Develocorder. In 1979, an Eclipse mini-computer capable of digitizing the 1-inch analog magnetic tape used to record most of the 44-station network was introduced. This was the time when picking seismic traces on a computer screen improved the earthquake location quality. The Caltech-USGS Seismic Processing (CUSP) real-time digitizing and timing system came online in 1985, and the Earthworm system replaced CUSP in the mid 2000s for greater catalog completeness and precision compared to the predigital years. Maps of the current seismic network are given in numerous recent papers (for example, Got and others, 2008).
A modern geodetic network was established in the late 1950s (Eaton, 1986a; Eaton, 1986b). A
network of water-tube tiltmeters was installed to record ground deformation (Eaton, 1959), including one short-base water-tube tiltmeter installed in the Uwëkahuna Vault on the northwest rim of Kïlauea Caldera that was read daily beginning in 1956. A similar tiltmeter was installed in the Whitney Vault, where it was shown to satisfactorily track both the daily tilt read from the Bosch-Omori seismometer for the five years preceding abandonment of the Whitney Vault in 1962 as well as the daily tilt read from an identical tiltmeter installed in Uwëkahuna Vault (Eaton, 1986a, p. 13–14). This 5-year period of redundancy is important, because it allows us to more confidently interpret the nearly 40 years of seismometric tilt measured when the Whitney Vault was the only installation (see discussion of data reduction in appendix A).
The geodetic network was also steadily expanded after the 1950s (Decker and others, 2008). Vertical (leveling networks) and horizontal electronic distance measurements (EDM) were made periodically to augment the tilt measurements. From the mid-1950s, it has been possible to specify rather closely the seismic and geodetic response of Kïlauea across cycles of eruptions, intrusions, and large earthquakes. An important limitation of the earlier deformation studies was the lack of continuous measurement. Precise data could be gathered soon after an important eruption or earthquake, but one had to be lucky to make measurements just before such an event. Global Positioning System (GPS) geodesy, which measures both vertical and horizontal changes, was begun in the late 1980’s (Decker and others, 2008; Dvorak and others, 1989). When continuously recording GPS networks were installed in the 1990s (Decker and others, 2008) it was possible for the first time to view correlated seismic and geodetic activity through an entire eruption or earthquake cycle.

6 Two Hundred Years of Magma Transport and Storage at Kïlauea Volcano, Hawai‘i, 1790–2008
Figure 1.1. Index maps and section of Kïlauea Volcano and its setting on the Island of Hawai‘i. A, Shaded relief map of Kïlauea and part of Mauna Loa (adapted from Moore and Mark, 1992) showing tectonic features of Kïlauea Volcano and names of features mentioned in the text. Rift zones (red) marked by open fractures, cinder cones, and pit craters extend to the east and southwest. The east rift has been far more active than the southwest rift within historical time. The seismic southwest rift zone (seismic SWRZ) is the locus of intrusions and is a mirror image of the active east rift zone. The Koa‘e Fault Zone (orange) is a zone of tensional faulting connecting the active rift zones. The small double arrow shows dilation within the Koa‘e. Kïlauea’s flank, south of the Koa‘e and the two rift zones, is spreading seaward (single arrows) under the pressure of continuing magma supply aided by gravity. Movement occurs principally along the decollement at 12-km depth (see part D). The south flank’s Hilina Pali fault system consists of normal faults formed as a gravitational response to spreading. B, Shaded relief map showing onshore terrain, with added submarine features mentioned in the text. Notable among these is the Päpa‘u Seamount and the Hilina slump, an older submarine landslide from Kïlauea. Within the slump are a midslope bench and an outer bench, the latter acting as a barrier to south flank spreading. C, Shaded relief map (taken from Eakins and others, 2003) with additional colored bathymetry and tectonic features near the distal ends of Kïlauea Volcano. Hawai‘i’s newest volcano, Lö‘ihi submarine volcano, is also shown. D, Oblique cut-away view of the Kïlauea plumbing system (adapted from Tilling and others, 1987). A near-horizontal landward-dipping basal decollement is the principal surface along which seaward spreading occurs away from the Mauna Loa buttress. Spreading is associated with dilation of the two rift zones creating room to house a deep magma system within the Kïlauea edifice. Magma is supplied from the mantle at depths greater than 60 km through a subhorizontal deep seismic zone at depths of about 25–35 km connected to a vertical conduit extending to 20 km beneath Kïlauea’s summit to feed a magma chamber at 2–6 km depth that contains a liquid core.
A Tectonic Context for Interpreting Ground Deformation and Seismicity
Figure 1.1 summarizes the elements important to an understanding of the evolution of Kïlauea. In plan view Kïlauea is built on the south flank of Mauna Loa (fig. 1.1A), and its history is therefore intimately tied to the presence and activity of Mauna Loa. Additional tectonic features found offshore (fig. 1.1B) are two parts of a raised platform (“midslope and outer benches”) associated with an early landslide called the Hilina slump (Lipman and others, 2001; Morgan and others, 2003) and a linear topographic feature called the Päpa‘u Seamount. Recent bathymetry around the Island of Hawai‘i shows additional offshore features (fig. 1.1C), including the continuation of Kïlauea’s east rift zone, which extends more than 50 km beyond the shoreline, and Hawai‘i’s newest active volcano, “Lö‘ihi Seamount.” Kïlauea’s long east rift zone contrasts with the much less active southwest rift zone, which extends less than 1 km beyond the shoreline. Mauna Loa, in contrast, has a stunted northeast rift zone, its active part extending only about 10 km from the summit, and a southwest rift zone that extends for about 40 km beyond the shoreline.
Important tectonic elements of Kïlauea are (1) its summit caldera containing a nested pit crater, Halema‘uma‘u, (2) rift zones extending to the east and southwest connected by the Koa‘e Fault Zone, (3) an immobile north flank buttressed by Mauna Loa, and (4) a mobile south flank, described in the next section, extending seaward of the Koa‘e Fault Zone and rift zones. The traditionally defined southwest rift zone (SWR) is defined by eruption centers, pit craters, and open cracks that represent eruptive activity over
the last hundreds or thousands of years. An additional important tectonic element is the “seismic southwest rift zone” (SSWR), which geographically forms a mirror image of the east rift zone. The SSWR is defined by earthquake swarms that trace the path of numerous recent intrusions on the southwest side of the volcano (Klein and others, 1987; Wright and Klein, 2006), and extends south from Kïlauea Caldera, then trends southwest to join the traditional southwest rift zone in the vicinity of the Kamakai‘a Hills (fig. 1.1A).
In an oblique cutaway view (fig. 1.1D, modified many times from plate 1 of Ryan, 1988) we show a shallow magma reservoir beneath Kïlauea’s summit, a magma conduit connecting the site of magma generation within the Hawaiian mantle source region to the shallow magma chamber, a subhorizontal decollement (see, for comparison, Ando, 1979) at the base of the volcanic pile (10–12 km depth) along which the mobile south flank is spreading seaward, and a magma system that extends beneath the rift zones to the decollement (Delaney and others, 1990). Recent offshore geophysical studies have shown that the distal portion of the midslope bench (“outer bench” in fig. 1.1C) acts as a barrier to free movement of Kïlauea’s south flank (Morgan and others, 2000, 2003; Phillips and others, 2008).
Kïlauea’s shallow magma reservoir is located at the point where the density of the rising magma matches the density of the surrounding rocks (Ryan, 1987). Both seismic and deformation studies infer a magma storage zone 2–6 km beneath Kïlauea’s summit with a diameter of about 2–4 km (Koyanagi and others, 1974; Tilling and Dvorak, 1993). More recent work has demonstrated the existence of magma pockets at depths of less than 1 km as part of the feeding system for the east rift eruption that began in 1983 (Almendros and others, 2002a).

Chapter 1 Introduction 7
Koa‘e Fault Zone
Southwest seismic SWRZ
East rift zone
KïlaueaCaldera
Hilina Pali
rift zo
ne
Mauna Loa
South
Flank
19.409° N
155.285° W
Kïlauea Iki
Pauahi Crater
Makaopuhi Crater
Näpau Crater
Kalalua
Heiheiahulu
Pu‘u Kaliu
KapohoCrater
Pu‘u ‘Ö‘ö (not shown)Pu‘u Kamoamoa
Mauna UluMauna Iki
Great Crack
Kamakai‘a Hills
Pu‘ukou
Keanakäko‘i CraterPuhima‘u Crater
Hiiaka Crater
Halema‘uma‘u
0 105 KILOMETERS
0 5 MILES
P a c i f i c O c e a n
A

8 Two Hundred Years of Magma Transport and Storage at Kïlauea Volcano, Hawai‘i, 1790–2008
Koa‘e Fault Zone Southwes
t rift z
one
seismic SWRZEast rift zone
Kïlauea Caldera
Halema‘uma‘u
Hilina Pali
Mauna Loa
Päpa‘uSeamount
Hilina Slump
South
Flank
Midslope bench
Outer bench
19.409° N
155.285° W
0 105 KILOMETERS
0 5 MILES
P a c i f i c O c e a n
B
Figure 1.1.—Continued

Chapter 1 Introduction 9
KïlaueaMauna Loa
Mauna Kea
Hilo
Lö‘ihisubmarine volcano
Päpa‘uSeamount
Hilina Slump
Puna Ridge
Punalu‘u Slump
Midslope bench
Outer bench
East rift zone
Sout
hwes
t rift zo
ne
Upper slope
Toe
Landslide
blocks
C
19.409° N
155.285° W
0 2010 KILOMETERS
0 10MILES
P a c i f i c O c e a n
Figure 1.1.—Continued

10 Two Hundred Years of Magma Transport and Storage at Kïlauea Volcano, Hawai‘i, 1790–2008
10
20
5
0
MaunaUluKïlauea
Caldera
30
40
E a s t r i f t z o n e
Sout hw e st r i f t zone
Pu‘u‘Ö‘ö
Heiheiahulu Pu‘u KaliuNäpauCrater Iilewa Crater
Kapoho Crater
Summit magmareservoir withliquid core
Intrusion loci
Deep magma systemthat drives spreading
Basal decollement (fault)under south flank alongwhich spreading occurs
Deep seismic zone
D
Depth, in km
Figure 1.1.—Continued

Chapter 1 Introduction 11
Active Seaward Spreading of Kïlauea’s South Flank
Seaward spreading of Kïlauea’s south flank was recognized in the early 1970s with data obtained from an expanded geodetic monitoring network (Swanson and others, 1976a). A surface along which spreading took place was located at the base of the Kïlauea edifice from analysis of the focal mechanism of the M7.2 south flank earthquake that occurred on November 29, 1975 (Ando, 1979). Subsequent studies have further quantified spreading rates and give support to the idea originally expressed by Swanson and others (1976a) that spreading was distributed among several subhorizontal planes over a depth range of several kilometers (see, for example, Arnadottir and others, 1991; Morgan and McGovern, 2005b; Morgan and others, 2003). Theoretical models of volcano spreading have also been applied to Hawai‘i (Borgia, 1994; Borgia and Treves, 1992). We address whether seaward-directed south flank spreading has occurred throughout Kïlauea’s history and, during the time period(s) during which spreading has occurred, we attempt to quantify the spreading rate.
Gravity
A regional gravity study (fig. 1.2A; Kauahikaua, 1993, figure 1.3) depicts a Bouguer gravity high centered on Kïlauea’s Caldera, indicating that Kïlauea’s summit magma system has remained in place over the lifetime of the volcano (Kauahikaua and others, 2000). Linear highs on the Bouguer gravity map extend to the east and southwest. To the east, there are gravity lobes both for the present and for a “fossil” rift to the north (Swanson and others, 1976a). The dominant eastern gravity lobe is curved near Kïlauea’s summit,
becoming straight east of the bend in the east rift zone. It lies north of the east rift zone (fig. 1.2A), merging with the rift zone within a few kilometers of where the rift zone disappears offshore. The curvature of Kïlauea’s east rift zone, as well as the distance between the gravity high and the present position of the east rift zone, is a measure of accumulated southward dilation and translation of the rift zone during spreading of Kïlauea’s south flank. The coincidence of the eastern gravity high with the lower east rift zone reflects the disappearance of Mauna Loa as a buttress and is consistent with seismicity and dilation being observed both north and south of the rift zone (see also Zablocki and Koyanagi, 1979).
The relation between the southwestern gravity high and the southwest rift zone tells a different story. The gravity high lies mostly west of the seismic southwest rift zone, and ends at the landward extension of the Päpa‘u lineament. The Kamakai‘a Hills and Yellow cone (Pu‘ukou) lie towards Kïlauea’s summit from the end of the gravity anomaly and are composed in whole or in part of highly fractionated Kïlauea lava (Wright and Fiske, 1971). The coincidence of the end of the gravity high and the disappearance of fractionated lava to the southwest (Wright, 1971) defines the southwestern extent of Kïlauea’s magma system, estimated from intrusions to lie at depths between 2 and 5 km. The southwest continuation of the rift zone, known as the “Great Crack,” is a shallow feature and suggests that Kïlauea might originally have formed within an asymmetric landslide scar—steep on the west side, flattening toward the east—associated with the larger Mauna Loa Volcano. The two rift zones are thus a bit different: the eastern gravity high marks the fossil rift north of the present volcanic and seismic rift, and the southwest gravity high in the upper rift coincides with the seismic southwest rift, which is displaced south of the volcanic rift (fig. 1.2A).
Seismicity as an Index of Stress Release
Kïlauea’s early seismic history is known to a completeness level of M4–M5.2. Many M4 earthquakes are reported as far back as the early 19th century (Klein and Wright, 2000, 2008). Earthquake swarms and earthquakes of magnitude smaller than 4 were often reported and are also noted in the catalog (Klein and Wright, 2000, 2008). Following the start of the Lyman earthquake diaries (Wyss and others, 1992b) in 1833, all M5.2 and larger earthquakes are probably known. M5.2 corresponds to Mercalli shaking intensity V (at which sleepers are awakened). Magnitudes are estimated from felt intensity information (Klein and Wright, 2008). The modern interpretive seismic history (Klein and others, 1987) identifies shallow earthquake swarms associated with eruptions and intrusions, deep earthquake swarms associated with the magma supply path (Klein and others, 1987; Wright and Klein, 2006) and swarms beneath Kïlauea’s south flank caused by the pressure of incoming magma (Dvorak and others, 1986; Klein and others, 1987; Wright and Klein, 2008). Throughout this paper we use seismicity as an indicator of stress release within the Kïlauea edifice in response to magma pressure applied at different depths (compare with Cayol and others, 2000). Rift seismicity is a direct response to magma on its way to eruption or intrusion, but flank seismicity is a nonlinear function of applied stress rate (Dieterich and others, 2000). As applied specifically to rift zone intrusions, seismicity is a useful but imperfect measure of the stress applied to the flank, because some magma movement may be aseismic and magma movement at different depths may generate a different stress response.

12 Two Hundred Years of Magma Transport and Storage at Kïlauea Volcano, Hawai‘i, 1790–2008
East rift zone
Mauna Loa
P a c i f i c O c e a n
155.285° W
19.409° N
Päpa‘u lineament
Southwest rift zone
Kïlauea
0 105 KILOMETERS
0 5 MILES
Figure 1.2. Maps showing relation of Bouguer gravity and seismicity to Kïlauea tectonics. A, Gravity data (Kauahikaua and others, 2000; Kauahikaua, 1993) are shown in blue on top of Kïlauea topography. A gravity high is centered in the northeastern part of Kïlauea Caldera. Gravity contours to the southwest initially follow the seismic southwest rift zone (fig. 1.1A, B) and then lie west of the seismic southwest rift, terminating west of the southwest rift zone. Gravity contours to the east show a maximum to the north of Kïlauea’s east rift zone, joining the rift zone at its eastern end. B, Epicenter maps for short-period (brittle failure) Kïlauea earthquakes in four depth ranges. The plotted earthquakes cover the period from 1970 through 2007. The 2.0 minimum magnitude for plotting means that small, poorly located events and those too small to have magnitude information are not plotted. The locations are standard hypoinverse locations from the HVO catalog. Earthquakes tagged as LP (long period) are excluded from this plot: these LP events often have emergent arrivals, are difficult to locate, and therefore would blur volcanic features if included in these maps. The four depth ranges are (1) 0–5 km: this includes the active and shallow rift zone magma conduits, shallow earthquakes above the magma reservoir under Kïlauea Caldera, and the shallowest events in the south flank and Ka‘öiki zones; (2) 5–15 km: the Kïlauea south flank, Ka‘öiki, and Hïlea zones that are active with large (up to M7) earthquakes are in this depth range, where the decollement and flank spreading are located; (3) 15–20 km, this zone is a minimum of seismicity except for the vertical magma conduit under Kïlauea Caldera; (4) 20–60 km; the upper-mantle magma conduit is visible as a cloud of earthquakes displaced just south of the caldera and centered near 30-km depth, plus deeper earthquakes of the conduit system in the lower left of the plot frame. Many of these deep earthquakes are caused by bending stresses in the lithosphere under Hawaiÿi and are localized near the deep magma conduits.
A

Chapter 1 Introduction 13
19°30'
19°20'
19°10'
19°30'
19°20'
155°20' 155°10' 155°0' 155°0'155°20' 155°10'
10 KILOMETERS0
0–5 km
15–20 km
5–15 km
20–60 km
1970-2007, M>2.0
East rift zone
SW rift z
one
Ka‘oiki seismic zoneKa‘öiki seismic zone
Hilea seismic zoneHilea seismic zone
south flank
Pacific Ocean
Kïlauea CalderaKïlauea Caldera
Kïlauea CalderaKïlauea Caldera
19°10'
extension of Päpa‘u lineament
B
0–5 km
5–15 km
15–20 km
20–60 km
Kïlauea Caldera
Figure 1.2.—Continued

14 Two Hundred Years of Magma Transport and Storage at Kïlauea Volcano, Hawai‘i, 1790–2008
between September 1961 and December 1965.
The general distribution of earthquakes beneath Kïlauea is shown for four depth ranges (fig. 1.2B). The primary seismic features are (1) eruption- and intrusion-related earthquakes between 2 and 4 km depth below rift zone magma conduits, (2) active flank and decollement earthquakes between the surface and the decollement, (3) earthquakes associated with a vertical magma conduit under Kïlauea Caldera between 7 and 20 km deep, and (4) earthquakes associated with a deeper and wider conduit plus flexure earthquakes at depths below 20 km. The earthquake distribution is shown for the very active period from 1970 through 2007 (fig. 1.2B). Swarms associated with eruptions and intrusions (fig. 1.2B, 0–5 km), and along the magma supply path (fig. 1.2B, 5–20 km beneath Kïlauea Caldera and extending south-southwest at depths greater than 20 km) are shown for the same time period. Flank swarms are mainly concentrated between depths of 5 and 15 km and occur in response to stress generated by upward and lateral movement between the magma source and sites of storage, eruption, and intrusion. Identical patterns characterize periods when no swarm activity occurs, suggesting that the general stress distribution within Kïlauea is nearly constant over time.
Seismic moment is calculated according to the moment-magnitude formulation for Hawaiÿi (Zuniga and others, 1988). Seismic moment is accumulated for the different regions and plotted as time series. Changes in the rate of moment accumulation reflect the level of seismic activity within the different tectonic regions. In our interpretations, particular attention is paid to changes in moment rate for periods not affected by earthquakes of magnitude greater than 5.
Eruptions and Intrusions
Translating the historical and geologic record into an understanding of magmatic history and volcano tectonics is based on the recognition that Kïlauea has been built by two different processes, both of which involve solidification of magma. “Exogenous growth” occurs by addition of lava flows to Kïlauea’s surface. “Endogenous growth” occurs through subsurface magmatic intrusion. We presume that exogenous growth was dominant during Kïlauea’s very earliest history, before the development of rift zones and a shallow magma storage reservoir beneath the summit. Once these features formed, affording the means to store magma in the edifice, endogenous growth became increasingly important and in the modern history is often the most frequent endpoint of magma transport to the rift zones.
During historical time, eruptions have occurred at the summit and along either rift zone. Intrusions may accompany eruptions or occur independently without associated eruption. During transport away from the summit reservoir, small pockets of magma can be isolated beneath the rift zones, where they cool and fractionate (Wright and Klein, 2006, figure 1.3; Wright and others, 1975). Spreading dilates the rift zones, and an additional volume of magma goes to fill the room created during spreading (see, for example, Cayol and others, 2000).
We recognize three different styles of eruption, “traditional,” “episodic,” and “sustained” (Wright and Klein, 2008).
Traditional eruptions are short-lived, usually lasting a few days to weeks, and are characterized by rapid transfer of magma causing a pronounced downward tilting (deflation) at Kïlauea’s summit. Succeeding eruptions occur at a different location. A series of six traditional eruptions occurred
Episodic eruptions return to the same vent location many times at intervals of days to weeks; individual episodes are short, lasting hours to days, and are also accompanied by sharp deflation of Kïlauea’s summit. The first 8 months of the Mauna Ulu eruption in 1969 is one example.
Sustained eruptions occupy one vent for a continuous period lasting for months or years, generally feeding a lava lake bounded by either a preexisting crater or by its own levees. Continuous eruption at Mauna Ulu between January 1970 and June 1971 is one example.
We recognize three types of intrusion, “traditional,” “inflationary” and “suspected deep” (Klein and others, 1987; Wright and Klein, 2008).
Traditional intrusions are marked by rapid tilt change, either inflation (near-summit intrusion) or deflation (rift intrusion), accompanied by shallow earthquake swarms near the site of intrusion. Traditional intrusions frequently accompany eruptions and indicate transfer of magma to a rift eruption site at a rate greater than the rate at which magma can be erupted. In some cases, accompanying earthquakes can be shown to migrate uprift, downrift, or to shallower depth from their starting point (Klein and others, 1987).
Inflationary intrusions, as previously defined (Klein and others, 1987, p. 1055–1056, table 43.1), are accompanied by intense shallow seismic activity but little summit tilt change or obvious rift deformation. We visualize magma as “leaking” into the uppermost parts of the east and seismic southwest rift zones at times when the summit reservoir is unable to further inflate

Chapter 1 Introduction 15
in response to a steady magma supply from depth. The paired inflationary intrusion of 4 to 8 April 1970 is one example (compare this report, chap. 5; Wright and Klein, 2008, figure 4). It is possible that some of the inflationary intrusions are fed all or in part by magma left in the upper rift zone following traditional intrusions. Earthquakes often migrate downrift during inflationary intrusions, just as they typically do during some traditional intrusions. When relocated, the earthquakes may be aligned to reflect a left-lateral tectonic adjustment to seaward spreading of the south flank (Rubin and Gillard, 1998).
Suspected deep intrusions, previously defined as “slow intrusions” (Klein and others, 1987, p. 1055–1056, table 43.1), are defined by concentrations of mostly small-magnitude earthquakes occurring beneath Kïlauea’s south flank at an elevated but slow rate for several days. Suspected deep intrusions are accompanied by little or no rift seismicity and small summit tilt change. The intrusion of 7 to 10 October 1969 is one example (compare this report, chap. 5; Wright and Klein, 2008, fig. 4). We interpret suspected deep intrusions as being related to magma supplied to the deeper (5–10 km) magma system beneath the rift zones and, by extension, to incremental increases in rates of rift dilation and seaward spreading (Wright and Klein, 2008). The relationship between our “suspected deep intrusions” and recently defined “slow” or “silent” earthquakes (compare Brooks and others, 2006; Cervelli and others, 2002b; Segall and others, 2006), marked by a discrete step in the seaward spreading of Kïlauea’s south flank, is discussed in chapter 8 of this report.
Role of Volatiles
Carbon dioxide (CO2), sulfur dioxide (SO
2), and
water (H2O), listed in order of increasing solubility,
are the principal volatile species contained in Kïlauean magma. Degassing of CO
2 is an important
process that occurs as magma moves upward to shallow storage (Gerlach and Graeber, 1985; Gerlach and others, 2002; Greenland and others, 1985). Most of the CO
2 is lost before magma moves into the
rift zone. Analysis of CO2 in rift and summit lavas,
combined with experiments indicates that escape of CO
2 occurs in the summit reservoir at pressures of
about 1.1 kbar corresponding to depths of 4–5 km (Dixon and others, 1995; Gerlach and others, 2002).
SO2 is degassed both at Kïlauea’s summit
and rift zones and has been used as an indicator of eruption rate (Sutton and others, 2003). H
2O
is released during summit storage and adds to the pressure exerted on the edifice that eventually results in eruption or intrusion.
Presentation of Seismic and Geodetic Data
The catalogs of seismicity and the record of tilting at Kïlauea’s summit are the only continuously monitored data extending back to the founding of HVO. As such they are critical to an interpretation of eruptive and intrusive activity. Seismic expression of volcanic activity at Kïlauea takes several forms: (1) seismic swarms associated with magma moving from summit storage into the rift zones, or magma moving within the rift zones as both precursors and response to eruptions and intrusions (Klein and others, 1987); (2) earthquakes and earthquake
swarms along the magma supply path leading to the summit reservoir (Wright and Klein, 2006; Wright and Klein, 2008); (3) release of stress built up beneath Kïlauea’s south flank by the pressure of incoming magma, including seismic swarms related to flank spreading (Wright and Klein, 2008); and (4) mantle earthquakes related to flexure of the Hawaiian lithosphere in response to the island load (Klein, 2007; Klein and others, 1987).
The early, pre-1959, Hawai‘i earthquake catalog (Klein and Wright, 2000) classifies known and possible Kïlauea earthquakes as “kl” [k(i)l(auea) s(outh) f(lank)]; rift zone [“uer” u(pper)e(ast) r(ift), “mer” m(iddle) e(ast) r(ift), “ler” l(ower)e(ast) r(ift), “sswr” s(eismic) s(outh) w(est) r(ift), and “swr” s(outh) w(est) r(ift)]; and summit [“kc” k(ilauea) c(aldera)], including a depth designation. “South Hawai‘i,” and “Kïlauea” are used when information is insufficient to make a more specific classification. A modern classification is presented in the section on “Earthquake swarms” in appendix A, which appears both at the end of the printed book and in the digital versions of this report. Additional supplementary material is in appendixes B–I, which are only available in the digital versions of this work—in the DVD that accompanies the printed volume and as a separate file accompanying this volume on the Web at http://pubs.usgs.gov/pp/1806/. We recognize that it is not possible to equate the terminology for the older periods with the more precise terminology used for the period beginning about 1967 when an adequate seismic network and detailed earthquake classification was possible. Differences in terminology for the older time periods are clarified in the figure captions. Classification of earthquakes from the modern catalog and a definition of earthquake swarms are given in appendix A (table A3; figure A4).

16 Two Hundred Years of Magma Transport and Storage at Kïlauea Volcano, Hawai‘i, 1790–2008
In this report we emphasize the only continuous record of geodetic change, which is the daily tilt records measured in the two vaults located near the edge of Kïlauea Caldera. In the text we report tilt as an azimuth (in degrees) clockwise from north and a magnitude (in microradians) (µrad) in conformity with current practice. In tables and figures for time periods before 1952 (chaps. 2 and 3) we report tilt magnitude in arc-seconds because the early seismic tilt was reported and plotted in arc-seconds The conversion factors are: 1 arc-second = 4.85 µrad, or 1 µrad = 0.21 arc-seconds. Errors in the tilt records from the seismometer in the Whitney Vault are estimated to be ±1 arc-second or 5 µrad, and from the short-base water-tube tiltmeter in the Uwëkahuna Vault are estimated to be ±0.2 arc-second or 1 µrad. Geologically significant tilt changes are ~10 µrad at Whitney and 2–3 µrad at Uwëkahuna. A more detailed discussion is given in appendix A.
Philosophical Approach to Interpretation of Disparate Datasets
Interpretations Based on Imprecise and Incomplete Historical Datasets
Data analyzed in this report, such as caldera filling rates in the 19th century, daily reading of tilt records at Kïlauea’s summit, and early earthquake records from a very limited network of seismometers, are impossible to evaluate with statistical certainty. Lava levels in Kïlauea Caldera are visual estimates made by different persons. Daily
tilt was not always measured and recorded by the same person. When we interpret the tilt or filling records, coincidence with other events is the critical factor that tells us whether changes are associated with known correlative events, such as eruptions, draining episodes, or earthquake swarms. We can formulate null hypotheses, such as the statement “Filling rates were constant before and after 1840.” For example, within the ranges of actual filling estimates the null hypothesis is true and the observed variations shown before and after 1840 in chapter 2, figure 2.1 are the measure of uncertainty and cannot be accepted as precise numbers. However the difference in the observations before and after 1840 are real, as noted by many persons who have looked at the data.
Intrusions before the founding of HVO are identified by concurrent draining of Kïlauea Caldera and an earthquake swarm with some earthquakes large enough to be felt. Earthquakes felt at Kapäpala Ranch are evidence of intrusion on Kïlauea’s southwest rift zone, and those felt at Hilo are evidence of intrusion beneath Kïlauea’s east rift zone. A Mauna Loa origin for the earthquake swarms is rejected on the basis of observed draining at Kïlauea.
Interpretations Based on Data from Established Seismic and Geodetic Networks
Typical background levels of summit tilt data and earthquakes located with a seismic network can be calculated in order to interpret small tilt changes and elevated numbers of earthquakes that are not part of a swarm. However, when tilt changes or small numbers of earthquakes are associated with
a documented volcanological event the criteria are loosened. For example, the tilt magnitude drop between 11 and 24 November 1959 is 5.41 µrad at an unusual azimuth. Although the magnitude is less than twice the average standard deviation calculated for quiet periods (appendix A, table A2, column 4), the azimuth points toward the shallow source path of magma supplied to the 1959 eruption in Kïlauea Iki Crater. The error in the tilt measurement may be high but is accepted, because it is consistent with the existence of a syneruption collapse of Kïlauea Iki Crater identified in later drilling. The timing, following the long first episode of the 1959 eruption, increases the credibility of this interpretation (see discussion of the 1959 eruption in chapter 4).
The number of earthquakes per day for any given region in the modern catalog is sufficiently variable to render calculation of an average background value meaningless. We use the occurrence of earthquake swarms beneath Kïlauea’s east rift zone to identify periods of intrusion. There are many weeks in which no earthquakes are located beneath the rift zone. If the seismicity increases in the few days preceding a swarm, we interpret that not as background but as the first indication of an approaching intrusion defined by the swarm. Similarly, if lower seismicity in the few days following a swarm is followed by a week of no earthquakes, we interpret the lowered seismicity not as a return to background but as a waning of the pressure of intrusion.
Interpretations in chapters 5–7 cite previously published conclusions to the extent possible. Our contribution is to identify longer term comparisons and contrasts among the various modern periods or between the modern studies and earlier work with the aim of presenting the evolution of the Kïlauea magma plumbing over time.

Chapter 1 Introduction 17
Volcano Observation: the Historical Record, 1790–Present
We have divided this 200-year history into six periods (chaps. 2–7), each separated by a major eruption or earthquake: 1790 to 1924 (chap. 2), 1924 to 1952 (3), 1952 to 1967 (4), 1967 to 1976 (5), 1976 to 1983 (6), and 1983 to 2008 (7). Master tables of all identified events are given as the first table in each chapter. Additional earthquakes of M5–6 are summarized in appendixes B and C for earlier periods when locations were uncertain. Map plots for all tabulated eruptions and intrusions and time-series figures for periods of one year or longer are given in appendices B–G, corresponding to chapters 2–7. A small subset of representative events are included in each chapter as reduced text tables and figures.
Calculations of magma supply rates and eruption efficiency are discussed in appendix A. Appendixes D–G includes tables summarizing the calculation of magma supply and eruption efficiency for intervals of time covered in chapters 4–7. Results are discussed and plotted in chapter 8.
Our presentation of seismic data emphasizes swarm activity accompanying eruptions and intrusions; examples of both time-series and map plots of representative events are shown in chapters 4–7. Time-series and map plots covering all events in the time periods covered by chapters 4–7 are included in appendixes D–G. The presentation of seismic data in chapters 2 and 3 is modified to
reflect the lack of a robust seismic network and the smaller number of accurately located events. Taken together, the seismic and tilt plots in chapters 2 and 3 and appendixes D–G present a synoptic view of monitored changes in Kïlauea volcanism over time.
The numbering of figures and tables is made as consistent as possible, with a chapter number as the leading number and a minimum number of subheadings. For example, the first text table and figure in chapter 3 are labeled 3.1. Where multiple closely related illustrations (as in illustrating different aspects of a single eruption) are combined as parts in one, the figure and table number are followed by letters identifying the parts, for example figure 3.1B. The numbering in the printed appendix A is independent, beginning with A1. Tables and figures in appendixes B–G follow a similar numbering convention—the appendix letter followed by a figure or table number beginning with 1. For example, the first appendix D table is table D1.
In March 2008, explosive activity began in Halema‘uma‘u with a lava lake in the bottom of Halema‘uma‘u occasionally in view. This activity continues as of this writing (2013), as has the eruption at Pu‘u ‘Öÿö that began in 1983. This is the first time in Kïlauea’s recorded history that activity has occurred simultaneously at the rift and summit. We take the beginning of the 2008 activity in Halema‘uma‘u as the end of our study period.
Supplementary material for this chapter appears in appendix A, which is printed at the end of this report. Appendix A contains the following figures and tables:
Tables A1 contains volume factors (km3/µrad) for Uwëkahuna and Whitney tiltmeters as a function of distance to various summit Mogi sources.
Table A2 contains Whitney tilt rainfall correlation and error magnitudes.
Table A3 contains our earthquake classification by tectonic region, and our working definition of earthquake swarms
Figure A1 shows a comparison of tilt records from (1) the Bosch-Omori seismometer in the Whitney Vault, (2) the daily short–base water tube tiltmeter in the Whitney Vault and (3) the daily short–base water tube tiltmeter in the Uwëkahuna Vault over the time period when all three tiltmeters were in operation.
Figure A2 shows the location of centers of inflation recorded by leveling surveys conducted before the 1967–68 eruption in Halema‘uma‘u.
Figure A3 compares distances to deformation centers from the Uwëkahuna and Whitney Vaults.
Figure A4 shows the map location of the regions defined in the earthquake classification of table A1.
Figure A5 illustrates our methodology for calculating magma supply.
18 Two Hundred Years of Magma Transport and Storage at Kïlauea Volcano, Hawai‘i, 1790–2008
Halema‘uma‘u lava lake in 1894. Painting by D.H. Hitchcock. Image courtesy of Hawaii National Park.
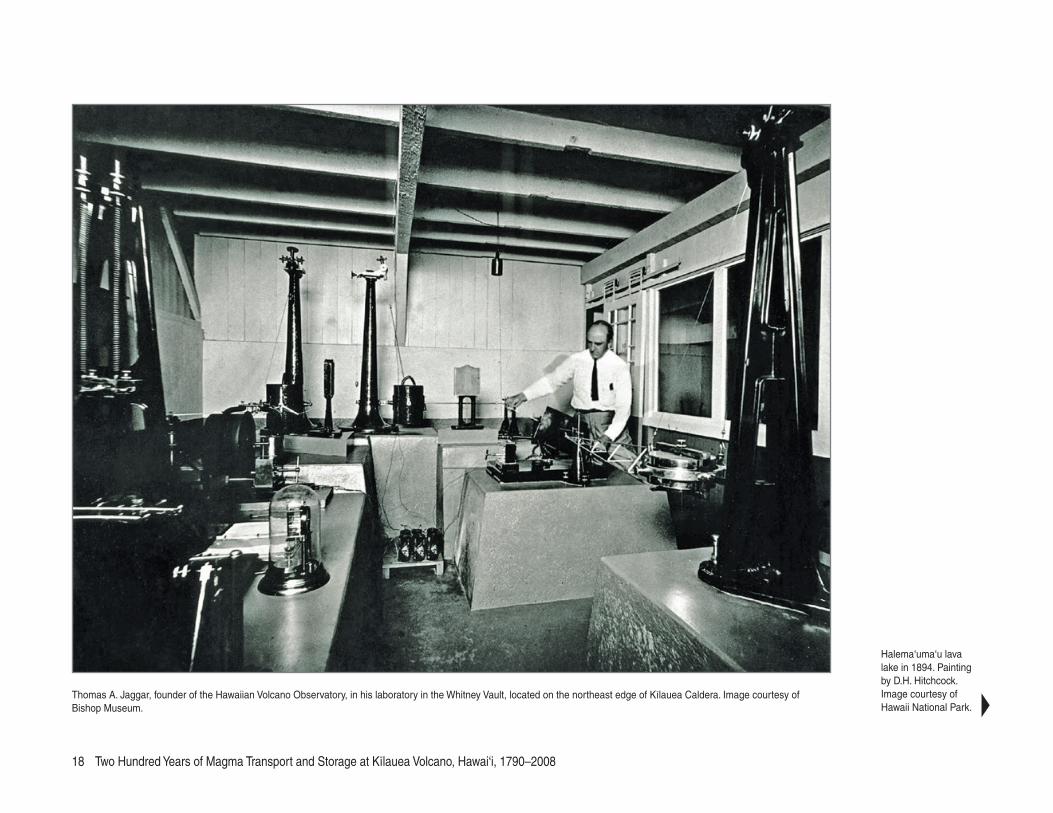
Thomas A. Jaggar, founder of the Hawaiian Volcano Observatory, in his laboratory in the Whitney Vault, located on the northeast edge of Kïlauea Caldera. Image courtesy of Bishop Museum.