chapter 1. gis fundamentals 1. gis overview -...
TRANSCRIPT

GIS Fundamentals
Work Site Alliance – Community Based GIS Education 1 2000
Chapter 1. GIS Fundamentals
1. GIS OverviewGIS refers to three integrated parts.• Geographic: Of the real world; the spatial realities, the geography.• Information: Data and information; their meaning and use.• Systems: The computer technology and support infrastructure.
GIS therefore refers to a set of three aspects of our modern world, and offersnew ways to deal with them (Davis, 21).
In 1990, the President of the Association of American Geographers, Saul Cohen,was quoted: “Times are changing, and our methods of meeting the needs of thetimes are also changing. The world is entering the ‘post-industrial InformationAge’ – a time when information is becoming a major product of, and foundationfor, progress. Increasing emphasis on data management is apparent andnecessary. Today’s focus in geography (or any other discipline) on data handlingand data manipulation reflects the national (and international) emphasis onmeeting the needs of the postindustrial information age.”
The concept of information is indeed the heart of the rapidly growing field ofGeographic Information Systems or GIS. As the world moves into theInformation Age, meaningful data and information are becoming the major‘currency’. With the continuous advances in computer technology, it is easy toconcentrate on dazzling systems and software, but the real value of any productis the data and the information such data provides. At the heart of any GIS isinformation.
This chapter introduces the reader to the very basic principles of GeographicInformation Systems, by giving an overview of the different operations that it canhandle and perform, as well as its environment. It aims to explain what GIS is,and presents the ArcView Graphical User Interface.
2. What is GIS?
2.1 History of GISSpatial analysis has been around as long as maps have been used fornavigation. Traditional GIS has included paper maps, and manual tools that wereutilized before the computer age.
There are many theories on how and where the original GIS began and took holdin the information-based world we live in today. There is little doubt that theHarvard Laboratory for Computer Graphics, later renamed by adding “and SpatialAnalysis” to its title, was a key institution in the birth and early development ofGIS in the United States. A large number of the founders of GIS in the academicand commercial sectors spent time at the Harvard Lab in the 1960s and 1970s,as staff, students, or visitors, exchanging ideas that would shape the field.

GIS Fundamentals
Work Site Alliance – Community Based GIS Education 2 2000
Most would acknowledge that the two dominant commercial GIS producers in theUnited States are Environmental Systems Research Institute (ESRI) andIntergraph. Estimates usually indicate that together they produce at least half ofthe GIS software in the country. ESRI will be the focus of this chapter, with theESRI desktop application ArcView being utilized for the software application ofthis course. Jack Dangermond, the President of ESRI, Inc. since 1969, is wellknown to GIS users because he established the company in that year, thensubsequently developed and launched ARC/INFO in 1982. Dangermondcontinues to refine ESRI’s software, and his efforts qualify him as one of theoriginal thinkers in the development of spatial analysis systems. (Lakhan, 2)
2.2 GIS DescriptionGeographic Information Systems (GIS) are computerized systems for thestorage, retrieval, manipulation, analysis, and display of geographicallyreferenced data. Since they can include either physical, biological, cultural,demographic, or economic information, they are valuable tools in natural, social,medical, and engineering sciences as well as in business and planning.
The infrastructure to any GIS is made up of four components whose interrelationis shown on the illustration below. These components can be listed in order ofimportance as follows.• Methods and People – The most important part of a GIS infrastructure.
Although GIS is a powerful tool, it will not work without some well-adaptedmethods and trained people.
• Data – The needed raw material to be processed by the system. The focusand attention should be on data. In fact, most work will be devoted to datainput and management. Data (information) is the foundation of GISapplications.
• Software – The computer programs needed to run GIS. There are many GISprograms available, from low-cost and low-performance packages toexpensive and very powerful ones. This also includes support programs, suchas statistical, word processing, graphing, and others.
• Hardware – The machinery on which GIS operates – computers, printers,plotters, digitizers, and other types of equipment. (Davis, 25)
Figure 1.1. Components of a GIS.

GIS Fundamentals
Work Site Alliance – Community Based GIS Education 3 2000
Unfortunately, GIS is often developed in the wrong order and more attention isgiven to the dazzling hardware and software, rather than trying to fit the data tothe computer technology. The statement ‘garbage in; garbage out’ can beapplied to the data collection process for the organization and the people whoutilize and implement that data. The greatest piece of software, and thecomputers with the greatest amount of memory and speed, will not improve theinformation from data that is poorly gathered and inputted into the system.
2.3 General Purposes of GISA description of GIS is that it is a computerized system that deals with spatialdata. GISs essentially perform five processes or tasks.• Input• Manipulation• Management• Query and Analysis• Visualization
Input – Gathering data from many sources. Before geographic data can be usedin a GIS, the data must be converted into a suitable digital format. Today manytypes of geographic data already exist in GIS-compatible formats. These datacan be obtained from data suppliers and loaded directly into a GIS. (ESRI, Inc.)
Manipulation – Converting data from one form to another; that is, conversionfrom one geometric projection to another, re-scaling, and other computer “tricks”to make the data more useful; changing one map file to match another. It is likelythat data types required for a particular GIS project will need to be transformed ormanipulated in some way to make them compatible with your system. Forexample, geographic information is available at different scales (detailed streetcenterline files; less detailed census boundaries; and postal codes at a regionallevel). Before this information can be integrated, it must be transformed to thesame scale (degree of detail or accuracy). This could be a temporarytransformation for display purposes or a permanent one required for analysis.GIS technology offers many tools for manipulating spatial data and for weedingout unnecessary data. (ESRI, Inc.)
Management and Storage – Efficient digital storage and retrieval for easy,efficient selection and viewing of data in a variety of ways. This involvesadministering and keeping track of data, including integration of various data setsinto a common database. For small GIS projects it may be sufficient to storegeographic information as simple files. However, when data volumes becomelarge and the number of data users becomes more than a few, it is often best touse a database management system (DBMS) to help store, organize, andmanage data. A DBMS is nothing more than computer software for managing adatabase. There are many different designs of DBMSs, but in GIS the relationaldatabase design has been the most useful. In the relational design, data arestored conceptually as a collection of tables. Common fields in different tablesare used to link them together. This surprisingly simple design is so broadly used

GIS Fundamentals
Work Site Alliance – Community Based GIS Education 4 2000
primarily because of its flexibility and very wide range of applications both withinand outside of GIS. (ESRI, Inc.)
Query and Analysis – Manipulating data to produce insight and newinformation. Simplifying the data or the world and its processes to understandhow things work. Once you have a functioning GIS containing your geographicinformation, you can begin to ask simple questions such as:• Who owns the land parcel on the corner?• How far is it between two places?• Where is land zoned for industrial use?
And, analytical questions such as:• Where are all the sites suitable for building new houses?• What is the dominant soil type for oak forest?• If I build a new highway here, how will traffic be affected?
Visualization – Presenting data in various ways for easy understanding of mapsand reports (Davis, 23). For many types of geographic operations, the end resultis best visualized as a map or graph. Maps are very efficient at storing andcommunicating geographic information. While cartographers have created mapsfor millennia, GIS provides new and exciting tools to extend the art and scienceof cartography. Map displays can be integrated with reports, three-dimensionalviews, photographic images, and other output such as multimedia. (ESRI, Inc.)
3. AreView Graphical User Interface (GUI)User Interface is a generic term, in computer science, which is adopted for allcomponents that humans use to communicate with computers. It includesanything between the input devices (keyboard, mouse, etc) and the outputdevices (printer, video display monitor, etc) which translate the electronic signalssent back by the machine to the user.
Graphical User Interface (GUI) designs a display format that enables the user tochoose commands, to start programs, and to see lists of files and other optionsby pointing to icons and lists of menu items on the screen. Choices can generallybe activated either with the keyboard or a mouse. The ArcView GUI consists ofcontrols called menus, buttons, and tools arranged in three bars at the top ofan Application window. The following figure shows the GUI associated to thecalled “View Window”:

GIS Fundamentals
Work Site Alliance – Community Based GIS Education 5 2000
Figure 1.2. Basic Graphical User Interface of ArcView.
• The Menu bar provides access to ArcView operations through pull-downmenus.
• The Button bar provides quick access to commonly used operations.• The Tool bar contains tools that perform operations requiring input from the
mouse. (Also, when you click on a tool, the cursor changes to reflect the toolyou have chosen).
When you place the cursor over a menu choice, button, or tool, the Status bardisplays a one-line description of the operation it performs. The Status bar alsoreports measurements and displays a progress bar for lengthy operations.(ESRI)
Below are examples of ArcView sessions showing all the available types ofdocuments in a GIS project.• View document• Table document• Chart document• Layout document• Script document
Project
A project is a collection of associated windows, or documents, that are displayedduring an ArcView session. The Project window contains all of the otherdocuments associated with the project (views, tables, charts, layouts andscripts). All of these associated documents are accessed through the activeproject window.
Projects are text (ASCII) files stored with an “.apr” extension. Projects containpointers to the physical locations of associated documents as well as userpreferences (colors, GUI, window sizes & positions). The user preferences storedwith the project affect only the way the data is displayed not the data itself.

GIS Fundamentals
Work Site Alliance – Community Based GIS Education 6 2000
Figure 1.3. Project window containing associated ArcView documents.
View
A view is the graphic representation of spatial information and can contain anynumber of “layers” or “themes” of spatial information (see Chapter 4). Thedifferent themes associated to a view are listed in the Table of Contents, asizable space located along the left side of the View window. As seen in theexample below, “Major Roads,” “Schools,” and “Census Block Groups” polygonswould be the selected themes in a single view.
Figure 1.4. View window displaying layers or themes of spatial information.
Table
A table is ArcView’s representation of tabular data. Tables contain descriptiveinformation about a specific subject. Each row, or record, defines one entry inthe database (e.g., one Census Block polygon); each column, or field, defines asingle characteristic for the entry (e.g. Area). Any dBase, INFO or ASCII file canbe displayed as an ArcView Table (see Chapter 2).

GIS Fundamentals
Work Site Alliance – Community Based GIS Education 7 2000
Figure 1.5. Table displaying tabular data about the theme.
Chart
Charts provide graphic representation of summarized tabular data. Charts canalso query data from the table from which it was built. Six chart types areavailable: line, bar, column, X,Yscatter, area, and pie. (NOTE: the same charttypes as in the Microsoft Excel spreadsheet software). The example belowdepicts GIS data of high school sizes on a bar graph.
Figure 1.6. A chart summarizing tabular data.
Layout
The layout document is used to combine all other documents (views, tables, andcharts) into an output document (usually a hardcopy map). Any previouslycomposed view can be placed into a layout. Within the layout a north arrow,scale bar, legend and other graphics can be added (see Chapter 6).

GIS Fundamentals
Work Site Alliance – Community Based GIS Education 8 2000
Figure 1.7. A layout combining views, tables, and charts for map-making purposes.
Script
Script windows are for writing and displaying Avenue scripts that customize theArcView user interface or perform user-designed tasks. From the button bar youcheck syntax, debug, and run your script.
Avenue is ArcView’s object-oriented programming language. With Avenue youcan modify the appearance of ArcView, create new programs, make complextasks simple, and communicate with other applications such as ARC/INFO, arelational database manager or a spreadsheet. Using scripts, ArcView can becustomized for specific user needs and for specific applications and tasks. Thefigure below is an example of the Avenue scripting language.
Figure 1.8. Example of the object-oriented programming language used by ArcView.

GIS Fundamentals
Work Site Alliance – Community Based GIS Education 9 2000
Exercises
In this section, the student will learn to open ArcView projects and themes, and usesome of the buttons and tools associated to the View document.
1A. Opening a Project in ArcView GISFrom the Start menu, go to Programs.
Open the GIS application that is installed on your computer (with the same stepsas if you have to open any other application such as Microsoft Word, etc). WhenArcView is opened, you will notice an Untitled Project window with the followingdialog boxes:
Click on OK in the first dialog box (on the left of the page).
Click on No when the second dialog box pops up, and an empty view window willopen.
GIS Fundamentals
Work Site Alliance – Community Based GIS Education 10 2000
1B. Adding Themes to a View
With the View window open and active, you then add a theme to the view.
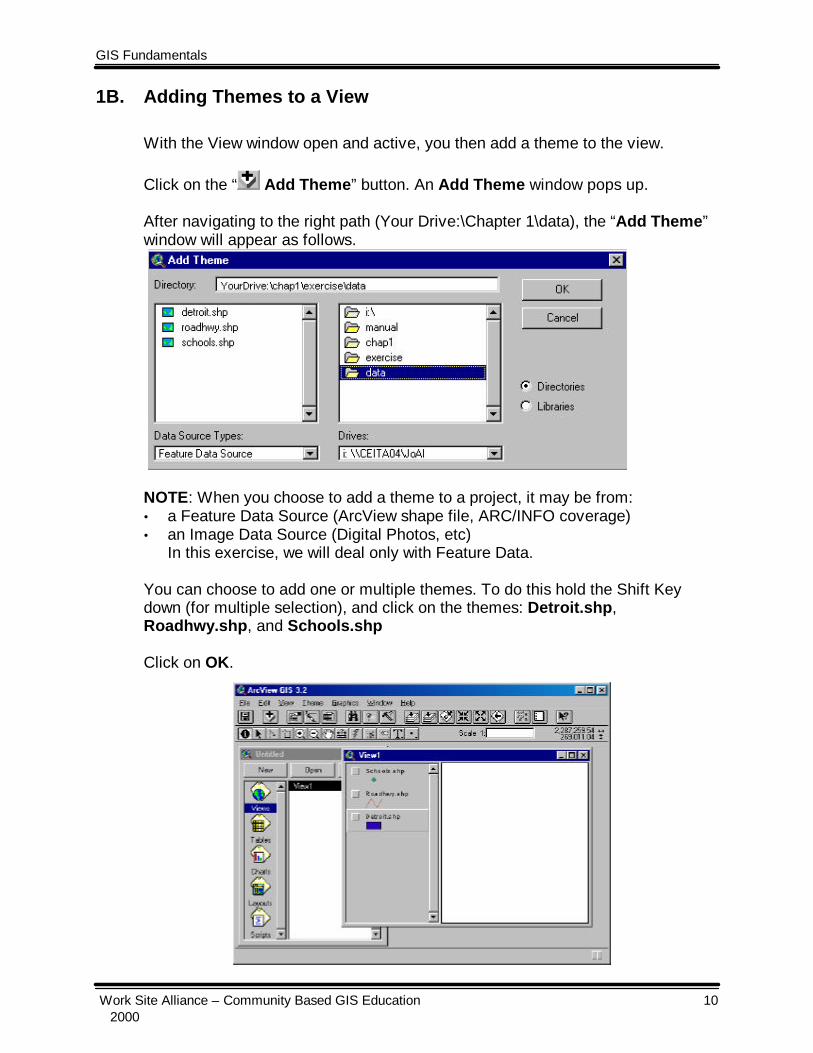
Click on the “ Add Theme” button. An Add Theme window pops up.
After navigating to the right path (Your Drive:\Chapter 1\data), the “Add Theme”window will appear as follows.
NOTE: When you choose to add a theme to a project, it may be from:• a Feature Data Source (ArcView shape file, ARC/INFO coverage)• an Image Data Source (Digital Photos, etc)
In this exercise, we will deal only with Feature Data.
You can choose to add one or multiple themes. To do this hold the Shift Keydown (for multiple selection), and click on the themes: Detroit.shp,Roadhwy.shp, and Schools.shp
Click on OK.

GIS Fundamentals
Work Site Alliance – Community Based GIS Education 11 2000
1C. Working in the View WindowOn the left side of the View window, we have the Table of Contents which holdsa list of the themes in the view. Themes which are “on” are denoted by the checkmark in the box on the left of each theme. If a theme is on, then it is visible in theview.
Click on the check box for each of the three themes you have just added.
The order of themes within the Table of Contents dictates the order in which thethemes are drawn in the view. The top theme in the Table of Contents is drawnlast and is the top layer of the view. The order of the themes can be rearrangedby clicking on a theme with the mouse and then dragging it to a new position inthe Table of Contents.
Notice the order in which the themes are in your View Window.Click on and drag the Detroit.shp to the top of the Table of Contents.Notice the change in the “map” by interchanging the order of the themes asdirected. Drag the theme Detroit.shp back to the bottom list.
Many functions in ArcView require that one or more themes are “active.” Anactive theme is that which responds to the View GUI. The legend for an activetheme appears “raised” in the table of contents. Themes can be made active byclicking on the name of the theme in the Table of Contents. Multiple themes maybe made “active” by holding down the Shift Key and clicking with the mouse oneach required theme.
Make the Detroit.shp theme active.Click on the “Zoom to Active Theme” button.

GIS Fundamentals
Work Site Alliance – Community Based GIS Education 12 2000
1D. Using Some Buttons & Tools in the View GUI:Another strength of ArcView is the additional tools associated with the Viewwindow. These tools can be used on themes and can help you manipulate theview, find features in the themes, and add graphic features.
Click on these buttons for immediate response.
Zoom to extent of all themesZoom to extent of active themesZoom inZoom out
Click on the following tools and move the pointer into the view graphics area.
Zoom into view (single click, or click and drag a box in the view)Zoom out from view (single click in the view)Move the view around (click and drag in the view)
Click on the Select Features tool.
Move the pointer to the polygon located in the middle of the Detroit.shp theme(which should be the active theme).
The polygon is now selected, and become highlighted.
Click on the “ Zoom to Extent of Selected Features” button. The View will“focus” on the selected polygon.
Click on the “ Clear Selected Features” button to un-select the previousarea.
GIS Fundamentals
Work Site Alliance – Community Based GIS Education 13 2000
Click on the “ Zoom to Previous Extent” button to retrieve the previousaspect of the view.
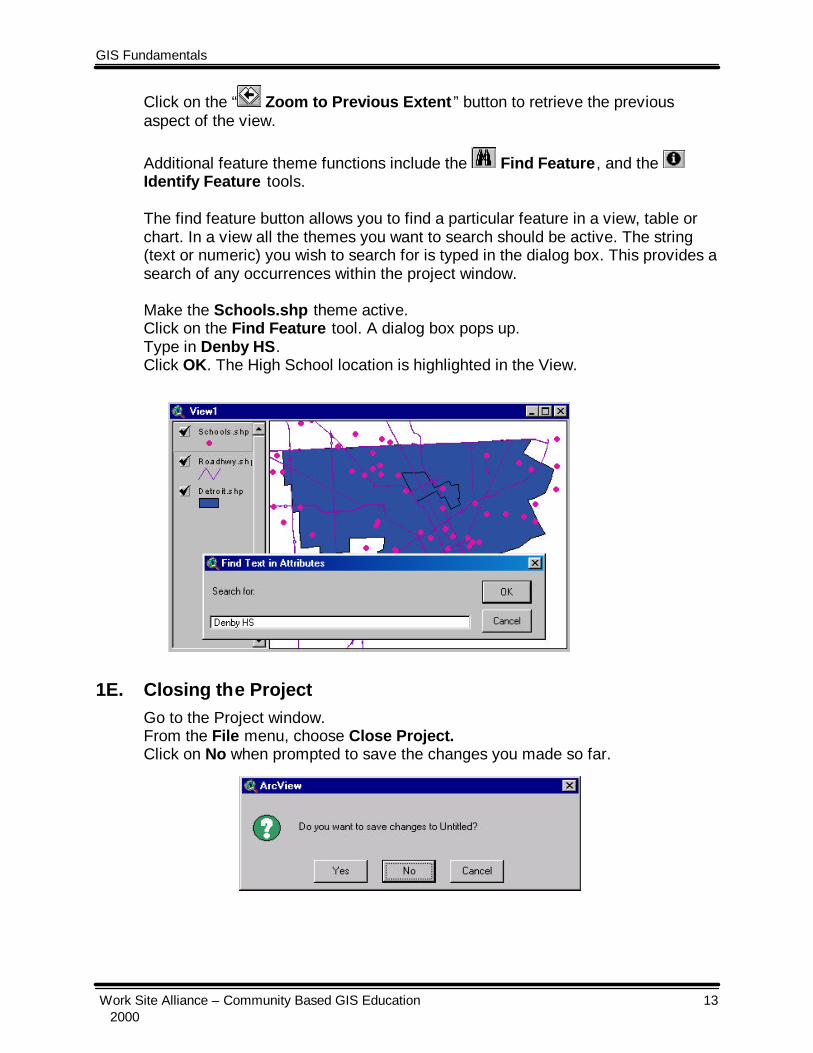
Additional feature theme functions include the Find Feature, and the Identify Feature tools.
The find feature button allows you to find a particular feature in a view, table orchart. In a view all the themes you want to search should be active. The string(text or numeric) you wish to search for is typed in the dialog box. This provides asearch of any occurrences within the project window.
Make the Schools.shp theme active.Click on the Find Feature tool. A dialog box pops up.Type in Denby HS.Click OK. The High School location is highlighted in the View.
1E. Closing the ProjectGo to the Project window.From the File menu, choose Close Project.Click on No when prompted to save the changes you made so far.

GIS Fundamentals
Work Site Alliance – Community Based GIS Education 14 2000
BibliographyDavis, Bruce E. GIS: A Visual Approach. Santa Fe: Onward Press, 1996.
ESRI Web Page. Environmental Systems Research Institute, Inc. Http://www.esri.com.
Lakhan, V. C. Introductory Geographical Information Systems. Chelsea: SummitPress, 1996.