chapter 1. introduction and literature review 1
TRANSCRIPT

1
CHAPTER 1. INTRODUCTION AND LITERATURE REVIEW
1.1Historical background
The Charlotte Maxeke Johannesburg Academic Hospital (CMJAH), formerly known as the
Johannesburg General Hospital, is the site of one of the world‟s first independently
functioning trauma units.
In 1960, the Head of the Department of Surgery, Prof D J Du Plessis noted that there was a
certain degree of difficulty being experienced by both staff and patients alike in the then
general casualty department which was responsible for the acute management of all
emergency patients. The main problem cited was that there was a relatively large population
of patients who had suffered traumatic injuries and required adequate and timeous access to
treatment. As such, it was decided that a dedicated area should be set aside for the
management of these trauma patients. Initiated in 1962 under the leadership of Prof A E
Wilkinson, this area, termed a unit at a later stage, was seen as an answer to the problems of
overcrowding and difficulty in access to trauma care.1
1.2 Current structures
Today, the above mentioned trauma unit consists of the emergency treatment/ resuscitation
area for the initial assessment and management of trauma patients, a trauma ICU for the
critically injured patients who have need of intensive care and monitoring, and a trauma ward
for the less severely injured and recovering patients. Associated trauma administrative offices
are responsible for a large amount of data capturing on the trauma-medibank system and for
the quality control of patient care. The data gleaned from this system informs the hand-over
discussions and the morbidity and mortality (M&M) meetings. For the purposes of this study

2
although the trauma unit comprises several different areas in the hospital for ease of
description it will be referred to either as area 163 or as the trauma unit.
In terms of non-trauma surgical admissions, a different management is currently in place.
General and vascular surgical admissions (non-trauma) are admitted first through a general
medical casualty area where they are triaged and assessed by emergency medical officers.
Once an assessment is complete the relevant surgical medical officer/ junior registrar is called
to go and assess the patient. Patients are then either managed and discharged in the medical
emergency area or admitted for further management under the care of the surgical team on
call for a given day. If an emergency operation is required patients are often sent straight to
the operating theatre from the admission area and only taken to the surgical wards post-
operatively.
When admitted, non-trauma, surgical patients will be cared for by one of three surgical
teams.
Ward 394 is a general surgical ward which also specialises in breast and thyroid
surgery.
Ward 395 is the vascular surgery ward
Ward 396 is a general surgical ward which also specialises in oncology and gastro-
intestinal surgery.
Ward 395 is on call for all vascular surgical emergencies 24 hours a day, 7 days per week.
Wards 394 and 396 are on call for general surgical emergencies for 24 hours, each on
alternate days.
3
Currently, the structures described necessitate at least 2 medical officers and one registrar
(intermediate or senior level) on duty within the hospital for the trauma unit (163) at any
given time. There is also 1 medical officer on duty in the hospital for the Trauma Intensive
Care Unit (TICU.) Simultaneously there is always one medical officer or junior registrar on
call within the hospital for either of wards 394 or 396 depending on which unit is on duty. In
addition there is always a senior registrar for each of the above mentioned units on call (from
home) every day. Ward 395 is staffed after hours by a medical officer and a senior registrar
who are on call from home. In general there is one consultant who is on telephonic call from
home for each of these wards every day. The exception is trauma (163) where the consultant
on call is required to be on hospital premises.
The potential exists with a system such as this for unacceptably frequent rostering of doctors
in terms of on call hours, and in terms of hours worked. This is exacerbated by the fact that
doctors have to continue working on the days following their calls and if they have been busy
during the calls, they may work as many as 36 hours at a time with little or no sleep. It would
be useful to understand the actual workload in the trauma unit and the surgical wards prior to
considering a possible restructuring of the surgical units or the employment of more
medically qualified personnel if a problem is identified.
1.3 Literature review
By the late 1970‟s, the improvement in the overall care of trauma patients in dedicated units
such as the unit in the Johannesburg General Hospital, had led to many similar units being
successfully implemented in hospitals throughout the world.2Prior to the trauma unit concept,
the management of severely injured patients took place in general “emergency” areas and
with a wide variety of other emergency patients and specialists. Thus trauma patients were
often lost in an inefficient and overburdened system where specialist care for these patients

4
was not optimal, in addition to which, this type of specialist care was not always easily or
immediately obtained. Consequently the “golden age” of trauma began. General surgery
became an extremely competitive and prestigious career choice and the trauma surgeon was
regarded as the “master surgeon of the pack:” - a surgeon who could operate in virtually any
area of the body in order to save a life within the so-called “golden hour” of trauma.2
Ultimately the American College of Surgeons developed a trauma centre designation system
with stipulated requirements, thus reinforcing the paradigm that trauma is a surgical disease
which must be managed in trauma-ratified centres, by exclusive trauma teams each of which
should be overseen by an on-site trauma surgeon.
Over the next quarter of a century, however, trauma surgery started to change, particularly in
the United States (US) and United Kingdom (UK) i.e. first world or developed country
settings. Dramatic improvements in the quality and number of diagnostic modalities started to
bring about a trauma revolution of sorts.2 There was a shift towards the non-operative
management of trauma patients, which essentially left the trauma surgeons acting as interns,
not doing much of the operative work themselves. They ended up “baby-sitting” patients for
other specialists (such as neurosurgeons and orthopaedic surgeons) during the night and then
handing them over for definitive management during the following day. At the same time,
newer specialist disciplines (for example emergency medicine and interventional radiology)
emerged.2 As these specialists started to become more adept and better trained at handling
trauma emergencies themselves, the presence of an on-site trauma surgeon was rendered
obsolete. At present the perception amongst many of the residents (registrars) is that trauma
surgeons are resuscitation doctors who let other surgeons do the actual operating.3 An
example is the study by Søreide4 which highlights that < 5 % of trauma patients are managed
operatively.

5
Currently, emergency medical care seems to be in turmoil - access to emergency medical care
is problematic in many areas of the world. Once emergency care has been accessed, patients
and doctors alike are faced with the issues of overcrowding, boarding and delays in
management. Average waiting times of 6.4hours have been quoted by Exadaktylos5 (in some
departments), just for surgical consultation. This would result in serious delays in the
definitive management of these patients.
This type of problem has been experienced before. Prior to the dawn of the trauma unit era,
as a solution to the above-mentioned problems was sought, the concept of merging trauma
surgery with other surgical emergencies was explored. By using the concept of the dedicated
trauma unit and applying this to all emergency surgical patients, a new type of unit could be
created; one which might make for a more patient- and surgeon-friendly environment, where
some of the pressure of the generalised emergency units may be alleviated by redirecting all
of the surgical emergencies toward a dedicated emergency surgical unit. This concept
effectively includes the disciplines of trauma, critical care and emergency surgery under one
umbrella and became known as Acute Care Surgery. The author of the name “Acute Care
Surgery”, L D Britt6, has seen the successful application of this new unit concept to an
impressive degree, with the result that not only are these Acute Care Surgery Units now being
run with success across many areas of the USA and Britain, but it also appears that the initial
rationale behind such a restructuring has actually achieved its aims i.e. filling the “quality
void” that exists in many emergency medical systems.
In South Africa, the problems of overcrowding and delays in generalised emergency areas
appear to be just as severe if not worse than outlined above and although the discipline of
trauma is not yet facing the same challenges, the solution to our own problems may lie along
similar lines to some of the Acute Care Surgery models which will be described. In some
instances there is great similarity between the problems experienced in the US and the
6
problems we are experiencing now in South Africa, particularly with regard to the working
hours and remuneration of general surgeons. In one study completed by the Association of
Surgeons of South Africa it was noted that general surgeons worked excessively long hours
and as a result had increased levels of stress and strain placed on their families.7
Gamelli8 has said: “Establishing acute care surgery as a defined speciality within a busy
academic medical centre allows for more efficient management of patient care, development
of educational programs, and more effective use of the surgical faculty‟s time.” Whilst Acute
Care Surgery (ACS) is a long way from becoming a separate sub-specialty in South Africa,
this statement does highlight three ideals which are very important generally and particularly
pertinent to the situation at CMJAH. They are:
• Efficient management of patient care.
• Academic program development.
• Efficient use of the surgical faculty‟s time.
Within the academic hospital environment in developed countries such as the US, traditional
incentives have tended to be replaced with more corporate measures such as revenue. This
has resulted in procedures becoming the main driving force for the measurement of
productivity, producing a system where rapid patient turnover and high level efficiency are
the norm. Time management is key and consequently scheduling plays an important role in
the managerial side of such academic units. “Caring for patients with operative emergencies
is inherently unexpected and inefficient and fits poorly into this contemporary academic
surgical model” according to Reilly and Schwab.9The CMJAH is an academic hospital which
faces the same problems with regard to the need for rapid patient turnover even though the

7
baseline reasons for that need are very different and in all likelihood due to the patient loads
at this hospital.
1.3.1 Acute care surgery
Is there a general model for Acute Care Surgery? Not yet; units at present tend to be set up
for specific country, area, and hospital needs.
The Santa Clara Valley Medical Centre (SCVMC) 10
in the USA and The Rotherham
General Hospital in the United Kingdom11
, are two examples of hospitals which are running
such acute care surgical units in very different but nonetheless effective ways.
The Santa Clara Valley Medical Centre (SCVMC) in Santa Clara County, USA is a level 1
trauma centre in which a single surgical service covers the elective patients as well as the
acute surgical and trauma patients. The structuring of their particular unit has been fine-tuned
over the better part of the last decade and is structured as follows: the emergency room team
is comprised of surgical and emergency medicine staff. The in-house on-call surgeons work
on a shift basis seeing to all emergency surgical patients who present. During day time hours
the responsibility is given over to an on-call attending (consultant) of the week and his/her
team of residents (registrars) and students. The residents and students of that week will then
be responsible for taking over the care of the patients who present during the 7 day cycle this
team will follow them up throughout their hospital stay.10
By comparison, the Rotherham General Hospital in the UK has developed a different
emergency general surgery (EGS) system. Introduced in March 2003, there were two major
changes made to existing work practices. Firstly, all emergency surgical patients were
managed by all five consultant surgeons as a team rather than falling under a single
consultant as had been the case previously. Secondly, each of the five consultants was
8
assigned a fixed on-call day each week. On this day, the on-call consultant had no elective
commitments in the hospital. The net result of these two changes was that the on-call
consultant would take responsibility for all the emergency patients on any given day and for
the post-intake ward round the following day. On the following day he/she would hand the
patients over to the rest of the consultant team who were thereafter jointly responsible for the
ongoing patient care.11
The two models outlined above demonstrate that working within the constraints of any given
situation, it is possible to restructure resources in a manner that is conducive to the
improvement of patient care, academic development and the efficient use of time for the
health care professionals in question, thus achieving all of the three ideals quoted previously,
but specific to the needs of the actual patient and hospital environments under consideration.
Before being able to consider the restructuring of these resources in a local context, it is
necessary to have data which accurately reflect the trauma and the general surgical loads
within the hospitals concerned.
Examples of workloads and doctor - patient ratios were sought at centres worldwide in order
to try and compare local emergency workloads with those internationally. In Nottingham,
England it was found, that emergency surgical admissions to one firm (surgical unit) in 1979
constituted half of the overall workload.12
Similarly in an audit done in a District General
Hospital (Whipps Cross Hospital, North East London) over the course of 1 year it was found
that out of 1060 patients population, 652 (62%) required operative management.13
Interestingly, the conclusions derived from these audits mentioned concerns for the quality of
care which patients were receiving as well as the level of training provided to the surgical
registrars. Only 30.2% of the patients in the Nottingham study were operated on within 48
hours leading to the assumption that surgical trainees are not gaining the experience needed
in the management of emergency surgical cases.12
Whipps Cross Hospital concluded that
9
management could be improved by provision of more adequate facilities. They also warned
that reducing staff or bed numbers without due consideration to the suggested restructuring
may lead to a significant reduction in patient care.13
Prior to undertaking the current
investigation it was anticipated that patient loads at CMJAH might be greater than those at
other large hospitals internationally. A representative article was sought in the US, UK and
Australia. The only suitable article found was in the Department of Surgery at the Royal
Devon and Exeter Hospital (UK), where a total of 19 931 surgical emergencies were admitted
in 7 study years spread over a 25 year period.14
This will be enlarged on in the discussion
chapter.
1.3.2 Objective
The objective of the current retrospective audit was to determine the total surgical load
indicated by admissions and operations in the four surgical areas/ wards at CMJAH over one
year.

10
CHAPTER 2. MATERIALS AND METHODS
2.1 Definitions
For the purposes of this study the following definitions have been used:
Emergency admissions- is the term used to describe any unplanned or
unbooked admission to hospital
Emergency operation- would be any operative procedure which is unplanned
or unbooked
Occasionally the term “urgent” will be used to describe a surgical procedure or
admission. This usually indicates that the surgical operation or admission must
happen within a few hours (usually not more than 24hrs,) but that the condition for
which the patient is being admitted or operated on does not necessarily warrant
immediate attention. The intervening time will allow for some degree of planning or
adjunctive management prior to intervention.
Non-emergency admissions and operations- these are admissions or
procedures which are pre-planned/ booked for a certain time/date in the future.
The waiting list for non-emergency admissions and operations is also subject
to change/reshuffling on occasions when there have been so many
emergencies that there is no more space to admit the non-emergency cases.
Unit- this term is used to describe a particular ward or area within the hospital
which has specific roles and responsibilities to perform. For example the
vascular unit is ward 395 and its patients (some of whom may actually be
managed in a different ward such as the intensive care unit,) the purpose of the
vascular unit is to manage and oversee the hospital stay of any patients with
vascular disorders which are surgical in nature. The work of the doctors within

11
a unit is not however restricted to one ward/ area in the hospital as they will be
required to work in the emergency areas, theatres, wards etc.
2.2 Study design
This is a retrospective audit of surgical loads at the CMJAH. Prior to starting the audit, ethics
clearance (no M….) was obtained from the Human Research Ethics Committee (Medical) of
the University of the Witwatersrand (Appendix A). Owing to the fact that the title was
changed after ethics clearance had been obtained, a notification to the ethics committee was
made and accepted.
2.2.1 Source of data
In the Department of Surgery at CMJAH, statistics are captured onto computer at the weekly
patient Morbidity and Mortality (M&M) meetings. Once appropriate permissions had been
obtained from the department and hospital, these statistics were downloaded from the
computer in the Department of Surgery.
2.2.2 Study population
All data for the period 29 December 2008- 28 December 2009 (52 calendar weeks) were
captured. The study population included all patient admissions and operations captured for
this period.
2.3 Data analysis
Data was initially captured onto Excel spread sheets and then analysed using the Statistical
Analysis System (SAS for Windows version 9.1; SAS Institute Cary. NC, USA). Statistical
tests used in SAS were the frequency, univariate, general linear models analyses and Tukey‟s
12
multiple comparison. In addition X-Y plots and linear regression analysis were done using
Prism 4 (Graph Pad Inc, San Diego CA, USA). Statistical significance was set at P < 0.05.
2.4 Methodology
Weekly data for the year 29 Dec 2008 – 28 Dec 2009, were recorded in the Excel spread
sheet under the following headings:
Week (1 – 52)
Ward (163, 394, 395, 396)
Then the absolute weekly totals for
Emergency admissions
Non – emergency admissions
Total admissions
Emergency operations
Non – emergency operations
Total operations
Consultants
Senior registrars
Junior registrars /medical officers
Total doctors
In the analysis of data, yearly trends were plotted as emergency and total admissions and
operations X-Y plots. Thereafter a seasonal trends analysis was done to compare emergency,
non-emergency and total admissions and operations. For ease of comparison all three tables
per heading are shown. However parametric tests were applied only to the emergency data so
that it would be in keeping with the main theme of this report.
13
CHAPTER 3. RESULTS: ADMISSIONS- YEARLY TRENDS
3.1 Introduction
An intention of this study was to record the number of doctors working in the units on a
weekly basis so that doctor - patient ratios could be calculated. It was found, however, that
the departmental data recorded the number of doctors assigned to each unit but did not
indicate the number of doctors actually on duty and working in the unit on a daily basis. Thus
the analysis of the number of working doctors and the calculation of doctor - patient ratios
proved impossible, and this objective was eliminated.
3.2 Area 163 (Trauma unit)
This is the admissions area for the trauma unit at the CMJAH.
The following figure (Figure3.1) is a plot of all admissions to area 163 during the 52 week
study period together with the linear regression line. In this area all admissions are
emergencies.
For most of the year the admissions were approximately 200 – 220 per week varying
throughout the year. The lowest recorded minimum one week was 160 admissions and the
highest was 371 around the New Year. The plot shows irregular variations and a secular trend
of a slight increase from beginning to end of the year. The linear regression analysis was not
statistically significant.

14
Area 163 - trauma
0 2 4 6 8 10 12 14 16 18 20 22 24 26 28 30 32 34 36 38 40 42 44 46 48 50 52
0
50
100
150
200
250
300
350
400All admissions are emergencies (linear regression P=0.0825)
Week
Nu
mb
er
of
ad
mis
sio
ns
Figure 3.1 Admissions for area 163 by week
3.3 Ward 394 (General surgery)
As this is a general surgical ward, some of the admissions are emergencies and some are pre-
planned admissions (non-emergencies.) Total admissions for ward 394 are shown on the
upper plot of Figure3.2.

15
Ward 394 - general surgery, breast, thyroid
0 2 4 6 8 10 12 14 16 18 20 22 24 26 28 30 32 34 36 38 40 42 44 46 48 50 52
0
5
10
15
20
25
30
35
40
45Emergency admissions (linear regression P=0.1328)
Total admissions (linear regression P=0.0967)
Week
Nu
mb
er
of
ad
mis
sio
ns
Figure 3.2 Total and emergency admissions for ward 394 by week
The total admissions vary between 7 and 43 with a rounded mean of 23 admissions per week.
Visually the rates are lowest between weeks 26 and 38 and highest between weeks 40 and 50.
There is a slight secular trend increase over the study period which is not statistically
significant
Emergency admissions 394 are shown as the lower plot in Figure3.2.They vary between 0
and 26 admissions with a mean of approximately 13 per week. The variations follow the total
admission patterns. Distances between the two plots are due to the non-emergency
admissions. The general yearly secular trend follows that of the total admissions, and is not
statistically significant.

16
3.4 Ward 395 (Vascular surgery)
This ward is a specialist facility for vascular surgery patients. Total admissions are shown in
Figure 3.3(upper plot). There are two peak periods; weeks 1 – 12 and 32 – 38. The secular
trend during the year is downwards but was not statistically significant.
Ward 395 - vascular surgery
0 2 4 6 8 10 12 14 16 18 20 22 24 26 28 30 32 34 36 38 40 42 44 46 48 50 52
0
2
4
6
8
10
12
14
16
18
20
22
24 Emergency admissions (linear regression P<0.0001)
Total admissions (linear regression P=0.3578)
Week
Nu
mb
er
of
ad
mis
sio
ns
Figure 3.3 Total and emergency admissions for ward 395 by week.
Emergency admissions for ward 395 are shown in the lower plot in Figure3.3. There is an
increase in the secular trend over the year of study which ranges from a weekly intake of
about 3 patients at the beginning of the year to about 9 patients at the end. The variations in
weeks 1 – 14 do not resemble the total admissions plots for the same period. The linear
regression shows a highly statistically significant trend (p < 0.0001).
17
3.5 Ward 396 (General surgery)
This is the second of the 2 general surgical wards which is responsible for the management of
both emergency and non-emergency admissions. Total admissions are in Figure3.4 below
indicated by the unbroken line plot. Variations are lowest between weeks 19 and 26; there are
two peaks at weeks 34 – 38 and 45 – 47. During the study period a slight increase in the
secular trend of the total number of admissions was noted. Although this was not statistically
significant, it should be mentioned that in the last 20 weeks of the study period the total
number of admissions to this ward are closely aligned with the number of emergency
admissions, indicating that very few non-emergency admissions were managed during this
time.
Emergency admissions for ward 396 are plotted on Figure 3.4 (the broken line). There is
quite a wide variation in actual numbers of emergency admissions in this ward from a
minimum of 0 per week to a maximum of 35 in one week. Despite this variation, the slight
general upward trend shown is not statistically significant.

18
Ward 396 - general surgery, oncology, gastro-intestinal
0 2 4 6 8 10 12 14 16 18 20 22 24 26 28 30 32 34 36 38 40 42 44 46 48 50 52
0
5
10
15
20
25
30
35
40 Emergency admissions (linear regression P=0.3801)
Total admissions (linear regression P=0.7694)
Week
Nu
mb
er
of
ad
mis
sio
ns
Figure3.4 Total and emergency admissions for ward 396 by week

19
CHAPTER 4. RESULTS: ADMISSIONS- SEASONAL TRENDS
4.1 Introduction
It is anecdotal that certain emergencies, particularly trauma, show seasonal variations. In
chapter 3 the secular trends for emergency admissions increased, one of which was
statistically significant. While this increase was towards the end of the year suggesting that
Summer is the busiest time, the first few weeks of the year are also Summer. Thus, the data
for the current study has been stratified into seasons to examine whether certain seasons are
busier than others.
4.2 Materials and methods
Subdividing a year into seasons is complicated, many methods exist. The conventional
seasonal calendar dates suggested on the website of the South African Weather Service was
used.15
The dates were corrected into the weeks of the study using a standard South African
diary; all South African diaries use the same week numbering system.
Table 4.1 Calendar weeks by season used in this study.
SEASON CALENDAR WEEKS
Spring Weeks 36 – 48 (total 13 weeks)
Summer Weeks 1 – 8 and 49 – 52 (total 12 weeks)
Autumn Weeks 9 – 21 (total 13 weeks)
Winter Weeks 22 – 35 (total 14 weeks)
There were occasional weeks where data was not recorded by the Department of Surgery
during the M&M meeting, thus the number of weeks in sections of the study does not always
add up to 52.

20
Statistical evaluation for the effect of season was applied to emergency admissions. First a
Shapiro-Wilk test for normality was applied. This showed that the emergency admissions had
a Gaussian distribution, so parametric statistics could be used. The two parametric tests used
used were the general linear models analysis followed by Tukey‟s multiple comparison test.
The level of statistical significance was set at P<0.05.
4.3 Area 163 Admissions
Table 4.2 below shows the admissions for area 163 by season. This is the total admissions for
this area because all admissions are emergencies in the trauma unit.
Table 4.2 Seasonal trends for all admissions to area 163 (trauma)
No of
weeks
mean SD Median Minimum Maximum
Spring 12 235 23.4 231 208 284
Summer 12 243 56.1 240 160 371
Autumn 11 215 29.9 203 176 254
Winter 14 216 25.4 215 182 267
Spring and summer were the busiest seasons with an extra 20 – 30 admissions per week than
in autumn and winter but the general linear models analysis showed no statistical effect for
season (F=1.92; P=0.1397.)
4.4 Ward 394 Admissions
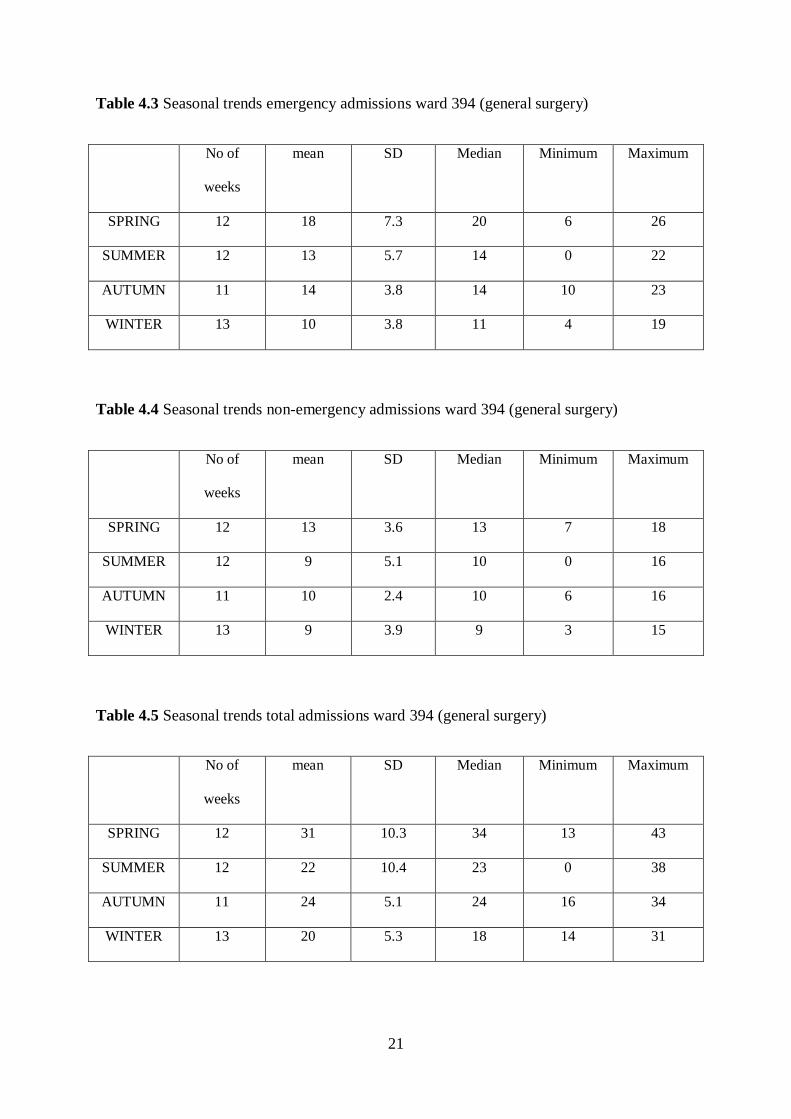
The three groupings of admissions are shown for emergency (Table 4.3), non-emergency
(Table 4.4), and total admissions (Table 4.5).
21
Table 4.3 Seasonal trends emergency admissions ward 394 (general surgery)
No of
weeks
mean SD Median Minimum Maximum
SPRING 12 18 7.3 20 6 26
SUMMER 12 13 5.7 14 0 22
AUTUMN 11 14 3.8 14 10 23
WINTER 13 10 3.8 11 4 19
Table 4.4 Seasonal trends non-emergency admissions ward 394 (general surgery)
No of
weeks
mean SD Median Minimum Maximum
SPRING 12 13 3.6 13 7 18
SUMMER 12 9 5.1 10 0 16
AUTUMN 11 10 2.4 10 6 16
WINTER 13 9 3.9 9 3 15
Table 4.5 Seasonal trends total admissions ward 394 (general surgery)
No of
weeks
mean SD Median Minimum Maximum
SPRING 12 31 10.3 34 13 43
SUMMER 12 22 10.4 23 0 38
AUTUMN 11 24 5.1 24 16 34
WINTER 13 20 5.3 18 14 31

22
Emergency admissions per week were low with little change between the seasons. No
statistically significant effect for season was noted. In this case the general linear models
analysis showed a statistically significant effect for season (F = ; P = ). Forward 394 each
season differed significantly at P < 0.05 from the other in the following descending order
Spring – Winter; Spring – Summer ;Spring – Autumn; Autumn – Winter; Summer – Winter;
Autumn – Summer. Thus, Spring was significantly busier than other seasons, a similar trend
to Autumn.
4.5 Ward 395 Admissions
The following three tables show the seasonal admissions to ward 395 (vascular surgery).
Table 4.6 shows the seasonal trends in the emergency admissions, Table 4.7 shows the
seasonal trends in the non-emergency admissions, and Table 4.8 shows the seasonal trend for
the total admissions.
Table 4.6 Seasonal trends emergency admissions ward 395 (vascular surgery)
No of
weeks
mean SD Median Minimum Maximum
SPRING 12 7 2.7 7 3 12
SUMMER 11 6 2.7 5 3 10
AUTUMN 12 3 2.3 3 0 8
WINTER 14 7 2.8 6 4 12
23
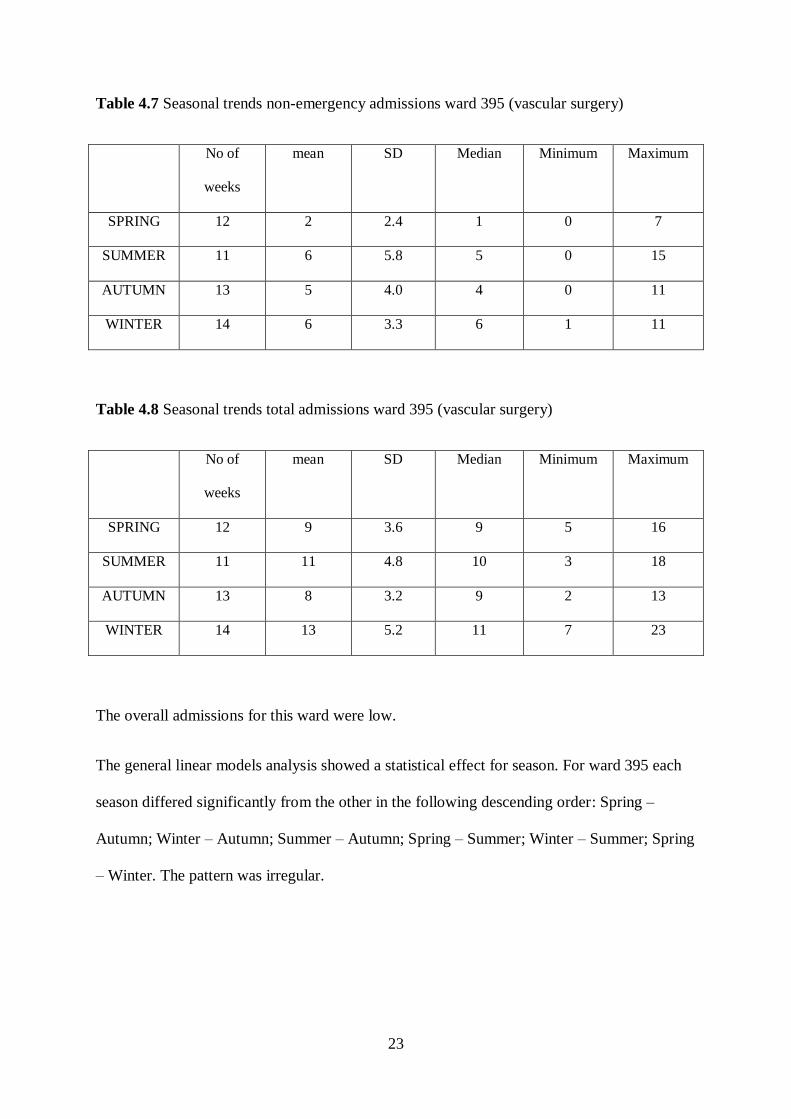
Table 4.7 Seasonal trends non-emergency admissions ward 395 (vascular surgery)
No of
weeks
mean SD Median Minimum Maximum
SPRING 12 2 2.4 1 0 7
SUMMER 11 6 5.8 5 0 15
AUTUMN 13 5 4.0 4 0 11
WINTER 14 6 3.3 6 1 11
Table 4.8 Seasonal trends total admissions ward 395 (vascular surgery)
No of
weeks
mean SD Median Minimum Maximum
SPRING 12 9 3.6 9 5 16
SUMMER 11 11 4.8 10 3 18
AUTUMN 13 8 3.2 9 2 13
WINTER 14 13 5.2 11 7 23
The overall admissions for this ward were low.
The general linear models analysis showed a statistical effect for season. For ward 395 each
season differed significantly from the other in the following descending order: Spring –
Autumn; Winter – Autumn; Summer – Autumn; Spring – Summer; Winter – Summer; Spring
– Winter. The pattern was irregular.
24
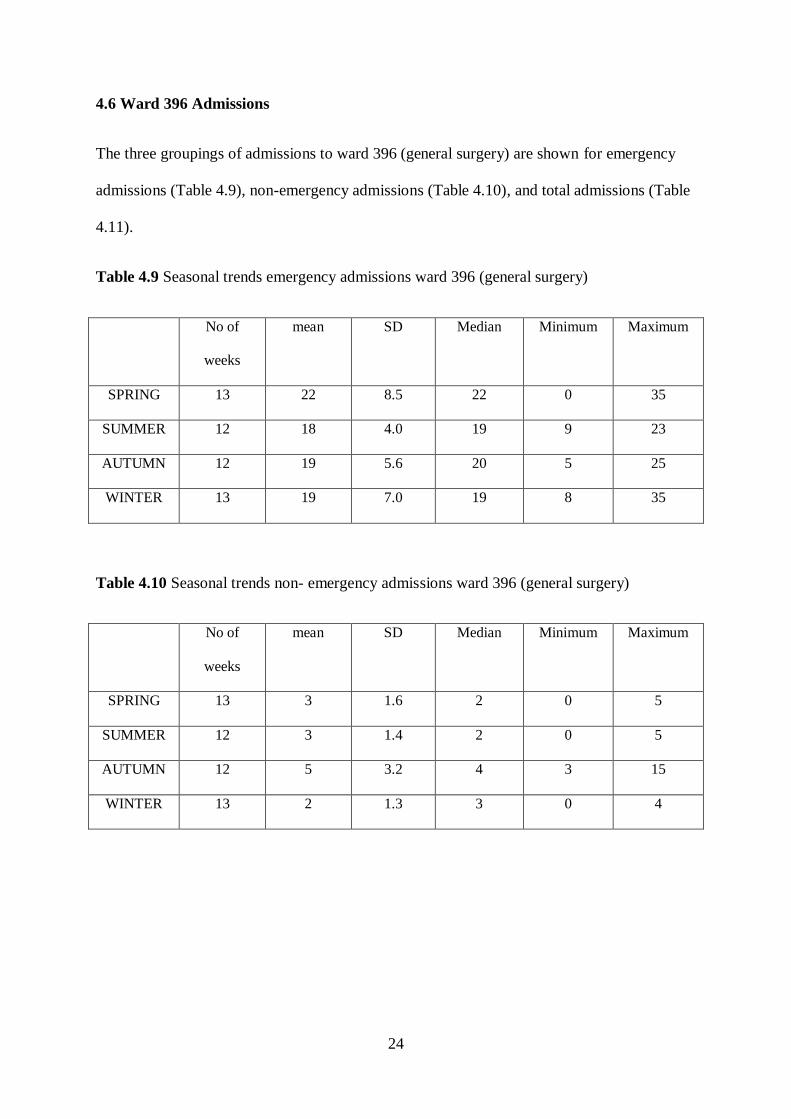
4.6 Ward 396 Admissions
The three groupings of admissions to ward 396 (general surgery) are shown for emergency
admissions (Table 4.9), non-emergency admissions (Table 4.10), and total admissions (Table
4.11).
Table 4.9 Seasonal trends emergency admissions ward 396 (general surgery)
No of
weeks
mean SD Median Minimum Maximum
SPRING 13 22 8.5 22 0 35
SUMMER 12 18 4.0 19 9 23
AUTUMN 12 19 5.6 20 5 25
WINTER 13 19 7.0 19 8 35
Table 4.10 Seasonal trends non- emergency admissions ward 396 (general surgery)
No of
weeks
mean SD Median Minimum Maximum
SPRING 13 3 1.6 2 0 5
SUMMER 12 3 1.4 2 0 5
AUTUMN 12 5 3.2 4 3 15
WINTER 13 2 1.3 3 0 4
25
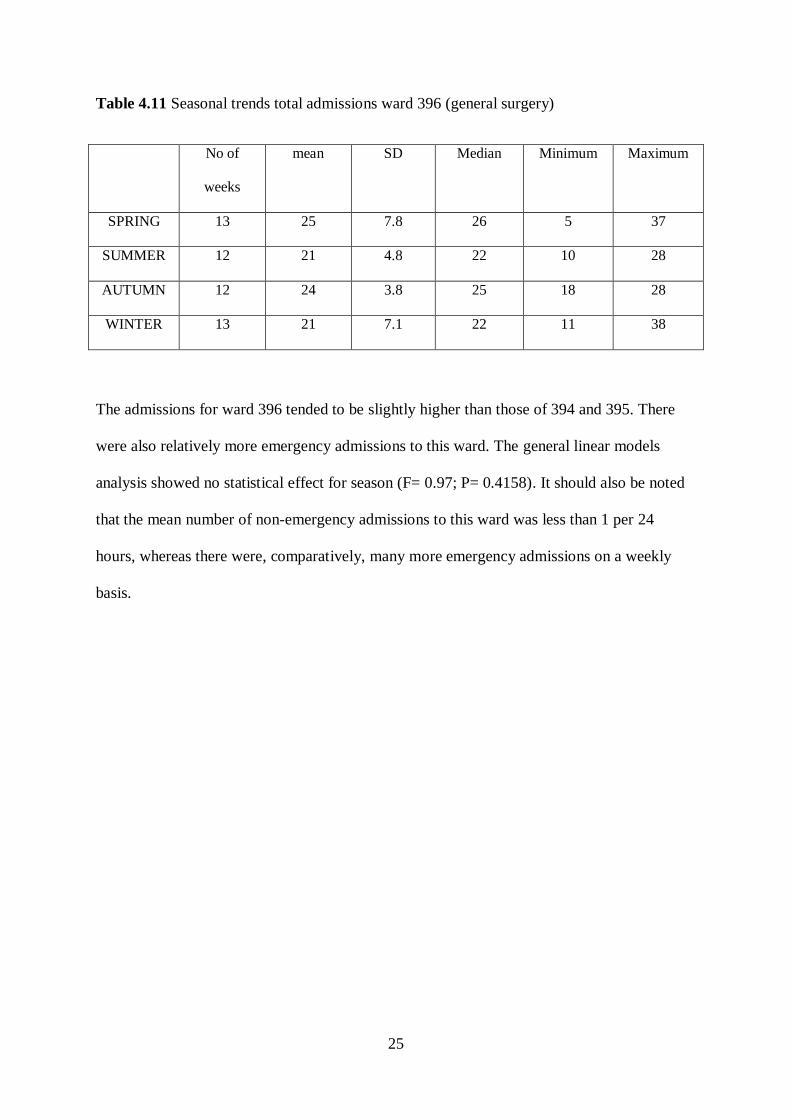
Table 4.11 Seasonal trends total admissions ward 396 (general surgery)
No of
weeks
mean SD Median Minimum Maximum
SPRING 13 25 7.8 26 5 37
SUMMER 12 21 4.8 22 10 28
AUTUMN 12 24 3.8 25 18 28
WINTER 13 21 7.1 22 11 38
The admissions for ward 396 tended to be slightly higher than those of 394 and 395. There
were also relatively more emergency admissions to this ward. The general linear models
analysis showed no statistical effect for season (F= 0.97; P= 0.4158). It should also be noted
that the mean number of non-emergency admissions to this ward was less than 1 per 24
hours, whereas there were, comparatively, many more emergency admissions on a weekly
basis.

26
CHAPTER 5. RESULTS: OPERATIONS- YEARLY TRENDS
5.1 Introduction
As was done for the annual trends for admissions, the emergency and total operations were
recorded and plotted together with a linear regression analysis.
5.2 Area 163 (Trauma unit)
Although admissions to the trauma unit are all emergencies, many of the operations which
are performed are “relook” procedures which follow after the initial emergency “damage
control” type operation. For this reason, there will be a certain number of operations which
are considered as pre-booked/planned operations despite the „emergency‟ nature of the
trauma unit setting. Therefore in this analysis two x-y plots will be shown on the graph
instead of the single plot shown for the admissions analysis.
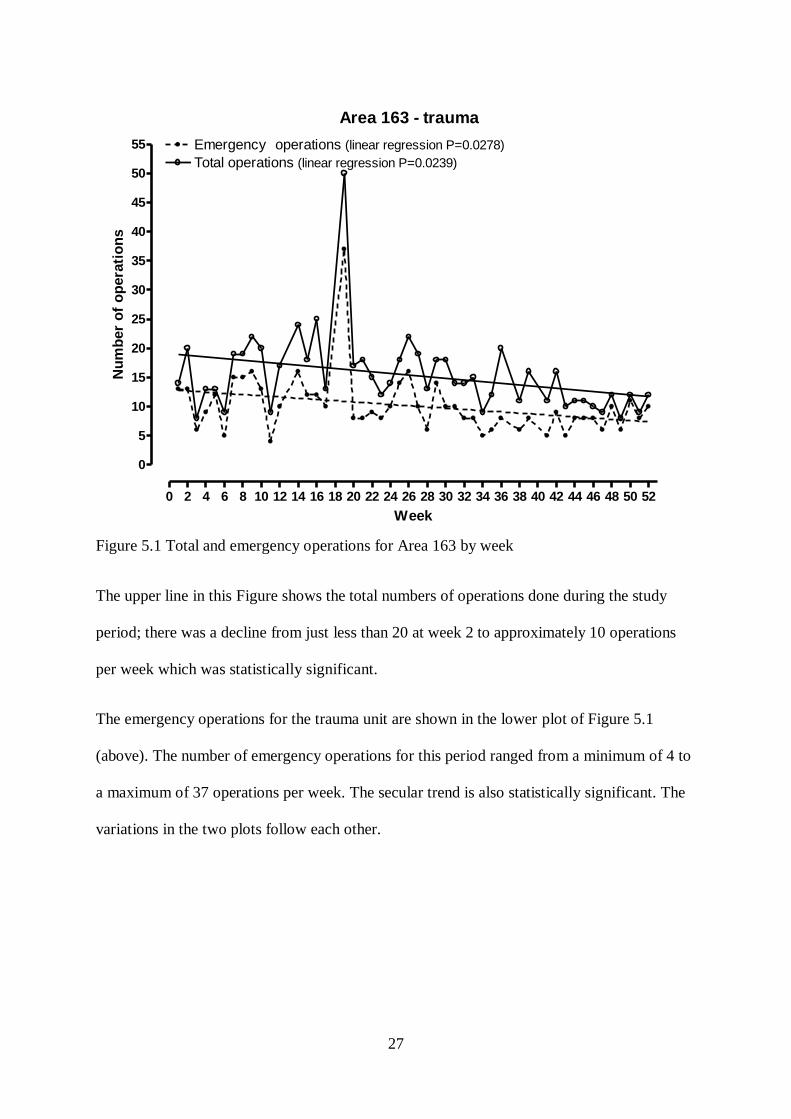
Figure 5.1 depicts all operations performed in the trauma unit during the 52 week study
period.
27
Area 163 - trauma
0 2 4 6 8 10 12 14 16 18 20 22 24 26 28 30 32 34 36 38 40 42 44 46 48 50 52
0
5
10
15
20
25
30
35
40
45
50
55 Emergency operations (linear regression P=0.0278)
Total operations (linear regression P=0.0239)
Week
Nu
mb
er
of
op
era
tio
ns
Figure 5.1 Total and emergency operations for Area 163 by week
The upper line in this Figure shows the total numbers of operations done during the study
period; there was a decline from just less than 20 at week 2 to approximately 10 operations
per week which was statistically significant.
The emergency operations for the trauma unit are shown in the lower plot of Figure 5.1
(above). The number of emergency operations for this period ranged from a minimum of 4 to
a maximum of 37 operations per week. The secular trend is also statistically significant. The
variations in the two plots follow each other.

28
5.3 Ward 394 (General surgery)
Total operations for ward 394 are shown on the upper plot of Figure 5.2.
Ward 394 - general surgery, breast, thyroid
0 2 4 6 8 10 12 14 16 18 20 22 24 26 28 30 32 34 36 38 40 42 44 46 48 50 52
0
2
4
6
8
10
12
14
16
18
20
22
24
26
28
30
32
34Emergency operations (linear regression P=0.0004)
Total operations (linear regression P=0.0179)
Week
Nu
mb
er
of
op
era
tio
ns
Figure 5.2 Total and emergency operations for ward 394 by week
Many high peaks can be seen during the course of the year of study with a statistically
significant downward trend during the study period.
Emergency operations for ward 394 are shown as the lower plot in Figure 5.2.The maximum
recorded emergency operations in one week were 19, with a minimum of 3. The linear
regression analysis for the downward secular trend is also statistically significant.
29
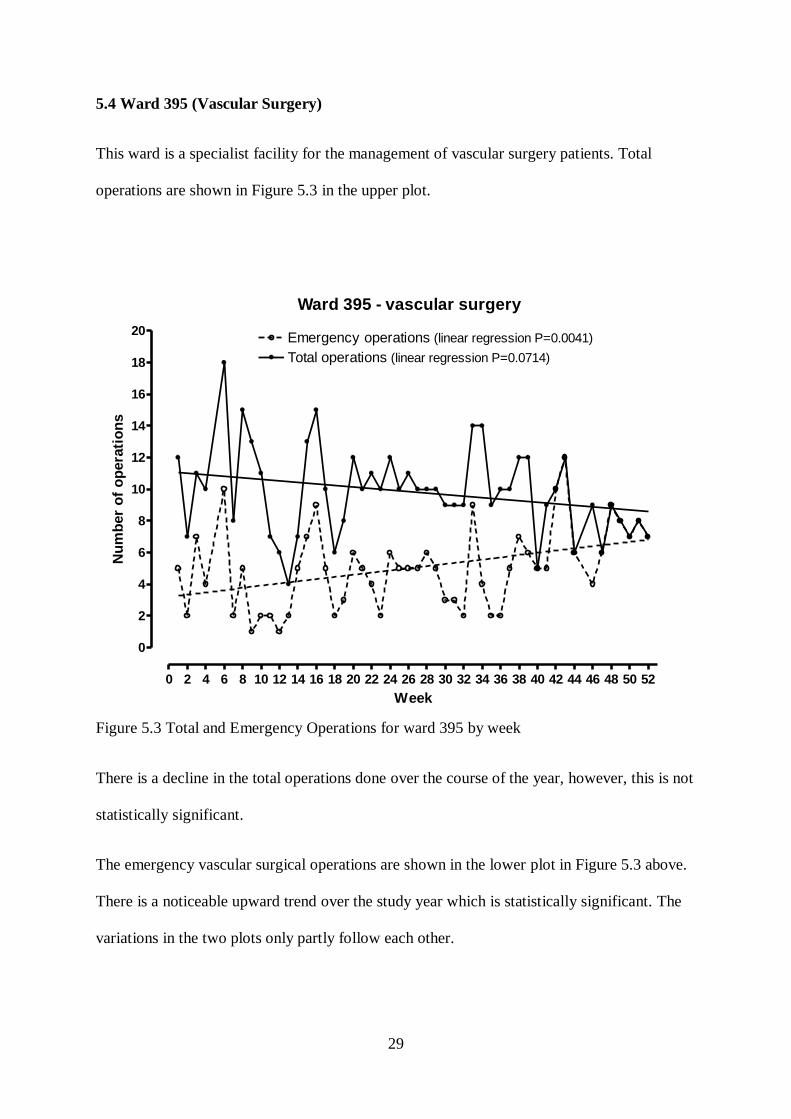
5.4 Ward 395 (Vascular Surgery)
This ward is a specialist facility for the management of vascular surgery patients. Total
operations are shown in Figure 5.3 in the upper plot.
Ward 395 - vascular surgery
0 2 4 6 8 10 12 14 16 18 20 22 24 26 28 30 32 34 36 38 40 42 44 46 48 50 52
0
2
4
6
8
10
12
14
16
18
20Emergency operations (linear regression P=0.0041)
Total operations (linear regression P=0.0714)
Week
Nu
mb
er
of
op
era
tio
ns
Figure 5.3 Total and Emergency Operations for ward 395 by week
There is a decline in the total operations done over the course of the year, however, this is not
statistically significant.
The emergency vascular surgical operations are shown in the lower plot in Figure 5.3 above.
There is a noticeable upward trend over the study year which is statistically significant. The
variations in the two plots only partly follow each other.
30
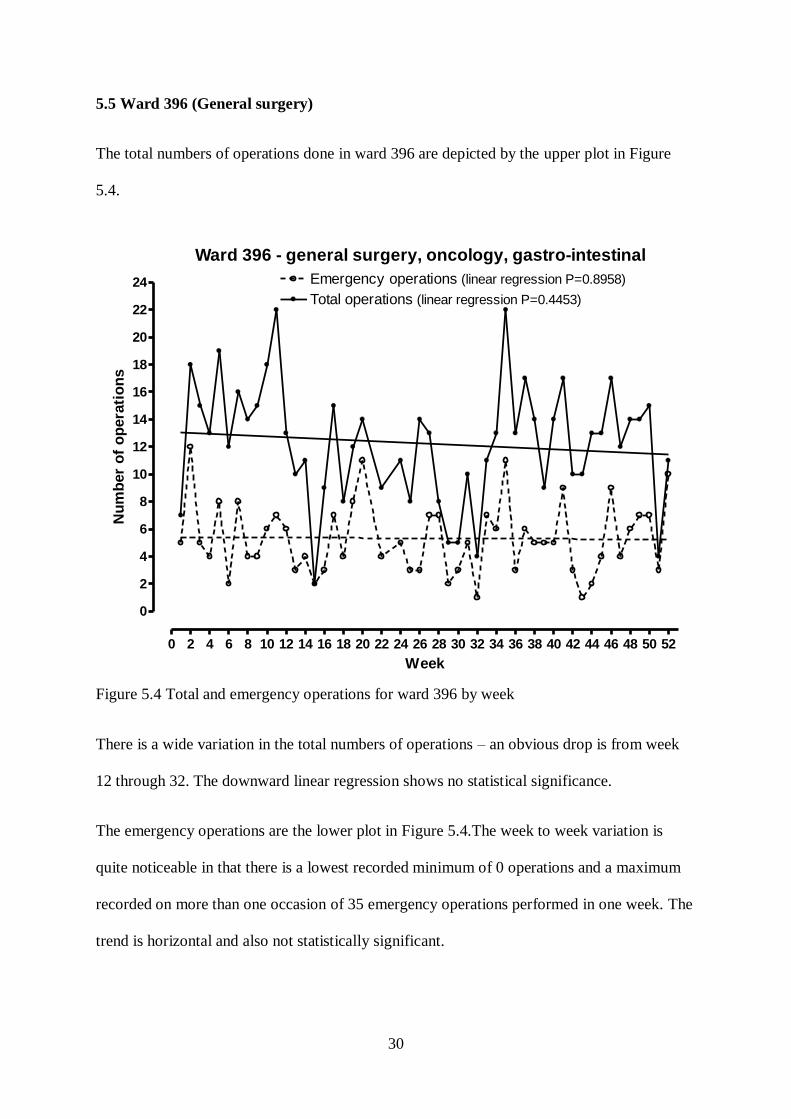
5.5 Ward 396 (General surgery)
The total numbers of operations done in ward 396 are depicted by the upper plot in Figure
5.4.
Ward 396 - general surgery, oncology, gastro-intestinal
0 2 4 6 8 10 12 14 16 18 20 22 24 26 28 30 32 34 36 38 40 42 44 46 48 50 52
0
2
4
6
8
10
12
14
16
18
20
22
24 Emergency operations (linear regression P=0.8958)
Total operations (linear regression P=0.4453)
Week
Nu
mb
er
of
op
era
tio
ns
Figure 5.4 Total and emergency operations for ward 396 by week
There is a wide variation in the total numbers of operations – an obvious drop is from week
12 through 32. The downward linear regression shows no statistical significance.
The emergency operations are the lower plot in Figure 5.4.The week to week variation is
quite noticeable in that there is a lowest recorded minimum of 0 operations and a maximum
recorded on more than one occasion of 35 emergency operations performed in one week. The
trend is horizontal and also not statistically significant.
31
CHAPTER 6. RESULTS: OPERATIONS- SEASONAL TRENDS
6.1 Introduction
In order to analyse whether seasonal operation rates mirror the admission rates, a seasonal
analysis of the operative data was done. Often the number of operations done will seem far
fewer than the number of admissions. The main reason for this is that not all emergency
admissions require operative intervention and some of those that do will only require
operation at a later stage and will therefore be classified as a planned / non-emergency
procedure.
6.2 Materials and methods
The operative data was categorised according to the seasonal calendar in the same manner as
in section 4.2.The data for the seasonal operations was analysed first with a Shapiro-Wilk test
for normality. This showed a Gaussian distribution so was followed by the general linear
models analysis and Tukey‟s multiple comparison test. The level of statistical significance
was set at P<0.05. In keeping with the emergency medicine theme of this report, the result
comments given at the end of each ward sub-section are relevant only to the emergency
operation results, the non-emergency and total operation results are given for the sake of
comparison.
6.3 Area 163 Operations
The three groupings of tables show the emergency (Table 6.1), non-emergency (Table 6.2),
and total operations (Table 6.3) for area 163 (Trauma unit)

32
Table 6.1 Seasonal trends emergency operations area 163 (trauma)
No of
weeks
mean SD Median Minimum Maximum
SPRING 12 7 2.6 8 0 10
SUMMER 12 10 3.5 11 5 15
AUTUMN 11 13 8.6 12 4 37
WINTER 14 10 3.2 10 5 16
Table 6.2 Seasonal trends non-emergency operations ward 163 (trauma)
No of
weeks
mean SD Median Minimum Maximum
SPRING 12 5 3.3 4 0 12
SUMMER 12 3 1.9 2 1 7
AUTUMN 11 8 3.1 7 3 13
WINTER 14 6 1.7 6 4 9
Table 6.3 Seasonal trends total operations ward 163 (trauma)
No of
weeks
mean SD Median Minimum Maximum
SPRING 12 11 4.8 11 0 20
SUMMER 12 13 4.3 13 8 20
AUTUMN 11 21 10.6 18 9 50
WINTER 14 15 3.4 15 9 22
33
As can be seen from theses tables the numbers of operations occurring within the trauma
environment are far fewer than the numbers of admissions to the trauma unit on a weekly
basis. The general linear models analysis showed a statistical effect for season (F = ; P = ).
Each season differed significantly from the other in the following descending order: Autumn
– Spring; Autumn – Winter; Summer – Spring; Autumn – Summer; Winter – Spring;
Summer – Winter. Autumn is therefore the busiest season.
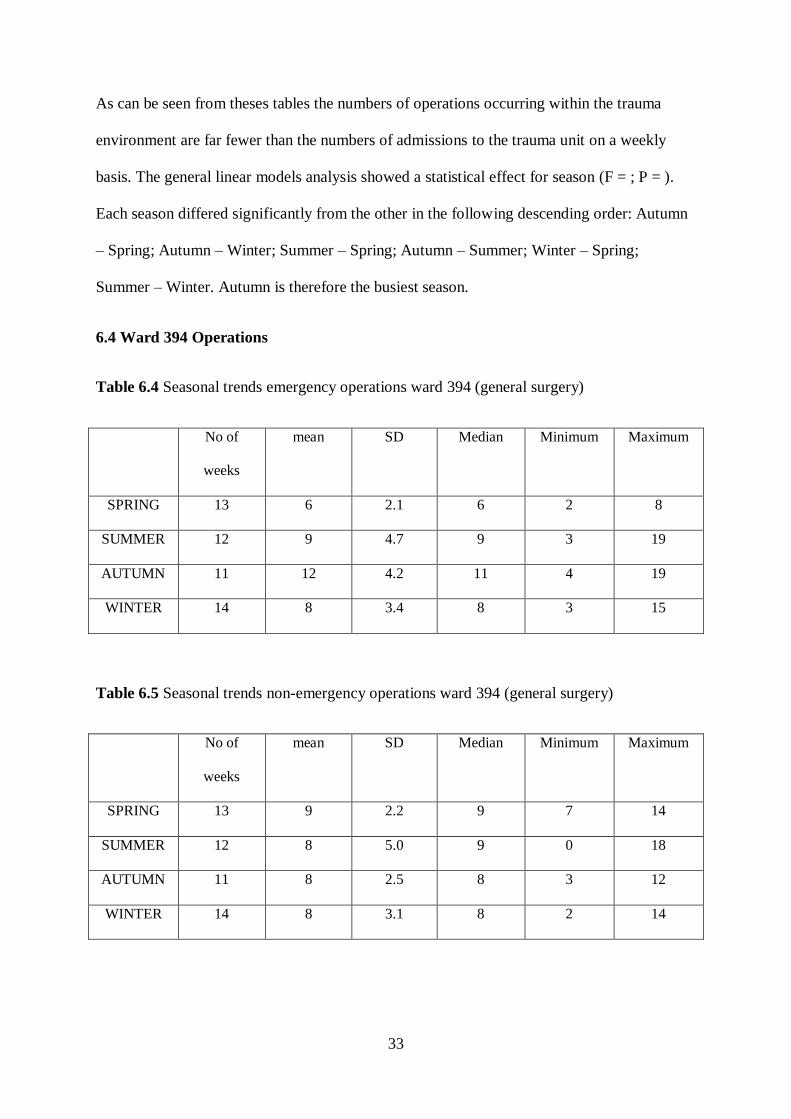
6.4 Ward 394 Operations
Table 6.4 Seasonal trends emergency operations ward 394 (general surgery)
No of
weeks
mean SD Median Minimum Maximum
SPRING 13 6 2.1 6 2 8
SUMMER 12 9 4.7 9 3 19
AUTUMN 11 12 4.2 11 4 19
WINTER 14 8 3.4 8 3 15
Table 6.5 Seasonal trends non-emergency operations ward 394 (general surgery)
No of
weeks
mean SD Median Minimum Maximum
SPRING 13 9 2.2 9 7 14
SUMMER 12 8 5.0 9 0 18
AUTUMN 11 8 2.5 8 3 12
WINTER 14 8 3.1 8 2 14

34
Table 6.6 Seasonal trends total operations 394 (general surgery)
No of
weeks
mean SD Median Minimum Maximum
SPRING 13 15 3.2 15 9 20
SUMMER 12 18 8.9 17 3 32
AUTUMN 11 19 5.4 19 11 28
WINTER 14 16 3.8 16 11 27
The mean numbers of total operations done in 394 appear to be higher than those done in
163, however this can largely be accounted for by the non-emergency cases. General linear
models analysis showed a statistical effect for season in ward 394. The seasons differed
significantly from each other in the following descending order: Autumn – Spring; Autumn –
Winter; Summer – Spring; Autumn – Summer; Winter – Spring; Summer – Winter. Spring
was the least busy period.
6.5 Ward 395 Operations
The following three tables show the emergency (Table 6.7), the non-emergency (Table 6.8),
and the total (Table 6.9) operations

35
Table 6.7 Seasonal trends emergency operations ward 395 (vascular surgery)
No of
weeks
mean SD Median Minimum Maximum
SPRING 12 6 2.7 6 2 12
SUMMER 11 6 2.5 7 2 10
AUTUMN 13 4 2.5 3 1 9
WINTER 14 4 1.9 5 2 9
Table 6.8 Seasonal trends non-emergency operations ward 395 (vascular surgery)
No of
weeks
mean SD Median Minimum Maximum
SPRING 12 3 3.0 2 0 8
SUMMER 11 4 3.7 5 0 10
AUTUMN 13 6 2.6 5 2 12
WINTER 14 6 1.5 6 4 10
Table 6.9 Seasonal trends total operations ward 395 (vascular surgery)
No of
weeks
mean SD Median Minimum Maximum
SPRING 12 9 2.4 1 5 12
SUMMER 11 10 3.6 8 7 18
AUTUMN 13 9 3.3 10 4 15
WINTER 14 11 1.7 10 9 14

36
Once again in ward 395 the mean numbers of operations tend to be lower than in the other
three wards studied. In ward 395 the general linear models analysis also showed a statistical
effect for season. Each season differed significantly from the other in the following
descending order: Spring – Autumn; Summer – Autumn; Spring – Winter; Summer – Winter;
Winter – Autumn; Spring – Summer.
6.6 Ward 396 Operations
The three groupings of tables are shown for emergency (Table 6.10), non-emergency (Table
6.11), and total admissions (Table 6.12) in ward 396.
Table 6.10 Seasonal trends emergency operations ward 396 (general surgery)
No of
weeks
mean SD Median Minimum Maximum
SPRING 13 22 8.5 22 0 35
SUMMER 12 18 4.0 19 9 23
AUTUMN 12 19 5.6 20 5 25
WINTER 13 19 7.0 19 8 35
Table 6.11 Seasonal trends non- emergency operations ward 396 (general surgery)
No of
weeks
mean SD Median Minimum Maximum
SPRING 13 3 1.6 2 0 5
SUMMER 12 3 1.4 2 0 5
AUTUMN 12 5 3.2 4 3 15
WINTER 13 2 1.3 3 0 4

37
Table 6.12 Seasonal trends total operations ward 396 (general surgery)
No of
weeks
mean SD Median Minimum Maximum
SPRING 13 25 7.8 26 5 37
SUMMER 12 21 4.8 22 10 28
AUTUMN 12 24 3.8 25 18 28
WINTER 13 21 7.1 22 11 38
In ward 396 the emergency operations and total operations were high compared to the other
wards however there appeared to be far fewer no-emergency cases in this ward. General
linear models analysis showed no statistical effect for season (F= 0.78; P= 0.5117.)
38
CHAPTER 7. DISCUSSION
7.1Principal Findings
South Africa is well known for having high levels of trauma particularly interpersonal
violence and road traffic accidents – approximately 1 million annual trauma cases reported by
68 % of hospital responding to headcount questionnaires. 75 % of these cases were treated in
State hospitals.16
The findings of the current investigation indicate that there is certainly a
very high trauma admission load at CMJAH which is one of the large State hospitals and is
classified as a quaternary hospital. Relatively, the non-trauma emergency surgical cases were
not as high but did show that they form a substantial number of the overall vascular and
general surgery admissions. For this reason it would be useful to have some guidance in
terms of the recommended number of doctors allocated to the trauma unit and other general
surgical wards.
Norms and standards for the doctor patient ratios have been taken from the Department of
Health website – Modernisation of tertiary services document appendix 4 of framework 0617
Norms described in the above mentioned document are as follows:
• Vascular surgery – 2 vascular surgeons and 2 registrars for a unit which does 400
operations p.a. with the addition of 2 vascular surgery fellows for a unit which does 1000
operations p.a.
• General surgery – for tertiary general surgery the recommended norm is one specialist
per 12 beds. There are no norms for the numbers of registrars provided in this document;
however the point is made that we should be developing our own norms appropriate for the
South African context.

39
• Trauma is considered as a branch of general surgery and therefore whilst there have
been no separate norms and standards listed, the same norms and standards can be applied to
the trauma unit as to the general surgery units.
• The norms set down for Intensive care unit (ICU) are set out in terms of bed numbers.
An ideal ICU in a Provincial tertiary hospital should have 12 beds.
The trauma ICU at CMJAH has 8 beds and very often extra beds have to be sought in other
ICU‟s in the hospital because the trauma ICU is full. General surgical patients who require
ICU care are usually sent to the general ICU in block 5 of the hospital. This ICU has 12 beds
but as it is a general ICU and as such is not dedicated to surgical patients only. There is
frequently a scenario where the all ICU beds are full and therefore trauma patientshave to be
hospitalised in the emergency resuscitation area in area 163. Should this be the case, ordinary
emergency trolleys are used as patient beds which can cause serious difficulties in nursing
care, limited access to the patients in terms of space constraints and medical problems such as
the development of pressure sores.
Other surgical loads were sought for the purposes of comparing the data collected at CMJAH
to other countries. The difficulties encountered were that very few areas recorded only the
surgical loads. Many places recorded general emergency department loads and yet others
recorded loads which were symptom or diagnosis related. Some examples of surgical loads in
other countries will be included later on in the discussion.
7.1.1 Admissions
The total emergency admissions shown in chapter 3 for all four wards combined were 13032
for 2009 of which 11221 (86.1%) were trauma admissions, indicating how large the trauma
40
load component is in comparison to the emergency surgical admissions in the other 3 wards
combined (1811; 13.9%).
The burden of trauma on the hospital is known to be extremely heavy and is one of the
reasons why a dedicated trauma unit has been developed. This allows for round the clock on-
site medical officer, registrar and consultant cover which at this stage is something that the
other 3 units cannot feasibly provide. Space is however a big problem for the trauma unit.
Once the ICU beds are all full, the emergency area is taken over by the ICU patients for
whom there are no beds. This in turn limits the space available for resuscitation of trauma
patients. Often the trauma ward is also fully occupied and the trauma patients have to be
“outlied” to other wards in the hospital.
The total numbers of admissions in the 3 non-trauma wards are closely aligned with the
number of emergency admissions in these wards indicating that many if not all of the total
admissions for a particular week are in fact emergency admissions. This can have an
important impact on the quality of care delivered to the emergency patients who may have to
wait several hours before being attended to by the doctor on duty. It also affects the care of
the booked patients whose planned admissions and subsequent operations may have to be
delayed if the emergency cases admitted take up all of the ward space and operative time.
This might be indicative that a new system needs to be implemented; one in which a
restructuring of the existing units and staff can be considered in order to try and alleviate the
surgical burden placed on the facilities and the staff members.
The highest number of admissions recorded in the trauma unit happened around the time of
the New Year celebrations with a drastic fall to the lowest number of admissions two weeks
later. This was then followed by a steady linear increase in admission numbers towards the
end of the study period.
41
Conversely, the two general surgical wards (394 and 396) showed peaks in the number of
admissions in late winter and early spring with a much quieter time during the festive season.
This is probably due to the fact that elective (planned) operative lists do not run over the
festive season and only emergency patients and cancer patients are admitted and operated on
during this time.
The vascular surgery unit (ward 395) showed a marked spike in the total number of
admissions in the third quarter of the year. This may be seasonally related but also may be
due to closure of one of the feeder hospitals resulting in the unit having to take on many extra
patients. It should be noted that there are several feeder hospitals and that many of the
vascular surgery admissions are referrals from these hospitals.
Although the seasonal analysis of the data shows that trauma admissions are highest in
summer and lowest in winter with slightly more admissions in spring than in autumn, the
mean values are all over two hundred trauma admissions per week in all seasons indicating a
very high work load for the doctors in the trauma unit. Surgical admissions show a different
trend. Given that the total patient admissions for the 3 surgical wards are still less than those
for the trauma unit, there is an overall extra burden of patient numbers in the summer.
7.1.2 Operations
With regard to the operative trends shown, for the trauma unit, these were fairly consistent
throughout the year (about 15 patients per week on average) with one week (week 19)
showing a huge increase in the total (50) and emergency operations (37) . No reason was
apparent for this sudden spike but may also be due to closure of one of the associated feeder
hospitals as this is an occurrence which occurs quite frequently in the trauma context. It was
also noted that this spike coincided with the Easter holidays and this was thought to have
contributed to the increase in trauma related operations during this period. There was a

42
statistically significant decline in both the total and emergency operations performed over the
study period for the trauma unit. It should also be mentioned that the total numbers of
operations performed in the trauma unit is low in comparison to the numbers of admissions
seen in this unit. This is in keeping with a more conservative philosophy which has resulted
in a worldwide trend towards the non-operative management of trauma patients as previously
commented on in the literature review.
Ward 394 showed some examples of substantial week to week variation in operative trends.
The quietest operative period was revealed to be between weeks 24 and 38. This indicated a
correlation with the admission trends which were also at their quietest in the same week
period. The downward trend shown for the emergency operations in ward 394 was shown to
be statistically significant. Although an explanation for this was sought no definitive answer
was found. Possibilities include more operations being performed at feeder hospitals or staff
issues and available theatre time at CMJAH (which occur on an ongoing basis.)
In ward 395 there was a linear increase in the number of emergency operations performed as
the year progressed, whereas the total number of operations decreased over the same period.
This is an interesting occurrence which echoes the admission trends in the vascular ward but
the reason for this is unclear at this stage and is postulated to be due to difficulties with
transfer of patients from feeder hospitals.
Although total operations and emergency operations were fairly constant throughout the year,
in ward 396, there were 2 peaks in the total operations during the year. The first peak in week
12 did not show a corresponding increase in the number of emergency operations so this was
probably due to an increase in the booked cases. The second peak was mirrored by a peak in
the emergency operations in week 36 and was shown to be the week in which the highest
number of emergency cases was admitted. Reasons such as changeover of staff and registrar
43
exams may also account for spikes such as this. The overall downward trend in total
operations and the horizontal trend in emergency operations were not statistically significant.
In terms of seasonal analysis, there was very little consistency shown between the 4 wards.
The highest seasonal emergency operation rates for trauma were found to be during the
autumn, for 394 during summer and autumn, for 395 during spring and for 396 during winter
and spring. The small number of emergency operations for each ward would probably
account for these findings appearing to be somewhat random. It is interesting to note that
whilst the weekly trauma admissions are far higher than those in any of the other three wards,
the numbers of operations are not proportionally as high in comparison to the general surgical
wards, thus showing that there are a lot of trauma patients who do not proceed to operation
once they have been admitted. This could indicate a move towards the more conservative
management of trauma cases in keeping with the move towards the non-operative
management cited in the literature review.2
7.2 Strengths and Weaknesses
7.2.1 Strengths of the current study
This study has given a good indication of the overall burden of surgical disease in the
CMJAH. In particular it has outlined how extensive the burden of trauma is in this context.
It has also shown that the burden of surgical emergencies constitutes a fair proportion of the
total surgical workload in the hospital.
The seasonal analysis of surgical trends has helped to illustrate when the busiest times of the
year are for each of the four units analysed in this study and has outlined that the emergency
surgical workload has an important impact on both the operative responsibilities and the non-
emergent/booked cases in each of the four units.

44
7.2.2 Weaknesses of current study
As regards the weaknesses of this study, an accurate reflection of the exact surgical diagnosis
cannot be given and as such, the reasons for seasonal variations in disease type cannot be
identified. This means that trends - for example a seasonal increase in burns injuries during
the winter- cannot be confirmed or denied.
Another weakness of the study is that while there is good data capturing in terms of the
number of doctors assigned to each unit, this data did not reflect the actual number of doctors
on duty in the hospital at any given time. In addition to this, there was no data to show the
number of interns either allocated to or working in the units at any given time.
Lastly, it is very difficult to compare the different workloads of the doctors working in
different units. This is largely because of the differences in timetabling and shift work across
the different units. For example, in area 163 the medical officers work on a shift basis
whereas the medical officers in the general surgical wards work every day and do their
afterhours duties according to a call roster system.
7.3 Strengths and Weaknesses in relation to other studies
7.3.1 Strengths of current study
This study confirms that the burden of trauma on South African hospitals is extremely high
and in keeping with the info contained in the SA info website.16
In fact the article on this
website estimated that there were 1 million new trauma cases countrywide per year which
would mean that in 2009, CMJAH admitted 1 % of these cases.
By way of comparison other examples of surgical loads were sought. Mount Sinai Hospital
(Toronto) recorded an annual emergency department volume of 38000, 20% (7 600) of which
were trauma related and 10% (3 800) of which were surgical (non-trauma.)18
This gives a total

45
number of 11 400 cases seen in the emergency department, not all of which would have been
admitted to the hospital. The total number of cases seen in this emergency department (ED)
approximates the number of emergency admissions from only the trauma unit at CMJAH,
highlighting once again the high numbers of patients seen in the trauma unit at CMJAH. The
numbers of non-trauma surgical patients are slightly lower than the quoted number for Mount
Sinai, however the numbers quoted for Mount Sinai account for the total number of patients
seen in the ED whereas the patient population quoted in this study are admissions to the
hospital.
7.3.2 Weaknesses of current study
When attempting to compare this study to other studies, the main problem encountered was
that other seasonal analysis studies include medical emergencies together with the surgical
emergencies. Such examples include North New York General Hospital ED, with a quoted
annual ED patient volume of 63 000. This includes all specialities with no breakdown given
for surgical or trauma patients.18
Other audits and surgical loads were sought but very often
audits were done pertaining only to a given diagnosis or presenting complaint. This prevented
comparison with the current study.
7.4 Implications of the study
The main messages arising from this study are that while there are good systems in place,
particularly for the management of trauma patients at the CMJAH, there are also systems for
the management non-trauma patients which appear to be slightly cumbersome and do not use
their resources to optimal efficiency. An important suggestion therefore would be to look at
restructuring the existing resources into a more organised system of practice such as the type
of Acute Care Surgery Unit described in the literature review. This would allow for the more
efficient utilisation and deployment of staff within the units, thus reducing the burden placed

46
on the staff in terms of working hours and patient loads. The Royal Infirmary (Edinburgh)
demonstrated this through a retrospective study on operative activity following the separation
of elective and emergency surgical activity. This study showed that despite an increase in
emergency operations from 941 in 1994 to 1351 in 1999, there was a twofold reduction in
operations carried out after hours thus allowing a more optimal usage of staff resources.19
This
would also allow for better access to emergency surgical facilities and definitive emergency
surgical intervention, which would be more beneficial to both the patients requiring
emergency surgical care as well as those requiring non-emergent surgical care. Presently the
latter often have to wait weeks or even months due to the overcrowding of hospitals with
emergency cases. The implementation of Acute Care Surgery units or Surgical admission
units has also been shown to improve bed management20
, which would benefit not only the
patients with surgical emergencies but would allow for the improvement of the use of
physical resources thus indirectly benefitting the non-emergent patients as well.
One suggestion would be to remodel the existing trauma unit and redeploy some of the staff
from the other 3 wards (394,395 and 396) to the trauma unit, therefore allowing it to absorb
the burden of emergency surgical disease. Ideally one of the general surgical wards could be
reallocated to this Acute Care Unit to increase the bed allocation for the new unit.
The other three units could then potentially amalgamate to become one general surgical and
vascular unit, thus relatively speaking, increasing the staff allocation but without having the
responsibility of managing any of the emergency surgical cases- all of which would be
managed by the Acute Care Unit. This general surgical/vascular unit would then be solely
responsible for managing all non-emergent vascular and general surgical cases.
47
7.5 Unanswered questions and future research
The main question still unanswered by this particular study, is that of the exact doctor patient
ratios. In order to accurately record and analyse these statistics, a prospective data collection
would need to be undertaken, in which somebody would have to manually record the
numbers of doctors and patients present in each unit on every day.
Other future research could include feasibility studies into whether a unit such as the one
proposed above would be achievable given the current staffing structures and budgetary
constraints within the hospital system.
More research could then be done on how best to achieve the aim of creating a new Acute
Care Surgical Unit and follow up auditing of the newly implemented models.
48
REFERENCES
1. Boffard KD.The history of the trauma unit at Johannesburg Hospital.Department of
Surgery handout1999.
2. Green SM. Trauma surgery: discipline in crisis. Annals of Emergency Medicine 2009; 53:
198-207
3. The Committee to Develop the Reorganized Specialty of Trauma, Surgical Critical Care,
and Emergency Surgery. Journal of Trauma 2005; 58: 614-616
4. Søreide K. Trauma and the acute care surgery model – should it embrace or replace general
surgery? Published online Scandinavian Journal of Trauma, Resuscitation and Emergency
Medicine 2009; 17: 4 [accessed on 28 November 2011]
5. Exadaktylos AK, Velmahos GC. Emergency medicine and acute care surgery: a modern
“Hansel and Gretel” fairytale? Emergency Medicine Journal2008; 25: 321-322
6. Britt LD. Acute Care Surgery: The Curriculum should address the needs. Journal of
Surgical Education 2007; 64: 300-301
7. Kahn D, Pillay S, Veller MG, Panieri E, Westcott MJ. General surgery in crisis – factors
that impact on a career in general surgery. South African Journal of Surgery 2006; 44:
108 112.
8.Gamelli RL. Organization of faculty practice and resident training in acute care surgery in
an academic medical centre.Journal of Surgery 2007; 141: 302-303
9. Reilly PM, Schwab CW. Acute care surgery: The academic hospital‟s perspective. Surgery
2007; 141: 299-301
10. Garland AM, Riskin DJ, Brundage SI, Moritz F, Spain DA, Purtill M, Sherck JP. A
county hospital surgical practice: a model for acute care surgery. American Journal of
Surgery 2007; 194: 758-764
11. Donlon M, Cooper JC. Re-designing emergency services: The EGS system. Bulletin of
the Royal College of Surgeons 2006; 88: 166-170
12. Stower MJ, Hardcastle JD, Bourke JB.Surgical emergencies and manpower. Annals of
the Royal College of Surgeons of England 1984; 66:117-119
13. Glass RE, Thomas PA. Surgical audit in a district general hospital: a stimulus for
improving patient care. Annals of the Royal College of Surgeons of England 1987;69:135-
139

49
14. Campbell WB, Lee EJK, Van de Sijpe K, Gooding J, Cooper MJ.A 25-year study of
emergency surgical admissions. Annals of the Royal College of Surgeons of England 2002;
84: 273 – 277
15. South African Weather
Services.http://www.weathersa.co.za/web/Content.asp?contentID=52; [accessed 7 November
2011].
16. SA Health Info.www.sahealthinfo.org/violence/injurypreventionarticle.pdf [Accessed 30
November 2011]
17. Department of Health modernization of tertiary services
document.http://www.doh.gov.za/mts/docs/framework04.pdf May 2003; [accessed 19 July
2010].
18. University of Toronto Division of Emergency Medicine
website.http://www.emergencymedicine.utoronto.ca/hospitals.htm [Accessed 13 December
2011]
19. Addison PD, Getgood A, Paterson-Brown S. Separating elective and emergency surgical
care (the emergency team). Scottish Medical Journal 2001; 46: 48 - 50
20. Ortiga B, Capdevila C, Salazar A, Viso MF, Bartolome C, Cortobella X. Effectiveness of
a Surgery Admission Unit for patients undergoing major elective surgery in a tertiary
university hospital. Biomed Central Health Services Research 2010; 22: 23