chapter 1 introduction - usitc · chapter 1 introduction . ... the assessment in this report is...
TRANSCRIPT
U.S. International Trade Commission | 43
Chapter 1 Introduction Purpose This report examines the Trans-Pacific Partnership Agreement (TPP),9 a major trade agreement potentially linking the United States with 11 other parties: Australia, Brunei (Brunei), Canada, Chile, Japan, Malaysia, Mexico, New Zealand, Peru, Singapore, and Vietnam. Prepared by the U.S. International Trade Commission (Commission or USITC), the report assesses the likely impact of the TPP agreement on the U.S. economy, specific industry sectors, and U.S. consumers, as required by the Bipartisan Congressional Trade Priorities and Accountability Act of 2015.10 In particular, the statute requires the Commission to assess the likely impact of TPP on the U.S. economy as a whole and on specific industry sectors, including the impact it will have on the gross domestic product (GDP), exports, and imports; aggregate employment and employment opportunities; the production, employment, and competitive position of industries likely to be significantly affected by the TPP; and the interests of U.S. consumers.
The statute also requires the Commission to review available economic assessments of the agreement, including literature about any substantially equivalent proposed agreements. The Commission’s report should describe the analytical methods used and conclusions drawn in this literature, and it should also discuss areas of consensus and divergence between the Commission’s analyses and conclusions and those of other economic assessments reviewed.
Scope The United States already has free trade agreements (FTAs) with 6 of the other 11 TPP parties: Australia, Canada, Chile, Mexico, Peru, and Singapore. The TPP would therefore result in five new FTA partners for the United States: Brunei, Japan, Malaysia, New Zealand, and Vietnam. The agreement is likely to affect most sectors of the U.S. economy either directly or indirectly. For example, the removal or reduction in the restrictiveness of a particular tariff or nontariff measure may not only affect the sector directly exposed to the liberalization, but it may also
9 USTR, Trans-Pacific Partnership Agreement (TPP), full text, https://ustr.gov/trade-agreements/free-trade-agreements/trans-pacific-partnership/tpp-full-text. All in-text citations to TPP articles, annexes, or notes are to this version. 10 On November 5, 2015, the U.S. International Trade Commission received a letter from the U.S. Trade Representative (USTR) requesting that the Commission provide a report to the President and Congress assessing the likely impact of the TPP Agreement under section 105(c) of the Bipartisan Congressional Trade Priorities and Accountability Act of 2015 (19 U.S.C. 4204(c)). See appendix A for the request letter from the USTR.
Chapter 1: Introduction
44 | www.usitc.gov
have indirect effects on upstream and downstream sectors.11 This report will examine economy-wide effects of the TPP as well as selected sectoral effects, based on a quantitative analysis discussed further below. Per the statute, this report also includes qualitative discussion and analysis of the agreement’s effects on selected industry sectors.
These sectors were selected based on different factors, including the extent of the sector’s trade liberalization under the TPP, the importance of the sector in terms of trade with the TPP region, the apparent sensitivity of certain U.S. industries to increased trade, and industry and Commission views regarding potential sectoral effects. In total, over 20 industry sectors were analyzed and are included in this report. Agricultural sectors analyzed include dairy; sugar; beef; pork; poultry; grains; processed foods; fresh fruits, vegetables, and nuts; alcoholic beverages; and seafood. Manufacturing sectors analyzed include passenger vehicles; textiles and apparel; footwear; chemicals; and titanium metal. Services sectors analyzed include computer services; professional services; audiovisual services; express delivery; financial services, including banking and insurance; and telecommunications services. The report also includes analyses of the regulatory provisions of the TPP that would apply across sectors of the economy.
Analytical Approach The main quantitative analysis used in this report is based on simulations from a dynamic computable general equilibrium (CGE) model of trade among the 12 TPP countries and the rest of the world.12 The CGE model is based on the Global Trade Analysis Project (GTAP) model, an economy-wide CGE model of world trade specified at the sector level.13 This quantitative analysis is limited to certain aspects of the agreement, as explained below.
The simulation analysis provides effects for U.S. GDP; U.S. exports, imports, production, and consumption in the aggregate and by sector; and U.S. employment and wages by labor type (skilled vs. unskilled labor). Because of the dynamic nature of the analysis, the estimated effects capture the impact of the TPP Agreement over time from entry into force, thus differentiating the effects of immediate commitments from the effects of commitments over longer timeframes. The estimated effects also capture the reinforcing impact of the TPP Agreement on the growth of the U.S. economy during the agreement’s period of implementation.
11 An upstream sector (e.g., textiles) provides output that is used as an input by a downstream (e.g., apparel) sector. 12 Chapters 3, 4, and 5 present model results by sector for country groups, such as all TPP partners, or existing FTA partners in the TPP. Where warranted, additional detail on trade with specific partners is reported in the text. 13 The GTAP framework includes 57 sectors. Some of these sectors were further broken down, or disaggregated, while others were combined, to focus on sectors of interest. See chapter 2 and appendix G for more details.
TPP Agreement: Likely Impact on the U.S. Economy and on Specific Industry Sectors
U.S. International Trade Commission | 45
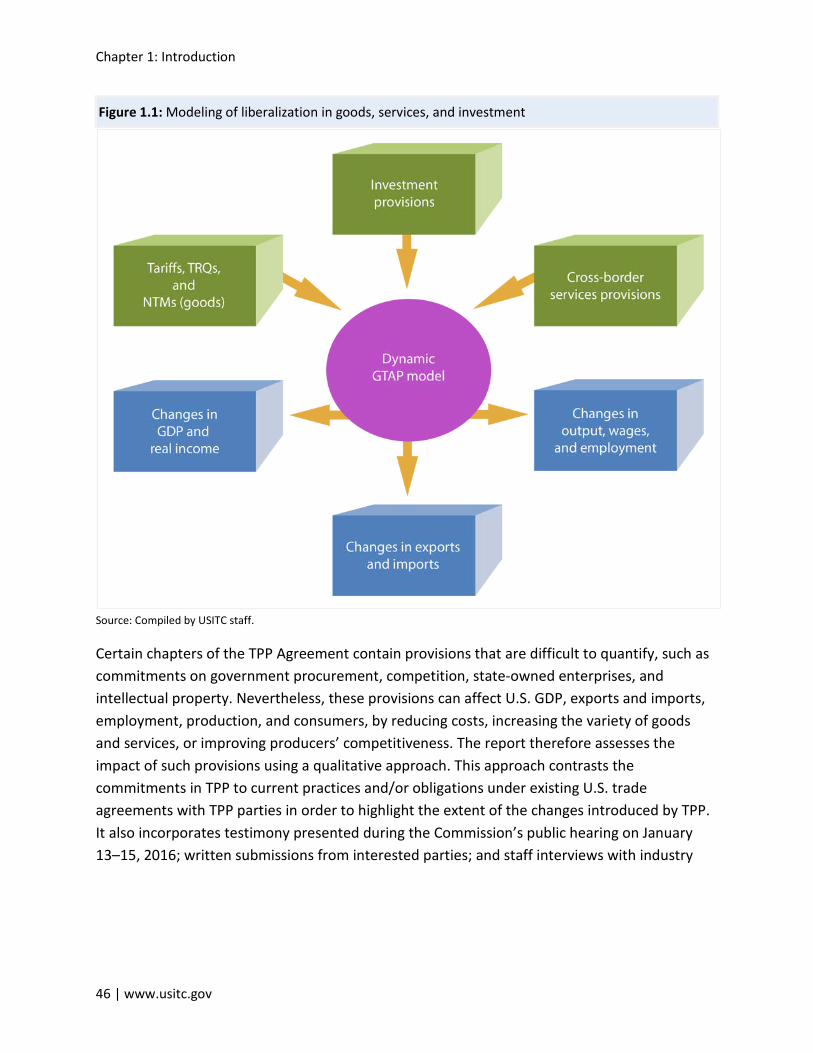
When the Commission has assessed prospective FTAs in the past, it has used the CGE model to simulate the economy-wide and sectoral effects of the agreements regarding tariffs, tariff-rate quotas (TRQs), and selected nontariff measures (NTMs) for trade in goods.14 The current analysis assessing the impact of the TPP Agreement not only estimates the impact of tariffs, NTMs, and TRQs on goods, but also estimates (1) the effect of NTMs on cross-border trade for certain services and (2) the effect of restrictive measures affecting foreign direct investment (FDI). These new analytical extensions to the modeling framework draw on a variety of databases and economic analyses to estimate the existing barriers and the impact of the TPP on these barriers, based on the text of the agreement. Figure 1.1 shows how the TPP’s provisions, once quantified, are integrated into the dynamic CGE model to obtain results on economic outcomes that take into account TPP liberalization in goods, services, and investment. The analysis in chapter 2 and technical appendix G explains the inputs into the model and the analytical framework in more detail.
14 Tariff-rates quotas (TRQs) are a type of tariff restraint, with a lower tariff applied to in-quota imports and a higher tariff applied to over-quota imports. Even though TRQs have a specified access or quota level, they are generally defined as tariff barriers. Nontariff measures (NTMs) are policy measures other than tariffs, such as sanitary and phytosanitary regulations, that may have an effect on international trade.
Chapter 1: Introduction
46 | www.usitc.gov
Figure 1.1: Modeling of liberalization in goods, services, and investment
Source: Compiled by USITC staff.
Certain chapters of the TPP Agreement contain provisions that are difficult to quantify, such as commitments on government procurement, competition, state-owned enterprises, and intellectual property. Nevertheless, these provisions can affect U.S. GDP, exports and imports, employment, production, and consumers, by reducing costs, increasing the variety of goods and services, or improving producers’ competitiveness. The report therefore assesses the impact of such provisions using a qualitative approach. This approach contrasts the commitments in TPP to current practices and/or obligations under existing U.S. trade agreements with TPP parties in order to highlight the extent of the changes introduced by TPP. It also incorporates testimony presented during the Commission’s public hearing on January 13–15, 2016; written submissions from interested parties; and staff interviews with industry
TPP Agreement: Likely Impact on the U.S. Economy and on Specific Industry Sectors
U.S. International Trade Commission | 47
representatives.15 Such information is interwoven into most chapters of this report, complementing the report’s quantitative assessments.
TPP Agreement Overview TPP is a comprehensive agreement that covers trade in goods and services, rules of origin, trade remedies, customs facilitation, sanitary and phytosanitary measures, technical barriers to trade, foreign investment, intellectual property, government procurement, competition policy, and labor and environmental standards, among other areas. There are 30 chapters in the agreement, which are listed in table 1.1 along with the corresponding chapters where they are discussed in this report. The assessment in this report is based on a review of all 30 chapters, as well as various annexes and numerous side agreements that address bilateral trade issues between individual TPP parties.
The TPP Agreement includes several chapters that have not been included in previous U.S. bilateral FTAs. These address state-owned enterprises, temporary entry of businesspersons, cooperation and capacity building, competitiveness and business facilitation, development, small and medium-sized enterprises, and regulatory coherence.
15 See appendix C for the calendar of the public hearing. See appendix D for summaries of positions of interested parties provided for inclusion in this report.
Chapter 1: Introduction
48 | www.usitc.gov
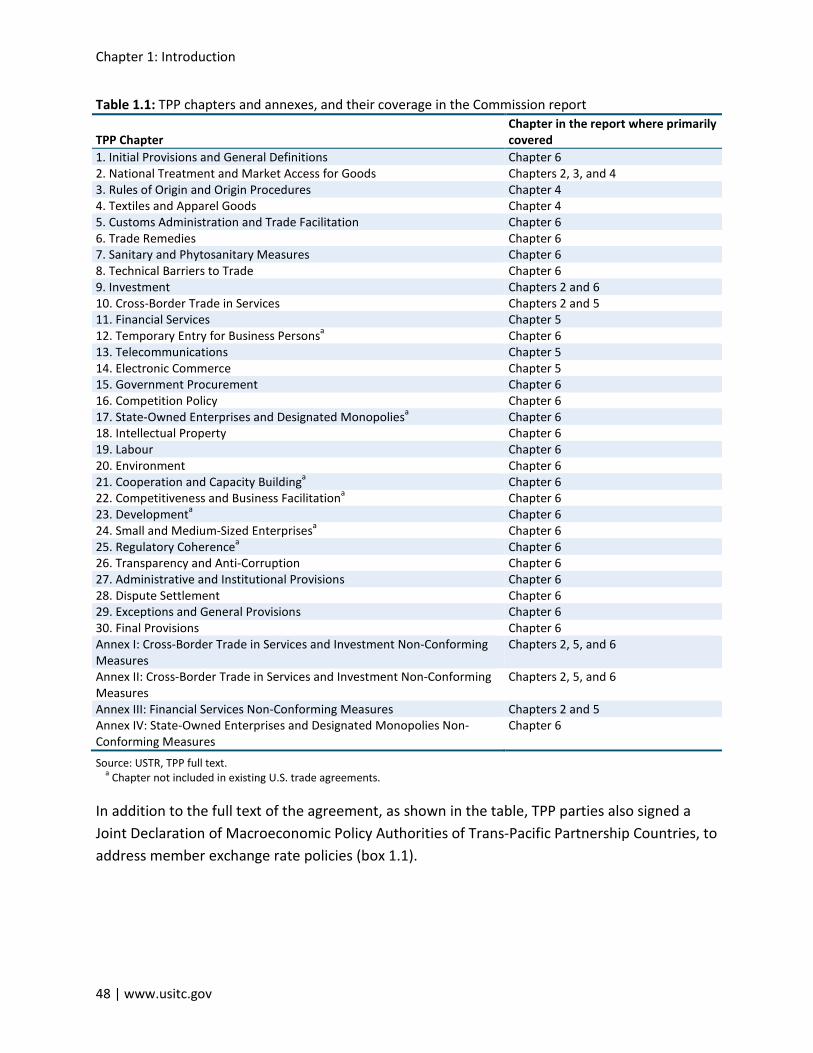
Table 1.1: TPP chapters and annexes, and their coverage in the Commission report
TPP Chapter Chapter in the report where primarily covered
1. Initial Provisions and General Definitions Chapter 6 2. National Treatment and Market Access for Goods Chapters 2, 3, and 4 3. Rules of Origin and Origin Procedures Chapter 4 4. Textiles and Apparel Goods Chapter 4 5. Customs Administration and Trade Facilitation Chapter 6 6. Trade Remedies Chapter 6 7. Sanitary and Phytosanitary Measures Chapter 6 8. Technical Barriers to Trade Chapter 6 9. Investment Chapters 2 and 6 10. Cross-Border Trade in Services Chapters 2 and 5 11. Financial Services Chapter 5 12. Temporary Entry for Business Personsa Chapter 6 13. Telecommunications Chapter 5 14. Electronic Commerce Chapter 5 15. Government Procurement Chapter 6 16. Competition Policy Chapter 6 17. State-Owned Enterprises and Designated Monopoliesa Chapter 6 18. Intellectual Property Chapter 6 19. Labour Chapter 6 20. Environment Chapter 6 21. Cooperation and Capacity Buildinga Chapter 6 22. Competitiveness and Business Facilitationa Chapter 6 23. Developmenta Chapter 6 24. Small and Medium-Sized Enterprisesa Chapter 6 25. Regulatory Coherencea Chapter 6 26. Transparency and Anti-Corruption Chapter 6 27. Administrative and Institutional Provisions Chapter 6 28. Dispute Settlement Chapter 6 29. Exceptions and General Provisions Chapter 6 30. Final Provisions Chapter 6 Annex I: Cross-Border Trade in Services and Investment Non-Conforming Measures
Chapters 2, 5, and 6
Annex II: Cross-Border Trade in Services and Investment Non-Conforming Measures
Chapters 2, 5, and 6
Annex III: Financial Services Non-Conforming Measures Chapters 2 and 5 Annex IV: State-Owned Enterprises and Designated Monopolies Non-Conforming Measures
Chapter 6
Source: USTR, TPP full text. a Chapter not included in existing U.S. trade agreements.
In addition to the full text of the agreement, as shown in the table, TPP parties also signed a Joint Declaration of Macroeconomic Policy Authorities of Trans-Pacific Partnership Countries, to address member exchange rate policies (box 1.1).
TPP Agreement: Likely Impact on the U.S. Economy and on Specific Industry Sectors
U.S. International Trade Commission | 49
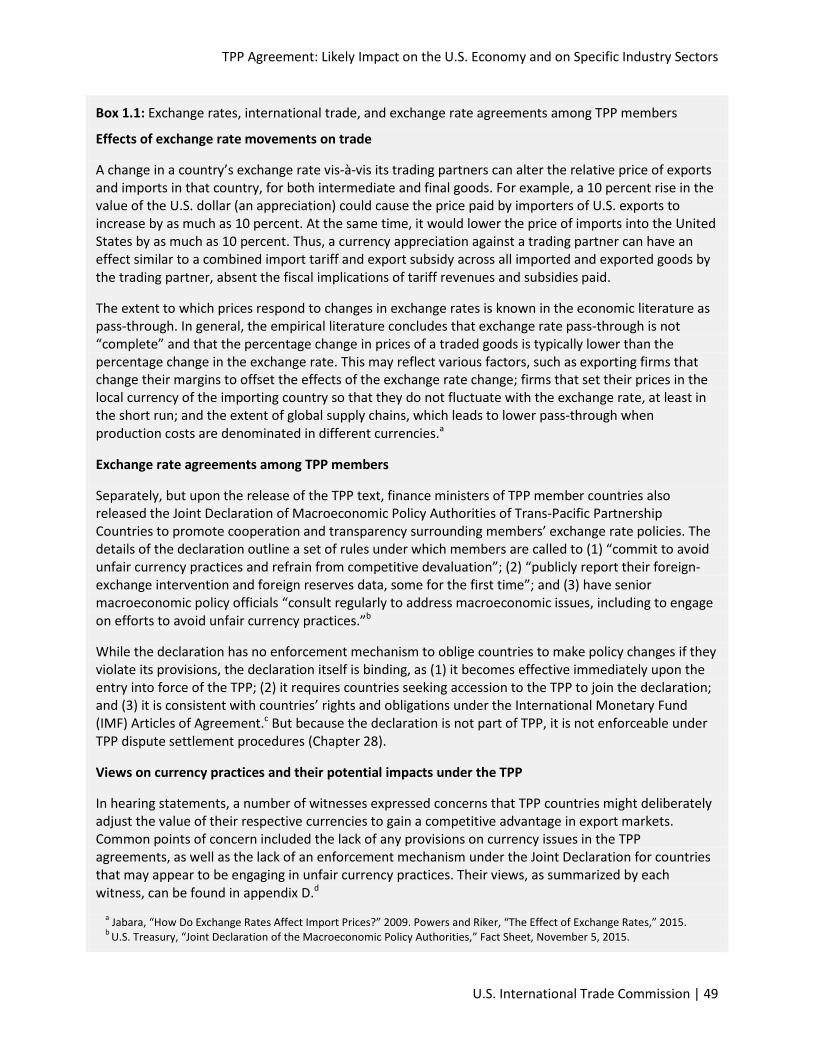
Box 1.1: Exchange rates, international trade, and exchange rate agreements among TPP members
Effects of exchange rate movements on trade
A change in a country’s exchange rate vis-à-vis its trading partners can alter the relative price of exports and imports in that country, for both intermediate and final goods. For example, a 10 percent rise in the value of the U.S. dollar (an appreciation) could cause the price paid by importers of U.S. exports to increase by as much as 10 percent. At the same time, it would lower the price of imports into the United States by as much as 10 percent. Thus, a currency appreciation against a trading partner can have an effect similar to a combined import tariff and export subsidy across all imported and exported goods by the trading partner, absent the fiscal implications of tariff revenues and subsidies paid.
The extent to which prices respond to changes in exchange rates is known in the economic literature as pass-through. In general, the empirical literature concludes that exchange rate pass-through is not “complete” and that the percentage change in prices of a traded goods is typically lower than the percentage change in the exchange rate. This may reflect various factors, such as exporting firms that change their margins to offset the effects of the exchange rate change; firms that set their prices in the local currency of the importing country so that they do not fluctuate with the exchange rate, at least in the short run; and the extent of global supply chains, which leads to lower pass-through when production costs are denominated in different currencies.a
Exchange rate agreements among TPP members
Separately, but upon the release of the TPP text, finance ministers of TPP member countries also released the Joint Declaration of Macroeconomic Policy Authorities of Trans-Pacific Partnership Countries to promote cooperation and transparency surrounding members’ exchange rate policies. The details of the declaration outline a set of rules under which members are called to (1) “commit to avoid unfair currency practices and refrain from competitive devaluation”; (2) “publicly report their foreign-exchange intervention and foreign reserves data, some for the first time”; and (3) have senior macroeconomic policy officials “consult regularly to address macroeconomic issues, including to engage on efforts to avoid unfair currency practices.”b
While the declaration has no enforcement mechanism to oblige countries to make policy changes if they violate its provisions, the declaration itself is binding, as (1) it becomes effective immediately upon the entry into force of the TPP; (2) it requires countries seeking accession to the TPP to join the declaration; and (3) it is consistent with countries’ rights and obligations under the International Monetary Fund (IMF) Articles of Agreement.c But because the declaration is not part of TPP, it is not enforceable under TPP dispute settlement procedures (Chapter 28).
Views on currency practices and their potential impacts under the TPP
In hearing statements, a number of witnesses expressed concerns that TPP countries might deliberately adjust the value of their respective currencies to gain a competitive advantage in export markets. Common points of concern included the lack of any provisions on currency issues in the TPP agreements, as well as the lack of an enforcement mechanism under the Joint Declaration for countries that may appear to be engaging in unfair currency practices. Their views, as summarized by each witness, can be found in appendix D.d
a Jabara, “How Do Exchange Rates Affect Import Prices?” 2009. Powers and Riker, “The Effect of Exchange Rates,” 2015. b U.S. Treasury, “Joint Declaration of the Macroeconomic Policy Authorities,” Fact Sheet, November 5, 2015.
Chapter 1: Introduction
50 | www.usitc.gov
c U.S. Treasury, “Joint Declaration of the Macroeconomic Policy Authorities,” November 5, 2015. Brunei, Malaysia, Singapore, and Vietnam are granted special accommodations under the agreement that grant them extra time and relaxation of certain reporting requirements for data dissemination. All TPP countries are IMF member countries.
d Parties mentioning currency issues in appendix D include Representatives DeLauro, Slaughter, DeFazio, and Lee; Representative Levin; the AFL-CIO Action Network; Americans Backing a Competitive Dollar; Citizens Trade Campaign; Coalition for a Prosperous America; Economic Policy Institute; Ideal Taxes; Teamsters; and United Steelworkers.
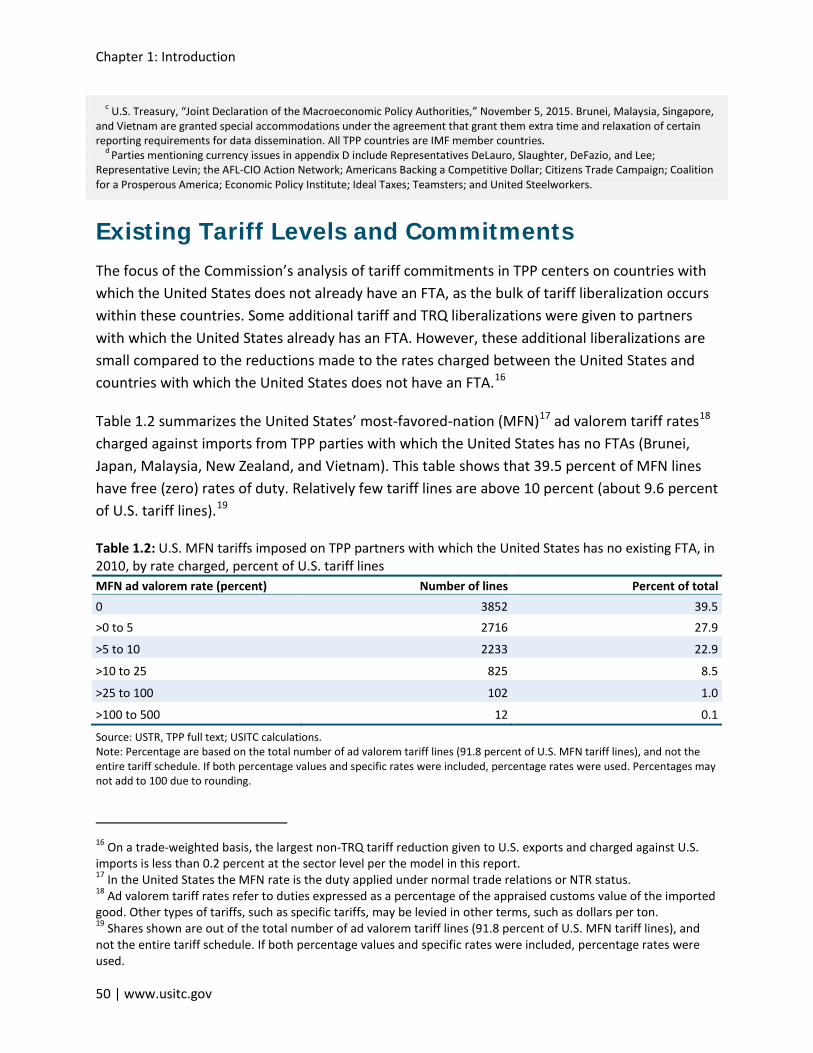
Existing Tariff Levels and Commitments The focus of the Commission’s analysis of tariff commitments in TPP centers on countries with which the United States does not already have an FTA, as the bulk of tariff liberalization occurs within these countries. Some additional tariff and TRQ liberalizations were given to partners with which the United States already has an FTA. However, these additional liberalizations are small compared to the reductions made to the rates charged between the United States and countries with which the United States does not have an FTA.16
Table 1.2 summarizes the United States’ most-favored-nation (MFN)17 ad valorem tariff rates18 charged against imports from TPP parties with which the United States has no FTAs (Brunei, Japan, Malaysia, New Zealand, and Vietnam). This table shows that 39.5 percent of MFN lines have free (zero) rates of duty. Relatively few tariff lines are above 10 percent (about 9.6 percent of U.S. tariff lines).19
Table 1.2: U.S. MFN tariffs imposed on TPP partners with which the United States has no existing FTA, in 2010, by rate charged, percent of U.S. tariff lines MFN ad valorem rate (percent) Number of lines Percent of total 0 3852 39.5 >0 to 5 2716 27.9
>5 to 10 2233 22.9
>10 to 25 825 8.5
>25 to 100 102 1.0
>100 to 500 12 0.1
Source: USTR, TPP full text; USITC calculations. Note: Percentage are based on the total number of ad valorem tariff lines (91.8 percent of U.S. MFN tariff lines), and not the entire tariff schedule. If both percentage values and specific rates were included, percentage rates were used. Percentages may not add to 100 due to rounding.
16 On a trade-weighted basis, the largest non-TRQ tariff reduction given to U.S. exports and charged against U.S. imports is less than 0.2 percent at the sector level per the model in this report. 17 In the United States the MFN rate is the duty applied under normal trade relations or NTR status. 18 Ad valorem tariff rates refer to duties expressed as a percentage of the appraised customs value of the imported good. Other types of tariffs, such as specific tariffs, may be levied in other terms, such as dollars per ton. 19 Shares shown are out of the total number of ad valorem tariff lines (91.8 percent of U.S. MFN tariff lines), and not the entire tariff schedule. If both percentage values and specific rates were included, percentage rates were used.
TPP Agreement: Likely Impact on the U.S. Economy and on Specific Industry Sectors
U.S. International Trade Commission | 51
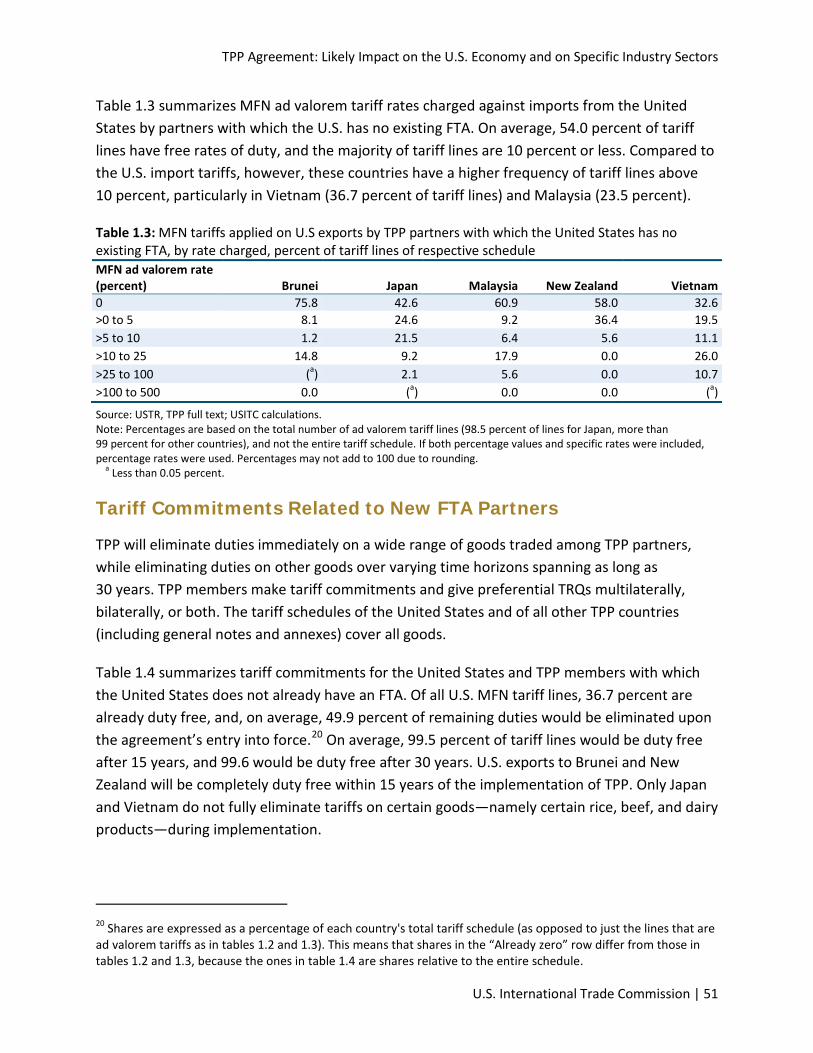
Table 1.3 summarizes MFN ad valorem tariff rates charged against imports from the United States by partners with which the U.S. has no existing FTA. On average, 54.0 percent of tariff lines have free rates of duty, and the majority of tariff lines are 10 percent or less. Compared to the U.S. import tariffs, however, these countries have a higher frequency of tariff lines above 10 percent, particularly in Vietnam (36.7 percent of tariff lines) and Malaysia (23.5 percent).
Table 1.3: MFN tariffs applied on U.S exports by TPP partners with which the United States has no existing FTA, by rate charged, percent of tariff lines of respective schedule MFN ad valorem rate (percent) Brunei Japan Malaysia New Zealand Vietnam 0 75.8 42.6 60.9 58.0 32.6 >0 to 5 8.1 24.6 9.2 36.4 19.5 >5 to 10 1.2 21.5 6.4 5.6 11.1 >10 to 25 14.8 9.2 17.9 0.0 26.0 >25 to 100 (a) 2.1 5.6 0.0 10.7 >100 to 500 0.0 (a) 0.0 0.0 (a)
Source: USTR, TPP full text; USITC calculations. Note: Percentages are based on the total number of ad valorem tariff lines (98.5 percent of lines for Japan, more than 99 percent for other countries), and not the entire tariff schedule. If both percentage values and specific rates were included, percentage rates were used. Percentages may not add to 100 due to rounding.
a Less than 0.05 percent.
Tariff Commitments Related to New FTA Partners
TPP will eliminate duties immediately on a wide range of goods traded among TPP partners, while eliminating duties on other goods over varying time horizons spanning as long as 30 years. TPP members make tariff commitments and give preferential TRQs multilaterally, bilaterally, or both. The tariff schedules of the United States and of all other TPP countries (including general notes and annexes) cover all goods.
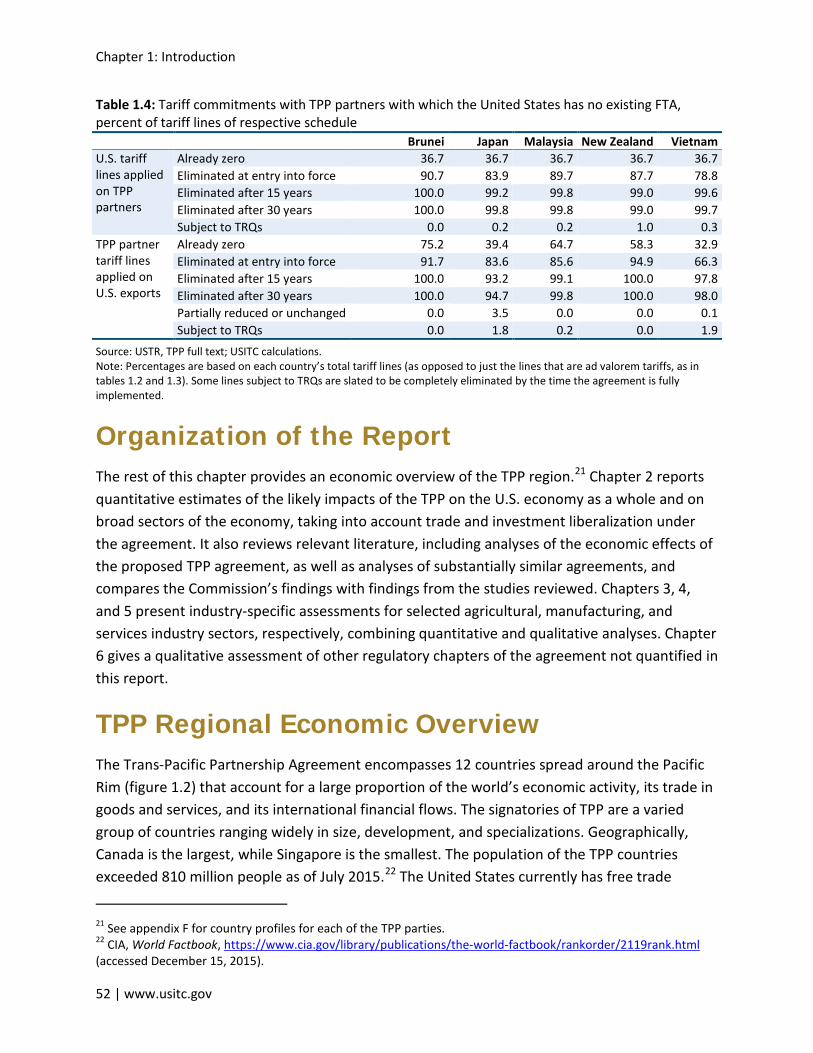
Table 1.4 summarizes tariff commitments for the United States and TPP members with which the United States does not already have an FTA. Of all U.S. MFN tariff lines, 36.7 percent are already duty free, and, on average, 49.9 percent of remaining duties would be eliminated upon the agreement’s entry into force.20 On average, 99.5 percent of tariff lines would be duty free after 15 years, and 99.6 would be duty free after 30 years. U.S. exports to Brunei and New Zealand will be completely duty free within 15 years of the implementation of TPP. Only Japan and Vietnam do not fully eliminate tariffs on certain goods—namely certain rice, beef, and dairy products—during implementation.
20 Shares are expressed as a percentage of each country's total tariff schedule (as opposed to just the lines that are ad valorem tariffs as in tables 1.2 and 1.3). This means that shares in the “Already zero” row differ from those in tables 1.2 and 1.3, because the ones in table 1.4 are shares relative to the entire schedule.
Chapter 1: Introduction
52 | www.usitc.gov
Table 1.4: Tariff commitments with TPP partners with which the United States has no existing FTA, percent of tariff lines of respective schedule Brunei Japan Malaysia New Zealand Vietnam U.S. tariff lines applied on TPP partners
Already zero 36.7 36.7 36.7 36.7 36.7 Eliminated at entry into force 90.7 83.9 89.7 87.7 78.8 Eliminated after 15 years 100.0 99.2 99.8 99.0 99.6 Eliminated after 30 years 100.0 99.8 99.8 99.0 99.7 Subject to TRQs 0.0 0.2 0.2 1.0 0.3
TPP partner tariff lines applied on U.S. exports
Already zero 75.2 39.4 64.7 58.3 32.9 Eliminated at entry into force 91.7 83.6 85.6 94.9 66.3 Eliminated after 15 years 100.0 93.2 99.1 100.0 97.8 Eliminated after 30 years 100.0 94.7 99.8 100.0 98.0 Partially reduced or unchanged 0.0 3.5 0.0 0.0 0.1 Subject to TRQs 0.0 1.8 0.2 0.0 1.9
Source: USTR, TPP full text; USITC calculations. Note: Percentages are based on each country’s total tariff lines (as opposed to just the lines that are ad valorem tariffs, as in tables 1.2 and 1.3). Some lines subject to TRQs are slated to be completely eliminated by the time the agreement is fully implemented.
Organization of the Report The rest of this chapter provides an economic overview of the TPP region.21 Chapter 2 reports quantitative estimates of the likely impacts of the TPP on the U.S. economy as a whole and on broad sectors of the economy, taking into account trade and investment liberalization under the agreement. It also reviews relevant literature, including analyses of the economic effects of the proposed TPP agreement, as well as analyses of substantially similar agreements, and compares the Commission’s findings with findings from the studies reviewed. Chapters 3, 4, and 5 present industry-specific assessments for selected agricultural, manufacturing, and services industry sectors, respectively, combining quantitative and qualitative analyses. Chapter 6 gives a qualitative assessment of other regulatory chapters of the agreement not quantified in this report.
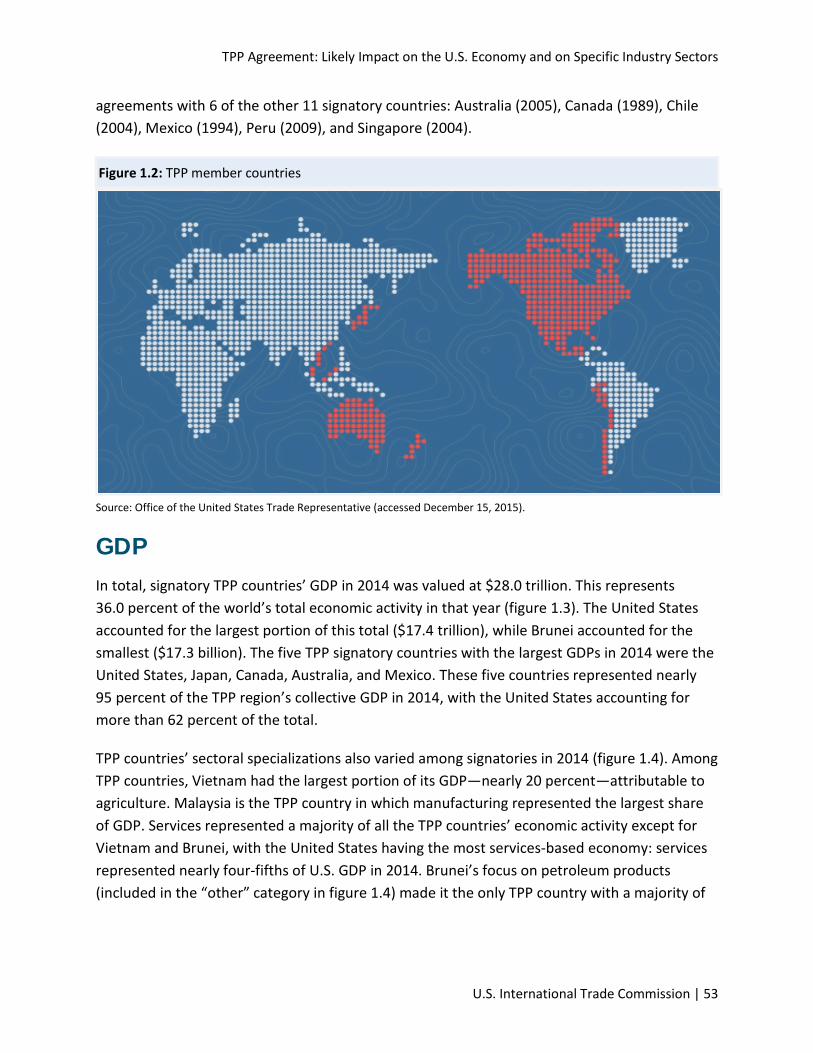
TPP Regional Economic Overview The Trans-Pacific Partnership Agreement encompasses 12 countries spread around the Pacific Rim (figure 1.2) that account for a large proportion of the world’s economic activity, its trade in goods and services, and its international financial flows. The signatories of TPP are a varied group of countries ranging widely in size, development, and specializations. Geographically, Canada is the largest, while Singapore is the smallest. The population of the TPP countries exceeded 810 million people as of July 2015.22 The United States currently has free trade
21 See appendix F for country profiles for each of the TPP parties. 22 CIA, World Factbook, https://www.cia.gov/library/publications/the-world-factbook/rankorder/2119rank.html (accessed December 15, 2015).
TPP Agreement: Likely Impact on the U.S. Economy and on Specific Industry Sectors
U.S. International Trade Commission | 53
agreements with 6 of the other 11 signatory countries: Australia (2005), Canada (1989), Chile (2004), Mexico (1994), Peru (2009), and Singapore (2004).
Figure 1.2: TPP member countries
Source: Office of the United States Trade Representative (accessed December 15, 2015).
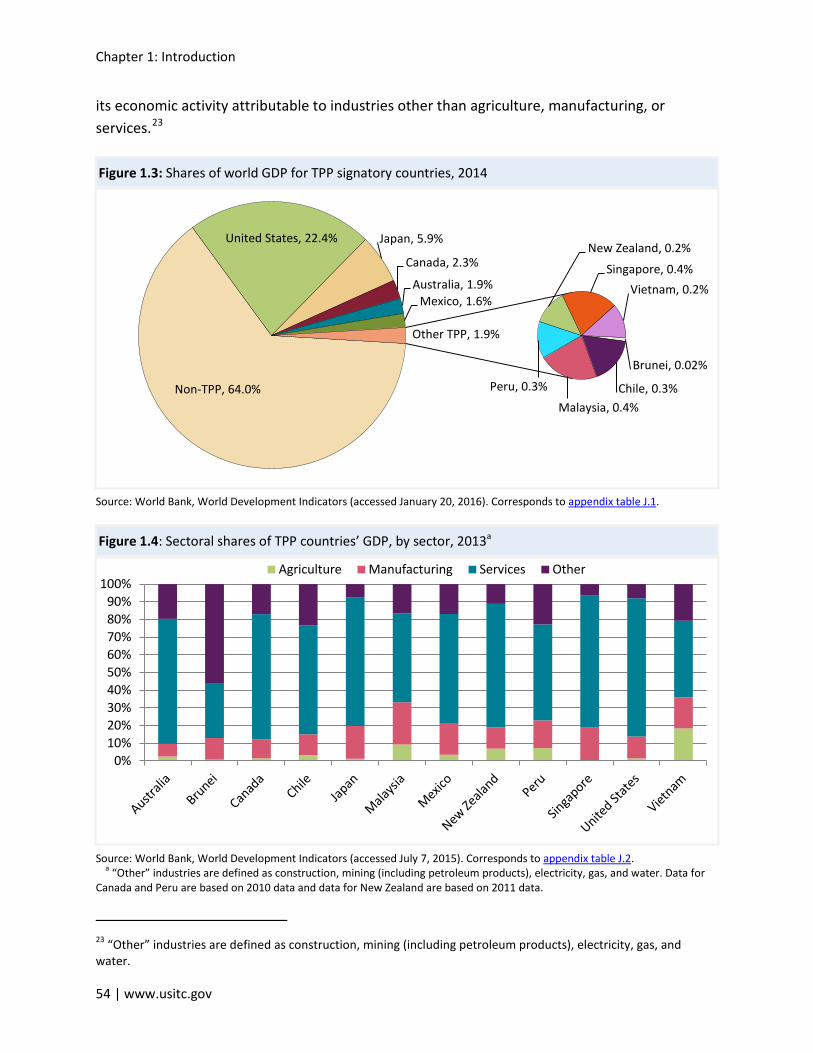
GDP In total, signatory TPP countries’ GDP in 2014 was valued at $28.0 trillion. This represents 36.0 percent of the world’s total economic activity in that year (figure 1.3). The United States accounted for the largest portion of this total ($17.4 trillion), while Brunei accounted for the smallest ($17.3 billion). The five TPP signatory countries with the largest GDPs in 2014 were the United States, Japan, Canada, Australia, and Mexico. These five countries represented nearly 95 percent of the TPP region’s collective GDP in 2014, with the United States accounting for more than 62 percent of the total.
TPP countries’ sectoral specializations also varied among signatories in 2014 (figure 1.4). Among TPP countries, Vietnam had the largest portion of its GDP—nearly 20 percent—attributable to agriculture. Malaysia is the TPP country in which manufacturing represented the largest share of GDP. Services represented a majority of all the TPP countries’ economic activity except for Vietnam and Brunei, with the United States having the most services-based economy: services represented nearly four-fifths of U.S. GDP in 2014. Brunei’s focus on petroleum products (included in the “other” category in figure 1.4) made it the only TPP country with a majority of
Chapter 1: Introduction
54 | www.usitc.gov
its economic activity attributable to industries other than agriculture, manufacturing, or services.23
Figure 1.3: Shares of world GDP for TPP signatory countries, 2014
Source: World Bank, World Development Indicators (accessed January 20, 2016). Corresponds to appendix table J.1.
Figure 1.4: Sectoral shares of TPP countries’ GDP, by sector, 2013a
Source: World Bank, World Development Indicators (accessed July 7, 2015). Corresponds to appendix table J.2. a “Other” industries are defined as construction, mining (including petroleum products), electricity, gas, and water. Data for
Canada and Peru are based on 2010 data and data for New Zealand are based on 2011 data.
23 “Other” industries are defined as construction, mining (including petroleum products), electricity, gas, and water.
Non-TPP, 64.0%
United States, 22.4% Japan, 5.9%
Canada, 2.3%
Australia, 1.9% Mexico, 1.6%
Brunei, 0.02%
Chile, 0.3% Malaysia, 0.4%
Peru, 0.3%
New Zealand, 0.2%
Singapore, 0.4% Vietnam, 0.2%
Other TPP, 1.9%
0%10%20%30%40%50%60%70%80%90%
100%Agriculture Manufacturing Services Other
TPP Agreement: Likely Impact on the U.S. Economy and on Specific Industry Sectors
U.S. International Trade Commission | 55
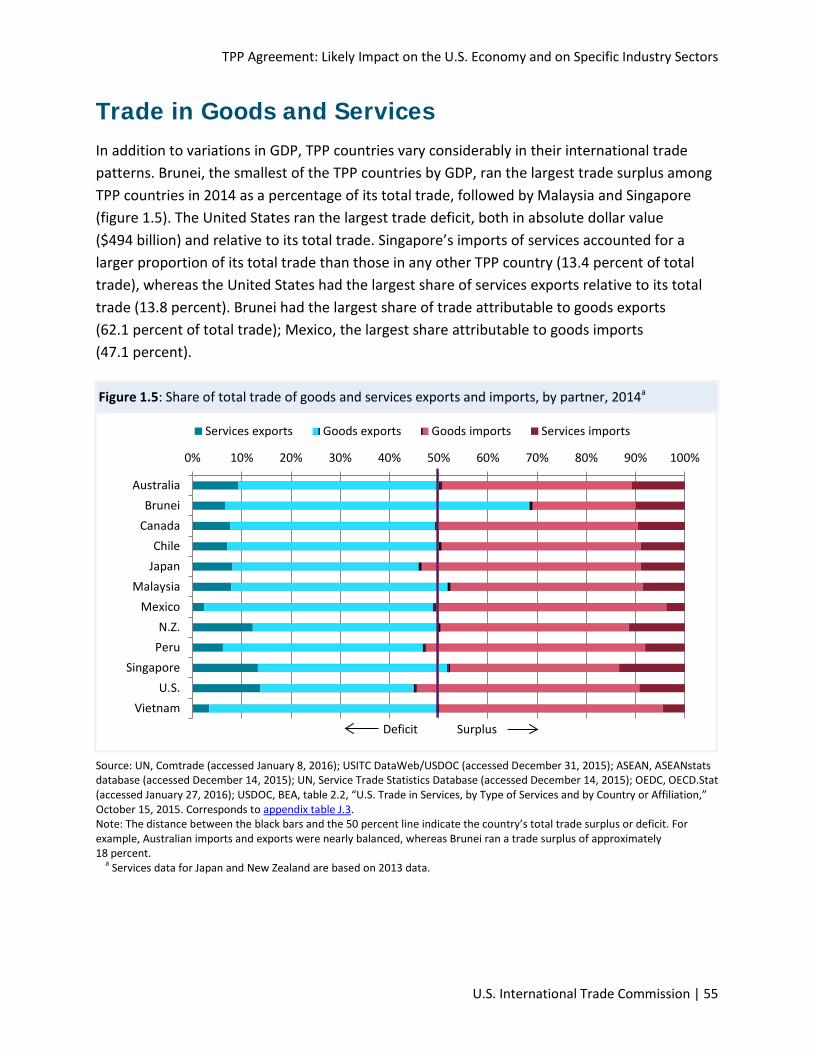
Trade in Goods and Services In addition to variations in GDP, TPP countries vary considerably in their international trade patterns. Brunei, the smallest of the TPP countries by GDP, ran the largest trade surplus among TPP countries in 2014 as a percentage of its total trade, followed by Malaysia and Singapore (figure 1.5). The United States ran the largest trade deficit, both in absolute dollar value ($494 billion) and relative to its total trade. Singapore’s imports of services accounted for a larger proportion of its total trade than those in any other TPP country (13.4 percent of total trade), whereas the United States had the largest share of services exports relative to its total trade (13.8 percent). Brunei had the largest share of trade attributable to goods exports (62.1 percent of total trade); Mexico, the largest share attributable to goods imports (47.1 percent).
Figure 1.5: Share of total trade of goods and services exports and imports, by partner, 2014a
Source: UN, Comtrade (accessed January 8, 2016); USITC DataWeb/USDOC (accessed December 31, 2015); ASEAN, ASEANstats database (accessed December 14, 2015); UN, Service Trade Statistics Database (accessed December 14, 2015); OEDC, OECD.Stat (accessed January 27, 2016); USDOC, BEA, table 2.2, “U.S. Trade in Services, by Type of Services and by Country or Affiliation,” October 15, 2015. Corresponds to appendix table J.3. Note: The distance between the black bars and the 50 percent line indicate the country’s total trade surplus or deficit. For example, Australian imports and exports were nearly balanced, whereas Brunei ran a trade surplus of approximately 18 percent.
a Services data for Japan and New Zealand are based on 2013 data.
0% 10% 20% 30% 40% 50% 60% 70% 80% 90% 100%
AustraliaBrunei
CanadaChile
JapanMalaysia
MexicoN.Z.
PeruSingapore
U.S.Vietnam
Services exports Goods exports Goods imports Services imports
Deficit Surplus
Chapter 1: Introduction
56 | www.usitc.gov
Size of Trade in Goods
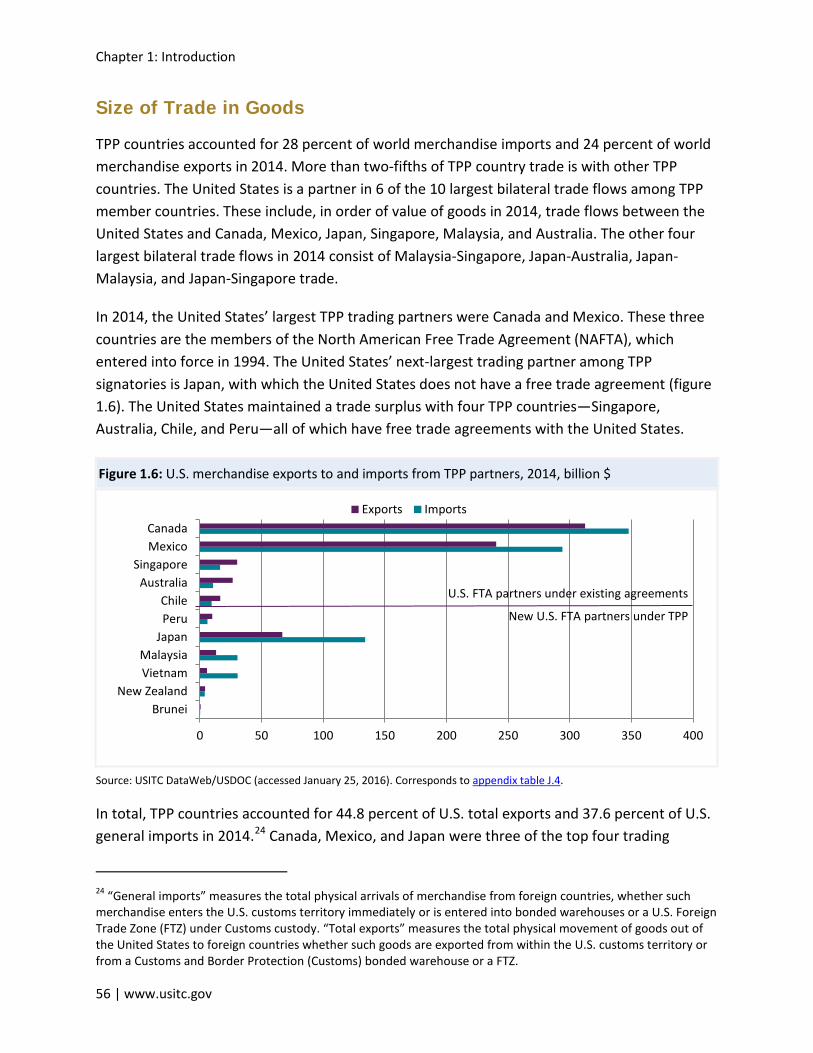
TPP countries accounted for 28 percent of world merchandise imports and 24 percent of world merchandise exports in 2014. More than two-fifths of TPP country trade is with other TPP countries. The United States is a partner in 6 of the 10 largest bilateral trade flows among TPP member countries. These include, in order of value of goods in 2014, trade flows between the United States and Canada, Mexico, Japan, Singapore, Malaysia, and Australia. The other four largest bilateral trade flows in 2014 consist of Malaysia-Singapore, Japan-Australia, Japan-Malaysia, and Japan-Singapore trade.
In 2014, the United States’ largest TPP trading partners were Canada and Mexico. These three countries are the members of the North American Free Trade Agreement (NAFTA), which entered into force in 1994. The United States’ next-largest trading partner among TPP signatories is Japan, with which the United States does not have a free trade agreement (figure 1.6). The United States maintained a trade surplus with four TPP countries—Singapore, Australia, Chile, and Peru—all of which have free trade agreements with the United States.
Figure 1.6: U.S. merchandise exports to and imports from TPP partners, 2014, billion $
Source: USITC DataWeb/USDOC (accessed January 25, 2016). Corresponds to appendix table J.4.
In total, TPP countries accounted for 44.8 percent of U.S. total exports and 37.6 percent of U.S. general imports in 2014.24 Canada, Mexico, and Japan were three of the top four trading
24 “General imports” measures the total physical arrivals of merchandise from foreign countries, whether such merchandise enters the U.S. customs territory immediately or is entered into bonded warehouses or a U.S. Foreign Trade Zone (FTZ) under Customs custody. “Total exports” measures the total physical movement of goods out of the United States to foreign countries whether such goods are exported from within the U.S. customs territory or from a Customs and Border Protection (Customs) bonded warehouse or a FTZ.
0 50 100 150 200 250 300 350 400
BruneiNew Zealand
VietnamMalaysia
JapanPeruChile
AustraliaSingapore
MexicoCanada
Exports Imports
U.S. FTA partners under existing agreements
New U.S. FTA partners under TPP
TPP Agreement: Likely Impact on the U.S. Economy and on Specific Industry Sectors
U.S. International Trade Commission | 57
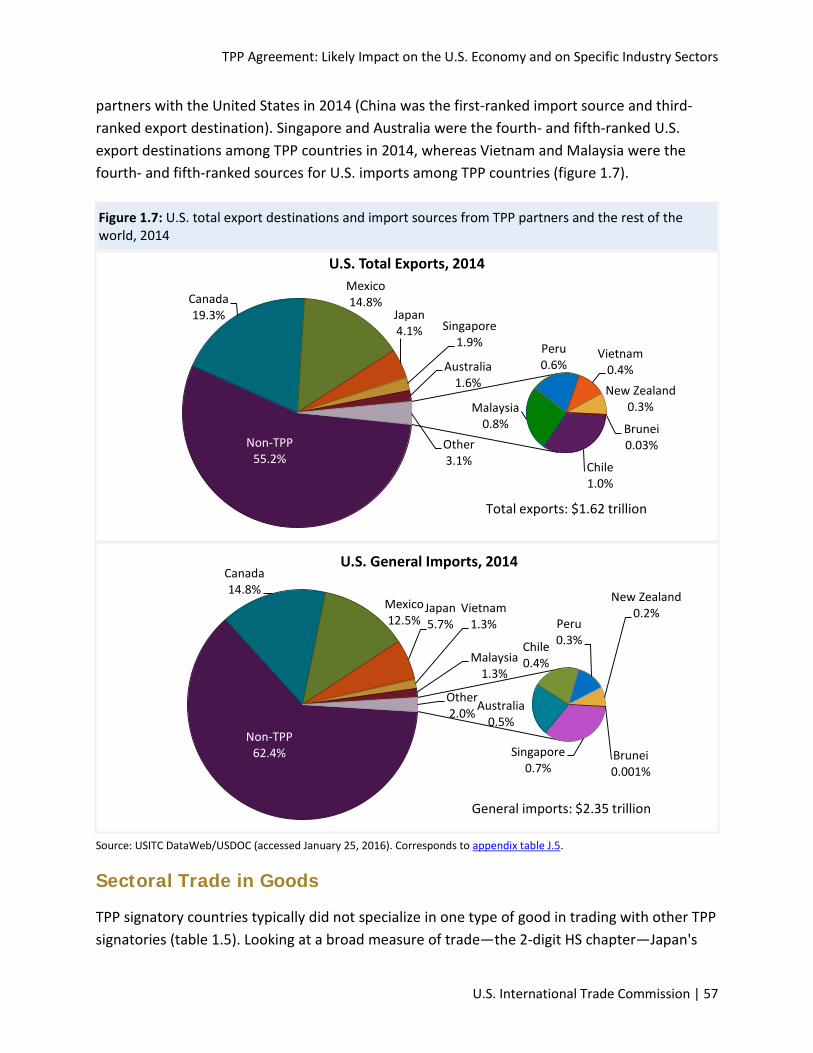
partners with the United States in 2014 (China was the first-ranked import source and third-ranked export destination). Singapore and Australia were the fourth- and fifth-ranked U.S. export destinations among TPP countries in 2014, whereas Vietnam and Malaysia were the fourth- and fifth-ranked sources for U.S. imports among TPP countries (figure 1.7).
Figure 1.7: U.S. total export destinations and import sources from TPP partners and the rest of the world, 2014
Source: USITC DataWeb/USDOC (accessed January 25, 2016). Corresponds to appendix table J.5.
Sectoral Trade in Goods
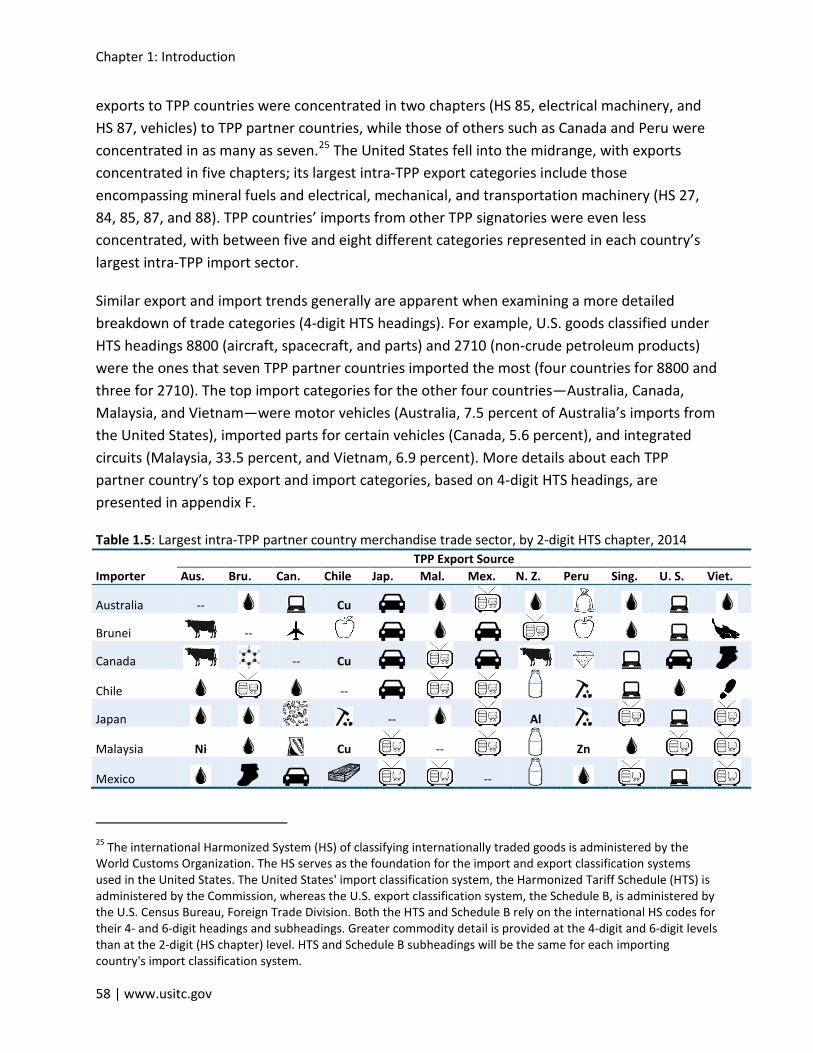
TPP signatory countries typically did not specialize in one type of good in trading with other TPP signatories (table 1.5). Looking at a broad measure of trade—the 2-digit HS chapter—Japan's
Non-TPP 55.2%
Canada 19.3%
Mexico 14.8%
Japan 4.1% Singapore
1.9%
Australia 1.6%
Chile 1.0%
Malaysia 0.8%
Peru 0.6%
Vietnam 0.4% New Zealand
0.3%
Brunei 0.03% Other
3.1%
U.S. Total Exports, 2014
Total exports: $1.62 trillion
Non-TPP 62.4%
Canada 14.8%
Mexico 12.5%
Japan 5.7%
Vietnam 1.3%
Malaysia 1.3%
Singapore 0.7%
Australia 0.5%
Chile 0.4%
Peru 0.3%
New Zealand 0.2%
Brunei 0.001%
Other 2.0%
U.S. General Imports, 2014
General imports: $2.35 trillion
Chapter 1: Introduction
58 | www.usitc.gov
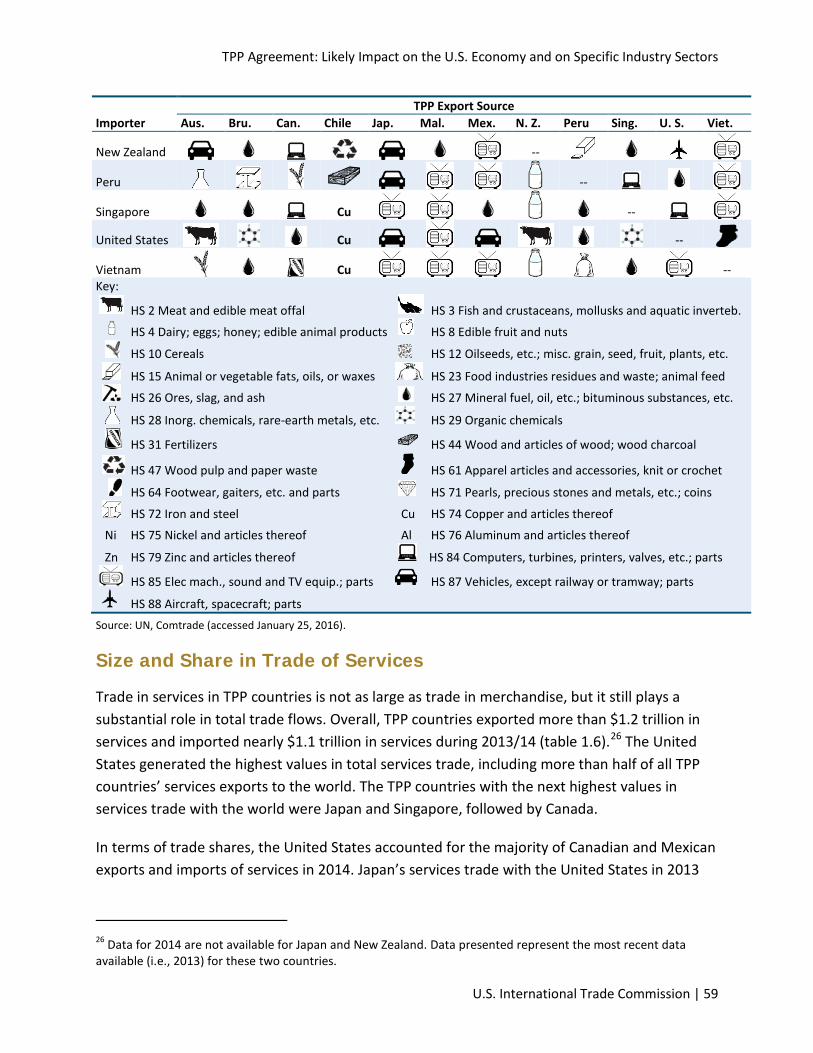
exports to TPP countries were concentrated in two chapters (HS 85, electrical machinery, and HS 87, vehicles) to TPP partner countries, while those of others such as Canada and Peru were concentrated in as many as seven.25 The United States fell into the midrange, with exports concentrated in five chapters; its largest intra-TPP export categories include those encompassing mineral fuels and electrical, mechanical, and transportation machinery (HS 27, 84, 85, 87, and 88). TPP countries’ imports from other TPP signatories were even less concentrated, with between five and eight different categories represented in each country’s largest intra-TPP import sector.
Similar export and import trends generally are apparent when examining a more detailed breakdown of trade categories (4-digit HTS headings). For example, U.S. goods classified under HTS headings 8800 (aircraft, spacecraft, and parts) and 2710 (non-crude petroleum products) were the ones that seven TPP partner countries imported the most (four countries for 8800 and three for 2710). The top import categories for the other four countries—Australia, Canada, Malaysia, and Vietnam—were motor vehicles (Australia, 7.5 percent of Australia’s imports from the United States), imported parts for certain vehicles (Canada, 5.6 percent), and integrated circuits (Malaysia, 33.5 percent, and Vietnam, 6.9 percent). More details about each TPP partner country’s top export and import categories, based on 4-digit HTS headings, are presented in appendix F.
Table 1.5: Largest intra-TPP partner country merchandise trade sector, by 2-digit HTS chapter, 2014
Importer TPP Export Source
Aus. Bru. Can. Chile Jap. Mal. Mex. N. Z. Peru Sing. U. S. Viet.
Australia --
Cu
Brunei
--
Canada
-- Cu
Chile
--
Japan
--
Al
Malaysia Ni
Cu
--
Zn
Mexico
--
25 The international Harmonized System (HS) of classifying internationally traded goods is administered by the World Customs Organization. The HS serves as the foundation for the import and export classification systems used in the United States. The United States' import classification system, the Harmonized Tariff Schedule (HTS) is administered by the Commission, whereas the U.S. export classification system, the Schedule B, is administered by the U.S. Census Bureau, Foreign Trade Division. Both the HTS and Schedule B rely on the international HS codes for their 4- and 6-digit headings and subheadings. Greater commodity detail is provided at the 4-digit and 6-digit levels than at the 2-digit (HS chapter) level. HTS and Schedule B subheadings will be the same for each importing country's import classification system.
TPP Agreement: Likely Impact on the U.S. Economy and on Specific Industry Sectors
U.S. International Trade Commission | 59
Importer TPP Export Source
Aus. Bru. Can. Chile Jap. Mal. Mex. N. Z. Peru Sing. U. S. Viet.
New Zealand
--
Peru
--
Singapore
Cu
--
United States
Cu
--
Vietnam
Cu
-- Key:
HS 2 Meat and edible meat offal HS 3 Fish and crustaceans, mollusks and aquatic inverteb.
HS 4 Dairy; eggs; honey; edible animal products HS 8 Edible fruit and nuts
HS 10 Cereals HS 12 Oilseeds, etc.; misc. grain, seed, fruit, plants, etc.
HS 15 Animal or vegetable fats, oils, or waxes HS 23 Food industries residues and waste; animal feed
HS 26 Ores, slag, and ash HS 27 Mineral fuel, oil, etc.; bituminous substances, etc.
HS 28 Inorg. chemicals, rare-earth metals, etc. HS 29 Organic chemicals
HS 31 Fertilizers HS 44 Wood and articles of wood; wood charcoal
HS 47 Wood pulp and paper waste HS 61 Apparel articles and accessories, knit or crochet
HS 64 Footwear, gaiters, etc. and parts HS 71 Pearls, precious stones and metals, etc.; coins
HS 72 Iron and steel Cu HS 74 Copper and articles thereof
Ni HS 75 Nickel and articles thereof Al HS 76 Aluminum and articles thereof
Zn HS 79 Zinc and articles thereof HS 84 Computers, turbines, printers, valves, etc.; parts
HS 85 Elec mach., sound and TV equip.; parts HS 87 Vehicles, except railway or tramway; parts
HS 88 Aircraft, spacecraft; parts Source: UN, Comtrade (accessed January 25, 2016).
Size and Share in Trade of Services
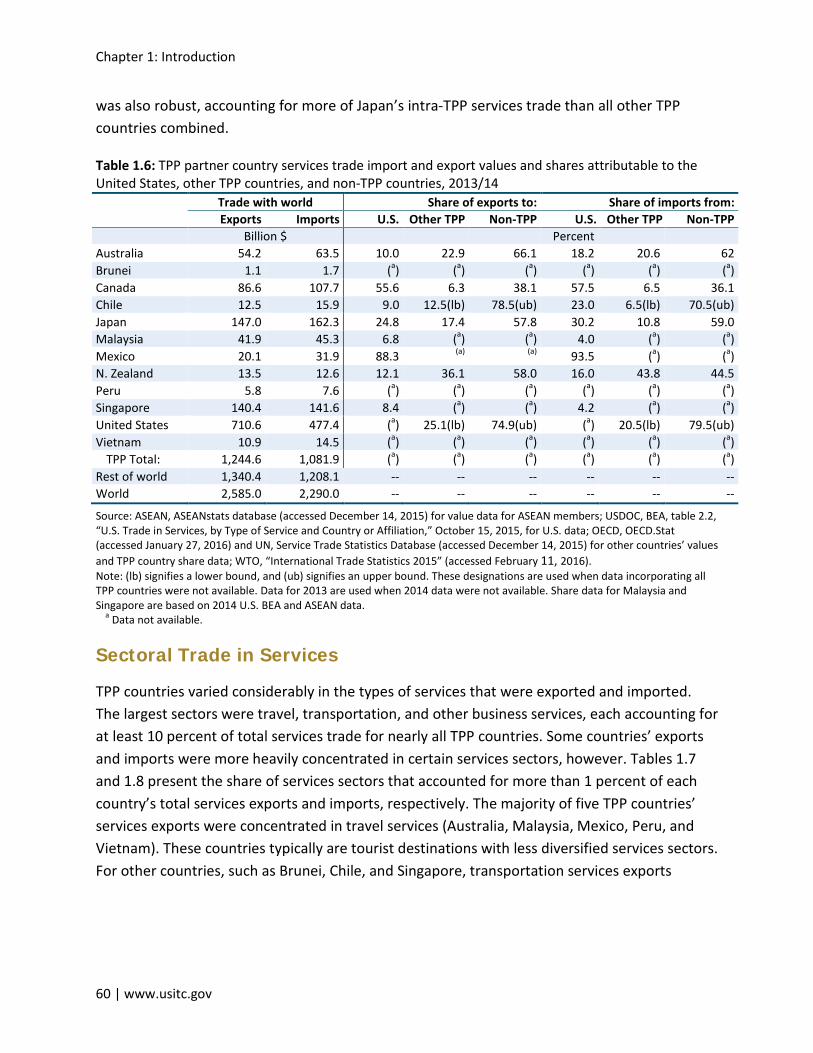
Trade in services in TPP countries is not as large as trade in merchandise, but it still plays a substantial role in total trade flows. Overall, TPP countries exported more than $1.2 trillion in services and imported nearly $1.1 trillion in services during 2013/14 (table 1.6).26 The United States generated the highest values in total services trade, including more than half of all TPP countries’ services exports to the world. The TPP countries with the next highest values in services trade with the world were Japan and Singapore, followed by Canada.
In terms of trade shares, the United States accounted for the majority of Canadian and Mexican exports and imports of services in 2014. Japan’s services trade with the United States in 2013
26 Data for 2014 are not available for Japan and New Zealand. Data presented represent the most recent data available (i.e., 2013) for these two countries.
Chapter 1: Introduction
60 | www.usitc.gov
was also robust, accounting for more of Japan’s intra-TPP services trade than all other TPP countries combined.
Table 1.6: TPP partner country services trade import and export values and shares attributable to the United States, other TPP countries, and non-TPP countries, 2013/14 Trade with world Share of exports to: Share of imports from:
Exports Imports U.S. Other TPP Non-TPP U.S. Other TPP Non-TPP Billion $ Percent Australia 54.2 63.5 10.0 22.9 66.1 18.2 20.6 62 Brunei 1.1 1.7 (a) (a) (a) (a) (a) (a) Canada 86.6 107.7 55.6 6.3 38.1 57.5 6.5 36.1 Chile 12.5 15.9 9.0 12.5(lb) 78.5(ub) 23.0 6.5(lb) 70.5(ub) Japan 147.0 162.3 24.8 17.4 57.8 30.2 10.8 59.0 Malaysia 41.9 45.3 6.8 (a) (a) 4.0 (a) (a) Mexico 20.1 31.9 88.3 (a) (a) 93.5 (a) (a) N. Zealand 13.5 12.6 12.1 36.1 58.0 16.0 43.8 44.5 Peru 5.8 7.6 (a) (a) (a) (a) (a) (a) Singapore 140.4 141.6 8.4 (a) (a) 4.2 (a) (a) United States 710.6 477.4 (a) 25.1(lb) 74.9(ub) (a) 20.5(lb) 79.5(ub) Vietnam 10.9 14.5 (a) (a) (a) (a) (a) (a)
TPP Total: 1,244.6 1,081.9 (a) (a) (a) (a) (a) (a) Rest of world 1,340.4 1,208.1 -- -- -- -- -- -- World 2,585.0 2,290.0 -- -- -- -- -- --
Source: ASEAN, ASEANstats database (accessed December 14, 2015) for value data for ASEAN members; USDOC, BEA, table 2.2, “U.S. Trade in Services, by Type of Service and Country or Affiliation,” October 15, 2015, for U.S. data; OECD, OECD.Stat (accessed January 27, 2016) and UN, Service Trade Statistics Database (accessed December 14, 2015) for other countries’ values and TPP country share data; WTO, “International Trade Statistics 2015” (accessed February 11, 2016). Note: (lb) signifies a lower bound, and (ub) signifies an upper bound. These designations are used when data incorporating all TPP countries were not available. Data for 2013 are used when 2014 data were not available. Share data for Malaysia and Singapore are based on 2014 U.S. BEA and ASEAN data.
a Data not available.
Sectoral Trade in Services
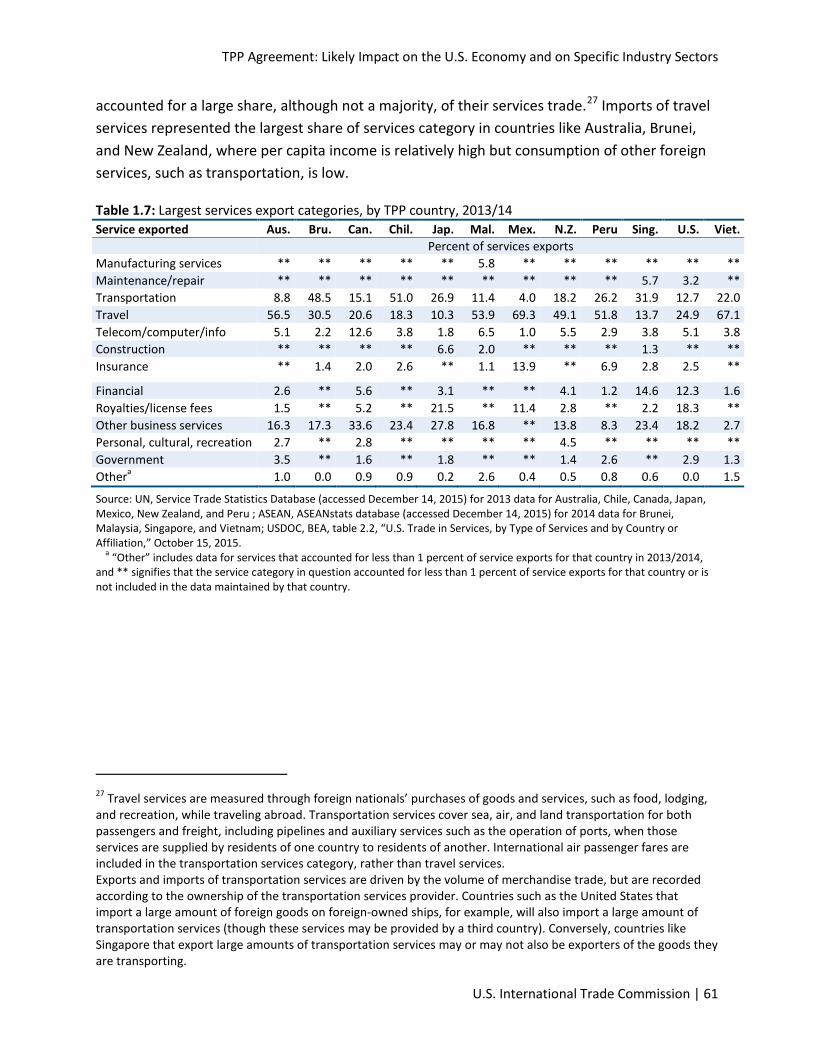
TPP countries varied considerably in the types of services that were exported and imported. The largest sectors were travel, transportation, and other business services, each accounting for at least 10 percent of total services trade for nearly all TPP countries. Some countries’ exports and imports were more heavily concentrated in certain services sectors, however. Tables 1.7 and 1.8 present the share of services sectors that accounted for more than 1 percent of each country’s total services exports and imports, respectively. The majority of five TPP countries’ services exports were concentrated in travel services (Australia, Malaysia, Mexico, Peru, and Vietnam). These countries typically are tourist destinations with less diversified services sectors. For other countries, such as Brunei, Chile, and Singapore, transportation services exports
TPP Agreement: Likely Impact on the U.S. Economy and on Specific Industry Sectors
U.S. International Trade Commission | 61
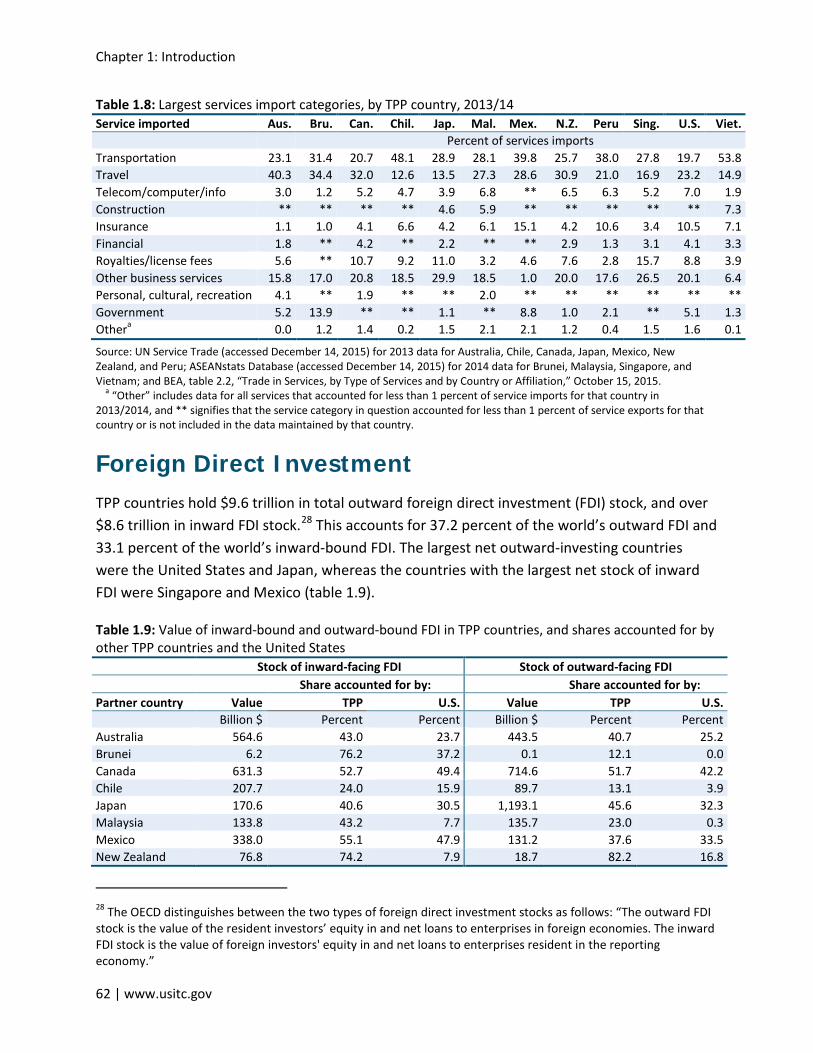
accounted for a large share, although not a majority, of their services trade.27 Imports of travel services represented the largest share of services category in countries like Australia, Brunei, and New Zealand, where per capita income is relatively high but consumption of other foreign services, such as transportation, is low.
Table 1.7: Largest services export categories, by TPP country, 2013/14 Service exported Aus. Bru. Can. Chil. Jap. Mal. Mex. N.Z. Peru Sing. U.S. Viet. Percent of services exports Manufacturing services ** ** ** ** ** 5.8 ** ** ** ** ** ** Maintenance/repair ** ** ** ** ** ** ** ** ** 5.7 3.2 ** Transportation 8.8 48.5 15.1 51.0 26.9 11.4 4.0 18.2 26.2 31.9 12.7 22.0 Travel 56.5 30.5 20.6 18.3 10.3 53.9 69.3 49.1 51.8 13.7 24.9 67.1 Telecom/computer/info 5.1 2.2 12.6 3.8 1.8 6.5 1.0 5.5 2.9 3.8 5.1 3.8 Construction ** ** ** ** 6.6 2.0 ** ** ** 1.3 ** ** Insurance ** 1.4 2.0 2.6 ** 1.1 13.9 ** 6.9 2.8 2.5 **
Financial 2.6 ** 5.6 ** 3.1 ** ** 4.1 1.2 14.6 12.3 1.6 Royalties/license fees 1.5 ** 5.2 ** 21.5 ** 11.4 2.8 ** 2.2 18.3 ** Other business services 16.3 17.3 33.6 23.4 27.8 16.8 ** 13.8 8.3 23.4 18.2 2.7 Personal, cultural, recreation 2.7 ** 2.8 ** ** ** ** 4.5 ** ** ** ** Government 3.5 ** 1.6 ** 1.8 ** ** 1.4 2.6 ** 2.9 1.3 Othera 1.0 0.0 0.9 0.9 0.2 2.6 0.4 0.5 0.8 0.6 0.0 1.5
Source: UN, Service Trade Statistics Database (accessed December 14, 2015) for 2013 data for Australia, Chile, Canada, Japan, Mexico, New Zealand, and Peru ; ASEAN, ASEANstats database (accessed December 14, 2015) for 2014 data for Brunei, Malaysia, Singapore, and Vietnam; USDOC, BEA, table 2.2, “U.S. Trade in Services, by Type of Services and by Country or Affiliation,” October 15, 2015.
a “Other” includes data for services that accounted for less than 1 percent of service exports for that country in 2013/2014, and ** signifies that the service category in question accounted for less than 1 percent of service exports for that country or is not included in the data maintained by that country.
27 Travel services are measured through foreign nationals’ purchases of goods and services, such as food, lodging, and recreation, while traveling abroad. Transportation services cover sea, air, and land transportation for both passengers and freight, including pipelines and auxiliary services such as the operation of ports, when those services are supplied by residents of one country to residents of another. International air passenger fares are included in the transportation services category, rather than travel services. Exports and imports of transportation services are driven by the volume of merchandise trade, but are recorded according to the ownership of the transportation services provider. Countries such as the United States that import a large amount of foreign goods on foreign-owned ships, for example, will also import a large amount of transportation services (though these services may be provided by a third country). Conversely, countries like Singapore that export large amounts of transportation services may or may not also be exporters of the goods they are transporting.
Chapter 1: Introduction
62 | www.usitc.gov
Table 1.8: Largest services import categories, by TPP country, 2013/14 Service imported Aus. Bru. Can. Chil. Jap. Mal. Mex. N.Z. Peru Sing. U.S. Viet. Percent of services imports Transportation 23.1 31.4 20.7 48.1 28.9 28.1 39.8 25.7 38.0 27.8 19.7 53.8 Travel 40.3 34.4 32.0 12.6 13.5 27.3 28.6 30.9 21.0 16.9 23.2 14.9 Telecom/computer/info 3.0 1.2 5.2 4.7 3.9 6.8 ** 6.5 6.3 5.2 7.0 1.9 Construction ** ** ** ** 4.6 5.9 ** ** ** ** ** 7.3 Insurance 1.1 1.0 4.1 6.6 4.2 6.1 15.1 4.2 10.6 3.4 10.5 7.1 Financial 1.8 ** 4.2 ** 2.2 ** ** 2.9 1.3 3.1 4.1 3.3 Royalties/license fees 5.6 ** 10.7 9.2 11.0 3.2 4.6 7.6 2.8 15.7 8.8 3.9 Other business services 15.8 17.0 20.8 18.5 29.9 18.5 1.0 20.0 17.6 26.5 20.1 6.4 Personal, cultural, recreation 4.1 ** 1.9 ** ** 2.0 ** ** ** ** ** ** Government 5.2 13.9 ** ** 1.1 ** 8.8 1.0 2.1 ** 5.1 1.3 Othera 0.0 1.2 1.4 0.2 1.5 2.1 2.1 1.2 0.4 1.5 1.6 0.1
Source: UN Service Trade (accessed December 14, 2015) for 2013 data for Australia, Chile, Canada, Japan, Mexico, New Zealand, and Peru; ASEANstats Database (accessed December 14, 2015) for 2014 data for Brunei, Malaysia, Singapore, and Vietnam; and BEA, table 2.2, “Trade in Services, by Type of Services and by Country or Affiliation,” October 15, 2015.
a “Other” includes data for all services that accounted for less than 1 percent of service imports for that country in 2013/2014, and ** signifies that the service category in question accounted for less than 1 percent of service exports for that country or is not included in the data maintained by that country.
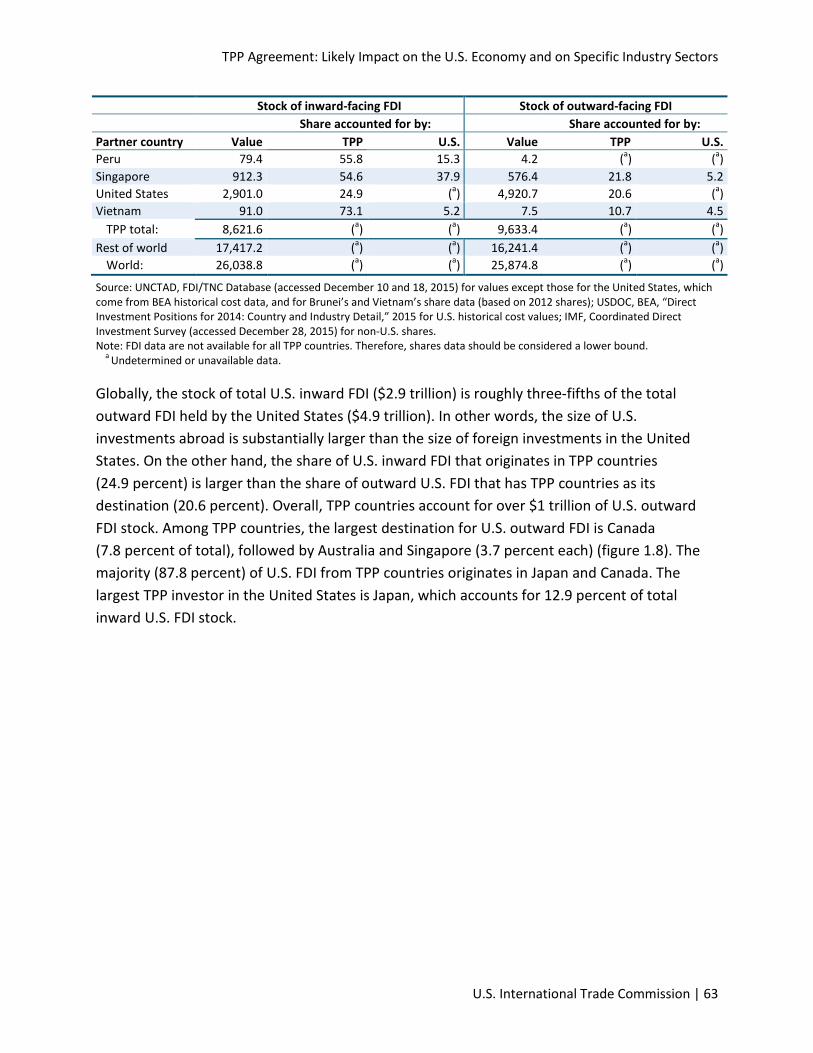
Foreign Direct Investment TPP countries hold $9.6 trillion in total outward foreign direct investment (FDI) stock, and over $8.6 trillion in inward FDI stock.28 This accounts for 37.2 percent of the world’s outward FDI and 33.1 percent of the world’s inward-bound FDI. The largest net outward-investing countries were the United States and Japan, whereas the countries with the largest net stock of inward FDI were Singapore and Mexico (table 1.9).
Table 1.9: Value of inward-bound and outward-bound FDI in TPP countries, and shares accounted for by other TPP countries and the United States Stock of inward-facing FDI Stock of outward-facing FDI Share accounted for by: Share accounted for by: Partner country Value TPP U.S. Value TPP U.S. Billion $ Percent Percent Billion $ Percent Percent Australia 564.6 43.0 23.7 443.5 40.7 25.2 Brunei 6.2 76.2 37.2 0.1 12.1 0.0 Canada 631.3 52.7 49.4 714.6 51.7 42.2 Chile 207.7 24.0 15.9 89.7 13.1 3.9 Japan 170.6 40.6 30.5 1,193.1 45.6 32.3 Malaysia 133.8 43.2 7.7 135.7 23.0 0.3 Mexico 338.0 55.1 47.9 131.2 37.6 33.5 New Zealand 76.8 74.2 7.9 18.7 82.2 16.8
28 The OECD distinguishes between the two types of foreign direct investment stocks as follows: “The outward FDI stock is the value of the resident investors’ equity in and net loans to enterprises in foreign economies. The inward FDI stock is the value of foreign investors' equity in and net loans to enterprises resident in the reporting economy.”
TPP Agreement: Likely Impact on the U.S. Economy and on Specific Industry Sectors
U.S. International Trade Commission | 63
Stock of inward-facing FDI Stock of outward-facing FDI Share accounted for by: Share accounted for by: Partner country Value TPP U.S. Value TPP U.S. Peru 79.4 55.8 15.3 4.2 (a) (a) Singapore 912.3 54.6 37.9 576.4 21.8 5.2 United States 2,901.0 24.9 (a) 4,920.7 20.6 (a) Vietnam 91.0 73.1 5.2 7.5 10.7 4.5
TPP total: 8,621.6 (a) (a) 9,633.4 (a) (a) Rest of world 17,417.2 (a) (a) 16,241.4 (a) (a)
World: 26,038.8 (a) (a) 25,874.8 (a) (a)
Source: UNCTAD, FDI/TNC Database (accessed December 10 and 18, 2015) for values except those for the United States, which come from BEA historical cost data, and for Brunei’s and Vietnam’s share data (based on 2012 shares); USDOC, BEA, “Direct Investment Positions for 2014: Country and Industry Detail,” 2015 for U.S. historical cost values; IMF, Coordinated Direct Investment Survey (accessed December 28, 2015) for non-U.S. shares. Note: FDI data are not available for all TPP countries. Therefore, shares data should be considered a lower bound.
a Undetermined or unavailable data.
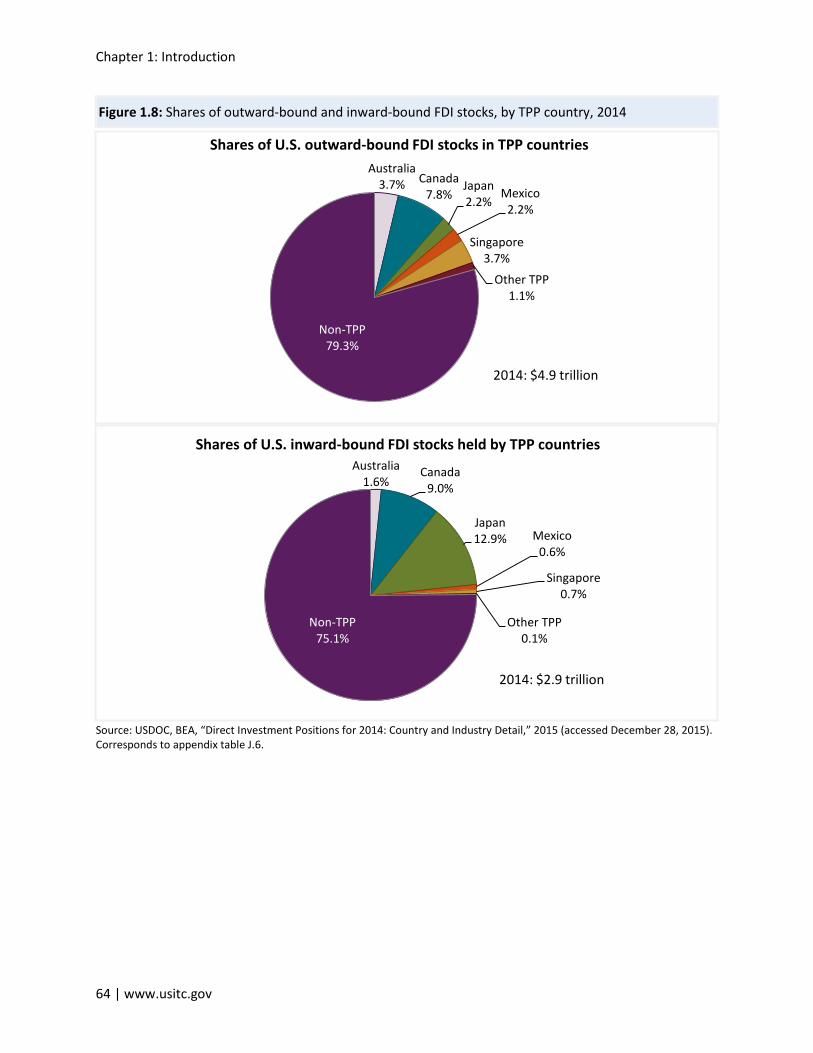
Globally, the stock of total U.S. inward FDI ($2.9 trillion) is roughly three-fifths of the total outward FDI held by the United States ($4.9 trillion). In other words, the size of U.S. investments abroad is substantially larger than the size of foreign investments in the United States. On the other hand, the share of U.S. inward FDI that originates in TPP countries (24.9 percent) is larger than the share of outward U.S. FDI that has TPP countries as its destination (20.6 percent). Overall, TPP countries account for over $1 trillion of U.S. outward FDI stock. Among TPP countries, the largest destination for U.S. outward FDI is Canada (7.8 percent of total), followed by Australia and Singapore (3.7 percent each) (figure 1.8). The majority (87.8 percent) of U.S. FDI from TPP countries originates in Japan and Canada. The largest TPP investor in the United States is Japan, which accounts for 12.9 percent of total inward U.S. FDI stock.
Chapter 1: Introduction
64 | www.usitc.gov
Figure 1.8: Shares of outward-bound and inward-bound FDI stocks, by TPP country, 2014
Source: USDOC, BEA, “Direct Investment Positions for 2014: Country and Industry Detail,” 2015 (accessed December 28, 2015). Corresponds to appendix table J.6.
Australia 3.7% Canada
7.8% Japan 2.2%
Mexico 2.2%
Singapore 3.7%
Other TPP 1.1%
Non-TPP 79.3%
Shares of U.S. outward-bound FDI stocks in TPP countries
2014: $4.9 trillion
Australia 1.6%
Canada 9.0%
Japan 12.9% Mexico
0.6%
Singapore 0.7%
Other TPP 0.1%
Non-TPP 75.1%
Shares of U.S. inward-bound FDI stocks held by TPP countries
2014: $2.9 trillion
TPP Agreement: Likely Impact on the U.S. Economy and on Specific Industry Sectors
U.S. International Trade Commission | 65
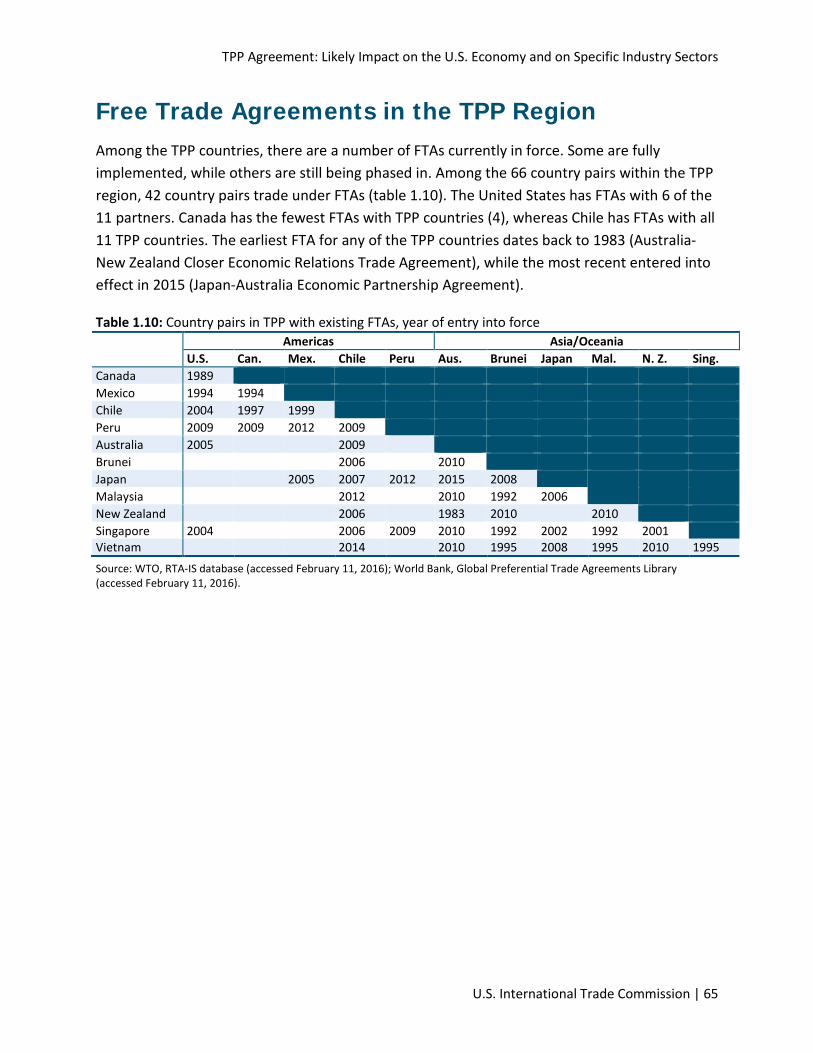
Free Trade Agreements in the TPP Region Among the TPP countries, there are a number of FTAs currently in force. Some are fully implemented, while others are still being phased in. Among the 66 country pairs within the TPP region, 42 country pairs trade under FTAs (table 1.10). The United States has FTAs with 6 of the 11 partners. Canada has the fewest FTAs with TPP countries (4), whereas Chile has FTAs with all 11 TPP countries. The earliest FTA for any of the TPP countries dates back to 1983 (Australia-New Zealand Closer Economic Relations Trade Agreement), while the most recent entered into effect in 2015 (Japan-Australia Economic Partnership Agreement).
Table 1.10: Country pairs in TPP with existing FTAs, year of entry into force
Americas Asia/Oceania U.S. Can. Mex. Chile Peru Aus. Brunei Japan Mal. N. Z. Sing.
Canada 1989 Mexico 1994 1994 Chile 2004 1997 1999 Peru 2009 2009 2012 2009 Australia 2005 2009 Brunei 2006 2010 Japan 2005 2007 2012 2015 2008 Malaysia 2012 2010 1992 2006 New Zealand 2006 1983 2010 2010 Singapore 2004 2006 2009 2010 1992 2002 1992 2001 Vietnam 2014 2010 1995 2008 1995 2010 1995 Source: WTO, RTA-IS database (accessed February 11, 2016); World Bank, Global Preferential Trade Agreements Library (accessed February 11, 2016).
Chapter 1: Introduction
66 | www.usitc.gov
Bibliography Association of Southeast Asian Nations (ASEAN). ASEANstats database.
http://aseanstats.asean.org/ (accessed December 14, 2015).
Central Intelligence Agency (CIA). World Factbook. https://www.cia.gov/library/publications/the-world-factbook/rankorder/2119rank.html (accessed December 15, 2015).
International Monetary Fund (IMF). Coordinated Direct Investment Survey (CDIS) database. http://data.imf.org/?sk=40313609-F037-48C1-84B1-E1F1CE54D6D5 (accessed December 28, 2015).
Jabara, Cathy L. “How Do Exchange Rates Affect Import Prices? Recent Economic Literature and Data Analysis.” Rev. ed. U.S. International Trade Commission. Office of Industries Working Paper. Publication ID-21, October 2009.
Organisation for Economic Co-operation and Development (OECD). OECD.Stat database. http://stats.oecd.org/ (accessed January 27, 2016).
———. “Foreign Direct Investment.” https://data.oecd.org/fdi/fdi-stocks.htm (accessed April 5, 2016).
Powers, William, and David Riker. “The Effect of Exchange Rates on the Costs of Exporters When Inputs Are Denominated in Foreign Currencies.” International Trade Journal 29 (2015): 3–18.
United Nations (UN). Comtrade database. Via the World Integrated Trade Solution (WITS). http://unstats.un.org/unsd/tradekb/Knowledgebase/Use-UN-Comtrade-via-World-Integrated-Trade-Solution-WITS (accessed December31, 2015).
———. Service Trade Statistics Database. http://unstats.un.org/unsd/servicetrade/default.aspx (accessed December 14, 2015).
United Nations Conference on Trade and Development (UNCTAD). FDI/TNC Database. http://unctad.org/en/Pages/DIAE/FDI%20Statistics/FDI-Statistics.aspx (accessed December 10 and 18, 2015).
U.S. International Trade Commission (USITC) Interactive Tariff and Trade DataWeb (DataWeb)/U.S. Department of Commerce (USDOC). http://dataweb.usitc.gov (accessed various dates).
TPP Agreement: Likely Impact on the U.S. Economy and on Specific Industry Sectors
U.S. International Trade Commission | 67
U.S. Department of Commerce (USDOC). “FAQ: Schedule B and HS Numbers.” http://export.gov/faq/eg_main_017509.asp (accessed April 6, 2015).
———. U.S. Bureau of Economic Analysis (BEA). International Data. International Services, table 2.2, “U.S. Trade in Services, by Type of Service and by Country or Affiliation.” October 15, 2015. http://www.bea.gov/iTable/bp_download_modern.cfm?pid=41.
———. “Foreign Direct Investment Position in the United States on a Historical-cost Basis.” http://www.bea.gov/international/di1fdibal.htm (accessed December 28, 2015).
———. “U.S. Direct Investment Position Abroad on a Historical-cost Basis.” http://www.bea.gov/international/di1usdbal.htm (accessed December 28, 2015).
U.S. Department of Treasury (U.S. Treasury). “Joint Declaration of the Macroeconomic Policy Authorities of TPP Countries.” Fact sheet, November 5, 2015. https://www.treasury.gov/initiatives/Documents/Press%20Release%20-%20Joint%20Declaration%20Fact%20Sheet.pdf.
———. “Joint Declaration of the Macroeconomic Policy Authorities of TPP Countries.” November 5, 2015. https://www.treasury.gov/initiatives/Documents/TPP_Currency_November%202015.pdf .
U.S. Trade Representative (USTR). TPP Full Text, n.d. https://ustr.gov/trade-agreements/free-trade-agreements/trans-pacific-partnership/tpp-full-text (accessed November 30, 2015).
———. “The Trans-Pacific Partnership.” https://ustr.gov/tpp/ (accessed December 15, 2015).
World Bank. Global Preferential Trade Agreements Database. Agreements Library. http://wits.worldbank.org/gptad/library.aspx (accessed February 11, 2016).
———. World Development Indicators (WDI) database. http://data.worldbank.org/indicator (accessed various dates).
World Trade Organization (WTO). Regional Trade Agreements Information System (RTA-IS) database. http://rtais.wto.org/UI/PublicMaintainRTAHome.aspx (accessed February 11, 2016).