chapter 1: introduction to engineering...
TRANSCRIPT

7/24/2017
1
Chapter 1: Introduction to Engineering Economy
Engineering economy:
Systematic evaluation of the economic merits of proposed solutions to engineering problems.
Answers basic economic questions:
Do benefits exceed costs? How to conduct a certain activity? How to utilize the staff?Which alternative to choose?
7/24/2017
2
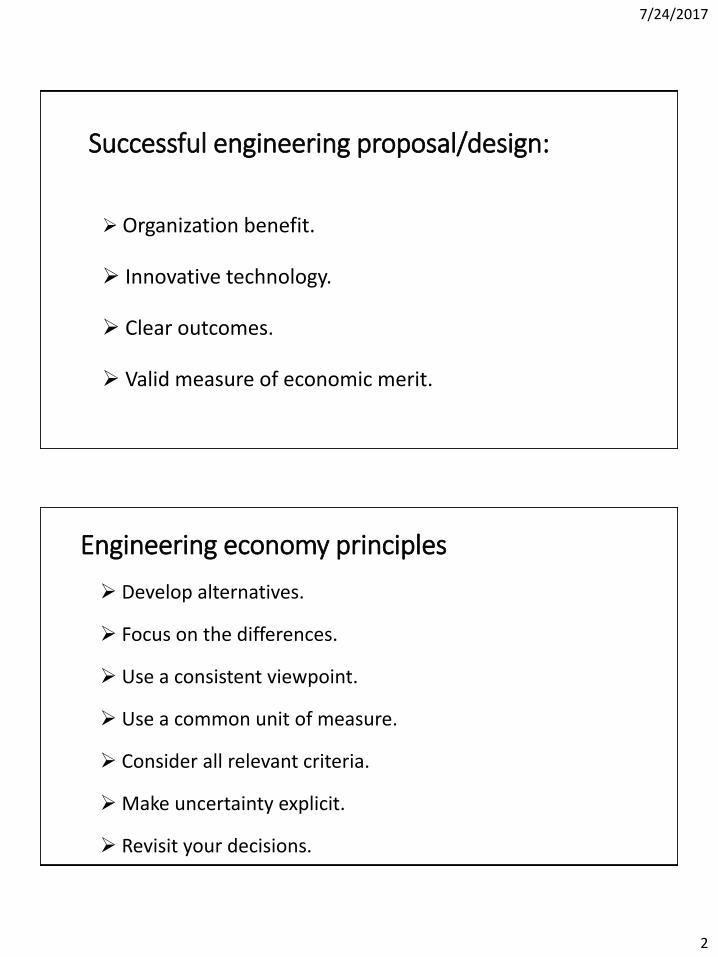
Successful engineering proposal/design:
Organization benefit.
Innovative technology.
Clear outcomes.
Valid measure of economic merit.
Engineering economy principles
Develop alternatives.
Focus on the differences.
Use a consistent viewpoint.
Use a common unit of measure.
Consider all relevant criteria.
Make uncertainty explicit.
Revisit your decisions.

7/24/2017
3
Economic analysis procedure
Problem definition.
Development of alternatives.
Development of prospective outcomes.
Selection of a decision criterion.
Analysis and comparison of alternatives.
Selection of the preferred alternative.
Performance monitoring and post-evaluation of results.
Problem definition exampleExample:
A small furniture-manufacturing company wants to increase theirprofits to get a loan from the bank to purchase a more modern pattern-cutting machine. One proposed solution is to sell waste wood chips andshavings to a local charcoal manufacturer instead of using them to fuelspace heaters for the company’s office and factory areas.
• Define the company’s problem.
Not enough revenue to cover costs or to produce significant profit.
• Alternatives?

7/24/2017
4
Economic analysis example
Someone bought a small apartment building for $100,000. He spent$10,000 of his own money for the building and obtained a mortgagefrom a local bank for the remaining $90,000. The annual mortgagepayment to the bank is $10,500. He also estimates that annualmaintenance on the building and grounds will be $15,000. There arefour apartments in the building that can each be rented for $360 permonth.
• Problem?
Yesmoney spent ($10,500 + $15,000 = $25,500) every year exceeds revenue ($360×4×12 = $17,280) $8,220 loss per year.
Maybe rent is too low?
• Alternatives? Raise the rent.
Decrease maintenance cost.
Sell the building.
Abandon the building.
• Development of prospective outcomes?
Option 1: raise rent so the net balance is zero.
$8,220/4 apts/ 12 months = $171.25 increase per apartment per month (48% increase).
Option 2: lower monthly expenses.
$10,500 + X = $17,280 X = $6,780 per year (maintenance) $565 per month.
Option 3: Selling the building.
Option 4: Abandoning the building.

7/24/2017
5
• Selection of a decision criterion?
Minimization of losses.
• Analysis and comparison of alternatives?
Based on the selected criterion.
• Selection of the preferred alternative?
Select the best achievable option.
Spreadsheets
Excellent for large and repetitive problems.
Graphical output is easily generated.

7/24/2017
1
Chapter 2: Cost Concepts and Design Economics
Objective
Analyze short term-alternatives when the time-value of money is not a factor.

7/24/2017
2
Cost categories
1) Fixed costs (costs unaffected by changes in a specific range of operating conditions).
Examples: insurance on facilities, taxes on facilities, general management and administrative salaries, license fees, interest costs on borrowed capital.
2) Variable costs (costs that vary with the quantity of output).
Examples: materials and labor costs.
3) Incremental cost (additional cost resulting from increasing the output by one or more units).
Examples: mileage cost, production of 1 vs. 2 units.
Cost categories example
Classify each of the following cost items into fixed or variablecosts:
Raw materials Variable
Direct labor wages Variable
Supplies Variable
Property taxes Fixed
Utilities (electricity bill) Fixed and Variable
Administrative salaries Fixed
Sales commission Variable
Rent Fixed
Shipping charges Variable

7/24/2017
3
Example: highway pavingA new highway is to be paved and the contractor has two locations to setup their asphalt mixing equipment. The job requires 50,000 yd3 ofasphaltic material and the project duration is estimated to be 4 months (17weeks of 5 working days). Which option is better?
Assume the contractor is paid $12/yd3 asphalt delivered to the site and assume the cost of material is $1.5/yd3 . At what point does he break-even and begin to make a profit?
Break-even means: Total revenue = Total expenses
$90,750 + [$2.75 × 3 X] + [$1.5 × X] = $12 XX = 40,333 yd3
Site B is better.

7/24/2017
4
Other categories of cost- Direct costs (directly measured and allocated to a specific outcome or
work activity).Examples: labor and material costs associated with a certain construction activity are direct costsfor that activity.
- Indirect costs (overhead or burden): difficult to allocate to a specificoutput or work activity. A specific formula can be used (proportions).
Examples: plant operating costs, common tools, general supplies, general maintenance.
- Standard costs (established ahead of production or service delivery:anticipated labor and material costs + overhead cost per unit).
Useful for bidding, cost estimation, comparison, and evaluation.
Cost terminology
Cash cost: involves payment of cash and results in cash flow.
Example: estimates for the cost of travel, labor, material, etc.
Book cost: does not involve a cash transaction and is normally reflected asa noncash cost.
Example: depreciation due to the use of assets such as equipment (not a cash flow).
Sunk cost: payment occurred in the past with no relevance to future costand revenue estimates (not a part of future cash flows and is typicallydisregarded in engineering economy problems).
Example: non-refundable down payment on a car.

7/24/2017
5
Opportunity costs: monetary advantage foregone due to limited resources
or the cost of the best rejected opportunity.
Example: working and getting paid for one year or going to college and paying tuition.
Life-cycle cost: summation of all costs related to a product, a system, a
structure, or a service during its lifespan.
Acquisition phase (need, alternatives, design) … greatest potential for savings occurs here.
Operation phase (production or delivery until product/service is retired or disposed).
Example: buying a modern hybrid car vs. an old SUV.
General price-demand relationship
𝑝 = 𝑎 − 𝑏 × 𝐷
Where:
𝑝 = price
𝐷 = demand
𝑎 and b = constants that depend on the
product or service.
0 < 𝐷 < 𝑎/b 𝑎 > 0; b > 0

7/24/2017
6
Total revenue
Total revenue (TR) from selling a product or
a service is:
𝑇𝑅 = 𝑝𝑟𝑖𝑐𝑒 × 𝑑𝑒𝑚𝑎𝑛𝑑 = 𝑝 × 𝐷
Recall that 𝑝 = 𝑎 − 𝑏𝐷
𝑇𝑅 = 𝑎𝐷 – 𝑏𝐷2
Cost, volume, and breakeven point
Total costs (𝐶𝑇) = Fixed costs (𝐶𝐹) + Variable costs (𝐶𝑉)
Assuming a linear relationship between variable costs and demand,
𝐶𝑉 = 𝑐𝑣 × 𝐷, where 𝑐𝑣 is the variable cost per unit demand.
𝐶𝑇 = 𝐶𝐹 + 𝑐𝑉 × 𝐷
Scenario 1: demand is a function of price.
Scenario 2: demand and price are independent from each other.

7/24/2017
7
Profit – scenario 1
Profit = Total revenue – Total costs
𝑃𝑟𝑜𝑓𝑖𝑡 = 𝑎𝐷 − 𝑏𝐷2 − (𝐶𝐹 + 𝑐𝑉𝐷)
𝑃𝑟𝑜𝑓𝑖𝑡 = −𝑏𝐷2 + 𝑎 − 𝑐𝑉 𝐷 − 𝐶𝐹
To maximize profit,
𝑑(𝑃𝑟𝑜𝑓𝑖𝑡)
𝑑𝐷= 𝑎 − 𝑐𝑣 − 2𝑏𝐷 = 0
Optimal 𝐷 𝐷* = 𝑎−𝑐𝑣
2𝑏
Breakeven point (profit = 0) is found by:
Total revenue = Total cost
𝑎𝐷 − 𝑏𝐷2 = 𝐶𝐹 + 𝑐𝑉𝐷
−𝑏𝐷2 + 𝑎 − 𝑐𝑉 𝐷 − 𝐶𝐹 = 0
Solve for 𝐷 to get 𝐷’ (breakeven demand)
(2 breakeven demands 𝐷’1 and 𝐷’2): range of
profitable demand
𝐷′ =−(𝑎 − 𝑐𝑣) ± 𝑎 − 𝑐𝑣
2 − 4(−𝑏)(−𝐶𝐹)
2(−𝑏)

7/24/2017
8
Example
A company produces an electronic timing switch that is used in consumer andcommercial products. The fixed cost (𝐶𝐹) is $73,000 per month, and thevariable cost (𝑐𝑣) is $83 per unit. The selling price per unit is 𝑝 = $180 −0.02(𝐷).
1) Determine the optimal volume for this product and confirm that a profitoccurs (instead of a loss) at this demand.
2) Find the volumes at which breakeven occurs; that is, what is the range ofprofitable demand.
(1)
D∗ =𝑎−𝑐𝑣
2𝑏=
$180−$83
2∗0.02= 2,425 𝑢𝑛𝑖𝑡𝑠 𝑝𝑒𝑟 𝑚𝑜𝑛𝑡ℎ (𝑚𝑎𝑥𝑖𝑚𝑢𝑚 𝑝𝑟𝑜𝑓𝑖𝑡).
Or write down the equation of profit, derive, and equate to zero.
𝑃 = 180 𝐷 − 0.02 𝐷2 − 73,000 + 83 𝐷 = −0.02 𝐷2 + 97 𝐷 − 73,000
For a profit to occur, the 2nd derivative should be negative (-0.04).
Also, substitute the optimal demand (𝐷∗) in the profit equation:
Profit= [$180 × 2,425 – 0.02 × 2,4252] – [$73,000 + $83 × 2,425] = $44,612 (+ve profit).
(2) 𝑎 = 180 𝑏 = 0.02 𝑐𝑣 = 83 𝐶𝐹 = 73000
D′ =−(180 − 83) ± 180 − 83 2 − 4(−0.02)(−73,000)
2(−0.02)
𝐷’1 = 932 units and 𝐷’2 = 3,918 units.

7/24/2017
9
Profit – scenario 2
Price per unit (𝑝) and demand (𝐷) are
independent from each other.
Profit = Total revenue – Total costs
𝑃𝑟𝑜𝑓𝑖𝑡 = 𝑝 𝐷 − (𝐶𝐹 + 𝑐𝑉𝐷)
Only one breakeven point.
ExampleAn engineering consulting firm measures its output in a standard servicehour unit. The variable cost (𝑐𝑣) is $62 per standard service hour and thecharge-out rate [i.e., selling price (𝑝)] is $85.56 per hour. The maximumoutput of the firm is 160,000 hours per year, and its fixed cost (𝐶𝐹) is$2,024,000 per year. What is the breakeven point in standard service hoursand in percentage of total capacity?
Total revenue = Total costs
𝐷’ × $85.56/ℎ = $2,024,000 + $62 × 𝐷’
𝐷’ = 85,908 ℎ.
% 𝑜𝑓 𝑡𝑜𝑡𝑎𝑙 𝑐𝑎𝑝𝑎𝑐𝑖𝑡𝑦 =85,908
160,000× 100% = 54%

7/24/2017
10
Present economy studies
Duration < one year time influence on money is ignored (present economy).
Comparing multiple alternatives:
(1) For variable known revenue and benefits, select the alternative with
maximum profit.
(2) For constant or unknown revenues and benefits, select the alternative with
minimum total cost per defect-free product or service.
ExampleThe demand for a certain part is 100,000 units. The part is produced on ahigh-speed turret lathe, using screw-machine steel costing $0.30 per pound. Astudy was conducted to determine whether it might be cheaper to use brassscrew stock, costing $1.40 per pound. Because the weight of steel requiredper piece was 0.0353 pounds and that of brass was 0.0384 pounds, thematerial cost per piece was $0.0106 for steel and $0.0538 for brass. However,when the manufacturing engineering department was consulted, it was foundthat, although 57.1 defect-free parts per hour were being produced by usingsteel, the output would be 102.9 defect-free parts per hour if brass wereused. Assuming the machine attendant is paid $15.00 per hour, and thevariable (i.e., traceable) overhead costs for the turret lathe are estimated tobe $10.00 per hour. Which material should be used for this part?

7/24/2017
11
Unknown or constant revenue (demand is constant) compare the
cost per defect-free unit
Select brass
ExampleTwo machines with approximately the same capital investment are being considered forthe production of a part. The important differences between the machines are theirproduction capacities (production rate × available production hours) and their reject rates(percentage of parts produced that cannot be sold). Consider the following table:
The material cost is $6.00 per part, and all defect-free parts produced can be sold for $12each (rejected parts have negligible scrap value.) For either machine, the operator cost is$15.00 per hour and the variable overhead rate for traceable costs is $5.00 per hour.
Assume that the daily demand for this part is large enough that all defect-free parts can besold. Which machine should be selected?

7/24/2017
12
Variable total revenue Rule #1 Profit maximization
Profit per day = Total revenue per day – Total costs per day
= production rate × production hours ×$12
part× 1 −
rejected%
100− production rate × production hours ×
$6
hour
− production hours ×$15
hour+
$5
hour
For machine A:
Profit per day = 100 parts
hour×
7 hours
day×
$12
part× (1 − 0.03) −
100 parts
hour×
7 hours
day×
$6
part−
7 hours
day
Energy efficiency studies
Two pumps delivering 100 hp (1 hp = 0.746 kW) will be operated for one
year (4,000 h) for agricultural purposes. Assuming the electricity costs
$0.1 per kWh. Which pump would you select?

7/24/2017
13
Elect consumption($) =Power delivered
efficiency× #hours × price
For pump A:
Consumption = 100 hp ×0.746 kW
hp×
1
0.8× 4,000 h ×
$0.10
kWh= $37,300
Total owning and operating cost = $37,300 + $2,900 + $170 = $40,370
For pump B:
Consumption = 100 hp ×0.746 kW
hp×
1
0.9× 4,000 h ×
$0.10
kWh= $33,156
Total owning and operating cost = $33,156 + $6,200 + $510 = $39,866
Select pump B
Making vs. outsourcing
• In-house production vs. purchasing (outsourcing).
• Indirect and overhead costs could be shared among other activities.
• Accurate analysis is needed in decision-making.

7/24/2017
1
Chapter 3: Cost Estimation Techniques
Objective
To present various methods for estimating important factors(costs, revenue, useful lives, residual values, etc.) in anengineering economy study.
Cost estimation is useful for:1) Setting up a selling price for a quote or a bid.
2) Determining if a product will be profitable.
3) Justifying capital for process changes or improvements.
4) Setting benchmarks for productivity improvements.

7/24/2017
2
Two fundamental approaches for cost estimation
Top-down approach
Good for early estimates when developing alternatives.
Uses historical data from similar projects with adjustments to
account for inflation, deflation, and other factors.
Bottom-up approach
More detailed approach.
Project is broken down into small units.
The estimated overall cost is the sum of the units’ costs + other
costs (e.g. overhead).
Integrated cost estimation approach
Components
1. Work breakdown structure (WBS):Successive levels of the work elements and their interrelationships.
2. Cost and revenue structure (classification):Delineation of cost and revenue categories and elements for different WBS levels.
3. Estimating techniques (models):Selected mathematical models to estimate future costs and revenues.

7/24/2017
3
Integrated approach
Work breakdown structure (WBS)
• WBS is a basic tool in project management.
• WBS defines all project elements and their interrelationships, collecting andorganizing information, and developing relevant cost and revenue data andmanagement activities. WBS includes recurring (maintenance) and non-recurring (initial construction) work elements.
• Each WBS level further details the work elements. The resources required for awork element are the sum of resources of sub-elements below it.
• WBS Includes functional and physical work elements. Functional (logistic support, project management, and marketing).
Physical (labor, materials, and resources required for the making of a product).

7/24/2017
4
Example:Develop the first 3 WBS levels for the construction of a small commercial building.
Cost and revenue structure• In this structure, costs and revenue to be included in the analysis
are identified and categorized.
• Examples of cost and revenue categories:
Capital investment.
Labor costs.
Material costs.
Maintenance costs.
Overhead.
Disposal costs.
Sales revenue.
Market (or salvage) value.

7/24/2017
5
Estimating techniques (models)
The goal is to develop cash flow projections, not exact future data(which is almost impossible).
Cost and revenue estimates can be classified to:
Order-of-magnitude estimates- Planning and initial evaluation of a project to select feasible alternatives (±30 – 50%
accuracy).- Level 1 or 2 of the WBS.
Semi-detailed (or budget) estimates- Preliminary or conceptual design stage of a project (±15% accuracy).- Level 2 or 3 of the WBS.
Definitive (detailed) estimates- Detailed design estimates from drawings, specs, quotations, … used for bidding (±5%
accuracy).- Level 3 and beyond.
Sources of estimating data
• Accounting records.
• Other sources inside the firm.
• Sources outside the firm.
• Research and development (R&D).

7/24/2017
6
Selected modelsModel 1: Indexes (ratio technique)
- An index is a dimensionless number used to estimate present and future costs from historical data.
𝐶𝑛 = 𝐶𝑘 ×ҧ𝐼𝑛ҧ𝐼𝑘
Where:k: reference year.n: year to be estimated at.Cn and Ck: cost or price in years n and k, respectively.Īn and Īk are the index values for the years n and k, respectively.
Example
A company wants to install a new boiler. The price of the boilerin the year 2000 was $525,000 when the index was 468. What isthe price of the boiler in 2014 given that the index value is 542in the year 2014?
𝐶2014 = 𝐶2000 ×𝐼2014𝐼2000
𝐶2014 = 525,000 ×542
468= $608,013

7/24/2017
7
Selected models
Model 2: Unit technique
- Widely used and understood.
- Good for preliminary estimates.
Examples: Cost per m2 of construction × area of construction.
Operating cost per mile × number of miles.
Selected models
Model 3: Factor technique
- Extension of the unit technique.
- Good for preliminary estimates.
𝐶𝑜𝑠𝑡 =
𝑑
𝐶𝑑 +
𝑚
𝐶𝑚𝑈𝑚
Where:
Cd: cost of a component d that is estimated directly.
fm: cost per unit of component m.
Um: number of units of component m.

7/24/2017
8
Parametric cost estimating
• Utilizing historical cost data and statistical techniques to predictfuture costs.
• These models are used in early design stages to get an estimate ofa product or project cost based on few physical characteristics (e.g.weight, volume, power).
• Common techniques (parametric models):
Power sizing technique. Learning curve.
Power sizing technique
• Referred to as the exponential model.
• Used for industrial plants and equipment.
𝐶𝐴𝐶𝐵
=𝑆𝐴𝑆𝐵
𝑋
Where:
CA and CB: costs for plants A and B, respectively ($ as of the time for which
the estimate is desired).
SA and SB: sizes of plants A and B, respectively (same physical units).
X: cost-capacity factor which depends on the type of plant.

7/24/2017
9
ExampleThe purchase price of a commercial boiler (capacity S) was $181,000 eight yearsago. Another boiler of the same basic design, except with capacity 1.42 S, iscurrently being considered for purchase. If the cost index was 162 for this typeof equipment when the capacity S boiler was purchased and is 221 now, and theapplicable cost capacity factor is 0.8, what is your estimate of the purchase pricefor the new boiler?
Let 𝐶𝐴 = cost of new boiler (𝑆𝐴 =1.42 𝑆) today and 𝐶𝐵 = cost of old boiler today
(𝑆𝐵 =𝑆).
𝐶𝐵 = $181,000 ×221
162= $246,920.
𝐶𝐴 = $246,920 ×1.42𝑆
𝑆
0.8
= $326,879
Learning curve• Also called experience curve or manufacturing progress function.• Reflects increased efficiency and performance with repetitive production.
𝑍𝑢 = 𝐾(𝑢𝑛)
Where:
u = output unit number.
Zu = number of input resource units needed to produce output unit u.
K = number of input resource units needed to produce the first output unit.
n = learning curve exponent = log 𝑠
log 2
s = learning curve slope parameter expressed as a decimal (𝑠 = 0.9 for a 90% learning curve).

7/24/2017
10
ExampleThe time required to assemble the first car is 100 hours and the learning rate is80%. What is the time required to assemble the 10th car?
𝑆 = 0.8 𝐾 = 100 hours 𝑢 = 10 cars
𝑍10 = 100 × 10log 0.8log 2 = 47.65 hours
*** This is not the total time to produce 10 units … it’s the time to produce the 10th unit ***
Example
You have been asked to estimate the cost of 100 prefabricated structures,each structure provides 1,000 sq.ft of floor space, with 8-ft ceilings. In 2003,you produced 70 similar structures consisting of the same materials andhaving the same ceiling height, but each provided only 800 sq.ft of floorspace. The material cost for each structure was $25,000 in 2003, and thecost capacity factor is 0.65. The cost index values for 2003 and 2014 are 200and 289, respectively. The estimated manufacturing cost for the first 1,000sq.ft structure is $12,000. Assume a learning curve of 88% and use the costof the 50th structure as your standard time for estimating manufacturingcost. Estimate the total material cost and the total manufacturing cost forthe 100 prefabricated structures.

7/24/2017
11
Material cost
𝐼2003 = 200 𝐼2014 = 289𝑆2003 = 800 𝑆2014 = 1000 𝑋 = 0.65𝐶2003 = $25,000
𝐶2014 = $25,000 ×289
200×
1000
800
0.65
= $41,764
Manufacturing cost
𝑠 = 0.88 𝐾 = $12,000
𝑍50 = $12,000 × 50log 0.88log 2 = $5,832/unit
Total cost = ($41,764+$5,832)×100 = $4,759,600.

7/24/2017
1
Chapter 4: The Time Value of Money
Objective
Explain the time value of money calculations andeconomic equivalence.
Time value of money because money can earn moremoney over time (interest on capital).

7/24/2017
2
Interest
Simple interest
Not commonly used.
Total interest is linearly proportional to the initial loan amount
(principal).
Compound interest
More common in personal and professional financing.
Interest is based on the remaining principal + any accumulated
interest.
Simple interest
𝐼 = 𝑃 × 𝑁 × 𝑖
𝐼: Total simple interest paid or earned.𝑃: Principal amount lent or borrowed.𝑁: Number of interest periods (e.g., years).𝑖: Interest rate per interest period.
Example: $1,000 loan for 3 years at a simple interest rate of 10% per year.
𝑃 = Principal = $1,000.
𝑁 = Number of interest periods = 3 years.
𝑖: Interest rate per interest period = 10% per year.
The total interest paid = 𝐼 = $1000 × 10% × 3 years = $300.
The total amount repaid at the end of the loan period = principal (𝑃) + interest (𝐼)
= $1000 + $300 = $1300.

7/24/2017
3
ExampleYou borrowed $5,000 at a simple interest rate = 0.5% per month to be repaid after 4 years. How much will you pay back?
or what is the future equivalent of the borrowed $5,000?
𝑃 = Principal = $5,000.
𝑁 = Number of interest periods = 4 years.
𝑖: Interest rate per interest period = 0.5% per month × 12 months/year = 6% per year.
The total interest paid = 𝐼 = $5,000 × 6% × 4 years = $1,200.
The total amount repaid (or future equivalent) = $5,000 + $1,200 = $6,200.
Compound interest
Interest is based on the remaining principal + accumulated interest.
Example: $1,000 loan for 3 years at a compound interest rate of 10% per year.
PeriodAmount owed at
beginning of periodInterest amount
for periodAmount owed at
end of period
1 $1,000 $100 $1,100 2 $1,100 $110 $1,210 3 $1,210 $121 $1,331
Compounding period (e.g., years, months)
= amount owed at beginning of period × interest rate = $1,000 × 10%
= amount owed at beginning of period + interest for period = $1,000 + $100
Amount owed at end of previous period

7/24/2017
4
Simple vs. compound interest
The concept of economic equivalence
• For comparing alternatives when time value of money is a factor
(compound interest is involved).
• Alternatives are reduced to an equivalent basis.
• Cash-flow diagram is an essential tool in economic equivalence.
7/24/2017
5
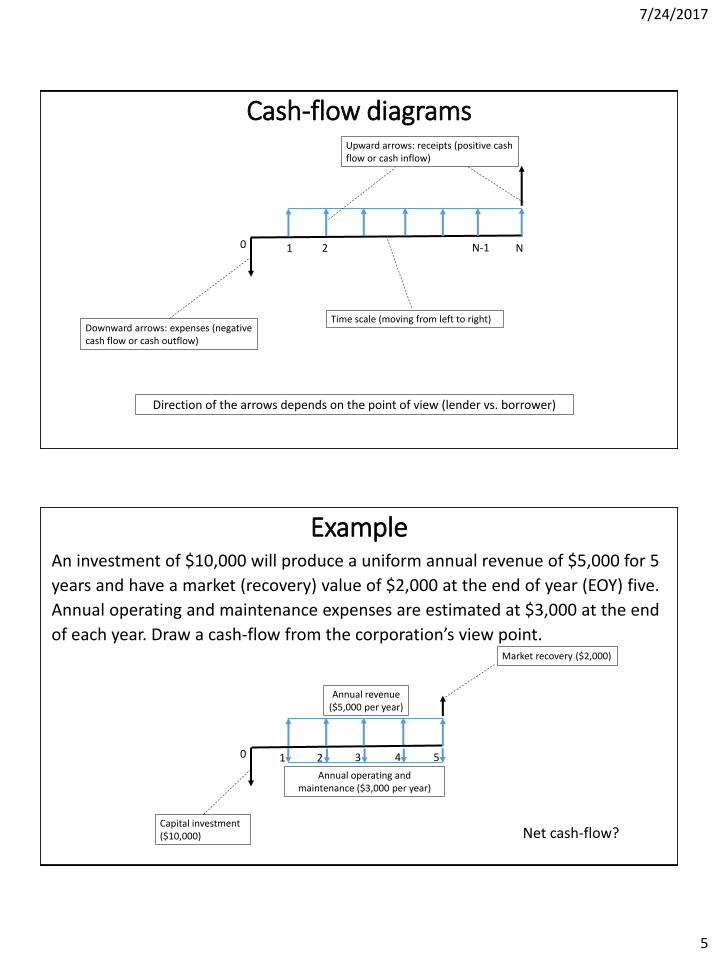
Cash-flow diagrams
0 1 2 N-1 N
Time scale (moving from left to right)Downward arrows: expenses (negative cash flow or cash outflow)
Upward arrows: receipts (positive cash flow or cash inflow)
Direction of the arrows depends on the point of view (lender vs. borrower)
ExampleAn investment of $10,000 will produce a uniform annual revenue of $5,000 for 5
years and have a market (recovery) value of $2,000 at the end of year (EOY) five.
Annual operating and maintenance expenses are estimated at $3,000 at the end
of each year. Draw a cash-flow from the corporation’s view point.
0 1 2 3 4
Annual revenue ($5,000 per year)
Capital investment ($10,000)
Market recovery ($2,000)
5
Annual operating and maintenance ($3,000 per year)
Net cash-flow?

7/24/2017
6
Cash flow diagramsNotation
𝑖: effective interest rate per interest period.
𝑁: number of compounding interest periods (e.g., years).
𝑃: present sum of money (or the equivalent sum of one or more cash flows at present time).
𝐹: future sum of money (or the equivalent sum of one or more cash flows at future time).
𝐴: end-of-period cash flow (or equivalent end-of-period value) in a uniform series starting at the end of first period and continuing through the last period.
0 1 2 N-1 N
𝑃
𝐴
𝐹Beginning of period 1 (year 1, month 1, or any other compounding period)
End of period 1
Relating present and future equivalent values• For a single cash flow and using the compound interest rate
formula.
𝐹 = 𝑃 1 + 𝑖 𝑁
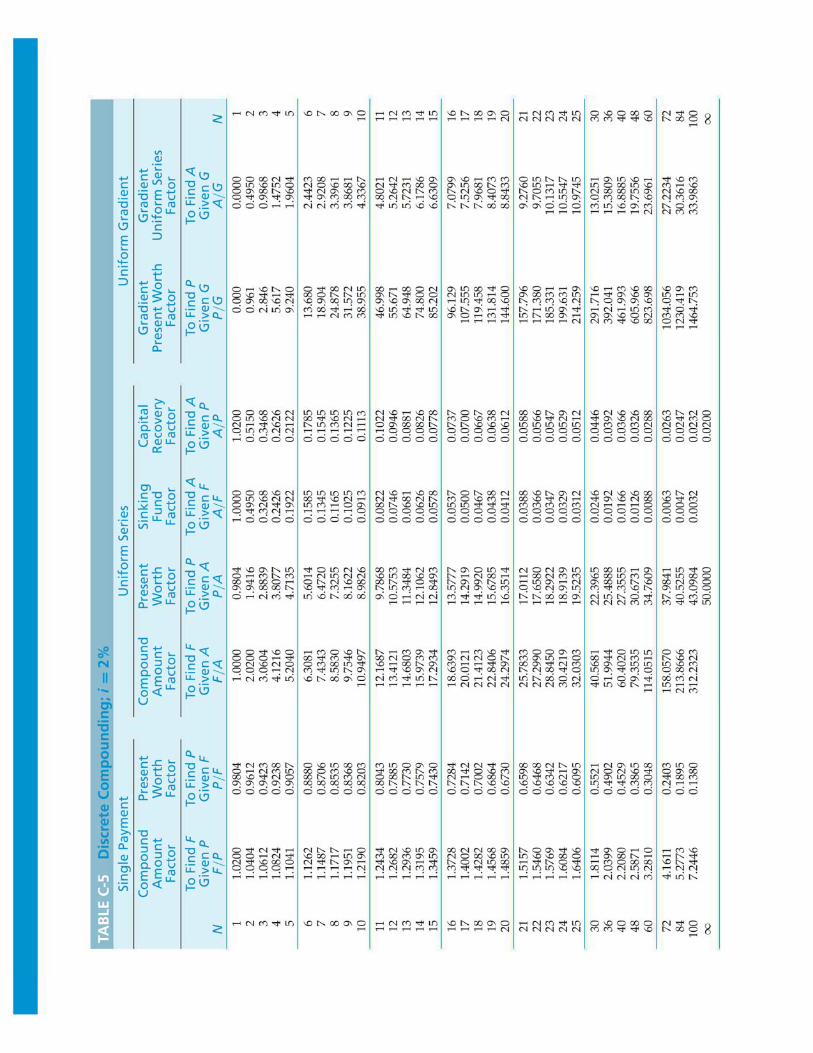
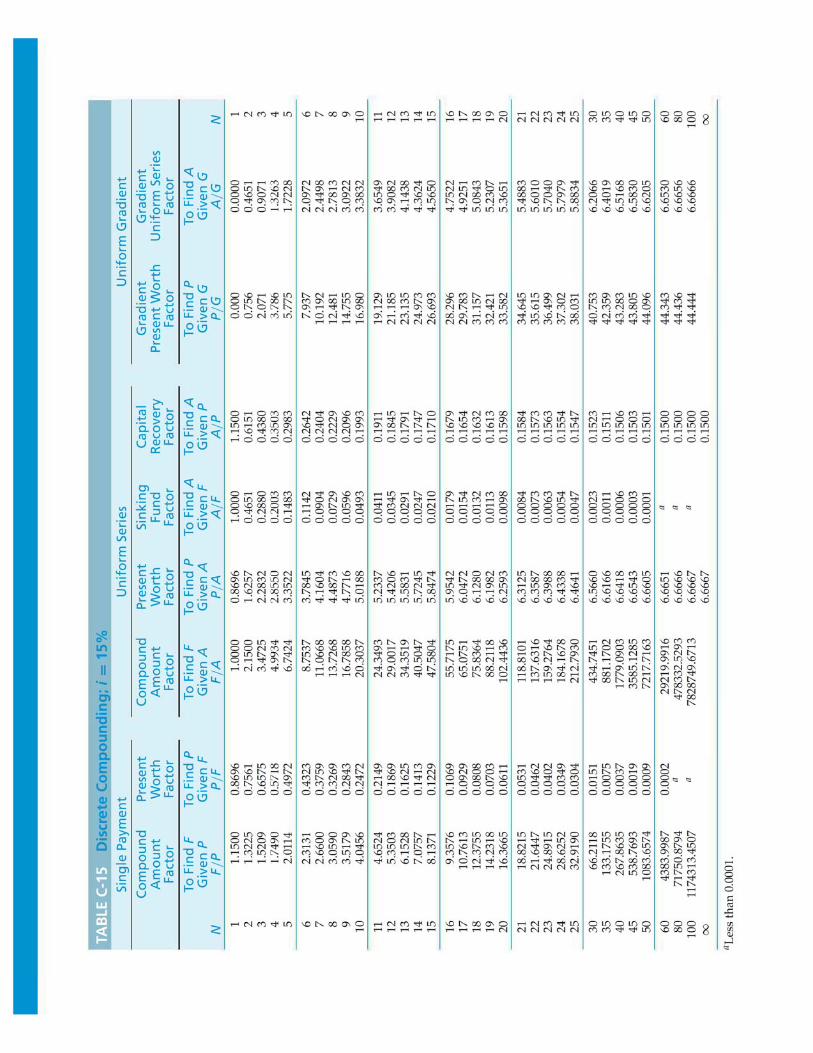
or𝐹 = 𝑃 Τ𝐹 𝑃 , 𝑖%,𝑁 𝑓𝑟𝑜𝑚 𝑡𝑎𝑏𝑙𝑒𝑠 𝑖𝑛 𝐴𝑝𝑝𝑒𝑛𝑑𝑖𝑥 𝐶
𝑃 = 𝐹 1 + 𝑖 −𝑁
or𝑃 = 𝐹 Τ𝑃 𝐹 , 𝑖%,𝑁 𝑓𝑟𝑜𝑚 𝑡𝑎𝑏𝑙𝑒𝑠 𝑖𝑛 𝐴𝑝𝑝𝑒𝑛𝑑𝑖𝑥 𝐶

7/24/2017
7
Example$1,000 loan for 3 years at a compound interest rate of 10% per year. How much will be repaid?
𝑃 = $1,000 𝑁 = 3 years 𝑖 = 10%𝐹 = ?
𝐹 = 1,000 1 + 0.1 3 = $1,331
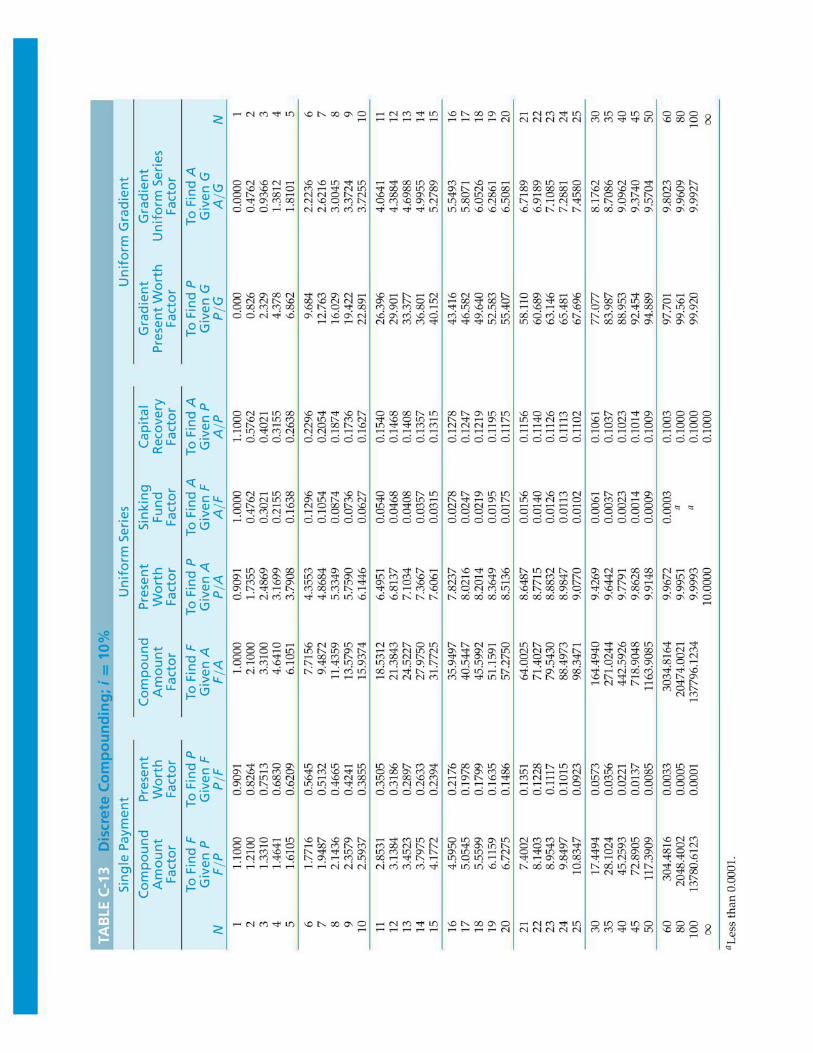
orGo to Appendix C, 𝑖 = 10% page to find Τ𝐹 𝑃 , 10%, 3
𝐹 = 1,000 × 1.331 = $1,331
ExampleYou need $10,000 after five years so you decided to save money now. How much do you need to deposit now in the bank given that the interest rate is 5% per year?
𝐹 = $10,000 𝑁 = 5 years 𝑖 = 5%𝑃 = ?
𝑃 = 10,000 1 + 0.05 −5 = $7,835.26orGo to Appendix C, 𝑖 = 5% page to find Τ𝑃 𝐹 , 5%, 5
P = 10,000 × 0.7835= $7,835

7/24/2017
8
Finding 𝒊 given 𝐹, 𝑃, and 𝑵
𝑖 = 𝑁 𝐹/𝑃 − 1
Example:
What is the interest rate that will double an investment of $50,000 in 10 years?
𝑃 = $50,000 𝐹 = $100,000 𝑁 = 10 years
𝑖 = ?
𝑖 =10
100,000/50,000 − 1 = 0.0718 = 7.18%
(to use Appendix C tables, you need interpolation).
Finding 𝑁 given 𝐹, 𝑃, and 𝑖
𝑁 =log( Τ𝐹 𝑃)
log(1 + 𝑖)Example:
How many years does it take to double my money at an interest rate of 5% per year?
𝐹/𝑃 = 2 𝑖 = 5%
𝑁 = ?
𝑁 =log(2)
log(1 + 0.05)= 14.2 years
(to use Appendix C tables, you need interpolation).

7/24/2017
9
Uniform series (annuity) to present and future 𝐴: series of uniform (equal) payments occurring at the end of each period for 𝑁 periods … also called annuity.
Example: repaying a loan in uniform monthly payments.
0 1 2 N-1 N
𝑃
𝐴
𝐹
Present equivalent value (a single value at time 0)
Annuity starts one interest period after the present equivalent
Future equivalent value (occurs at the same time as the last A, or N periods after P)
Finding 𝑭 given 𝐴
𝐹 = 𝐴1 + 𝑖 𝑁 − 1
𝑖
Or𝐹 = 𝐴 Τ𝐹 𝐴 , 𝑖%,𝑁 𝑓𝑟𝑜𝑚 𝑡𝑎𝑏𝑙𝑒𝑠 𝑖𝑛 𝐴𝑝𝑝𝑒𝑛𝑑𝑖𝑥 𝐶
Example:
How much will you have in 40 years if you invest $3,000 of your income each year in a project that earns 8% per year?
𝐴= $3,000 𝑖 = 8% 𝑁 = 40 years
𝐹 = ?
𝐹 = 3,0001 + 0.08 40 − 1
0.08= $777,169.6
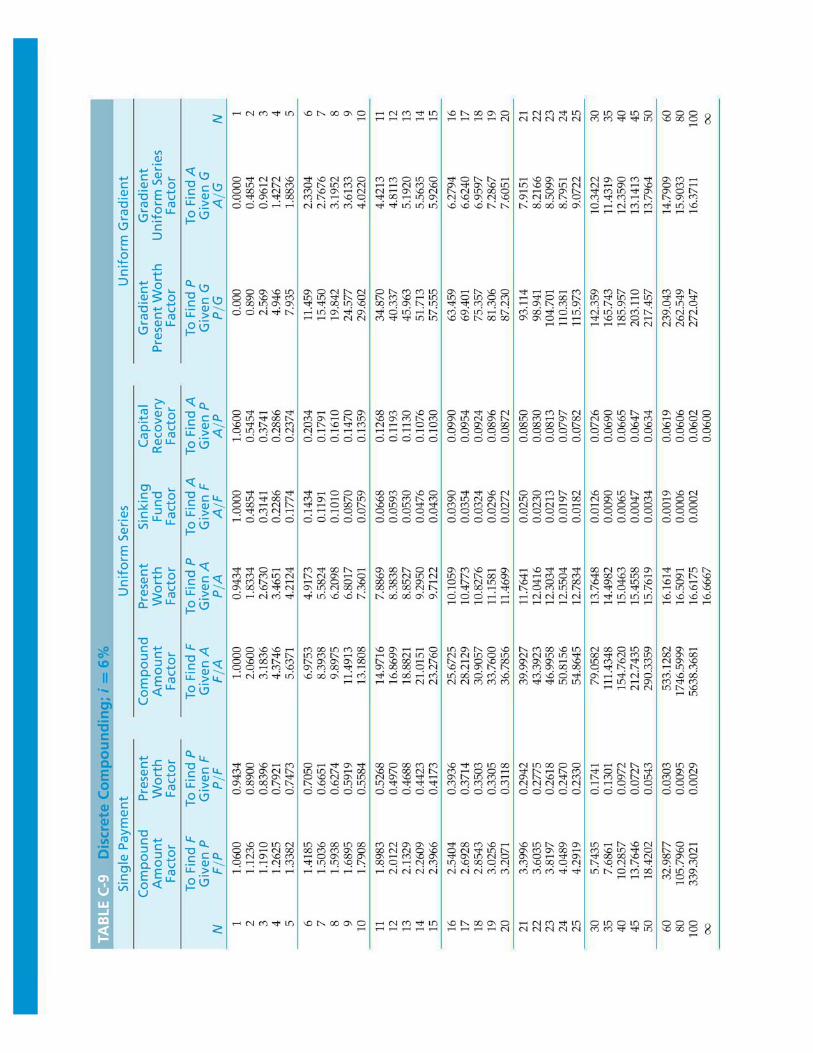
Or from Appendix C tables, Τ𝐹 𝐴 , 8%, 40 = 259.0565 𝐹 = $3,000 × 259.0565 = $777,169.5

7/24/2017
10
Finding 𝑷 given 𝐴
𝑃 = 𝐴1 + 𝑖 𝑁 − 1
𝑖 1 + 𝑖 𝑁
Or𝑃 = 𝐴 Τ𝑃 𝐴 , 𝑖%,𝑁 𝑓𝑟𝑜𝑚 𝑡𝑎𝑏𝑙𝑒𝑠 𝑖𝑛 𝐴𝑝𝑝𝑒𝑛𝑑𝑖𝑥 𝐶
Example:
You took a loan which is to be repaid in uniform payments over 4 years. Assuming the interest rate is 1% per month, and your monthly payment is $300. What is the principal amount (the amount of money borrowed)?
𝐴= $300 𝑖 = 1% per month 𝑁 = 4 years × 12 months/year = 48 months
*** the period 𝑁 should be consistent with the interest rate (interest per month period in months)
𝑃 = ?
𝑃 = 3001 + 0.01 48 − 1
0.01 1 + 0.01 48= $11,392.2
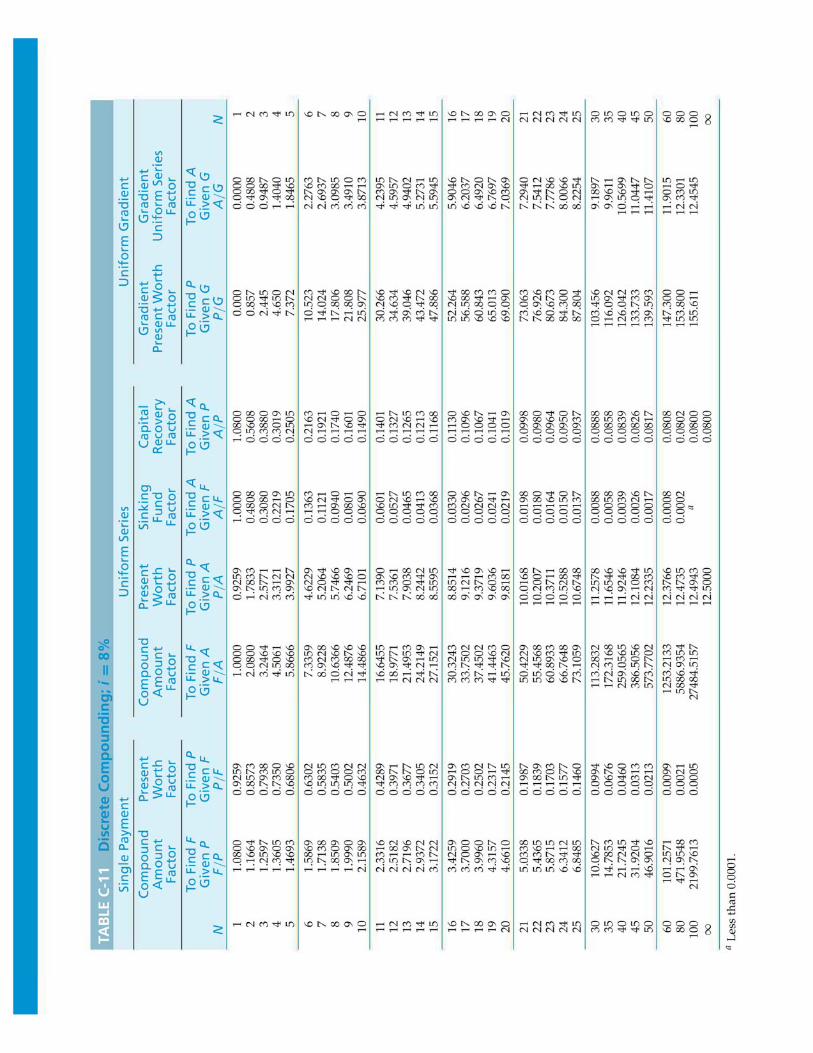
Or from Appendix C tables, Τ𝑃 𝐴 , 1%, 48 = 37.9740 𝐹 = $300 × 37.9740 = $11,392.2
Finding 𝑨 given 𝑷 or 𝑭• A given F
𝐴 = 𝐹𝑖
1 + 𝑖 𝑁 − 1
Or𝐴 = 𝐹 Τ𝐴 𝐹 , 𝑖%,𝑁 𝑓𝑟𝑜𝑚 𝑡𝑎𝑏𝑙𝑒𝑠 𝑖𝑛 𝐴𝑝𝑝𝑒𝑛𝑑𝑖𝑥 𝐶
• A given P
𝐴 = 𝑃𝑖 1 + 𝑖 𝑁
1 + 𝑖 𝑁 − 1
Or𝐴 = 𝑃 Τ𝐴 𝑃 , 𝑖%,𝑁 𝑓𝑟𝑜𝑚 𝑡𝑎𝑏𝑙𝑒𝑠 𝑖𝑛 𝐴𝑝𝑝𝑒𝑛𝑑𝑖𝑥 𝐶

7/24/2017
11
ExampleCalculate the compounded future value of 20 annual payments of $5,000 each into a savings account that earns 6% per year. All 20 payments are made at the beginning of each year.
- Definition of annuity: occurs at the end of each compounding period.
- In the example, payments are made at the beginning of each period.
𝐹 = $5,000 Τ𝐹 𝐴 , 6%, 20 Τ𝐹 𝑃 , 6%, 1
= $5,000 × 38.7856 × 1.06 = $194,963.68
Payments start at the beginning of each year, so the first annuity is at time 0. Hence, the present equivalent is at year -1 and the future equivalent is at year 19. We first use the (F/A) relationship to determine the future equivalent at year 19 and then we determine the future equivalent at year 20 using the (F/P) relationship.
Another way to solve:𝐹 = $5,000 Τ𝐹 𝑃 , 6%, 20 + $5000 Τ𝐹 𝐴 , 6%, 19 Τ𝐹 𝑃 , 6%, 1
𝐹 = $5,000 × 3.2071 + $5000 × 33.7600 × 1.06
ExampleA loan of $10,000 is to be repaid in 4 equal payments (over 4 years) and the interest rate is 10% per year. Determine the interest paid and principal repayment every year.
Find the annual payment (annuity)𝐴 = 𝑃 Τ𝐴 𝑃 , 10%, 4 = $10,000 × 0.3155 = $3,155 per year.
Fill out a table
Year Amount owed at beginning of period Interest Annual payment Principal repayment
1 $10,000 $1,000 $3,155 $2,155 2 $7,845 $785 $3,155 $2,371 3 $5,475 $547 $3,155 $2,608 4 $2,867 $287 $3,155 $2,868
Loan amount
= amount owed at beginning of period × interest rate
= annual payment – interest= amount owed at beginning of previous year – principal repayment in previous year
7/24/2017
12
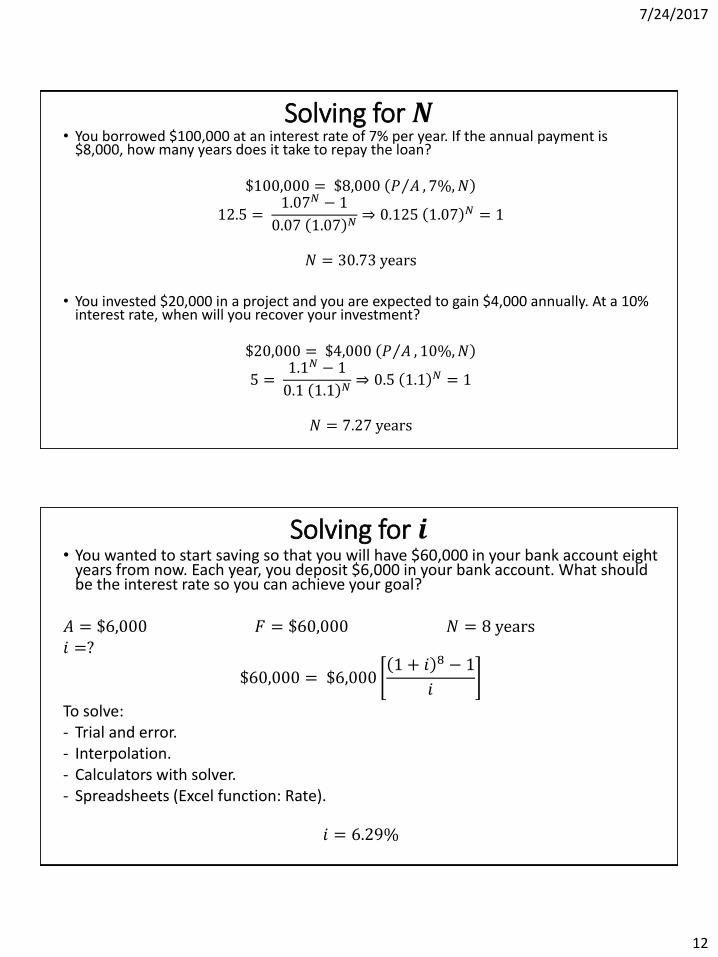
Solving for 𝑵• You borrowed $100,000 at an interest rate of 7% per year. If the annual payment is
$8,000, how many years does it take to repay the loan?
$100,000 = $8,000 Τ𝑃 𝐴 , 7%,𝑁
12.5 =1.07𝑁 − 1
0.07 1.07 𝑁⇒ 0.125 1.07 𝑁 = 1
𝑁 = 30.73 years
• You invested $20,000 in a project and you are expected to gain $4,000 annually. At a 10% interest rate, when will you recover your investment?
$20,000 = $4,000 Τ𝑃 𝐴 , 10%,𝑁
5 =1.1𝑁 − 1
0.1 1.1 𝑁⇒ 0.5 1.1 𝑁 = 1
𝑁 = 7.27 years
Solving for 𝒊• You wanted to start saving so that you will have $60,000 in your bank account eight
years from now. Each year, you deposit $6,000 in your bank account. What should be the interest rate so you can achieve your goal?
𝐴 = $6,000 𝐹 = $60,000 𝑁 = 8 years𝑖 =?
$60,000 = $6,0001 + 𝑖 8 − 1
𝑖
To solve:- Trial and error.- Interpolation.- Calculators with solver.- Spreadsheets (Excel function: Rate).
𝑖 = 6.29%

7/24/2017
13
Deferred annuities
- Ordinary annuity (uniform series) appears at the end of the first period.
- Deferred annuity (also uniform series) begins at later time.
Annuity is deferred for J periods
- To find the present equivalent (𝑃) at time zero:
𝑃 = 𝐴 Τ𝑃 𝐴 , 𝑖%,𝑁 − 𝐽 ( Τ𝑃 𝐹 , 𝑖%, 𝐽)
Deferred annuities - example
How much money should be deposited each year for 12 years if you wishto withdraw $309 each year for five years, beginning at the end of the 14th
year? Assume the interest rate is 8% per year.
0 12
14 15 18
1
𝐴?
Find the present worth of both annuities and equate.
𝐴 Τ𝑃 𝐴 , 8%, 12 = $309 Τ𝑃 𝐴 , 8%, 5 ( Τ𝑃 𝐹 , 8%, 13)𝐴 × 7.5361 = $309 × 3.9927 × 0.3677
𝐴 = $60.2
$309

7/24/2017
14
Uniform (arithmetic) gradient of cash flows
- Cash flow that changes by a constant amount (G) each period.
Present equivalent
𝑃 = 𝐺 ×1
𝑖
1+𝑖 𝑁−1
𝑖 1+𝑖 𝑁 −𝑁
1+𝑖 𝑁
Or 𝑃 = 𝐺 × ( Τ𝑃 𝐺, 𝑖%,𝑁) … tables in Appendix C
Annuity equivalent
𝐴 = 𝐺 ×1
𝑖−
𝑁
1+𝑖 𝑁−1
Future equivalent
𝐹 =𝐺
𝑖× Τ𝐹 𝐴 , 𝑖%,𝑁 −
𝑁×𝐺
𝑖
Examples
At a 15% interest rate, determine the present equivalent for the following cash flow.
𝑃 = 𝐴 Τ(𝑃 𝐴 , 15%, 4) + 𝐺 Τ(𝑃 𝐺 , 15%, 4)
𝑃 = $5,000 × 2.855 + $1,000 × 3.79= $18,065
At a 15% interest rate, determine the present equivalent for the following cash flow.
𝑃 = 𝐴 Τ(𝑃 𝐴 , 15%, 4) − 𝐺 Τ(𝑃 𝐺 , 15%, 4)
𝑃 = $8,000 × 2.855 − $1,000 × 3.79= $19,050

7/24/2017
15
Geometric sequence of cash flows- Cash flow that changes by a constant rate (
_𝑓) each period.
- First payment at EOY 1.
Example: Assume that a payment of $1,000 is made at EOY 1 anddecreases by 20% per year after the first year for 4 years. At a25% interest rate, Determine the present equivalent.
_𝑓 = −20%
𝑃 =$1,000 [1 − Τ𝑃 𝐹 , 25%, 4 Τ𝐹 𝑃 ,−20%, 4 ]
0.25 − (−0.2)
𝑃 = $1,849.38
Nominal and effective interest rates- If compounding period is less than a year.
- Annual rate is called nominal interest rate or annual percentage rate (APR).- Actual or exact rate is called effective interest rate.
- Example: if annual interest rate is 10% compounded annually, then the effective rate = nominal rate = 10%.
𝑖 = 1 +𝑟
𝑀
𝑀
− 1
Where:
𝑖: effective interest rate per year.𝑟: nominal interest rate per year.𝑀: number of compounding periods per year.

7/24/2017
16
ExampleA credit card company charges 1.375% per month on the unpaid balance. They claim that the annual interest rate is (12 × 1.375% = 16.5%).
- What is the effective interest rate per month?
Since compounding is monthly, effective monthly rate = nominal monthly rate = 1.375%.
- What is the effective interest rate per year?
𝑟 = 16.5% 𝑀 = 12 compounding periods per year
𝑖 = 1 +0.165
12
12
− 1 = 17.81%
- Does this card provide a better deal than another card which charges 16.8% annual rate compounded bimonthly?
𝑀 = 6 compounding periods per year ⇒ 𝑖 for the other card = 1 +0.168
6
6
− 1 = 18.02%
17.81% < 18.02% ⇒ the first card (16.5% per year compounded monthly) is better.
ExampleA loan of $15,000 requires monthly payments of $477 over a 36-month period.
- What is the nominal interest rate (APR)?
𝑃 = $15,000 𝐴 = $477 𝑁 = 36 months
$477 = $15,000 ( Τ𝐴 𝑃 , 𝑖𝑚𝑜𝑛𝑡ℎ𝑙𝑦%, 36)
By trial and error (or using solver) ⇒ 𝑖 = 0.75% per month
Nominal rate (𝑟) = 0.75% × 12 = 9% per year.
- What is the effective interest rate per year?
𝑖 = 1 +0.09
12
12
− 1 = 9.38% per year
- What is the amount of unpaid loan principal after 20 months?𝑃20 = $477 Τ𝑃 𝐴 , 0.75%, 16 = $7,166.59

7/24/2017
17
Examples• A loan of $2,000 at 10% annual interest rate for 8 years is to be repaid in two
payments, @ EOY 4 and EOY 8. What is the value of the payments?
Consider every 4 years as one payment.⇒ 𝑟 = 40% per 4 years compounded annually.
𝑖 = 1 +0.4
4
4
− 1 = 46.41% per 4 years
Using A/P relationship:
𝐴 = $2,000 ×0.4641 × 1.46412
1.46412 − 1= $1,739.9 every 4 years
• If the monthly interest rate is 1%, what is the effective semi-annual rate?
⇒ Monthly rate = 1% = effective monthly = nominal monthly (no additional info on compounding is provided).
Nominal semi-annual rate = 6 × 1% = 6%
Effective semi-annual rate 𝑖 = 1 +0.06
6
6− 1 = 6.15%
Continuous compounding- Allowing interest to compound continuously throughout the period ⇒ 𝑀
approaches ∞.𝑖 = 𝑒𝑟 − 1
Where 𝑖 is the effective rate and 𝑟 is the nominal rate.
Continuous compounding factors
Τ𝑃 𝐹 , 𝑟%,𝑁 = 𝑒−𝑟𝑁
Τ𝐹 𝐴 , 𝑟%,𝑁 =𝑒𝑟𝑁 − 1
𝑒𝑟 − 1
Τ𝑃 𝐴 , 𝑟%,𝑁 =𝑒𝑟𝑁 − 1
𝑒𝑟𝑁(𝑒𝑟−1)
Notice: 𝑟 is substituted (not 𝑖)
So we can use these formulas or we can substitute
the effective interest rate (𝑖) in P/F. F/A, and P/A
equations presented earlier
in the chapter

7/24/2017
18
Example• A bank offers loans at an annual interest rate of 12% compounded continuously,
- What is the effective annual interest rate?
𝑟 = 0.12 (nominal annual)
𝑖 = 𝑒0.12 − 1 = 0.1275 = 12.75%
- What is the effective monthly interest rate?
𝑟 =0.12
12= 0.01 (nominal monthly)
𝑖 = 𝑒0.01 − 1 = 0.01005 = 1.005%
- If you borrowed $10,000 on these terms, what is the future equivalent of this loan after 5 years?
Τ𝐹 𝑃 , 𝑟%,𝑁 = 𝑒𝑟𝑁 = 𝑒0.12∗5 = 1.8221 ⇒ 𝐹 = $10,000 × 1.8221 = $18,221
Or 𝐹 = 𝑃 × 1 + 𝑖 𝑁 = $10,000 × 1 + 0.1275 5 = $18,221
Or using the monthly interest: 𝐹 = $10,000 × 1 + 0.01005 60 = $18,221
Example• A nominal interest rate of 8% is compounded continuously.
- What is the uniform EOY amount for 10 years that is equivalent to $8,000 at EOY 10?
𝐹= $8,000 𝐴 = ?
𝐴 = $8,000 Τ𝐴 𝐹 , 8% 𝑛𝑜𝑚𝑖𝑛𝑎𝑙, 10 = $8,000 ×𝑒0.08 − 1
𝑒0.08×10 − 1= $543.68
- What is the present equivalent value of $1,000 per year for 12 years?
𝐴= $1,000 𝑃 = ?
𝑃 = $1,000 Τ𝑃 𝐴 , 8% 𝑛𝑜𝑚𝑖𝑛𝑎𝑙, 12 = $1,000 ×𝑒0.08×12 − 1
𝑒0.08×12(𝑒0.08 − 1)= $7,409.4
- What is the future equivalent at the end of the 6th year of $243 payments made every 6 months during the 6 years (first
payment occurs 6 months from the present and the last occurs at EOY 6)?
𝐴= $1,000 𝐹 = ?
𝐹 = $243 Τ𝐹 𝐴 , 4%, 12 = $243 ×𝑒0.04×12 − 1
𝑒0.04 − 1= $3,668.3