chapter 1 performance of agriculture sector and policy
TRANSCRIPT

1
Chapter 1
Performance of Agriculture Sector and Policy Initiatives
Crop segment constitutes about 70 per cent of total output of agriculture sector and
performance of this segment is vital for farm income, food security and price stability in
the Country. It is almost impossible to sustain 8 per cent growth in economy and 4 per
cent growth in agriculture sector if crop sector remains stagnant. Therefore, crop sector
has remained in the centre of public measures like institutional reforms, infrastructure
creation, generation and dissemination of improved technology, price and trade policy,
spreading use of modern inputs, increasing credit, enhancing irrigation facilities etc.
Eleventh Five Year Plan has focused on a model that encompass 4 per cent growth in
agriculture. This was considered vital not only for improving food and nutrient security,
but also for inclusive growth and checking rural urban divide. It is widely felt – and has
also been documented – that high rates of growth experienced by India during the last
two decades or so have largely benefited urban and non agriculture population in India.
To address this disquiet trend, the ongoing Eleventh Five Year Plan (2007-2012) has
placed heavy emphasis on agriculture and rural development and a number of important
policy measures have been initiated to address the issues of agrarian distress. Further,
right from the Ninth Five- Year Plan onwards, 4 percent growth in Indian agriculture
has been targeted, but the actual growth rate has remained considerably lower than this
target. The lower than targeted performance of agriculture in the backdrop of an
impressive growth of the overall economy has serious implications. Several studies have
pointed out to the deceleration in agricultural growth during 1990s continuing towards
middle of first decade of the new century. However, it is worth investigating whether
measures initiated during the Eleventh Plan made any difference to the growth
trajectory or not so that these lessons can be used during the 12th Plan.

2
1.1 Performance of Agriculture Sector
There are several ways to assess performance of agriculture sector. The most common
indicator is at what rate the sector is growing and whether growth rate is decelerating,
stagnant or accelerating. This is examined by looking at performance of total agriculture
and crop sector and individual crops separately.
GDP Agriculture
Growth rates are subject to limitations like sensitivity to choice of period, and deviation
of base and terminal years from normal trend. In order to overcome this problem a
complete series of decadal growth rates beginning from 1950-51 to 1960-61 extending
to 2000-01 to 2010-11 was estimated and is presented in Fig.1.1. In order to capture
performance during shorter period we have also calculated five yearly growth rates by
taking average of annual rate of change in GDP agriculture at constant prices (Fig. 1.2).
Fig 1.1. Trend growth in agriculture based on 10 years period: beginning 1951-61 and extending to 2001-11: Per cent
3
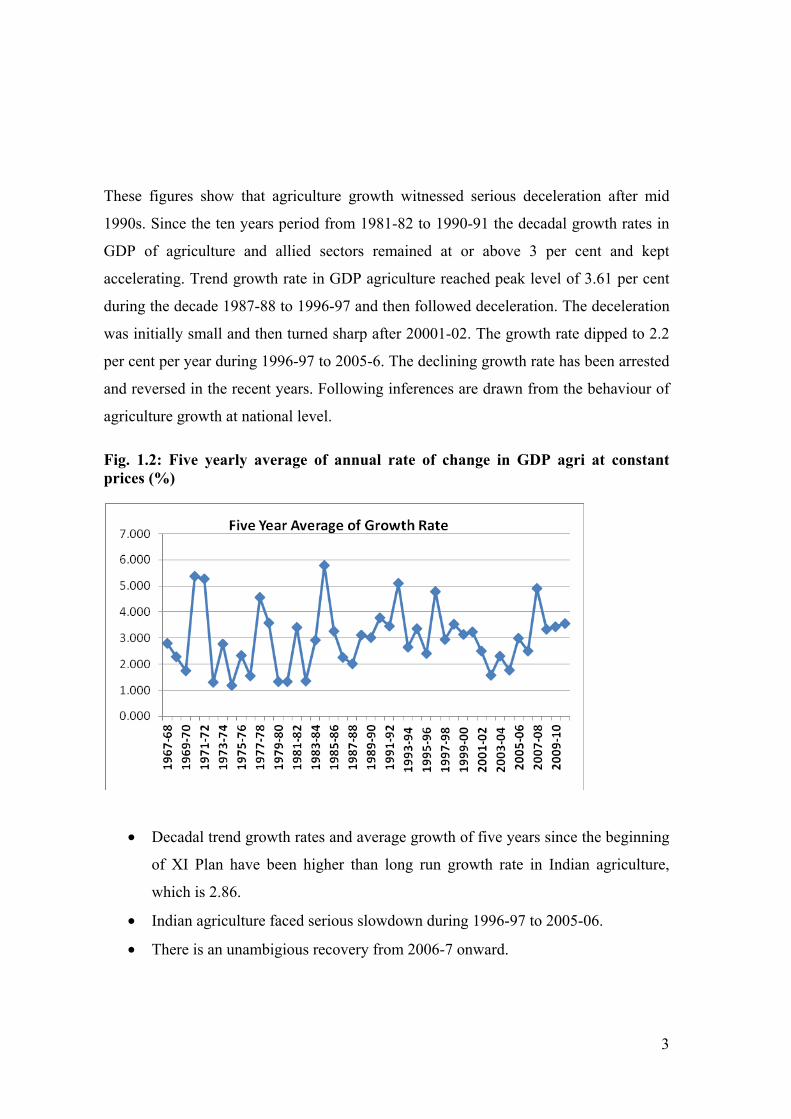
These figures show that agriculture growth witnessed serious deceleration after mid
1990s. Since the ten years period from 1981-82 to 1990-91 the decadal growth rates in
GDP of agriculture and allied sectors remained at or above 3 per cent and kept
accelerating. Trend growth rate in GDP agriculture reached peak level of 3.61 per cent
during the decade 1987-88 to 1996-97 and then followed deceleration. The deceleration
was initially small and then turned sharp after 20001-02. The growth rate dipped to 2.2
per cent per year during 1996-97 to 2005-6. The declining growth rate has been arrested
and reversed in the recent years. Following inferences are drawn from the behaviour of
agriculture growth at national level.
Fig. 1.2: Five yearly average of annual rate of change in GDP agri at constant prices (%)
• Decadal trend growth rates and average growth of five years since the beginning
of XI Plan have been higher than long run growth rate in Indian agriculture,
which is 2.86.
• Indian agriculture faced serious slowdown during 1996-97 to 2005-06.
• There is an unambigious recovery from 2006-7 onward.

4
• It is very important to find out what has contributed to this recovery? How far
those factors can go?
Agriculture Performance at Disaggregate Level
The crop sub-sector growth in the first decade of India’s planning phase (1950s) was
very impressive (3.1%). The First Five-Year Plan accorded highest priority to
agriculture and allocated substantial part of the plan outlay to this sub-sector. Further,
this period witnessed remarkable progress in land reforms, institutional changes, and
operationalization of some major irrigation projects. These initiatives played an
important role in achieving higher growth of the sector during the period. The
importance and priority given to agriculture was diluted in the Second and Third Five-
Year Plans, and as a consequence, the sub-sector witnessed a deceleration during sixties
(1.7%). This led to severe shortage of foodgrains, and the country was compelled to
import huge quantities of foodgrains. The food aid from the USA came with
conditionality, which influenced economic and foreign policies of the country, and
forced the country to put greater efforts to increase foodgrain production. In mid sixties,
a new agricultural strategy was adopted which emphasized on spreading dwarf and
high-yielding varieties (HYVs) of wheat and rice. The new strategy paid dividends and
resulted in well-acclaimed ‘green revolution’. The crop sub-sector, which was growing
at an annual rate of 1.8 per cent in the seventies, grew at the rate of 2.2 per cent in1980s
and 3.0 per cent in the nineties. Though the same growth in the crops was maintained, it
fell short of the targeted growth rate of 4 per cent in the eleventh five year plans.
The policy support, adoption of improved production technologies and public
investment in infrastructure, research and extension contributed to growth in the
agricultural sector. However, investment on agriculture declined throughout the
nineties, leading to a slowdown in the agricultural growth especially in the late nineties.
This led to deceleration in growth of total factor productivity in the north western
region, especially in rice and wheat growing areas. The continuous threat to the
production and lowered factor productivity of rice and wheat forced government to take

5
corrective measures to reverse such trends. Conscious efforts have been made in the
recent years to raise investment in agriculture.
Table 1.1: Growth Rate in Output of Various Sub-sectors of Agriculture at 1999-00 Prices, 1950-51 to 2008-09 (Per Cent/year) Period Crop
sector Live-stock
Horticul-ture crops
Non-Horticulture
crops
Cereals
1950-51 to 1959-60 3.06 1.42 0.74 3.52 3.95 1960-61 to 1969-70 1.70 0.41 4.87 1.09 2.10 1970-71 to 1979-80 1.79 3.92 2.86 1.49 2.40 1980-81 to 1989-90 2.24 4.91 2.63 2.12 2.89 1990-91 to 1999-00 3.02 3.79 5.95 2.07 2.24 2000-01 to 2008-09 3.06 3.90 3.35 2.89 2.31
The growth registered by livestock sub-sector was modest till 1970. It was 1.4 per cent
per annum in the fifties and as low as 0.4 per cent per annum in the sixties. An upsurge
in growth rate output was registered in the seventies when it rose to 3.9 per cent per
annum. Livestock sub-sector growth was always higher than crop sub-sector since 1970.
This was even during the heydays of green revolution (seventies and eighties); when the
policy emphasis was largely focused on the crop sub-sector. The acceleration continued
in the eighties (4.9%) but it slackened in the nineties and after 2000s. Even then, this
sub-sector was able to maintain a respectable growth rate close to 4 per cent per annum.
The impressive performance of the livestock sector is attributed to effective government
interventions, success of the Anand Pattern Cooperatives, and rising demands for
livestock products in response to rising incomes in urban and rural areas and growing
urbanization. Expenditure elasticities for livestock products are high with the tilt in
favour of rural areas. Future increases in per caput income and changing consumption
patterns would lead to still higher demand for livestock products, which would give
further boost to this sector.
Rapid growth in livestock sub-sector is desirable for several reasons. This sub-sector
employees about 21 million people. It is an important source of livelihood for

6
smallholders and landless labourers. And the distribution of livestock is more egalitarian
than that of land. The smallholders and landless labourers together control about 71 per
cent of cattle, 63 per cent of buffaloes, 66 per cent of small ruminants (goat and sheep),
70 per cent of pigs, and 74 per cent of poultry.
Fisheries have been recognized as a promising source of augmenting income, generating
employment and improving nutrition. Fish is also a source of nutritious food. It is also
an important source of livelihood for a large section of economically backward
population. With the changing consumption patterns, emerging market forces and
technological developments, it has assumed added importance and is undergoing rapid
transformation in the country. On the whole, the growth of the fisheries sub-sector in
India has been remarkable; growth rate of more than 5 per cent per annum in the
eighties and nineties and is attributed to the rapid development of aquaculture. However
the growth in this sunrise sub-sector has been decelerating since 2000-01.
Crop Sector More than half of cropped area in India is rainfed. Irrigation also depends to a
significant extent on precipitation. Because of these reasons performance of crop output
is strongly affected by rainfall which results in sharp year to year fluctuations in growth
of crop output. This can be seen from annual rate of change in year on year output (Fig
1.3). As was seen in the case of GDP agriculture, crop sector output also followed sharp
deceleration in growth after 1996-97. There are some changes in the growth pattern
after 2004-05. The growth rate as measured by average of annual rate of change was
4.33 per cent during the Eight Plan (1992-93 to 1996-97) and then declined to 2.25 per
cent. The deceleration continued during the Tenth Plan (2002-03 to 2006-07). There is
some increase in the rate of growth of crop output during 11th Plan. Another notable
change in growth pattern is that the effect of severe drought of 2009-10 was moderate
compared to the previous droughts of similar magnitude. This indicates increased
resilience of agriculture to weather shock.

7
Fig. 1.3: Trend in annual rate of change in crop output at constant prices
Crop Productivity Performance of crop sector has also been quite variable across crops. Also, area under
some crops is rising while some crops show decline. Thus growth in production of
various crops show much higher variation than the variation in growth in productivity.
Trend growth rate in productivity of major crops was estimated by fitting log linear
trend to two years moving average of productivity beginning with 1999-00. Still, it is
pertinent to mention that, despite this smoothening, growth rates can turn out to be
totally different with small change in the period. Cotton topped the list with more than
10 per cent annual growth in its productivity, a Bt driven phenomenon which now
occupies more than 90 percent area under cotton. Bajra comes second with more than 4
per cent annual growth in yield. Productivity of groundnut, soyabean and jowar
increased by more than 3 per cent during 2001 to 2008-9. Maize and sunflower
maintained per cent growth in productivity during the last decade. Among the two major
cereals, productivity of rice show annual growth of 1.69 percent but wheat productivity
8
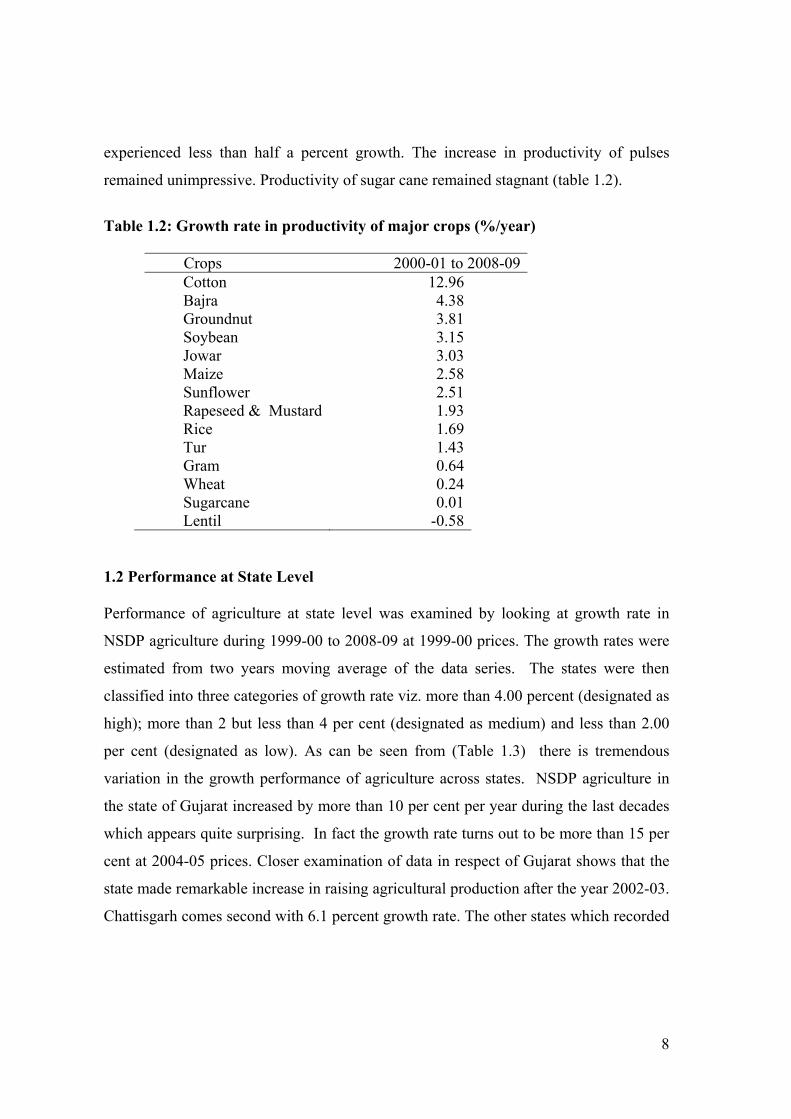
experienced less than half a percent growth. The increase in productivity of pulses
remained unimpressive. Productivity of sugar cane remained stagnant (table 1.2).
Table 1.2: Growth rate in productivity of major crops (%/year)
Crops 2000-01 to 2008-09 Cotton 12.96Bajra 4.38Groundnut 3.81Soybean 3.15Jowar 3.03Maize 2.58Sunflower 2.51Rapeseed & Mustard 1.93Rice 1.69Tur 1.43Gram 0.64Wheat 0.24Sugarcane 0.01Lentil -0.58
1.2 Performance at State Level Performance of agriculture at state level was examined by looking at growth rate in
NSDP agriculture during 1999-00 to 2008-09 at 1999-00 prices. The growth rates were
estimated from two years moving average of the data series. The states were then
classified into three categories of growth rate viz. more than 4.00 percent (designated as
high); more than 2 but less than 4 per cent (designated as medium) and less than 2.00
per cent (designated as low). As can be seen from (Table 1.3) there is tremendous
variation in the growth performance of agriculture across states. NSDP agriculture in
the state of Gujarat increased by more than 10 per cent per year during the last decades
which appears quite surprising. In fact the growth rate turns out to be more than 15 per
cent at 2004-05 prices. Closer examination of data in respect of Gujarat shows that the
state made remarkable increase in raising agricultural production after the year 2002-03.
Chattisgarh comes second with 6.1 percent growth rate. The other states which recorded

9
more than 4 per cent annual growth in agricultural output are Madhya Pradesh,
Rajasthan, Maharashtra and Andhra Pradesh.
In eastren India, Orissa shows more than 3 per cent growth but other states continue to
languish with low growth. Agriculture output in Jharkhand showed negative growth
over the last decade. Similarly, Karnataka and Assam experienced below 1 per cent
growth despite low level of productivity.
Table 1.3: Statewise Growth rate in agriculture NSDP at constant prices LOW upto 2.0 MEDIUM < 4 > 2 HIGH > 4 State TGR State TGR State TGR Jharkhand -0.9 Uttrakhand 2.2 M.P. 4.1 Karnataka 0.4 H.P 2.4 Rajasthan 4.3 Assam 0.8 Punjab 2.4 Maharashtra 4.7 Kerala 1.0 Bihar 2.5 A.P. 5.2 U.P. 1.6 J&K 3.4 Chattisgarh 6.1 Tamil Nadu 1.8 Haryana 3.5 Gujarat 11.5 West Bengal 2.0 Orissa 3.6
State wise growth trends show that despite usual explanations for low growth like
changing climate, soil degradation, stress on water resources, technology slowdown and
policy constrains some states have done exceedingly well. It also shows that action at
state level matters a lot in determining performance of agriculture in a state. There is a
need to learn from better performing states and replicate relevant experience in low
growth states particularly those with high potential.
1.3 Factors Affecting Agriculture Growth An examination of various factors affecting agriculture at national level shows that
following factors have contributed in a big way to the recovery of growth rate in recent
years:
• Improvement in terms of trade
• Public and private investments
• Quality seed, hybrids

10
• Technology
• Institutional efforts
Terms of trade
Terms of trade for agriculture witnessed a sharp decline during late 1990s to 2004-05.
There has been a turnaround in TOT after this. This is evident from terms of trade for
agriculture sector relative to non agriculture and from ratio of food price index relative
to prices of non food items. Share of agri in total GDP at 2004-05 prices was 18.9
during 2004-05. During 2010-11 it declined to 14.3 per cent at constant prices but rose
to 19.0 per cent at current prices. The difference in share of GDP in agriculture at
current and constant prices show that farm gate prices received by farmers have turned
30 percent higher than non agriculture prices during six years after 2004-5. Similarly,
ratio of implicit price index for GDP agriculture relative to non agriculture prices index
with base year 1999-00 shows turnaround after 2004-05 and a steep hike in next six
years (Fig.1.4).
Fig. 1.4 : Terms of trade based on ratio of implicit price index of gdp agriculture to gdp non agriculture

11
Investment in Agriculture Both, public as well as private investments are crucial for growth. Indian agriculture had
suffered a stagnation and even decline in public investment in agriculture for more than
two decades beginning with 1980-81 (Fig. 1.5). As a result share of public investments
in agriculture dropped from more than 5 per cent to 1.6 percent during 1980-81 and
2000-01. Private sector investment also showed phases of stagnation during this period.
This long stagnation and decline in public investment was reversed during 2004-05
when public investments in real terms (1999-00 prices) were raised by almost 30 per
cent in one shot.
Fig. 1.5. Trend in public, private and total investments in agriculture and allied sectors at 1999-00 prices
Both public as well as private investments witnessed sharp increase after 2003-04.
However, public investments showed decline again in year 2008-09. Precise change in
agricultural investments during 2005-06 to 2009-10 at 2004-05 prices is presented in

12
Table 1. 4. The table shows that much of the increase in agricultural investments seen
during the recent years is on account of private investments.
Table1.4: Annual rate of change in GFCF and GDP agriculture at 2004-05 prices (%) Year Public Private Total GDP Agri. & Allied
2005-06 19.10 10.16 12.09 5.14
2006-07 18.70 0.78 4.90 4.16
2007-08 0.73 20.07 15.04 5.80
2008-09 -2.66 30.84 23.21 -0.15
2009-10 4.90 1.89 2.43 0.44 To get a deeper and meaningful picture of the situation it is preferable to see the
behavior of investment in agriculture, both public and private as a percentage share of
the Gross Domestic Product of agriculture sector. These shares at current and constant
prices are presented in Fig. 1.6. The story remains more or less the same at constant
and current prices. Public investments as percent of GDP agriculture peaked increased
during 2004-05 to 2006-07 and then declined. India seems to be investing less than 3.5
per cent of its sectoral GDP for developing infrastructure in agriculture sector. Both
public as well as private sector show much lower share in agriculture GDP at current
prices compared to constant prices. It seems the 11th Plan could not raise public
investments to 4 per cent of GDP of agriculture.

13
Fig 1.6: Public and private investments as per cent of GDP agriculture and allied sector.
2.86 3.24 3.69 3.51 3.42 3.58
10.35 10.84 10.4911.90
15.60 15.82
0.00
2.00
4.00
6.00
8.00
10.00
12.00
14.00
16.00
18.00
2004-05 2005-06 2006-07 2007-08 2008-09 2009-10
GFCF as a % share of GDP Agri. & Allied at constant 2004-05 Prices
Public
Private
2.86 3.14 3.52 3.27 3.13 3.15
10.35 10.49 9.8310.79
13.7212.89
0.00
2.00
4.00
6.00
8.00
10.00
12.00
14.00
16.00
2004-05 2005-06 2006-07 2007-08 2008-09 2009-10
GFCF as a % share of GDP Agri. & Allied at Current Prices
Public
Private

14
Quality Seed and Hybrid
Seed is carrier of technology. During last six years strong emphasis and support has
been provided to seed sector. This has resulted in success in two fronts. One,
production of quality seed doubled in four years after 2004-5 (table 1.5). Two, public
sector has taken on private sector to compete in seed market. As a result share of private
sector in seed production has gone down in the last five years. Still ratio of quality seed
to total seed is much lower than norm (Table 1.4) and there is a tremendous scope to
raise productivity and production by raising share of quality seed in total seed used by
farmers.
Table 1.5: Total seed production by the public and private sectors Year Total seed
production (lakh qtls)
Share of private sector
(%)
Quantity of seed produced by private sector
(lakh qtl)
Quantity of seed produced by public sector
(lakh qtl) 2003-04 132.27 47.48 62.80 69.47 2004-05 140.51 45.02 63.26 77.25 2005-06 148.18 46.80 69.35 78.83 2006-07 194.31 41.00 79.67 114.64 2007-08 194.23 42.59 82.72 111.51 2008-09 250.40 39.78 99.61 150.79 2009-10 280.00 38.93 109.00 171.00
Source: Seeds Division, Department of Agriculture & Cooperation, Ministry of Agriculture, Viewed on 5 April 2011 (http://dacnet.nic.in/seednet/seeds/material/IndianSeedSector.htm#Role of Public and Private Seed Sector). Like seed there is discernable change in role of public sector in development of hybrid
after 2001-02 in all types of crops (Table 1.6). Till 2001-02, private sector developed
150 hybrids of cotton compared to 15 by public sector. Similarly, in maize the number
of hybrids developed by private and public sector was 67 and 3. In the next seven years,
share of public sector increased from 8 percent to 19 percent in cotton, 4 percent to 40
percent in maize and 25 percent to 58 percent in rice. Similar changes are observed in
the case of other crops also. A sum total of hybrids developed till date by public and the
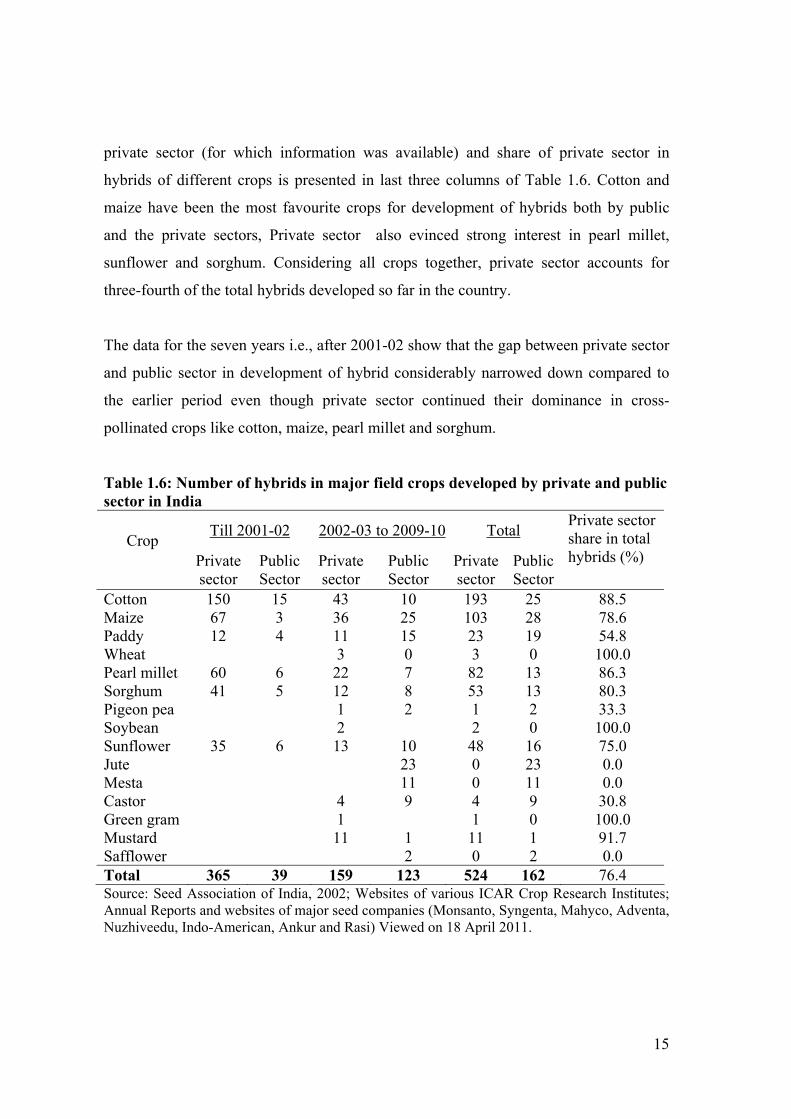
15
private sector (for which information was available) and share of private sector in
hybrids of different crops is presented in last three columns of Table 1.6. Cotton and
maize have been the most favourite crops for development of hybrids both by public
and the private sectors, Private sector also evinced strong interest in pearl millet,
sunflower and sorghum. Considering all crops together, private sector accounts for
three-fourth of the total hybrids developed so far in the country.
The data for the seven years i.e., after 2001-02 show that the gap between private sector
and public sector in development of hybrid considerably narrowed down compared to
the earlier period even though private sector continued their dominance in cross-
pollinated crops like cotton, maize, pearl millet and sorghum.
Table 1.6: Number of hybrids in major field crops developed by private and public sector in India
Till 2001-02 2002-03 to 2009-10 Total Crop Private
sector Public Sector
Private sector
Public Sector
Private sector
Public Sector
Private sector share in total hybrids (%)
Cotton 150 15 43 10 193 25 88.5 Maize 67 3 36 25 103 28 78.6 Paddy 12 4 11 15 23 19 54.8 Wheat 3 0 3 0 100.0 Pearl millet 60 6 22 7 82 13 86.3 Sorghum 41 5 12 8 53 13 80.3 Pigeon pea 1 2 1 2 33.3 Soybean 2 2 0 100.0 Sunflower 35 6 13 10 48 16 75.0 Jute 23 0 23 0.0 Mesta 11 0 11 0.0 Castor 4 9 4 9 30.8 Green gram 1 1 0 100.0 Mustard 11 1 11 1 91.7 Safflower 2 0 2 0.0 Total 365 39 159 123 524 162 76.4 Source: Seed Association of India, 2002; Websites of various ICAR Crop Research Institutes; Annual Reports and websites of major seed companies (Monsanto, Syngenta, Mahyco, Adventa, Nuzhiveedu, Indo-American, Ankur and Rasi) Viewed on 18 April 2011.
16
1.4 Recommendations
• Given the vital importance of agriculture for food security, livelihood and income
of vast majority of people and importance of the sector for overall growth of the
economy and other services provided by the sector, the country need effective
strategy to address the problems and challenges being confronted by agriculture
sector. There is also a need for policies and strategies to adjust to the new types
of technologies, changing demand patterns, upcoming value chains and
supermarkets, revolution in communication technology, institutional innovations
and globalization and other evolving changes in the system surrounding
agriculture.
• No production activity can be sustained in the long run by overlooking the health
of the production base and the producers. In this context it is essential that India
focus on farmers and natural resource system, comprising land, water, vegetation,
which form the production base of agriculture. Often, policies are focused on
farming without looking at their implications for the farmers. Unless growth and
development of farming leads to improvement in welfare of farmers, it cannot be
sustained.
• Agriculture diversification towards high value agricultural commodities like fruit,
vegetables and dairy products hold vast potential to accelerate growth and
improve farm income in the country. Harnessing full benefit of diversification
requires new institutional and contractual arrangements for production and
marketing and ensuring that smallholders are not excluded from the process.
• Growth in output and farm income depends upon a large number of factors viz.
prices of output and inputs, technology and other non price factors. Raising
growth requires remunerative and assured pricing environment for output, access
to improved technology, application of quality inputs and machinery. Further,
growth has to be achieved from a shrinking natural resource base which implies
that growth comes primarily from the increase in productivity.
• Terms of trade for agriculture during 1997 to 2005 remained adverse and are

17
identified as one of the factors for poor performance of agriculture during this
period. Due to increase in use of agricultural production for bio fuel and feed and
several constraints on supply side, prices of agricultural products are shifting to
higher equilibrium and trend. Till some big breakthrough in technology takes
place, agriculture growth will be led by price incentives. Therefore, in order to
maintain the tempo of growth, agricultural prices should not be suppressed.
• It was envisaged in the Eleventh Plan that in order to achieve 4 per cent growth
rate in agriculture India would need to raise public investment to 4% of GDP
agriculture. Public investments are falling short of this target which needs to be
met at the earliest.
• There are important lessons from disaggregate growth analysis. Much of what
happens in agriculture depends upon the action at state level and the status of
technology. Crops which experienced technological breakthroughs are showing
robust growth. Thus there is a need to motivate states to take required steps to
accelerate agriculture growth alongwith emphasis on technology.
• Technology is the prime mover for growth. Considering the costs and constraints
of resources such as water, nutrients and energy, the genetic enhancement of
productivity should be coupled with input use efficiency. This can be made
possible only by creation and utilization of new and improved technology.
• Electric power is not only cheaper but also much more efficient for undertaking
various farm operations. There is need to raise supply of power to rural areas and
agriculture sector and to check erratic supply, unscheduled cut and low voltage.
This restricts exploitation of irrigation potential in several areas and adoption of
efficient technologies like drip and sprinkler. Free or highly subsidised fixed tariff
for electric power results in inefficient use of power and also results in
indiscriminate use of scarce water resources which has serious implications for
future availability of water. Absence of user charges also constrain investments in
power generation to raise supply. Unless these issues are addressed power supply
to agriculture would remain inadequate.

18
• Increased use of inputs like quality seed and fertilizer results in instant increase in
productivity and production, and demand for such inputs is rising rapidly. Seed is
the basic input to raise productivity. In most of the crops use of quality/certified
seed in total seed use is awfully low. Inadequate availability at or near to villages,
high prices and spurious or low quality seed are the major constraints in
promoting use of seed. Weak regulation and almost complete absence of
monitoring mechanism are giving way to market for spurious inputs which is
damaging farmers interest to use quality inputs and ruins return to investment in
such inputs.
• In Central and Eastern states having a large potential like Bihar, East Uttar
Pradesh, Orissa, Assam, Chattisgarh and West Bengal, marketing infrastructure is
very underdeveloped and private trade is exploitative. As such, the incentives for
the adoption of new technology in such areas are very weak. In order to usher in
green revolution in these states farmers need to be assured of incentive structure.
• Agriculture in India is highly labour intensive activity. Cost of Cultivation data
shows that labour accounts for more than 40 per cent of the total variable cost of
crop production in most cases. Therefore, availability of labour to work in
agriculture is crucial in sustaining agricultural production. It is generally believed
that due to high level of underemployment and unemployment in rural areas there
is no shortage of labour in agriculture. However, reality in most of the countryside
is different. Evidence from field observations in various parts of the country
shows that at peak times either adequate labour is not available or it is available at
very high wage rate. Even during normal time, labour dictates its own terms and
conditions for work. Thus, despite, labour abundance and poverty in the
countryside, farmers face difficulties in getting hired labour. Because of this
production choices are strongly influenced by availability of labour. Availability
of labour for agriculture has also been severally affected by lack of willingness of
members of farm families to undertake manual work in agriculture. Policies that
reduce availability of labour for agriculture and hurt production prospects need to
be reoriented.

19

20
Chapter 2 Performance of Centrally Sponsored Schemers and Programmes
This Chapter review the performance of the central sector and centrally sponsored
schemes/ programmes implemented by the Department of Agriculture and Cooperation
during the Eleventh Five Year Plan with reference to their objectives and targets. This is
followed by suggestion for modifications, continuation or improvement in the efficacy
of schemes taking the RKVY model into consideration. Attempt is also made to study
the priority in the expenditure on agriculture and allied sectors by the States and the
Central government, and suggest ways to augment it.
2.1 Performance Review of the 11th Plan CS and CSS Schemes The CS and CSS schemes of DAC have performed well as evident from percentage
expenditures vis-a-vis RE figures: 101.88% in 2007-08, to 96.60% in 2008-09, 99.18%
in 2008-09, and to 99.13% in 2011-12. Except seeds, fertilizers, plant protection
Scheme and agricultural implements and machinery, all other schemes have shown
performance. Major finding of the analysis of various schemes is that agricultural inputs
related schemes have not performed well; which is a serious problems in view of the
stagnant or declining factor productivity noticed in a large number of states.
Suggestions on 10 Restructured Schemes proposed for 12th Plan
On the basis of restructuring, that created Central Agricultural Infrastructural Institutes,
a new scheme, by juxtaposition of 21 old schemes; and merged some schemes in the
RKVY, and created 7 National Mission schemes, and scrapped certain schemes, the
following 10 schemes are proposed for inclusion in the 12th Plan.
1. Central Agriculture Infrastructure & Establishment Scheme (CAI&ES)

21
2. National Agriculture Infrastructure and Information Development Scheme
(NAIDS) or RKVY (Infra and Info)
3. Rashtriya Krishi Vikas Yojana (RKVY)
4. National Mission on Seeds and Planting Material
5. National Food Security Mission
6. National Oilseeds and Oil-palm Mission
7. National Horticulture Mission
8. National Water Efficiency and Productivity Mission
9. National Mission on Farm Mechanisation and Energy
10. National Farmers Income Security Scheme
The proposal of the Ministry has been studied in view of the emerging scenario of
agricultural development challenges, and path ahead for meeting them.
CAIS&ES Scheme
1. CAIS & ES is a proposed Umbrella scheme carved out of juxtaposition of some 21
full schemes or scheme components that have infrastructure institutes or schemes
related to various aspects of agricultural development and statistical data collection,
generation and dissemination activities.
Regarding this restructuring the following suggestion are in order:
1. Performance of the schemes/institutes, except a few, are satisfactory.
2. What is required to be done further is:
i) To chaff out component activities with low success rates.
ii) Mark components activities with success stories, and strengthen them for
replication in other areas and provide them with more funds.
iii) Use available evaluation reports and field information to see which new
activities need to be added in the existing successful schemes.
iv) Finally, it has to be ensured that the quest for reducing number of schemes has
not led to dumping too many similar sounding schemes and component activities

22
under one gigantic Umbrella Scheme creating confusion of organisational
control clarity and losing the strategic focus on a scheme.
v) Restructuring exercise is to avoid thin spreading of resources, and make
effective implementation and monitoring of schemes when controlled by a few
implementing and monitoring agencies, and expedite approval mechanism,
which may not prove true when Umbrella Schemes grow too huge themselves.
vi) Instead of merging too many schemes of agricultural research, investigation,
extension, training, pest control, statistics, forecasting, and publicity into
CAIS&ES, these should be reorganized into three to four Umbrella Schemes,
namely: Agricultural Extension, Training and Management; Agricultural
Development Information and Data Analysis; Agricultural Marketing Scheme,
on the principle of dovetailing activities around the core activity
Merger of Existing DAC Development schemes into RKVY
In view of the fact that RKVY’s District Plan document’s comprehensiveness remained
a matter of serious concern; and its evaluation is still going on, findings of evaluation
need to of the document need to be looked at carefully before the merger of the DAC
schemes into this is carried out.
Since most of DAC schemes are already doing well, as evident from the 11th Five Year
Evaluation carried out by the Ministry, the move for merging them into large unviable
Umbrella Schemes by simply placing them under one big scheme needs to be examined
carefully. Mere shifting of activities and components from one head or scheme to
another without completing serious drills of evaluation and restructuring is not likely to
achieve higher physical and financial progress.

23
State’s Comments on RKVY
States are emphasizing that RKVY may have one fixed component and one variable
component. The fixed component may be released to the states on the basis of an
appropriate formula. The variable component may be incentivized. However, the
present formula for incentivizing RKVY, which also determines eligibility for funding
during the year under RKVY, may need some modification. The present formula is
based on a ratio of two numbers. The numerator consists of expenditure incurred by
agriculture and allied departments under the state plan. The denominator consists of the
total expenditure under the state plan. Both these numbers are not under the control of
the agriculture department. The present formula does not help the Secretary, Agriculture
in ensuring eligibility under RKVY. It is suggested that the variable component of
RKVY may be incentivized based on fixed numbers on which Secretary Agriculture
would have some control so that the expenditure under the state plan could be ensured.
New Restructured Mission Schemes
Ten existing 11th Plan schemes of National Mission are proposed to be merged into 7
national Mission schemes, namely, NFSM, NMSPM, NOOM, NHM, National Water
Efficiency and Productivity Mission, NFIS, and NMFME. These schemes should have
been assessed on the basis of evaluation studies made or available on their 11th Plan
implementation and success stories and lacunae so that the component activities, their
operational policies and monitoring mechanism are improved for better results. This
should have been done with a focus on removing their fit-for-all modal solutions to
evolve them into case-to-case customizable solution based schemes. During an Agro-
Economic Research study on NHM in which many states and their districts found that
the project had provision for fruits that do no grow in the state.
Views from Major Agricultural States
ISOPOM

24
• Flexibility for inter component diversion of funds up to 20 % for non-seed
components only, there should not be such cap.
• In open pipeline component, benefits are provided only to those who are having
sprinkler set already. In spite of this, it should be provided to any farmer in
need.
NSFM
• Inclusion of all low production areas need to be ensured.
• Lower salary of contractual staff is a problem.
• Limit of 20% inter-componential changes should be increased.
• Restriction on inter-componential changes from seed to non seed component
hinder the progress.
• There is shortage of regular fund release against allocation.
• Approval of DFSMEC at two stages i.e. at planning & at financial disbursement
which leads to delay in financial achievements.
• Engaging Secretary level officers lead to a where they don’t find time to attend
to, so there has to be.
• Sasakawa Global Extension 2000
Sasakawa Global Extension 2000 experience of the East African and the South
African countries should be replicated in India. This programme has such
features as: a) mounting knowledge-based efforts; b) an action-oriented
approach; (c) developing effective partnership with the national programmes; d)
training of extension workers; e) helping its partners in meeting new challenges;
and, f) providing flexibility for its country directors to support these programmes.
• Most of CS and CSS schemes have one or two broad components as follows:
a. Demonstration of a new variety/technology/equipment/etc.
The broad approach towards demonstration is to provide a package of
intervention, such as improved variety seeds agriculture implements, soil
improvement, package of practices etc, simultaneously. It does not help the
farmers in knowing the efficacy of one or more intervention contained in the

25
package. It makes its replication and adoption by farmers on their own
somewhat difficult. It may be considered if the desired interventions could be
taken up in phases.
b. Investment oriented – such as mechanization, soil improvement,
irrigation etc.
The investment oriented activities may need to be taken up on selective basis.
The investment oriented activities giving higher marginal return may be taken up
first but on a large scale. This would help in having demonstrable achievement
of programme objectives. This would also facilitate efficient implementation.
Schemes proposed for Scrapping
The list of schemes proposed tor scrapping was examined in the light of the
performance of these schemes, and their importance in the emerging priorities. Before
taking a final decision on the scrapping of particular scheme, impact evaluation study, if
already done, must be consulted.
The main suggestions here are:
i) The Technology Mission of Integrated Development of Horticulture In North-
Eastern States, Sikkim, J&K, and HP, need to be assessed on the basis of
evaluation studies before it is scrapped. The horticultural potential of these North
East and Himalayan Hill states need to be tapped by making this 12th Plan scheme
more resilient and vibrant.
ii) Agri-Clinic and Agri-Business centres scheme should be evaluated on the basis of
inputs from CMA Ahemedad who has done a study on this subject.
iii) The restructuring proposal has identified Macro-Management of Agriculture as
superfluous, and has categorized 10 schemes for merger with other schemes,
without specifying the scheme into which these are to be merged. Moreover, from
the overall agricultural economic imperatives that have emerged, a re-look at the
list proposed-to-be scrapped schemes is required.

26
iv) Agriculture Marketing and Trade Division need to be strengthened and made
more comprehensive in view of growing globalization of agriculture, and WTO
issues, and importance of foreign trade in making agriculture more remunerative.
Restructuring of DAC Schemes A close look at the Planning Commission driven restructuring proposal of the existing
11th Plan Schemes, numbering 51, into 10 new schemes falling into three broad
categories of CAI&ES, NAID, and 7 National Mission schemes raises certain serious
issues about it, as pointed out below:
• DAC’s present work/activity division follow, more or less, the golden principle
of dovetailing. E&S covers policy and development inputs activities; Crops Div
looks after all schemes and activities concerning food grains, schemes; Seeds
Div takes care of everything about seeds; and so on and so forth.
• The possibility of further strengthening, weeding and merger only lies within
these activity divisions, except some exceptions. The Planning Commission’s
concern for reducing the multiplicity of schemes can be more effectively done
by intra-division merger and scraping. This has dovetailing advantage of
contiguity of various activities related to core competence and activity. The
opposite scenarios is that of merging similar divisional activities into one or
more, as in the case CAI&ES, wherein all support institutions and
establishments are merged. The likelihood of poor coordination due to different
organisational priorities rendered to these infrastructure and information
activities when put under different schemes with different control may lead to
delays. However, DAC will have to debate and offer practical solutions to
ensure clear organizational and working modalities after the merger.
• The restructuring proposal needs to be seen in view of principles of: a) aligning
to structure; b) reducing complexity; c) focusing on core activities; d) creating
feasible roles; e) balancing leadership’s own roles and supervisory roles; f)
27
implementation clarity; and, finally, g) flexibility in functioning; h) uniformity
in guidelines.
• Restructuring by aligning activities with core-activities, and by dovetailing all
activities that fall in the core competence; and shifting all others activities for
merger with schemes to whose core competence these schemes can be better
aligned without losing on account of effective coordination, etc., can improve
the overall physical and financial performance.
• One basic requirement for restructuring of the on-going schemes for the next
Plan period is evaluation of their performance. Among the 51 CS and CSS
schemes, except few there is no indication of evaluation having been done by
either an internal or an external agency. The only basis for evaluation appears to
be the physical and financial performance during the 11th Plan period, which is
not adequate. Therefore, to firm up the implementation effectiveness of the new
12th Plan Schemes, the following feed back is required for making any decision
on it:
i. How many of the 51 CS and CSS schemes have been evaluated by an internal or
external agency; and what are the major recommendations.
ii. In those cases where no evaluation has at all been made, the Implementing
Divisions Joint Secretaries may state in bullets points their assessment of the
schemes.
iii. It must be ascertained whether the District Plan Document provides a reliable
district agricultural plan; and secondly whether the implementation experience
supports the move to make it the backbone of national agricultural development.
Are the states really using DAP document in fixing priorities for budget
allocation to the districts.
Therefore, the Sub-Group must seek inputs of all the concerned Divisions regarding the
evaluation status of the schemes for which the following information need to be
gathered from the Joint Secretaries of the CS and CSS schemes.

28
2.2 Expenditure Priorities for the 12th Plan Keeping in view the scheme wise performance, emerging agricultural economic position of India, and the resultant priorities to tackle the challenges, the following need to be given due priority while firming up allocations for the 12th Plan. 1. Agri-Business Clinic need to be continued in view of its good performance, and its
importance to the ailing sector, though it might require modifications that its
evaluation studies indicate.
2. Poor performance of seeds related schemes in the later years of the 11th Plan was
due to non-taking off of its schemes on loan restructuring, poor-show of Seeds
Infrastructure and Seeds Research Training. These farm input related schemes need
to be strengthened/modified instead of scrapping them or just shifting from scheme
to another.
3. In view of lower than expected performance of all three schemes of fertilizers
Division, these schemes need to be revamped in view of increasing importance of
stagnant or declining factor productivity problems of a large number of states.
4. Plant Protection schemes showed unevenness in their performance; but all that need
to be considered while deciding the treat they are to be meted out under
restructuring exercise is the undiminished role they have in arresting the declining
factor productivity and huge potential of agriculture and horticulture.
5. Agricultural Implements and Machinery scheme needs to be invigorated by all out
efforts needed in improving farm productivity and reducing farm labour safety
which is one of the focus areas of the 12th Plan under Labour and Employment.
The Sub Group strongly recommends much higher investment in agricultural
implement and machinery particularly in drought and rain fed areas.
6. Failure of Crops Division schemes of Farming Systems, and Watershed schemes
need to be probed into as Crop Division need to give more focus on Farming
Systems and Water Management approach.
7. The TM Oilseeds and Pulses schemes need to be assessed whether they are doing
enough to tap the developmental potential of technology revolution in molecular

29
biology, bio-technology, ecology management, which are high potential priorities
areas that need action. After evaluation studies, either these schemes should be
modified to factor in these visions or new schemes under the 12th Plan should be
formulated. A window under RKVY on the pattern of A3P pulses programme is
recommended to increase productivity of oilseeds.
8. NE & Himalayan States horticulture having performed well, and being a counter-
part of NHM need to be continued with some modifications. Protected horticulture
promotion in areas prone to adverse weather phenomena in the light of predicted
climate change is a must.
9. SFABC needs to be analyzed in view of the results of CMA study
10. IT Sector schemes should be assessed and strengthened in their achievement
towards linking farmers, extension scientists, and policy makers with national and
international data banks. This is one of the high potential areas in pushing
agriculture ahead.
11. RKVY’s component financial performance must be analyzed, and the physical
achievements need to be probed in details in view of the much talked-about lack of
comprehensiveness of this hurriedly formulated scheme. The results of the
evaluations carried out should be looked at seriously for making this scheme which
is being termed effective for its implementing agency level flexibility in
implementing the schemes according to the ground realities. This very flexibility
may prove to be its graveyard if not perfected in time, especially when the DAC has
proposed to merge many of CSS schemes RKVY.
12. While formulating New Schemes for the 12th Plan period there is a need to factor in
issues regarding which the Vision 2020 Document of Planning Commission has
shown concern:
For addressing issues of demographic transition, resource degradations, poverty issue
arising out of structural adjustment, globalisation, support for science & technology,
deceleration in poverty reduction – the following areas need high priority:

30
i) Natural Resource conservation and environmental protection.
ii) Tapping vast potential of soil, water and farming system.
iii) Tapping development potential of technology revolution in molecular biology,
biotechnology, ecology, and management.
iv) Tapping extension service management potential of ICT revolution by linking
farmers, workers, and scientists with national and international data and
knowledge base.
v) States with increasing factor productivity should be provided incentives for
further increasing productivity; states with constant factor productivity should be
provided agricultural inputs and other supports to raise their productivity; and
those with decreasing factor productivity should be provided rescue schemes to
arrest the declined productivity.
vi) Keeping in view strategic challenges identified in the 12th Five Year Plan,
Approached Paper of Planning Commission, there is need for formulation of new
schemes for taking care of sustained growth of agriculture.
vii) The investment oriented activities may need to be taken up on selective basis. The
investment oriented activities giving higher marginal return may be taken up first
but on a large scale. This would help in having demonstrable achievement of
programme objectives. This would also facilitate efficient implementation.

31
Chapter 3 Demand and Supply of Fertilizers, Seeds and Other Inputs
3.1. Fertilizers
The role of chemical fertilizers for increased agricultural production, in particular in
developing countries, is well established. In India, fertilizer consumption has been
increasing over the years and today India is the second largest consumer of fertilizers in
the world, after China, consuming about 26.5 million tonnes of NPK. It accounted for
15.3 per cent of the world's N consumption, 19 per cent of phosphatic (P) and 14.4 per
cent of potassic (K) nutrients in 2008. However, average intensity of fertilizer use in
India remains much lower than most countries in the world and is highly skewed, with
wide inter-regional, inter-state, and inter-district variations.
The importance of fertilizers in yield improvement, which is essential for achieving
increased agricultural production, further increases because there is little scope for
bringing more area under cultivation as well as majority of Indian soils are deficient in
many macro and micro nutrients. The application of essential plant nutrients,
particularly major and micronutrients in optimum quantity and right proportion, through
correct method and time of application, is the key to increased and sustained crop
production. However, the demand-supply gap of fertilizers in India has increased in
recent times, thereby leading to increased dependency on imports. Indian imports,
which were about 2 million tonnes in early part of 2000s, increased to 10.2 million
tonnes in 2008-09. In view of importance of fertilizers in agricultural growth and the
possibility of an emerging demand-supply gap, there is need to forecast future demand.
Demand Projections

32
Various methodologies have been used for projections of demand for fertilizers. Some
of important approaches include, normative approach/foodgrains target approach
(quantity of fertilizer required to produce specified level of agricultural output), positive
approach (quantity of fertilizers required corresponding to different scenarios of
variable that affect demand for fertilizers), population nutrition approach (using
projected population figures and per capita demand for foodgrains), and multiple
regression model. Based on past experience, foodgrains target approach and multiple
regression method seem to have projected demand for fertilizers fairly close to actual
demand.
Regression Method Estimates
The fertilizer demand function is often referred to as a “derived” demand because it is
determined to a large extent by the final demand for the crop produced. In general, the
demand for fertilizer depends on (a) the price of the crop(s), (b) the price of fertilizer,
(c) prices of other inputs that substitute for or complement fertilizer, and (d) the
parameters of the production function that describe the technical transformation of the
inputs into an output (i.e., the fertilizer response function). Though prices may be
important in determining fertilizer consumption, they are possibly less important than
other non-price factors such as introduction of new technology, high yielding crop
varieties, expanded irrigation, availability of credit, changing cropping pattern, etc.,
causing the derived demand for fertilizers to shift over time.
Specifying a forecasting model is always a challenge, especially the model type and
relevant variables. The common models are time series models where the forecast is
based on past observations of the variable being forecasted. Causal models and
qualitative methods have also been used. Causal models such as simple linear regression
models are preferable when projections of the exogenous variables are available.
Qualitative methods such as expert opinion are popular when insufficient data is
available to estimate a model or when there is a need to augment the results of a
quantitative method. In a single equation approach, which has been used widely,
33
typically demand function is estimated using time series of fertilizer use with some
price and non-price variables and often a linear trend. We used causal model because
time series data on fertilizer consumption as well as variables influencing fertilizer use
are available.
The fertilizer demand model using annual time series data, from 1976-77 to 2009-10
using simple linear regression model using ordinary least squares (OLS) method was
estimated. We hypothesized that the demand for fertilizer is a function of prices
(specifically price of fertilizers and foodgrains), subsidy, as well as non-price factors
such as irrigated area, coverage of high yielding varieties, area under foodgrains and
non-foodgrains, cropping intensity, rainfall, capital availability, etc. Among a large
number of factors considered in the study, the following variables were finally used in
the model based on their statistical significance and stability of the functional
relationship to estimate demand for the XII Five Year Plan period 2012-13 to 2016-17.
Separate nutrient demand functions were estimated for nitrogen (N), phosphorous (P),
potassium (K) and total fertilizers (N+P+K) in the country. The empirical model for the
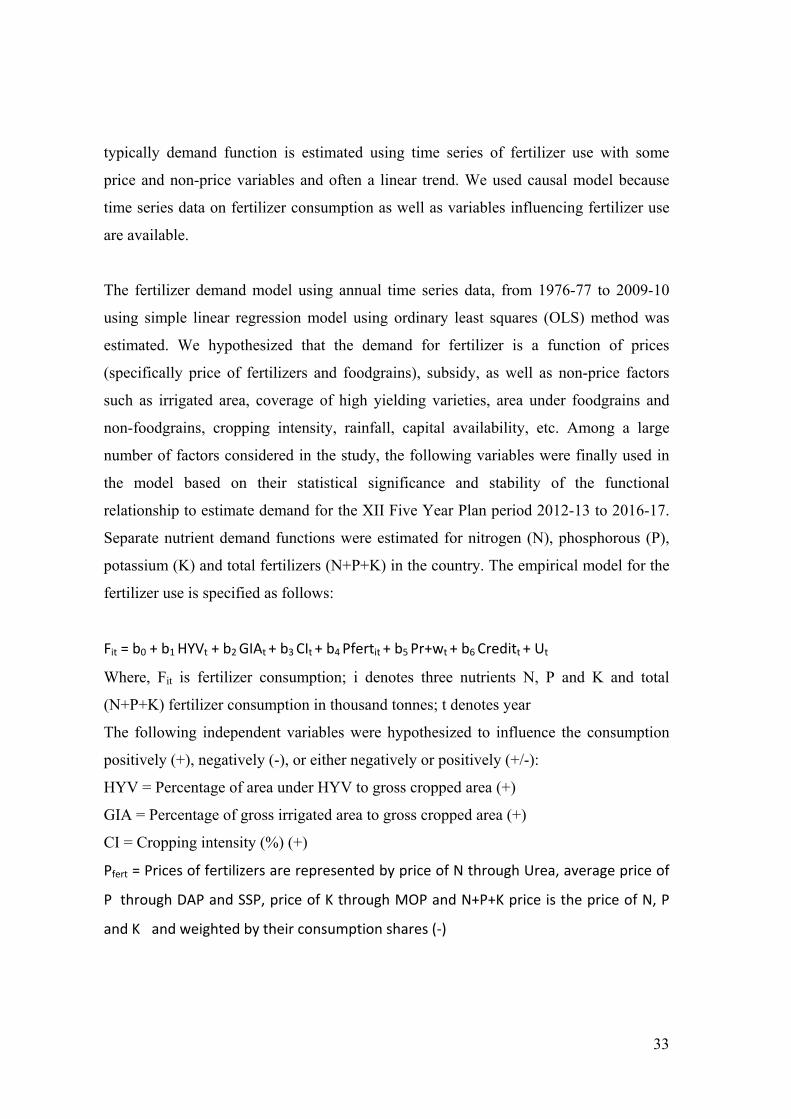
fertilizer use is specified as follows:
Fit = b0 + b1 HYVt + b2 GIAt + b3 CIt + b4 Pfertit + b5 Pr+wt + b6 Creditt + Ut
Where, Fit is fertilizer consumption; i denotes three nutrients N, P and K and total
(N+P+K) fertilizer consumption in thousand tonnes; t denotes year
The following independent variables were hypothesized to influence the consumption
positively (+), negatively (-), or either negatively or positively (+/-):
HYV = Percentage of area under HYV to gross cropped area (+)
GIA = Percentage of gross irrigated area to gross cropped area (+)
CI = Cropping intensity (%) (+)
Pfert = Prices of fertilizers are represented by price of N through Urea, average price of
P through DAP and SSP, price of K through MOP and N+P+K price is the price of N, P
and K and weighted by their consumption shares (-)
34
Pr+w = Output price is represented by procurement price of rice and wheat (main users of
fertilizers) and weighted by the share of their production (+)
Credit = Short term production credit per hectare of gross cropped area (Rs.) (+)
Two forms of functions, namely, linear and Cobb-Douglas, were tried in this analysis.
The results of linear regression equation were used for interpretation as it was found
better when compared with Cobb-Douglas production function.
Fertilizer Demand Projections
Based on the estimated regression results and the projected values of the explanatory
variables, we forecasted the demand for fertilizer. The demand forecasts have been
made assuming the growth in explanatory factors according to the last five and 10 year
time trend (2005-06 to 2009-10 and 2000-01 to 2009-10) and in case of fertilizer prices,
we have assumed an increase of about 5 percent per year. A comparison between the
actual fertilizer nutrients consumption and model estimated consumption showed the
model tracks historical data well.
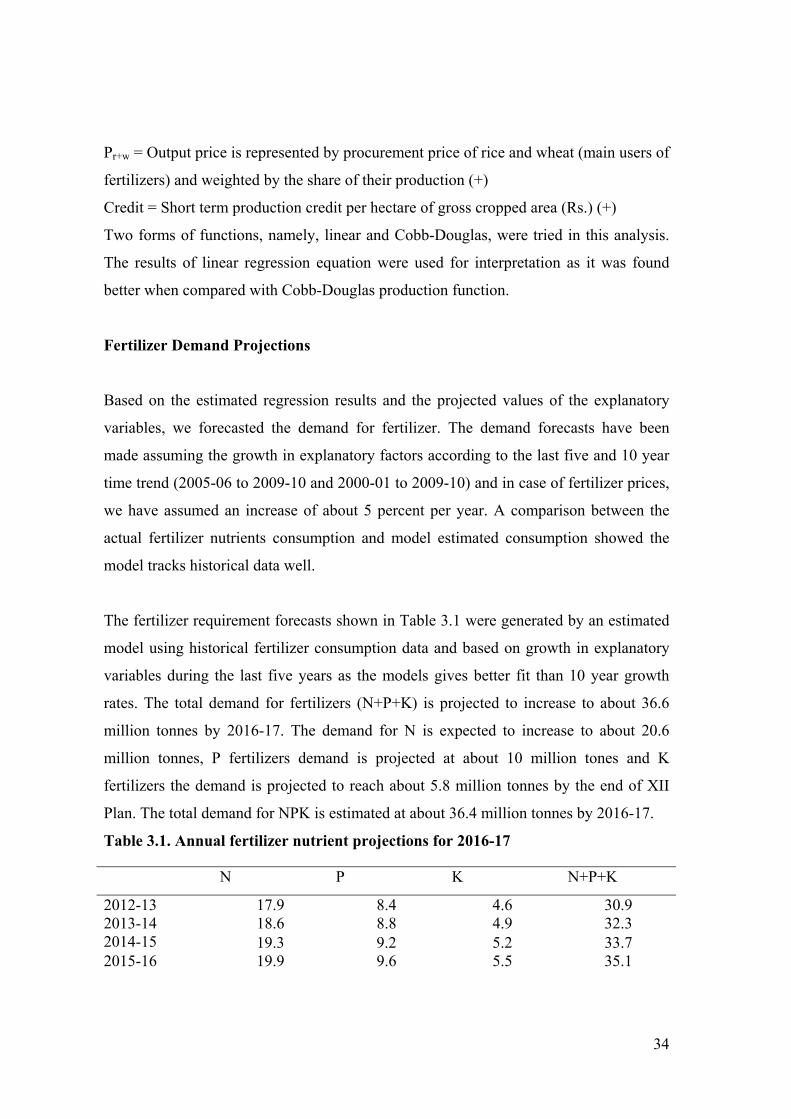
The fertilizer requirement forecasts shown in Table 3.1 were generated by an estimated
model using historical fertilizer consumption data and based on growth in explanatory
variables during the last five years as the models gives better fit than 10 year growth
rates. The total demand for fertilizers (N+P+K) is projected to increase to about 36.6
million tonnes by 2016-17. The demand for N is expected to increase to about 20.6
million tonnes, P fertilizers demand is projected at about 10 million tones and K
fertilizers the demand is projected to reach about 5.8 million tonnes by the end of XII
Plan. The total demand for NPK is estimated at about 36.4 million tonnes by 2016-17.
Table 3.1. Annual fertilizer nutrient projections for 2016-17
N P K N+P+K
2012-13 17.9 8.4 4.6 30.9 2013-14 18.6 8.8 4.9 32.3 2014-15 19.3 9.2 5.2 33.7 2015-16 19.9 9.6 5.5 35.1
35
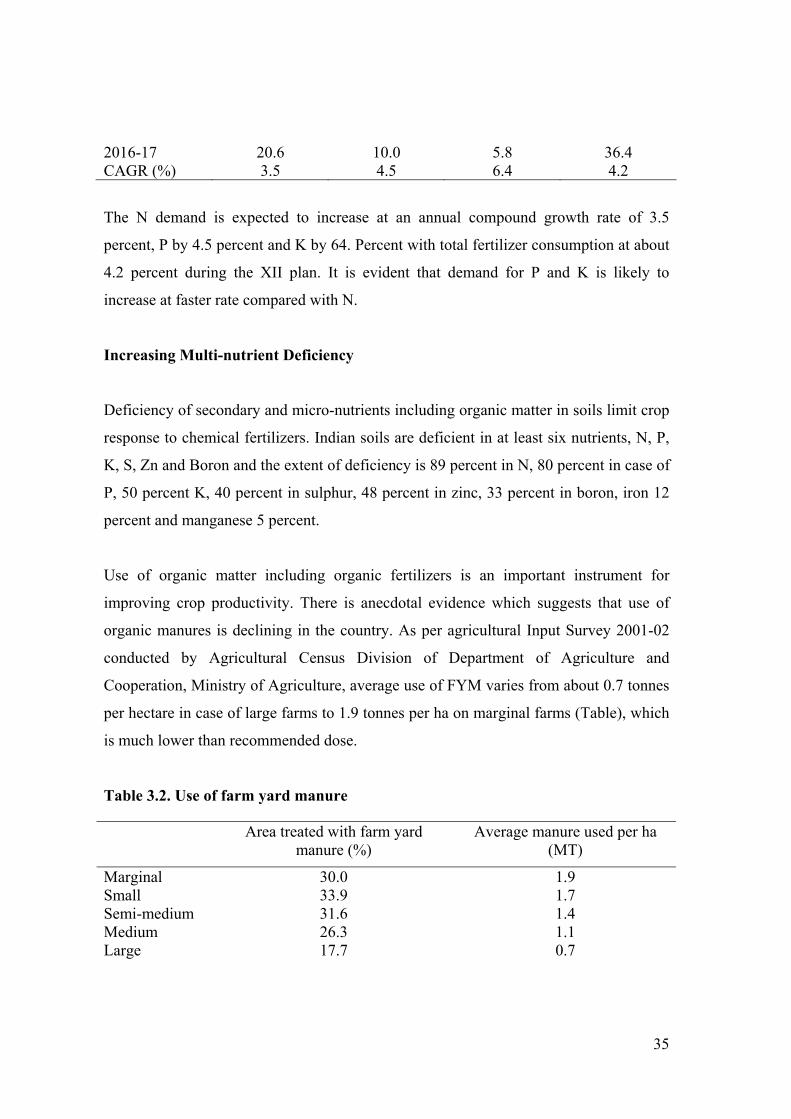
2016-17 20.6 10.0 5.8 36.4 CAGR (%) 3.5 4.5 6.4 4.2
The N demand is expected to increase at an annual compound growth rate of 3.5
percent, P by 4.5 percent and K by 64. Percent with total fertilizer consumption at about
4.2 percent during the XII plan. It is evident that demand for P and K is likely to
increase at faster rate compared with N.
Increasing Multi-nutrient Deficiency
Deficiency of secondary and micro-nutrients including organic matter in soils limit crop
response to chemical fertilizers. Indian soils are deficient in at least six nutrients, N, P,
K, S, Zn and Boron and the extent of deficiency is 89 percent in N, 80 percent in case of
P, 50 percent K, 40 percent in sulphur, 48 percent in zinc, 33 percent in boron, iron 12
percent and manganese 5 percent.
Use of organic matter including organic fertilizers is an important instrument for
improving crop productivity. There is anecdotal evidence which suggests that use of
organic manures is declining in the country. As per agricultural Input Survey 2001-02
conducted by Agricultural Census Division of Department of Agriculture and
Cooperation, Ministry of Agriculture, average use of FYM varies from about 0.7 tonnes
per hectare in case of large farms to 1.9 tonnes per ha on marginal farms (Table), which
is much lower than recommended dose.
Table 3.2. Use of farm yard manure
Area treated with farm yard manure (%)
Average manure used per ha (MT)
Marginal 30.0 1.9 Small 33.9 1.7 Semi-medium 31.6 1.4 Medium 26.3 1.1 Large 17.7 0.7
36
All Groups 29.1 1.4 Source: Input Survey 2001-02
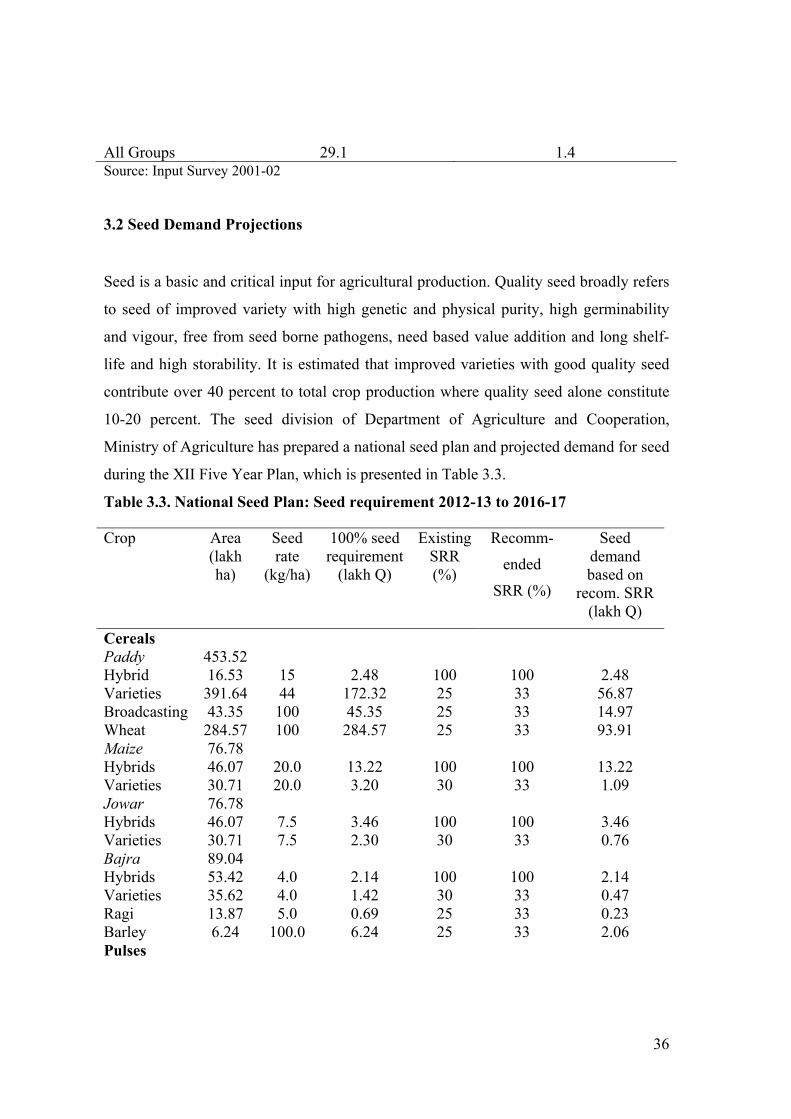
3.2 Seed Demand Projections
Seed is a basic and critical input for agricultural production. Quality seed broadly refers
to seed of improved variety with high genetic and physical purity, high germinability
and vigour, free from seed borne pathogens, need based value addition and long shelf-
life and high storability. It is estimated that improved varieties with good quality seed
contribute over 40 percent to total crop production where quality seed alone constitute
10-20 percent. The seed division of Department of Agriculture and Cooperation,
Ministry of Agriculture has prepared a national seed plan and projected demand for seed
during the XII Five Year Plan, which is presented in Table 3.3.
Table 3.3. National Seed Plan: Seed requirement 2012-13 to 2016-17
Crop Area (lakh ha)
Seed rate
(kg/ha)
100% seed requirement
(lakh Q)
Existing SRR (%)
Recomm-
ended
SRR (%)
Seed demand based on
recom. SRR (lakh Q)
Cereals Paddy Hybrid Varieties Broadcasting
453.52 16.53 391.64 43.35
15 44 100
2.48
172.32 45.35
100 25 25
100 33 33
2.48 56.87 14.97
Wheat 284.57 100 284.57 25 33 93.91 Maize Hybrids Varieties
76.78 46.07 30.71
20.0 20.0
13.22 3.20
100 30
100 33
13.22 1.09
Jowar Hybrids Varieties
76.78 46.07 30.71
7.5 7.5
3.46 2.30
100 30
100 33
3.46 0.76
Bajra Hybrids Varieties
89.04 53.42 35.62
4.0 4.0
2.14 1.42
100 30
100 33
2.14 0.47
Ragi 13.87 5.0 0.69 25 33 0.23 Barley 6.24 100.0 6.24 25 33 2.06 Pulses

37
Gram 79.73 75 59.8 25 33 19.73 Lentil 13.05 25 3.26 25 33 1.08 Peas 6.25 75 4.69 25 33 1.55 Urd 26.04 20 5.21 25 33 1.72 Moong 28.03 20 5.61 25 33 1.85 Arhar 34.02 10 3.40 30 50 1.70 Moth 11.00 15 1.65 25 33 0.54 Cowpea 6.00 25 1.50 25 33 0.50 Horsegram 2.70 30 0.81 25 33 0.27 Rajmash 1.00 60 0.60 25 33 0.20 Oilseeds Groundnut 62.19 150 93.29 25 33 30.78 Mustard 61.90 5 3.10 30 50 1.55 Soybean 97.35 75 73.01 25 33 24.09 Sunflower Hybrids Varieties
18.33 10.66 7.67
10 10
1.07 0.77
100 30
100 50
1.07 0.38
Linseed 3.63 25 0.91 25 33 0.30 Castor Hybrids Varieties
8.01 6.41 1.60
12.5 12.5
0.80 0.20
100 30
100 33
0.80 0.07
Safflower 2.88 12 0.35 25 33 0.11 Sesamum 19.42 5 0.97 25 33 0.32 Fibre Crops Cotton Hybrid Varieties
101.32 89,06 12.26
2.25 25
2.0 3.07
100 30
100 50
2.00 1.53
Jute 8.11 5 0.41 100 100 0.41 Mesta 2.01 10 0.20 30 50 0.01 Sunhemp 0.06 25 0.02 30 50 0.01 Source: Seed Division, Department of Agriculture and Cooperation, Ministry of Agriculture
Seed Sector Related Issues and Suggestions
Inadequate availability of quality seeds, planting material and germplasm are major
constraints limiting productivity. Supply of quality seeds is, therefore, absolutely
essential for increasing productivity of crops and total agricultural production. The
major issues related to seed sector include:

38
• Seed germination rate: The germination rate determines the minimum plant
population in the field which ultimately decides the yield levels. Often the farmers
face the problem of poor seed germination rate. A minimum seed germination rate
of 90 % is to be ensured by seed industry. Necessary regulatory mechanism is
needed to ensure supply of quality seed to the farmers by the industry.
• Seed Replacement Ratio (SRR)/ Variety Replacement Ratio (VRR): SRR coupled
with VRR is a major cause of concern affecting the yield of major crops in the
country. The reported SRR for cereal crops was 15-20% and it was as low as 2-
3% in case of pulses. Therefore, there is an urgent need to create awareness on
seed and variety replacement among farmers for important food crops.
• High Cost of Seeds: The cost of good quality seeds especially hybrid seeds are
very high and farmers at times are not able to purchase the seed at high cost.
Considering the land holding size of small and marginal farmers who will be
affected by the high cost of hybrid seeds, the seed producing companies should
bring down the cost of quality seed. Supply of seed to small and marginal farmers
must be at subsidized rates with Government support.
• High cost of transportation: Cost of transportation for some of the seeds e.g.
Potato seeds is high because the seed production centres are located far away from
the areas where potato production takes place. Localized seed production centres
may be created to avoid the high cost of transportation.
• Credit Flow: Non availability of credit for seed production to the seed producers,
especially the private seed companies at concessional rates is an issue. Therefore,
there is an urgent need to enhance the credit flow to the seed industry especially
term loan for creating infrastructure like storage, processing etc.
• Quality Research: There is a need for development of multi-resistant (resistant to
pests, diseases, drought, frost, soil salinity/ acidity etc) crop varieties. The seed
industry/ICAR/SAUs may undertake quality research for development of multi-
resistant crop varieties and production of seeds of such varieties.
• Seed storage: The viability of the seed requires to be maintained to get
satisfactory germination percentage. Therefore seed storage is a major concern
39
especially in the eastern region due to humid climatic conditions. Adequate
storage infrastructure is to be created to save the seed from damage.
• Protecting Germplasm: There has been an incidence of erosion in germplasm from
the country. The stakeholders of the seed industry may ensure that this type of
situation does not arise in the seed sector. Sharing of germplasm between public
and private seed companies is an option to protect the precious germplasm.
• Diversity in Seed Production: India has as many as 45 major crops for which the
seed has to be produced within the country. It is a challenging task to seed sector
to meet the seed requirement of such a diversified crop range. Seed hubs are to be
identified to produce seed and supply the same to the farmers in the area. This
also saves cost of transportation of seed and thus reduces the cost of seed supply
at farmer level.
• Infrastructure: Infrastructure is required for seed processing, storage,
transportation and distribution. The existing infrastructure facilities of public seed
agencies for meeting the above requirements are not satisfactory.
• Plan for Seed Production: The existing seed production plans are mainly one year
plans. There is an acute shortage of seed in cases of natural calamities. Under such
circumstances, the seed companies should be able to supply the required seed to
meet such exigencies. Therefore existing seed production plans may be changed
to a long term perspective plans (considering the viability of the seed) so as to
keep buffer stock of seed to meet any eventuality of natural calamities.
• Insurance: As seed production involves intensive crop cultivation practices, the
cost of cultivation is more than the normal cultivation. At times the seed crop may
get damaged due to natural calamities. Therefore, it was suggested that the seed
producers, processors and farmers should be adequately covered with appropriate
insurance.
• Seed Banks: Seed Banks are very popular in rural areas especially with tribals.
There are incidences of managing seed banks in tribal districts of Orissa. The
tribals save seeds of millets for distribution to the members during the next
cropping season. The seed banks not only protect the existing crop varieties but

40
also ensure supply of seed to the farmers. There is a need for creation of more
seed banks by implementing seed bank scheme.
• Technology upgradation: The seed processing machinery available with the seed
companies is old, suitable to process seed of one or two crops only which affects
the performance of processing units and also the quality of seed. The seed
processing units are required to upgrade the processing equipment with multi-
grain processors. Adoption of new technologies in seed production and transfer of
available technologies are important aspects in seed production.
• Awareness creation: Lack of awareness on importance of quality seed in crop
production resulting in low Seed and Variety Replacement Ratio. Efforts by the
Agriculture Extension personnel are required to create awareness in the farmers
on importance of seed.
• Involvement of Voluntary Organizations: The involvement of Voluntary
Organizations in seed production has already been reported from the eastern
region (voluntary organizations like LALL have been doing good work in seed
production in Orissa). The seed producing agencies in other parts of the country
may involve the local voluntary agencies in seed production process especially for
mobilizing the farmers to take-up seed production, training of farmers etc.
• Seed Business Ventures Model: Promoting rural self sustainable micro seed
ventures by Seed Business Ventures Model. Seed Business Incubator provides
holistic support to the entrepreneurs in terms of basic seeds, capacity building,
quality control, business consultancy, branding and marketing by commercializing
new cultivars and benefiting the farmers.
• Public Private Partnership (PPP): At present, the public seed agencies owing to
their social responsibility are engaged mostly in production and supply of high
volume- low value seed; whereas, the private seed agencies concentrate on
production of low volume - high value seed. Under the circumstances, the PPP
model in seed production is an innovative idea where the public and private seed
companies share knowledge on seed production, share the responsibility of seed

41
production for supply to the farmers and share germplasm. The private seed
agencies may pay royalty for sharing germplams for seed production.
• Lending rates for seed production: Lending to the seed industry should be 'on par'
with other agricultural lending as far as interest rate is concerned.
• Seed certification: Seed certification charges are on a higher side and there is need
to reduce the certification charges.
• Forage Seed Production: There is huge demand supply gap in forage seed
production. The seed companies are not coming forward for production of forage
seeds. This is a major cause of concern for development of Dairy sector in the
country. The Seed companies and SAUs have to take-up forage seed production
on a priority basis.
Suggestions:
• In view of the difficulties encountered by hybrid seed producers with respect to
shortage of trained labour, capacity building programmes on seed pollination have
to be organized.
• Subsidy under Government programmes may be extended for production of
truthfully labelled seeds also.
• Participation of Voluntary Agencies to take-up seed production is to be
encouraged by supplying foundation seed.
• Regulatory measures for quality seed production have to be tightened so as to
avoid supply of spurious seeds to the farmers.
• PPP model for seed production is to be encouraged for the benefit of farmers.
• Quality foundation seed of forage crops should be made available to private seed
companies for producing quality fodder seeds & supply to farmers
• The seed companies should be made responsible for poor performance of seed
supplied by them. The details of seed traits should be displayed on seed agency
website.

42
• The breeder seed of popular varieties may be made available to the private seed
producers for production of foundation and certified seeds. The private seed
companies may consider paying royalty to public sector seed agencies for sharing
the germplasm available with them.
• The “truthfully” labelled seed produced through Govt. supported schemes like
‘Seed Village Programme’ may be labelled in the farmers field itself so as to
ensure traceability.
• The public seed agencies may create adequate storage facilities for seed. A Capital
investment subsidy scheme for seed storage and processing units may be
formulated on the lines of similar scheme for Rural Godown for encouraging
Private Sector to build such infrastructure.
• There is a need for 'Phytosanitary' certification, especially for export / import of
seeds. The State Seed Corporations may establish at least one such certification
centre in each State.
• The seed companies should provide adequate compensation package / insurance
for farmers in case of failure of seeds/ low germination of seed purchased from
the companies.
• Govt. sponsored seed village programme needs to be expanded by including more
crops under the scheme.
• At present private seed industries are not undertaking the production of Forage
seeds. Therefore there is huge gap between the demand and supply of forage seed.
The seed Industry may explore to bridge the gap.
• Seed Industry – Research Institutions linkage has to be strengthened for taking
advantage of the positive aspects of both the segments and utilize the same for
farmers’ benefit.
• The seed agencies may sponsor need based research on the farms of the
Agricultural Universities to develop location specific crop varieties.
• Research Institutions and Universities should share knowledge on Good
Agricultural Practices (GAP) with all stakeholders for production of quality seed
with desired genetic purity.

43
• Farmers have to be involved in more extensive manner for production of
foundation/ breeder seed.
• Working capital requirements of seed companies have to be realistically assessed
and extended by banks.
• Term loan to be extended for creating infrastructure for seed processing and
storage by banks.
• Credit to seed sector may be treated as agricultural credit and the rate of interest
charged may be on par with agriculture.
3.3 Judicious Management of Agricultural Inputs
Intensive agricultural practices, over the years, to enhance agricultural productivity have
been eroding native agro-ecosystems through soil erosion, water
depletion/contamination, biodiversity loss and disruption in flow of various ecosystem
services threatening the agricultural bio-security. The intricate interdependence between
agriculture and the natural resources especially in the context of the looming threat of
Climate Change make it imminent to revisit the present agricultural strategies to evolve
measures for judicious use of various agricultural inputs to ensure sustainable
agriculture.
There should be a major effort on educating the farmer on the critical role the soil health
plays in productivity. Moreover soil testing is essential to determine the exact
requirement of type and quantity of Macro and Micro Nutrients. Suitable fertilizer
selection, proper dose, appropriate methods of application and judicious use plays a
significant role in plant physiology and crop productivity.
The need for achieving optimal seed replacement rates throughout the country should be
one of the focus areas besides putting in place mechanisms for supplying quality and
appropriate seed varieties taking into account the native agro-ecosystems and the pest
profile of the region. Appropriate practices for enhancing the quality of the crop by right

44
choice of seeds and seed health practices should be developed and the knowledge
disseminated to the farmers.
Since early 1990s, Government of India has been promoting Agro-ecosystem analysis
(AESA) based IPM through Farmer Field Schools (FFS) to promote environmentally
sustainable agriculture and enhance productivity. AESA, relies on holistic approach and
takes into account plant health, pest and beneficial insect dynamics, weather and soil
factors and farmers experience. Studies have shown that adoption of AESA based IPM
in a scientific manner through FFS programmes encouraged reliance on biological
control agents as well as substantial reduction in consumption of chemical fertilizers
and pesticides and consequently cost reduction. AESA also enlists active participation
of farmers in decision making based on experiential learning besides enhancing
productivity and protecting the native agro-ecosystems. The FFS schemes are currently
promoted departmentally and through some NGOs. However, most of the field level
extension functionaries have not undergone season long training in crop specific AESA
based programme. Moreover the State departments of Agriculture and Horticulture in
the country are facing staff crunch and the existing officers are burdened with
multifarious activities, as a result they are not able to focus on the qualitative aspects of
FFS. If quality of FFS is not maintained, the productivity can be negatively impacted at
farm level. There is a need to focus on the qualitative aspects of capacity building of the
trainers and the farmers. The extension officers who are responsible for building the
capacity of the farmers, themselves require intensive training in AESA based plant
health management. Ideally a separate cadre of Extension officers, through the
government machinery or through PPP, should be developed and made responsible for
organizing the FFS.
Bio-security
Bio-security risk management has implications for food, social and economic security in
the country. Understanding patterns and probabilities of introduction of new pests and

45
diseases is important to assess bio-security risk. As recommended by the core group,
constituted by Government of India, on plant and animal bio-security for national
agricultural bio-security system there is a need to tackle the issue of bio-security at a
sub-region level in collaboration with countries with whom India shares contiguous
boundaries for complete regional bio-security. Collaboration among South Asian
Nations (SANs) for creating a bio-secure region is required.
There is a need to make our agro-ecosystems more resilient to biological invasion.
Opportunities for improving resilience are considerable and include, for example:
• breeding of disease resistance into crops, assisted by new biotechnological tools
for incorporating existing or new resistance mechanisms
• strategies of deployment of crops which reduce the risk of pest and disease
outbreaks such as crop varietal mixtures and
• Monitoring the crop situation through Global Positioning System (GPS) based
pest surveys and surveillance and timely advisories to prevent epidemics or the
development of endemic areas.
• Diversification of local production systems to be ecologically and economically
resilient, reducing unnecessary movement of plants and animals.
• Promotion of ecological approaches such as AESA based plant health
management, which takes in to account the intricate interdependence of biotic
and abiotic components of the ecosystems.
• Need for greater communication and coordination among (and within) agencies.

46
Chapter 4 Demand and Supply Projections for Agri-Food Commodities
4.1 Demand Projections Four approaches have been used to estimate demand for various agricultural committees
during the 12th Plan. These are:
• Household Consumption Approach (NSSO plus Feed, Seed, Wastage and other
uses)
• Normative Approach: Based on ICMR recommendation
• Behavioural Approach: Based on demand elasticities
• Absorption Approach: based on past and current absorption
Total demand for any food commodity is divided in two parts; (1) household food
demand (2) Indirect demand which includes seed, feed, wastage, industrial use and any
other demand not captured by direct household consumption. Food demand for human
consumption was obtained by multiplying the projected per capita consumption with the
projected population. Indirect demand for food also includes the home-away demand
for food which is growing with urbanization and increasing employment opportunities
for the urban women. Looking demand (home consumption, home away consumption,
industrial use, export, wastages and requirement for seed and feed) and supply
(production, imports and government stock) food balance, the indirect demand (seed,
feed, industrial use, home away human consumption and wastages) can easily be
estimated under the assumption that total supply equal to total demand as follows:
Total supply = Production +Import - Change in government stock
Total demand = Household demand +Indirect demand
Indirect demand=home away demand+industrial demand+seed +feed+Export+ wastages

47
Total supply = Total demand
Thus, Indirect demand = Production + Import+ Change in stock – Household demand
Share of indirect demand in total demand/supply =
1- [household demand / (Production +Import +Change in Stock)]
4.1.1 Household Consumption Approach
Demand for any commodity includes household consumption demand and demand for
other uses like seed, feed, industrial use etc. A part of supply also goes as waste.
Demand for household consumption is estimated from monthly per capita consumption
of various commodities as reported in the Household Consumption Expenditure Survey
of National Sample Survey Office (NSSO). Per capita demand is multiplied by mid year
population to arrive at total demand. Two main issues in this projection are (a) Choice
of base year like should it be 2004-05 or 2009-10 which is more recent (b) allowance
for SFW and Industrial use. It is assumed that “Seed and wastage will remain
unchanged in the next plan and higher growth of animal husbandry sector, would put
stronger pressure on feed requirement.
Total demand is given by direct demand captured by NSSO plus indirect demand or
consumption not captured by NSSO data. Thus, total demand is:
Direct household demand as captured by NSSO +
Seed, feed, wastage+
industrial demand and +
any other demand not captured by NSSO like snacks, meals taken outside home,
cookies etc. not captured by NSSO consumption data
It is seen that the seed, feed, wastage and industrial use are not estimated scientifically
for quite some time. While estimating the total demand for various agricultural
commodities in the previous Plans, proportion of seed, feed and wastage have been
based on historical convention rather than based on any systematic study. Long back

48
Directorate of Economics and Statistics, GOI, prepared some estimates of SFW which
have been used to represent demand other than direct consumption by the household.
However, these estimates have been kept same since 1950-51. Some studies have shown
that proportion of SFW and demand not captured by NSSO consumption expenditure
has been on a rise and it is much higher than decades old estimates of DES. A
comparison of share of demand outside NSSO as reported by DES and as estimated by
NCAP is shown in Table 4.1 below:
Table 4.1: Share of SFW and other demand in total demand for various food commodities (%).
Items DES (SFW) NCAP (SFW+Ind. Use+ any other demand not captured by NSSO)
Rice 7.6 13.77
Wheat 12.1 18.13
Coarse Cereals 26.5 59.53
Pulses 12.5 42.75
Oilseeds Rec. : 28 41.23
Sugarcane SFW: 11.7, Rec.: 10.2 51.33 The NCAP estimates of share of demand not captured by NSSO are based on residual
approach which compute other demand as:
Total production + Import - Export- Change in stock over year - NSSO based
consumption.
These estimates for foodgrains are reported in table 4.2. These estimates show that share
of demand for SFW and other uses not captured by NSSO household consumption data
has been steadily rising. In the latest year close to one fourth of production is not
accounted for by NSSO consumption. These changes show that demand for non NSSO
items has been rising much faster than the demand included in NSSO. This demand
appears to be settling around one fourth of the total demand for foodgrains.

49
Table 4.2: Changes in share of demand for SFW and the demand not captured by NSSO consumption data since 1983 Period Foodgrain absorption not accounted by NSSO %
1983-84 to 1987-88 9.0 1989-90 to 1993-94 15.5 1995-96 to 1999-00 19.0 2000-01 to 2004-05 21.3 2005-6 to 2009-10 22.3 2009-10 24.2
Coming to the issue of base year it is observed that year 2009-10 show a very steep fall
in the per capita consumption of cereals and total foodgrains (Table 4.3). One reason for
this seems to be severe drought of year 2009-10 which brought down production of
cereals by 17 million tonne (8%) and course cereals by 76.5 million tonne (16%) over
the previous year. Therefore any projection that uses 2009-10 as a base will
underestimate future demand. Thus we have prepared demand estimates for 12th Plan by
using base 2004-05 and 2009-10.
Table 4.3: Annual Consumption NSS: Kg/per capita
Item 1993-94 1999-00 2004-05 2009-10 Rice 72.51 71.11 71.93 69.67 Wheat 53.29 54.14 51.56 52.97 Coarse cereals 20.20 15.51 16.54 8.74 Cereals 146.00 140.77 140.03 131.39 Pulses 9.86 11.19 9.01 8.39 Foodgrains 155.86 151.96 149.05 139.78 Edible oils 5.66 7.42 6.45 8.35 Sugar 9.49 9.46
Population Projection
The Mid Year (1st October) projected population figures for different years, post census,
are usually brought out by the Registrar General of India (RGI). However, post 2011

50
census no such projections have yet been issued by RGI. RGI had earlier projected the
population of the country for each year upto 2026 based on the observed rate of growth
in 2001 census with suitable adjustments for age specific growth. As per 2001 census
India’s population on 1st April 2011 was projected at 1192.5 million. However as per
2011 census the actual population on 1st April 2011 was 1210.193 million. Thus there
was an under estimation of 1.48% between the projected population and actual
population as on 1st April, 2011. Accordingly, the WG has inflated the projected
population by 1.48% for each year of the 12th Plan. The Mid-Year projected population
for 12th Plan works out as under:
Table 4.5: Projected population during 12th Plan
Year Projected: Million AGR
2011 1219.64
2012 1235.39 1.29 2013 1250.99 1.26 2014 1266.43 1.23
2015 1281.68 1.20 2016 1296.73 1.17
12th Plan CAGR 1.23 It may be mentioned that this approach assumes short term static behaviour of
consumption, i..e. increase in income have no effect on consumption.
Foodgrain Demand Based on Household Consumption Approach
Demand for foodgrains by the end of 12th Plan based On Household Consumption
Behaviour is presented in Table 4.5 under four scenarios. These include, per capita
household consumption of 2004-05 as a base assuming SFW and other types of demand
to be 12.5 % and 24.1%. The other two scenarios use per capita household consumption
of 2009-10 as a base assuming SFW and other types of demand to be 12.5 % and
24.1%. It will be seen from Table 4.5 that the scenario which assume 12.5% of total

51
demand going for SFW and other uses is highly underestimate. According to this
scenario demand for foodgrain during 2016-17 turns out to be 207.1 mt based on per
capita consumption (PCC) of 2009-10 and 220 mt based on PCC of 2004-05. As the
country has been already consuming much higher than 220 million tonne of foodgrain it
is not realistic to expect total demand for foodgrain to come down when population is
growing at annual rate of 1.23 per cent per year. Alternatively, foodgrain demand is
projected to be between 239 -254 mt depending on choice of base for PCC.
Table 4.5: Demand for foodgrain by 2016-17 Base SFW and
Other Demand Total Demand mt
2009-10 12.5% 207.1
2009-10 24.1% 239.0
2004-05 12.5% 220.9
2004-05 24.1% 254.8
4.1.2 Normative approach
This approach uses ICMR recommended quantity for per capita direct consumption to
arrive at demand at household level. ICMR’s recent recommendation is 122 kg cereals
and 25 kg pulses per person involved in sedentary activities and 146 and 25 kg for those
involved in sedentary activity. Assuming that the norm for sedentary activity represent
the requirement of total population, demand for foodgrain at the end of 12th Plan is
projected to be 217.8 mt when SFW and other demand is assumed to be 12.5 per cent of
total demand and 251.3 mt when SFW and other demand is taken as 24.1 per cent. If
ICMR recommendation for moderate activity is taken to represent average requirement
of the whole population the level of foodgrain demand increase to 259.3 and 299.2 mt
corresponding to 12.5 and 24.1 per cent levels of non household demand.

52
Table 4.6: Demand for foodgrain (2016-17) based on Normative Approach (ICMR) Base Norm
Kg/person SFW and Other Demand
Total Demand mt
Sedentary activity
Cereal: 122 kg Pulses: 25
12.5% 217.8
Sedentary Activity
Cereal: 122 Pulses: 25
24.1% 251.3
Moderate Activity
Cereal: 146 Pulses: 29
12.5% 259.3
Moderate Activity
Cereal: 146 Pulses: 29
24.1% 299.2
4.1.3 Behavioural Approach This approach is based on the behaviour of consumption on account of changing per capita income in a growing economy and the elasticity of consumption of various items to changes in income. The demand for year ‘t’ is estimated as under:
Dt = Pt * D0 (1+ η * y) t
Where,
Dt = Demand in period t,
Pt = Mid-year projected population in year t,
D0 = Per capita demand in base year,
η = Expenditure elasticity of Demand,
Y = rate of growth in per capita income.
The assumptions used in the projection based on this approach are:
• Demand elasticities estimated separately for four income classes, rural and
Urban and for six regions of the country

53
• Demand estimated separately for 35 states then aggregated.
• GDP growth: at 9 % per annum and per capita income @ 7.7 % per annum after
adjusting for population growth at 1.3 per cent.
• Base year consumption is taken from NSSO 2004-05.
Indirect Demand for Food
The indirect demand was computed for years from 1998 to 2008 and predicted using
trend analysis till the years 2016-17 for various food commodities. Share of indirect
demand in total demand of various food commodities is presented in Table 4.7.
Table 4.7: Indirect demand for food commodities in India, 1998 to 2026 (% of the total demand)
Commodity 2004-05 2011-12 2016-17
Rice 12.97 13.43 13.77Wheat 17.08 17.69 18.13Coarse cereals 56.07 58.06 59.53Maize 78.03 80.82 82.88Total cereals 21.39 22.06 22.49Pulses 37.00 41.71 42.75Chickpea 70.06 71.24 72.21Pigenpea 19.41 20.12 20.60Foodgrains 22.49 23.61 24.19Edible oils 29.53 40.20 41.23Rapeseed & mustard 21.98 22.77 23.32Ground nut 22.52 23.36 23.88Sugar 48.35 50.07 51.33Vegetables 37.76 38.43 38.91Potato 40.18 40.88 41.40Onion 30.93 31.48 31.88Fruits 81.47 82.90 83.95Milk 40.58 41.58 42.10Meat, fish & eggs 39.45 40.83 41.85Fish 57.13 59.89 60.66
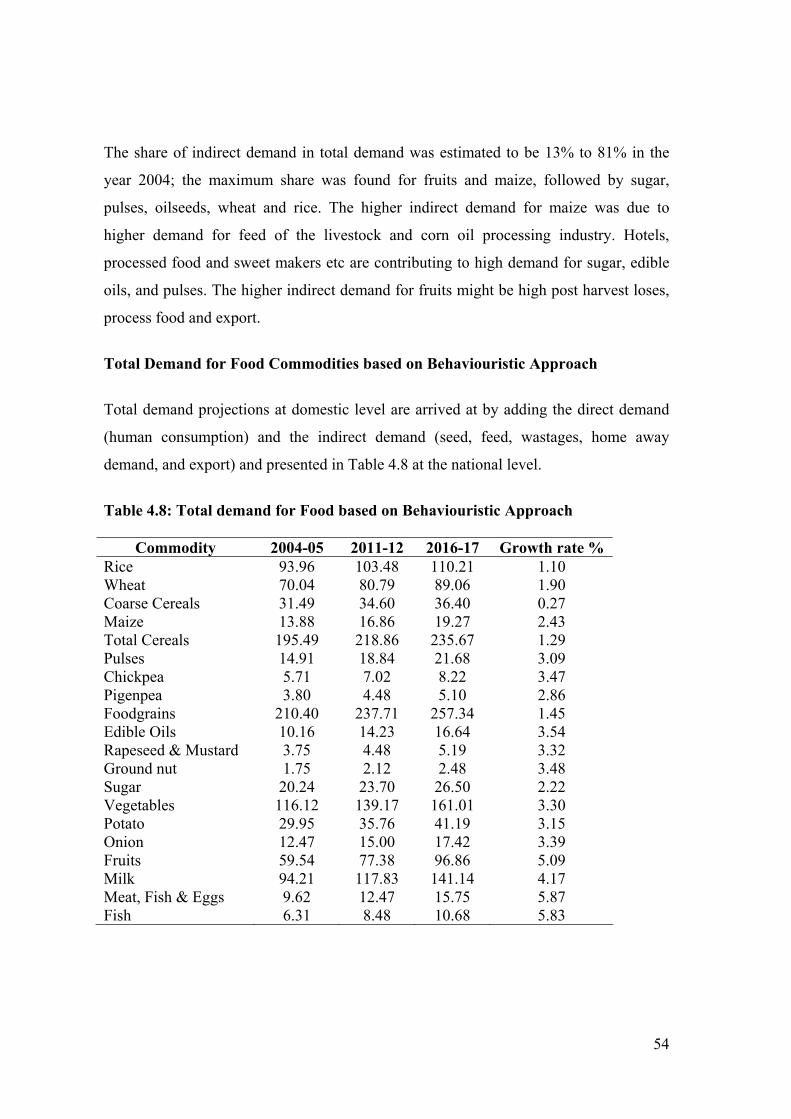
54
The share of indirect demand in total demand was estimated to be 13% to 81% in the
year 2004; the maximum share was found for fruits and maize, followed by sugar,
pulses, oilseeds, wheat and rice. The higher indirect demand for maize was due to
higher demand for feed of the livestock and corn oil processing industry. Hotels,
processed food and sweet makers etc are contributing to high demand for sugar, edible
oils, and pulses. The higher indirect demand for fruits might be high post harvest loses,
process food and export.
Total Demand for Food Commodities based on Behaviouristic Approach
Total demand projections at domestic level are arrived at by adding the direct demand
(human consumption) and the indirect demand (seed, feed, wastages, home away
demand, and export) and presented in Table 4.8 at the national level.
Table 4.8: Total demand for Food based on Behaviouristic Approach
Commodity 2004-05 2011-12 2016-17 Growth rate % Rice 93.96 103.48 110.21 1.10 Wheat 70.04 80.79 89.06 1.90 Coarse Cereals 31.49 34.60 36.40 0.27 Maize 13.88 16.86 19.27 2.43 Total Cereals 195.49 218.86 235.67 1.29 Pulses 14.91 18.84 21.68 3.09 Chickpea 5.71 7.02 8.22 3.47 Pigenpea 3.80 4.48 5.10 2.86 Foodgrains 210.40 237.71 257.34 1.45 Edible Oils 10.16 14.23 16.64 3.54 Rapeseed & Mustard 3.75 4.48 5.19 3.32 Ground nut 1.75 2.12 2.48 3.48 Sugar 20.24 23.70 26.50 2.22 Vegetables 116.12 139.17 161.01 3.30 Potato 29.95 35.76 41.19 3.15 Onion 12.47 15.00 17.42 3.39 Fruits 59.54 77.38 96.86 5.09 Milk 94.21 117.83 141.14 4.17 Meat, Fish & Eggs 9.62 12.47 15.75 5.87 Fish 6.31 8.48 10.68 5.83

55
4.1.4 Actual Absorption approach
This approach is more direct and pragmatic and it is based on recent situation. In this
approach we first estimated actual absorption for year 2010-11 which is the base for
twelfth plan. It estimates total absorption in the year as under:
• Base year: 2010-11 (1.4.2010 to 31 March 2011)
• Total absorption: 235.26 million tonne worked out as under:
Production (rabi 2009-10 + kharif 2010-11): 114.16+120.36 =234.5 mt
Less: Export+import: 2.88-2.02 = 0.86 mt
Change in stock (1 April 2010 and 1 April 2011): 16.1 -14.5= (-)1.6 mt
• Absorption represents demand when there is no supply constraint like 2010-11.
Thus, absorption during 2010-11 can be taken as demand
• Future growth in domestic demand:
– Growth in direct consumption
– Growth in seed, wastage, feed, industrial use, other demand
Projected absorption is estimated by computing aggregate growth rate in demand which
is taken as weighted sum of growth in various components of demand. These
computations are shown in table 4.9.
Table 4.9: Projected foodgrain demand during 2016-17 based on actual absorption and growth in different components of demand Source Composition Growth rate 1. Household direct 0.76 -0.40 -0.20 2. Seed 0.03 0.00 0.00 3. Wastage 0.03 1.50 1.50 4. Other uses: feed, industrial use and demand not captured by NSSO
0.18 2.70 2.70
Weighted sum ( 1 to 4) 0.23 0.38 5. Population growth 1.30 1.30 All sources (1 to 5) 1.53 1.68 Foodgrain demand mt 257.7
260.0

56
Total demand for foodgrain comprises 76 per cent of demand for direct household
consumption, 3 per cent as seed, 3 per cent as wastage and 18 per cent as feed, industrial
use, and home away demand etc. Past trend shows that per capita household
consumption of foodgrains has been declining. The rate of decline was found to be 0.4
percent per annum during 1993-94 and 2004-5. As PCC can’t keep on declining, the
rate of decline is presumed to fall from 0.4 per cent to 0.2 per cent in the second
scenario. Demand for seed is assumed to remain at current while the wastage is
expected to increase annually by 1.5 percent which is same as the growth in demand.
Per capita demand for feed, industrial use and home away food was arrived at by
multiplying rate of growth in per capita income with expenditure elasticity of livestock
product, which gives growth in per capita demand for livestock products. This was
estimates at 2.7 per cent. It was assumed that demand for feed etc. will grow at this rate.
Population growth rate is taken to be 1.3 per cent per annum for the 12th Plan. Adding
up weighted growth rate of various components of demand indicate 0.23 percent annual
growth in per capita foodgrain demand. Thus total demand for foodgrain is projected to
rise annually by 1.53 per cent. This growth rate will raise total demand for foodgrain
from 235.2 million tonne during 2010-11 to 258-260 million tonne during 2016-17.
This demand excludes export demand.
4.2 Supply Projections
Supply projections are estimated based on five approaches as follows:
− Simple Regression
− Exponential Growth
− Multiple Regression
− Average Annual Growth Rate
− Compound Annual Growth Rate
57
For the simple regression, exponential growth and the multiple regression, data for the
past 10 years (2000-01 to 2009-10) have been used to work out various constants as per
the following model:
Simple Regression Approach
Y=a+bx
a, b are constants, x is time in years.
(For pulses and sugarcane data for past 20 years
(1990-91 to 2009-10) were used because of erratic growth trend in recent decade.
Exponential Growth
y=a (b)T
a, b are constants and T is time in years.
Multiple Regression
y=a+bx1+cx2+dx3
a,b,c, d are constants,
x1: area under the crop
x2: fertilizer consumption per hectare
x3: percentage of irrigated area
For working out supply projections on the basis of average annual growth rate and the
compound annual growth rate, production data for the period 2005-06 to 2009-10 have
been used.
The estimates of supply projection for selected crops are presented in Table 4.10.
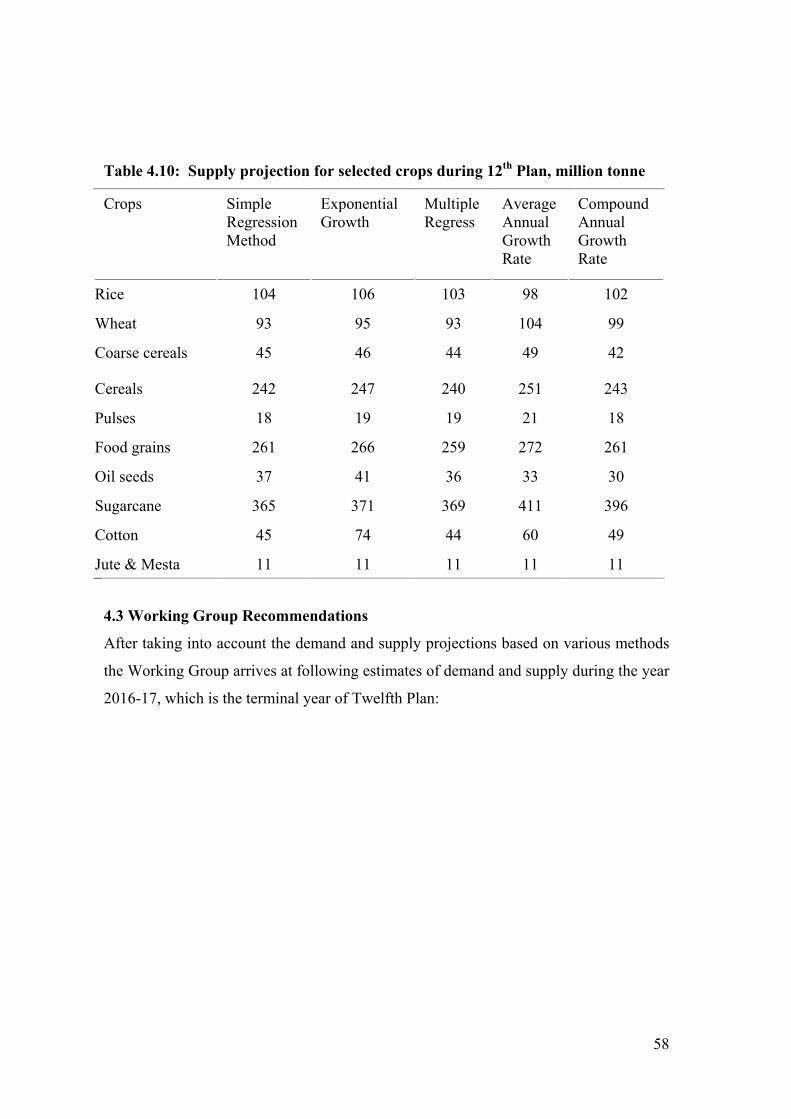
58
Table 4.10: Supply projection for selected crops during 12th Plan, million tonne
Crops Simple Regression Method
Exponential Growth
Multiple Regress
Average Annual Growth Rate
Compound Annual Growth Rate
Rice 104 106 103 98 102
Wheat 93 95 93 104 99
Coarse cereals 45 46 44 49 42
Cereals 242 247 240 251 243
Pulses 18 19 19 21 18
Food grains 261 266 259 272 261
Oil seeds 37 41 36 33 30
Sugarcane 365 371 369 411 396
Cotton 45 74 44 60 49
Jute & Mesta 11 11 11 11 11
4.3 Working Group Recommendations
After taking into account the demand and supply projections based on various methods
the Working Group arrives at following estimates of demand and supply during the year
2016-17, which is the terminal year of Twelfth Plan:

59
Table 4.11: Working Group Recommendation on Demand
Crop/Group of
Crops Demand mt Supply mt
Cereals 235 240-251 Pulses 22 18-21 Food grains 257 258-272 Oilseeds / Edible oils 59/16.64 33-41 Sugarcane / Sugar 279/26.5 365-411 Cotton na 44-74 Jute & Mesta 11 Vegetables 161
Fruits 96.86
Demand for cereal is projected to reach 235 mt and demand for pulses is projected to
reach 22 mt by the year 2016-17. The demand for the total foodgrain is expected to
reach 257 mt. Supply projections for the same indicate that India is likely to have small
surplus in cereals whereas, pulses will remain in short supply. Edible oil demand is
projected to reach 16.64 mt which will require 59 mt of oilseeds. Even in the best
production scenario India remains deficit in oilseeds. The deficiency in terms of
oilseeds is expected to raise between 18 to 26 mt of oilseeds. Demand for sugar is
projected to grow to 26.5 mt which can be met through sugarcane production of 279 mt.
Available trend show that India will be having surplus of sugar during the 12th Plan.
Demand for vegetables and fruits is expected to reach 161 and 97 mt.
60
Chapter 5
Agriculture Mechanisation
Contributor/Sub Group
1. Dr. Pitam Chandra, Director, CIAE Convenor
2. Shri Himat Singh, Deputy Commissioner (M&T) Member
3. Er. Baldev Singh, President, AMMA Member
4. Dr Surendra Singh, PC, AICRP on FIM Member
5. Sri RN Patil, Advisor, M/s John Deere Member
Farm mechanisation is getting increased attention due to three main reasons. One, rising
wages for labour, two, for achieving operational efficiency and three, rising cost of
energy.
India has witnessed steady growth in production and use of electro-mechanical power
sources particularly 4-wheel small tractors, power tillers, diesel engines and electric
motors and matching equipment since 1960s. The annual rate of growth in the sector is
high 8-10 % per annum. During year 2010-11 India produced about 5.48 lakh tractors
(Fig. 1). Though power tiller manufacture started about the same time as tractor but
their demand has been low, possibly due to wetland cultivation in kharif and upland
during rabi for which power tillers are not very suitable unless soil is in friable range.

61
Fig. 5.1. Tractor production trend in India
(Automotive Component Manufacturers Association of India) http://www.acmainfo.com/doc/Industry_Statistics_Vehicle_10-1.xls
While developed world mechanised its agriculture to create surplus labour for the
industrial sector, in India it has been directed to help farmers and farm worker do their
job speedily, with high quality job, acquire additional capacity to achieve timeliness in
field operations without much hardship and drudgery. It also helps in achieving
precision in metering and placement of inputs for better crop stand, better response to
inputs and increased productivity. Farm mechanization imparts dignity to farm work.
Bullocks and other draft animals continue to have relevance in India for socio-economic
reasons particularly to marginal and small farmers. However, animate power per unit
energy supply is costlier than electro-mechanical sources. Animals need to be fed and
maintained even when not in use and are vulnerable to morbidity and mortality due to
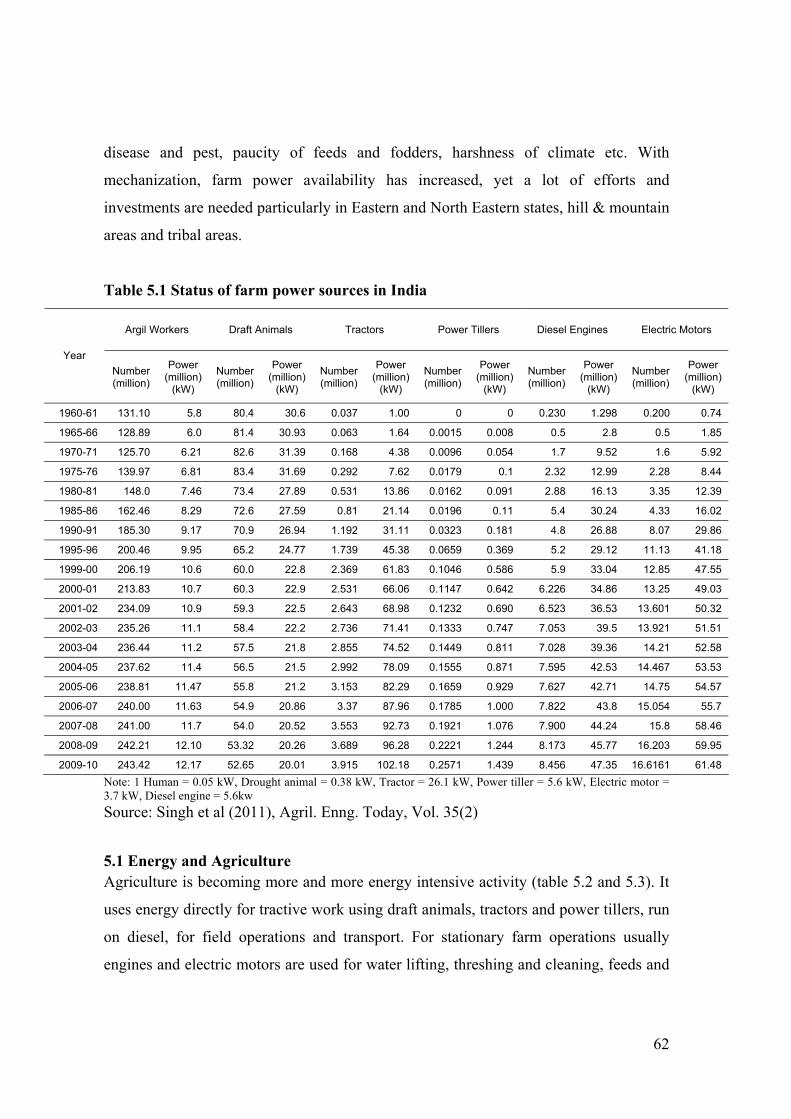
62
disease and pest, paucity of feeds and fodders, harshness of climate etc. With
mechanization, farm power availability has increased, yet a lot of efforts and
investments are needed particularly in Eastern and North Eastern states, hill & mountain
areas and tribal areas.
Table 5.1 Status of farm power sources in India
Argil Workers Draft Animals Tractors Power Tillers Diesel Engines Electric Motors
Year Number (million)
Power (million)
(kW)
Number (million)
Power (million)
(kW)
Number (million)
Power (million)
(kW)
Number (million)
Power (million)
(kW)
Number (million)
Power (million)
(kW)
Number (million)
Power (million)
(kW)
1960-61 131.10 5.8 80.4 30.6 0.037 1.00 0 0 0.230 1.298 0.200 0.74
1965-66 128.89 6.0 81.4 30.93 0.063 1.64 0.0015 0.008 0.5 2.8 0.5 1.85
1970-71 125.70 6.21 82.6 31.39 0.168 4.38 0.0096 0.054 1.7 9.52 1.6 5.92
1975-76 139.97 6.81 83.4 31.69 0.292 7.62 0.0179 0.1 2.32 12.99 2.28 8.44
1980-81 148.0 7.46 73.4 27.89 0.531 13.86 0.0162 0.091 2.88 16.13 3.35 12.39
1985-86 162.46 8.29 72.6 27.59 0.81 21.14 0.0196 0.11 5.4 30.24 4.33 16.02
1990-91 185.30 9.17 70.9 26.94 1.192 31.11 0.0323 0.181 4.8 26.88 8.07 29.86
1995-96 200.46 9.95 65.2 24.77 1.739 45.38 0.0659 0.369 5.2 29.12 11.13 41.18
1999-00 206.19 10.6 60.0 22.8 2.369 61.83 0.1046 0.586 5.9 33.04 12.85 47.55
2000-01 213.83 10.7 60.3 22.9 2.531 66.06 0.1147 0.642 6.226 34.86 13.25 49.03
2001-02 234.09 10.9 59.3 22.5 2.643 68.98 0.1232 0.690 6.523 36.53 13.601 50.32
2002-03 235.26 11.1 58.4 22.2 2.736 71.41 0.1333 0.747 7.053 39.5 13.921 51.51
2003-04 236.44 11.2 57.5 21.8 2.855 74.52 0.1449 0.811 7.028 39.36 14.21 52.58
2004-05 237.62 11.4 56.5 21.5 2.992 78.09 0.1555 0.871 7.595 42.53 14.467 53.53
2005-06 238.81 11.47 55.8 21.2 3.153 82.29 0.1659 0.929 7.627 42.71 14.75 54.57
2006-07 240.00 11.63 54.9 20.86 3.37 87.96 0.1785 1.000 7.822 43.8 15.054 55.7
2007-08 241.00 11.7 54.0 20.52 3.553 92.73 0.1921 1.076 7.900 44.24 15.8 58.46
2008-09 242.21 12.10 53.32 20.26 3.689 96.28 0.2221 1.244 8.173 45.77 16.203 59.95
2009-10 243.42 12.17 52.65 20.01 3.915 102.18 0.2571 1.439 8.456 47.35 16.6161 61.48 Note: 1 Human = 0.05 kW, Drought animal = 0.38 kW, Tractor = 26.1 kW, Power tiller = 5.6 kW, Electric motor = 3.7 kW, Diesel engine = 5.6kw Source: Singh et al (2011), Agril. Enng. Today, Vol. 35(2)
5.1 Energy and Agriculture Agriculture is becoming more and more energy intensive activity (table 5.2 and 5.3). It
uses energy directly for tractive work using draft animals, tractors and power tillers, run
on diesel, for field operations and transport. For stationary farm operations usually
engines and electric motors are used for water lifting, threshing and cleaning, feeds and

63
fodder processing etc. Stationary operations carried out using tractors and power tillers
are convenient but not efficient. Agriculture also uses large quantities of energy
indirectly in the form of seed, fertilizers, growth hormones, pesticides, machinery, etc
(Fig.5.2). Traditional agriculture used human labour and draft animal mostly, seeds
were on-farm produced or acquired through barter and plant nutrients were mostly solid
and liquid wastes of domestic animals, decomposed vegetation, green manuring etc.
Plant protection was mostly through crop rotation, physical, use of ash, plant extracts,
cow urine etc.
Table 5.2: Trends in number and growth rates in mechanical farm power sources in India 1950 1960 1970 1980 1990 1997 2000 2009-
10* Growth rate
(%) Base year 1970
Tractive power (number in million) Tractor 0.008 0.031 0.148 0.518 1.222 2.037 2.471 3.916 10.36 Power Tiller - - 0.003 0.021 0.040 0.085 0.110 0.192 12.7
Stationary power (number in million) Electric pump 0.020 0.100 1.629 4.330 6.01 8.254 9.525 16.194 6.06 Diesel pump 0.083 0.230 1.546 3.101 4.659 5.899 6.465 8.456 4.88
Others (number in million) Power sprayer/duster
- - 0.045 0.124 0.200 0.245 0.311 - 6.66
*SP Singh et al (2011), Agril. Enng. Today, Vol. 35(2)
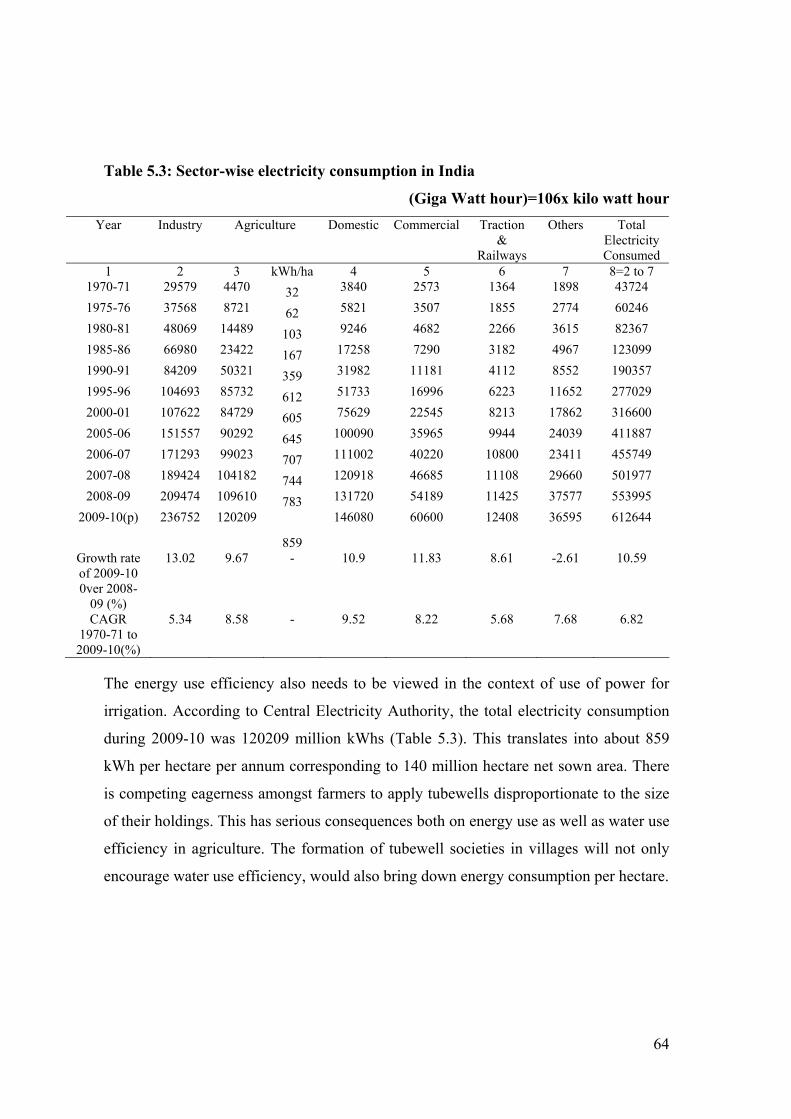
64
Table 5.3: Sector-wise electricity consumption in India
(Giga Watt hour)=106x kilo watt hour Year Industry Agriculture Domestic Commercial Traction
& Railways
Others Total Electricity Consumed
1 2 3 kWh/ha 4 5 6 7 8=2 to 7 1970-71 29579 4470 32 3840 2573 1364 1898 43724 1975-76 37568 8721 62 5821 3507 1855 2774 60246 1980-81 48069 14489 103 9246 4682 2266 3615 82367 1985-86 66980 23422 167 17258 7290 3182 4967 123099 1990-91 84209 50321 359 31982 11181 4112 8552 190357 1995-96 104693 85732 612 51733 16996 6223 11652 277029 2000-01 107622 84729 605 75629 22545 8213 17862 316600 2005-06 151557 90292 645 100090 35965 9944 24039 411887 2006-07 171293 99023 707 111002 40220 10800 23411 455749 2007-08 189424 104182 744 120918 46685 11108 29660 501977 2008-09 209474 109610 783 131720 54189 11425 37577 553995
2009-10(p) 236752 120209
859
146080 60600 12408 36595 612644
Growth rate of 2009-10 0ver 2008-
09 (%)
13.02 9.67 - 10.9 11.83 8.61 -2.61 10.59
CAGR 1970-71 to 2009-10(%)
5.34 8.58 - 9.52 8.22 5.68 7.68 6.82
The energy use efficiency also needs to be viewed in the context of use of power for
irrigation. According to Central Electricity Authority, the total electricity consumption
during 2009-10 was 120209 million kWhs (Table 5.3). This translates into about 859
kWh per hectare per annum corresponding to 140 million hectare net sown area. There
is competing eagerness amongst farmers to apply tubewells disproportionate to the size
of their holdings. This has serious consequences both on energy use as well as water use
efficiency in agriculture. The formation of tubewell societies in villages will not only
encourage water use efficiency, would also bring down energy consumption per hectare.

65
Fig 5.2. Source-wise energy consumption in India agriculture
Total energy use in production of principal crops in India has increased 4-5 times
between 1970 and 2005 during which average productivity increased from 837 to 1583
kg/ha (Fig. 5.3). It is evident that share of animal energy has significantly decreased
from 43.9% to 5.8% and that of human energy decreased from 36.7% to 7-9% though in
absolute terms decrease is not so enormous only electro-mechanical energy use has
increased phenomenally. Commercial energy use increased significantly - electrical
energy from 0.19% to 38.1%, diesel from 2.4 to 18.3%, and chemical fertilizers from
16.4% to 29.7%.

66
Fig. 5.3: Impact of farm power availability on food grain productivity
Table 5.4: Farm power availability on Indian farm
Year Cropping Intencity (%)
Food grain Productivity (t/ha)
Power availability (kW/ha)
Power per unit productivity (kW/t)
Net sown area per tractor (ha)
1975-76 120.0 0.944 0.48 0.51 487 1985-86 127.0 1.175 0.73 0.62 174 1995-96 130.0 1.491 1.05 0.70 84 2004-05 135.7 1.652 1.47 0.89 47 2005-06 136.4 1.715 1.51 0.88 45 2006-07 138.1 1.756 1.58 0.90 42 2007-08 139.0 1.860 1.62 0.87 40 2008-09 139.0 1.909 1.67 0.87 38 2009-10 139.2 1.798 1.73 0.96 36
There is increasing dependence of Indian agriculture on commercial energy. By 1990
about 80% of the total operational energy was electro-mechanical (Fig. 5.2). There is
close correlation between degree of agricultural mechanization, energy use and
agricultural production and productivity (Table 5.4). However, over mechanization as in
Punjab resulted in indebtedness of the farmers as the acquired farm power and

67
machinery assets are not fully utilized. Farm power availability in Punjab is highest in
the country so is foodgrain productivity (Table 5.5).
Table 5.5: Farm Power Availability and Average Productivity of Foodgrains in India in 2001
S.No. Name of the State Farm Power
Availability (kW/ha)
Food grain productivity
(kg/ha) 1 Punjab 3.50 4032 2 Haryana 2.25 3088 3 Uttar Pradesh 1.75 2105 4 Andhra Pradesh 1.60 1995 5 Uttranchal 1.60 1712 6 West Bengal 1.25 2217 7 Tamil Nadu 0.90 2262 8 Karnataka 0.90 1406 9 Kerala 0.80 2162 10 Assam 0.80 1443 11 Bihar 0.80 1622 12 Gujrat 0.80 1169 13 Mdhya Pradesh 0.80 907 14 Himachal Pradesh 0.70 1500 15 Maharashtra 0.70 757 16 Rajasthan 0.65 884 17 Jharkhand 0.60 1095 18 Jammu & Kashmir 0.60 1050 19 Orissa 0.60 799
20` Chhattisgarh 0.60 799 All India 1.35 1723
Average energy utilized in production of some of the major crops is shown in Table 5.6.
Energy productivity among cereals is highest for paddy at 0.234 kg/MJ, whereas that of
wheat, maize and sorghum is relatively lower. Amongst pulses Bengal gram energy
productivity is highest at 0.19 kg/MJ. In case of oilseeds soybean production is more
energy efficient than mustard. Sugarcane and potato are most energy consuming crops
per unit are but energy productivity is favourable. However, gain in productivity has
diminishing return as energy input use increases (Table 5.7) i.e. it is relatively more
energy efficient to pay greater attention to rainfed crop through increased input use than

68
irrigated high productivity situation. Total energy use in irrigated paddy cultivation
ranges between 17500-33500 MJ/ha while in rainfed it
ranges between 6600-1100 MJ/ha but productivity is considerably low.
Table 5.6: Energy use and energy productivity of some major crops in India
Table 5.7: Energy Uses for transplanted paddy cultivation in different areas
Energy resource High yielding zone irrigated
Medium yielding zone irrigated
Medium yielding zone rainfed
Direct energy, MJ/ha 14716 7586 7139 Indirect energy, MJ/ha 18803 9916 3990 Total energy 33519 17502 11129 Energy productivity, kg/MJ 0.139 0.191 0.250
Wheat crop is mostly irrigated. However, in some areas where soil moisture and
precipitation are favourable it is grown in rainfed conditions too of course with low
productivity levels. Total energy consumption of irrigated wheat in Punjab, UP is about
18,000 MJ/ha (14,000-19,000 MJ/ha) where as in rainfed wheat it ranges between 6,500
to 14,000 MJ/ha (Table 5.8). Use of diesel and electricity in irrigated areas is about 60-
80% of total direct energy and about 40% of total energy consumption. In areas of
intensive irrigated agriculture, renewable energy consumption component is low just
about 14% of total energy where as in rainfed wheat in MP it is high (about 80%). In
intensive wheat production irrigation accounts for 40% of the total operational energy
consumption, harvesting and threshing about 30%, and seedbed preparation about 17%.
Crop Total energy, MJ/ha Energy productivity (kg/MJ)
Paddy 13076 0.239 Wheat 14657 0.196 Maize 9956 0.215
Food grains
Sorghum 4745 0.200 Green Gran 4315 0.118 Black gram 3870 0.105
Pulses
Bengal Gram 5464 0.190 Mustard 8051 0.119
Oilseeds Soybean 6382 0.171 Sugarcane 59192 1.039 Cotton 9972 0.094
Cash crop
Potato 31352
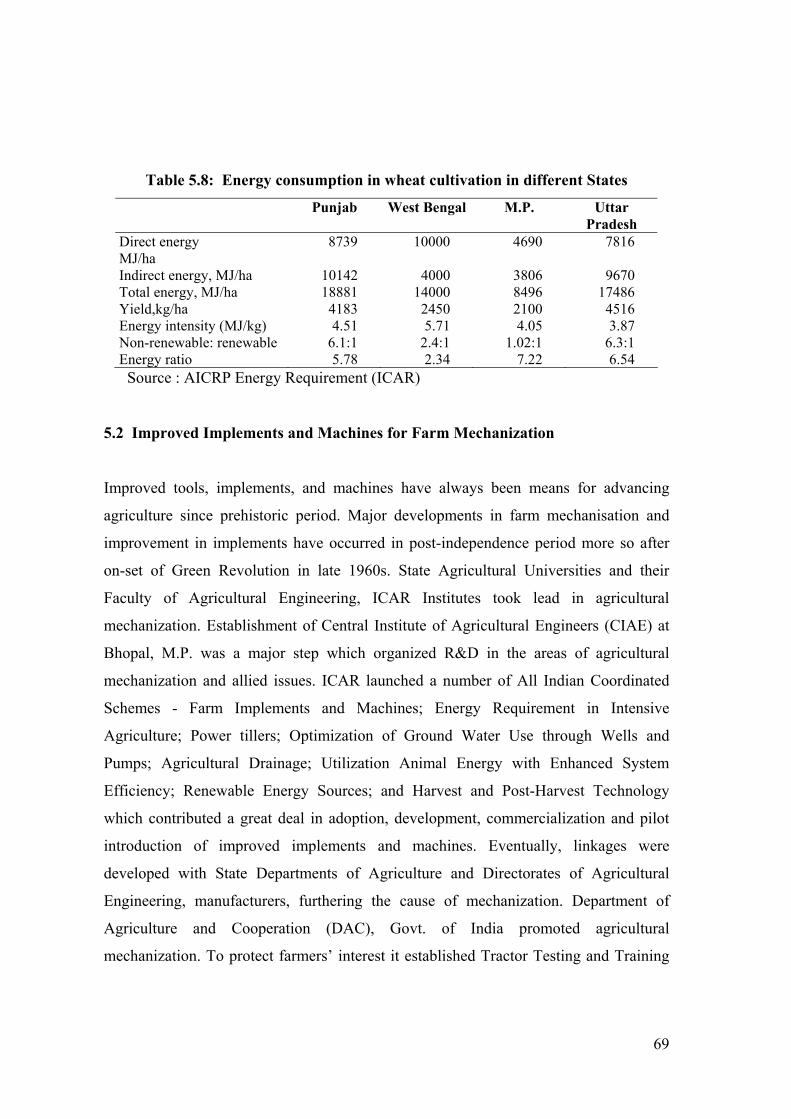
69
Table 5.8: Energy consumption in wheat cultivation in different States
Punjab West Bengal M.P. Uttar Pradesh
Direct energy MJ/ha
8739 10000 4690 7816
Indirect energy, MJ/ha 10142 4000 3806 9670 Total energy, MJ/ha 18881 14000 8496 17486 Yield,kg/ha 4183 2450 2100 4516 Energy intensity (MJ/kg) 4.51 5.71 4.05 3.87 Non-renewable: renewable 6.1:1 2.4:1 1.02:1 6.3:1 Energy ratio 5.78 2.34 7.22 6.54
Source : AICRP Energy Requirement (ICAR)
5.2 Improved Implements and Machines for Farm Mechanization
Improved tools, implements, and machines have always been means for advancing
agriculture since prehistoric period. Major developments in farm mechanisation and
improvement in implements have occurred in post-independence period more so after
on-set of Green Revolution in late 1960s. State Agricultural Universities and their
Faculty of Agricultural Engineering, ICAR Institutes took lead in agricultural
mechanization. Establishment of Central Institute of Agricultural Engineers (CIAE) at
Bhopal, M.P. was a major step which organized R&D in the areas of agricultural
mechanization and allied issues. ICAR launched a number of All Indian Coordinated
Schemes - Farm Implements and Machines; Energy Requirement in Intensive
Agriculture; Power tillers; Optimization of Ground Water Use through Wells and
Pumps; Agricultural Drainage; Utilization Animal Energy with Enhanced System
Efficiency; Renewable Energy Sources; and Harvest and Post-Harvest Technology
which contributed a great deal in adoption, development, commercialization and pilot
introduction of improved implements and machines. Eventually, linkages were
developed with State Departments of Agriculture and Directorates of Agricultural
Engineering, manufacturers, furthering the cause of mechanization. Department of
Agriculture and Cooperation (DAC), Govt. of India promoted agricultural
mechanization. To protect farmers’ interest it established Tractor Testing and Training

70
Stations. DAC also launched promotional schemes providing subsidy to the farmers,
bank-loans for the tractor and other machinery. It also established Central Farm
Machinery Review and Release Committee. Promotional efforts towards agricultural
mechanization are still on. Every year there is interaction meet between DAC and ICAR
where agricultural mechanization and on-farm processing and value addition related
equipment, practices, and required promotional measures are discussed, progress
monitored and future action plans are formulated. Progressive State Governments also
take similar measures.
Table 5.9 gives traditional and improved implements and machines available for
different unit operations of agriculture. Farm Machinery and Power industry accounts
for over Rs. 50,000 crores excluding FIM manufactured/fabricated by the craftsmen.
5.3 Strategy
The expectations from farm mechanization are as follows.
Sustainable increase in productivity and cropping intensity
Conservation of inputs through precision in metering and placement
Enhancement in income of agricultural workers
Benefits to all categories of farmers
Creation of worker-friendly environment
Reduced cost of production leading to greater profitability

71
Table 5.9 : Tradition and Improved Implement and Machines available for Different Unit Operations
Items Traditional implements
Improved implements
Seed bed preparation Spade Deshi plough Bakhar
Disc plough, Mould board plough Cultivator, Disc harrow Rotavator, Roto-tiller Puddler, Chisel plough Patela harrow, Pulverizer roller Leveler, Reversible plough
Sowing/Fertiliser application device
Broadcasting Dibbling Transplanting Line sowing Behind plough Pora/Khera Multi seed drill
Naveen dibbler, Rotary dibbler Mechanical transplanters, Manual 4-row rice transplanter, Pneumatic planter Tractor drawn 2-4 row vegetable sapling transplanter, Planter, Raised bed planter, Seed drill, Seed-cum-fertilizer drill, Zero till drill, Tractor drawn roto till drill, Tractor drawn strip till drill, Drum seeder for rice, Self propelled rice transplanter, Till planter, Fertiliser broadcaster Ammonia applicator, Potato planter, Groundnut planter, Sugarcane planter, Animal and tractor drawn inclined plate planter, Tractor drawn pneumatic planter
Irrigation and drainage
Leather bag Swing basket Dhenkli Chain pump Washer pump Persian wheel
Centrifugal pump, Submersible pump, Sprinkler Drip irrigation, Propeller pump, Axial flow pump Pressure compensated micro sprinkler, Micro sprinkler, Mole plough
Interculture/Plant Protection
Khurpi Spade Plough Blade harrow (dora)
Hand weeders, Cultivator, Wheel hoe, Rakes, Rotary tiller, Grubber-Cono weeder, Cycle Wheel hoe, Ridger/Furrower/sweep, Sprayer, Duster, Granular weedicide applicators, Power weeder, Rotary weeder
Harvesting / Digging Sickle, Khurpi Spade
Serrated sickle, Reaper, Combine, Digger’ Digger shakers
Threshing / Shelling Decortication
Beating, Rubbing, Animal treading, Olpad threshing
Pedal thresher, Power thresher, Combines, Decorticator, Axial flow thresher, Multi-crop thresher, Maize dehusker cum sheller, Ground nut thresher, Tractor operated high capacity multicrop thresher

72
Mechanization can contribute in achieving higher agricultural growth through:
(i) timeliness in field operation. Seedbed preparation and sowing can be completed
in 1-2 days before soil becomes too dry. Delay of every day beyond optimum
results in loss of about 0.5-1.0% in productivity. Conventional seedbed and
sowing with paleva irrigation can easily take 8-10 days, thus gain of 4-5%
minimum and can be up 8-10% or even more.
(ii) achieving optimum plant population through precision in metering and
placement of seed and fertilizer, more so if a planter is used which can increase
yield by 5-10% or more.
(iii) practising raised-bed-farming where crop could be raised under aerobic
conditions contributing in yield increase by 5-10%. It facilitates furrow irrigation
conserving water by 20-30%.
(iv) sowing of wheat after paddy harvest with Zero-till Drill which enhances yield by
at least 4-5%, but could be upto to 10% or more.
(v) line sowing and mechanical weeding in rice leading to increase in yield by 10-
15% both in upland and wetland crops
(vi) pressurized irrigation like drip & fertigation for increasing productivity by 25-
50% and irrigation water saving in same measure.
(vii) power sprayers bringing timeliness in plant protection measures due to high field
capacity,thus, saving the crop from pest damage and improving the harvest by
easily 10-15%.
(viii) harvesting by VCR and power threshing to speed up operations and prevent
wastage due to untimeliness and eliminate vulnerability to adverse weather
condition. Combining does it even better besides being a cheaper option.
(ix) enabling crop intensification by clearing field for next crop early, preparation of
seedbed and sowing quickly making use of available soil moisture.

73
The summary of current issues related to Farm Mechanization is as follows –
• Diminishing availability of farm labor due to growth in other sectors of economy
as well as rural schemes related to socio-economic development
• Increasing levels of awareness about the role of machinery on farm
• Availability of farm tools, implements and machines is improving in several
States.
• Improved farm credit availability
• Cost of production is increasing
• Drudgery reduction and workers’ safety are becoming important to retain youth
in farming
• Hill agriculture has huge mechanization deficit
• Gender friendliness of farm implements and machines
• Climate change and environmental safety
• Mechanization of operations in horticulture animal husbandry and fishery
• Manufacture of implements and machinery by industry
• Mechanization of organic farms
• Mechanization for improving the farm profitability
• Mechanization for climate resilient agriculture
While tractorization and mechanical power based mechanization would cover large,
medium and, to some extent, small farms; inclusive farm mechanization strategy must
include effective utilization of draft animal power and human labor. There is a need for
integrated models of farm mechanization utilizing all the three modes of farm power
supply.
The power availability on Indian farms is about 1.7 kW/ha at present and by the end of
12th plan; the farm power availability must increase to 2.1 kW/ha to achieve the national
agricultural production targets. There is an essential need to utilize surplus bio-residues

74
as fuel in agriculture through conversion into green fuels for both production and
postproduction operations.
There have been increased mechanization rates during 2009-10 and 2010-11 as
evidenced by the tractor sales during the period. The increased mechanization rate
appears to be well correlation with the national agricultural growth rate during 2010-11.
As reported by the Directorate of Agricultural Engineering, Madhya Pradesh, the
specific experience in Madhya Pradesh spread over 25 villages under the ‘Yantradoot’
scheme where crop specific farm implements were introduced resulted into 40% and
25% increased yields with respect to wheat and gram during Rabi 2010-11 with
concomitant reduction in the cost of production and enhanced farm income. The need
has been felt for intensification of farm mechanization efforts in the country during the
12th plan through consolidation of the existing schemes and additional strengthening in
terms of new programmes, human resource development and infrastructure.
Farm mechanization is a costly input requiring higher skills. Considering the farm sizes
and prevailing skills, farm mechanization penetration would have to be enhanced
through a combination of promotion of custom hiring models as well as individual
ownership. While draft animal power based implements and manual tools could be
owned by individual farmers (with appropriate financial incentives), the expensive
machinery could be promoted thorough custom hiring. Contract farming, cooperation
farming and other similar farming models would also promote appropriate farm
mechanization.
Greater impetus is required in the development of need based and regionally
differentiated farm machinery by the National Agricultural Research system. The on-
going efforts need to be suitably strengthened with appropriate participation of
agricultural machinery manufacturers to fill the critical mechanization gaps. CIAE
Bhopal has carried out successful development of appropriate machinery in partnership
with machinery manufacturers leading to elimination of gestation period in the

75
development of machinery and its availability to stakeholders. Similar experiences need
further replication across the NARS
5.4 Recommendations:
In view of the potential of farm mechanization to enhance productivity, profitability and
sustainability across the entire landscape of Indian agriculture, there is a need for a
quantum increase in the budgetary allocation of farm mechanization during the 12th
plan. The total budget of farm mechanization proposed is Rs.20,000 crore. The
programmes on promotion of farm mechanization would need to be implemented
through a mission by the Department of Agriculture and Cooperation. The specific
components of the proposed mission are as follows:
• Financial incentives of 50% on the purchase of mechanical power operated farm
machinery to individual farmers, farmers’ cooperatives and custom hiring
entrepreneurs. Financial institutions may provide machinery loans with reduced
interest rates and easy payment terms. State governments may consider top-up
subsidy.
• Financial incentives of 80% on the purchase of manual tools and draft animal
power based implements and machinery to individual farmers, farmers’
cooperatives and custom hiring entrepreneurs. Financial institutions may provide
machinery loans with reduced interest rates and easy payment terms. State
governments may consider top-up subsidy.
• Encouraging tractor, power tiller and machinery manufacturers to integrate
safety gadgets to reduce farm machinery related accidents. In addition, all States
must have adequate compensation packages for farm mechanization related
accidents.
• District level training, demonstration and entrepreneurship development through
farm mechanization centres. This includes training of youth in machinery

76
operation and maintenance with a view to promote machinery service centres in
production catchments.
• Intensive farm mechanization programme on the lines of ‘Yantradoot’
programme of M.P. Government in 10,000 villages in the country.
• Identification of critical farm mechanization gaps for immediate attention and
providing budgetary support for finding solution in joint institution-industry
mode.
• Promotion of local fabrication of farm tools and DAP based implements through
local artisans.
• Expansion and strengthening of machinery testing facilities to ensure quality of
construction and field performance the machinery.
• Special emphasis for hill and tribal areas to promote appropriate mechanization.
• Promotion of custom-hiring of farm machinery.
• Exposure of agricultural machinery manufacturers to the machinery
manufacturing industry in developed countries.
• Awareness creation through workshops, field days, exposure visits.
• Data acquisition on the level of mechanization and agricultural machinery
manufacturing industry for better planning and course corrections. This has
become more important since the machinery data acquisition has been
discontinued in Livestock census
• Custom duty exemption on the import of critical farm machinery and machinery
components to promote mechanization.
• Abolition of excise duty and VAT on agricultural machinery for the next 10
years.
• Appropriate human resource reinforcement at the Central as well as State levels
to implement and monitor the agricultural mechanization mission as proposed
above

77
Chapter 6 The Indian Agricultural Statistics System,
It’s Problems and Some Solutions
The agricultural statistics system has been subjected to review a number of times after
independence so that it can respond to the various challenges being faced from time to
time. As early as 1949 the Technical Committee on Coordination of Agricultural
Statistics in India stressed the need of uniform concepts and definitions and devising
uniform forms of returns for collection of data. The National Commission on
Agriculture (1976) made a critical assessment of the agricultural statistics system of the
country and made far reaching recommendations which put the agricultural statistics
system on a sound footing. Many schemes were initiated on the recommendations of the
National Commission of Agriculture. The high Level Evaluation Committee (1983)
under the chairmanship of Professor A.M. Khusro highlighted the problem of data gaps
and methodological gaps and made recommendations so that a solution is possible. It
also pointed out some emerging areas where mechanism should be put in place for
collection of data. Specifically, it highlighted the need of generating estimates at the
local level. A workshop was organised in 1998 to focus on modernization of the
statistical system in India. The highlight of this workshop was that a number of
suggestions were made regarding use of communication tools to improve the timeliness,
reliability and adequacy of agricultural statistics.
The National Statistical Commission in its Report published in the year 2001 has made
a number of recommendations on almost all aspects of agricultural statistics. Some of
the recommendations are given below.
It has highlighted the need to
• Have accurate crop production statistics at the small area level
• Use of remote sensing technology for crop acreage estimation for the North-
Eastern States

78
• Have an objective method of crop forecasting
• Have an alternative methodology for horticultural crops based on information
from all the sources i.e. market arrivals, exports and growers association
• Have an enlarged land use classification having categories such as social forestry,
land under still water and marshy and water logged land
• Have agriculture census on a sample basis with an element of household inquiry
• Have livestock census on a sample basis
• Merge livestock and agriculture census
• Improve recording of area under still water
• Appropriate methodology for estimation of production of inland fisheries
• Use remote sensing tools for development of forestry statistics.
More recently, the Vaidyanathan committee was constituted in the year 2009 to review
the current methodology used in Timely Reporting Scheme (TRS), Establishment of an
Agency for Reporting Agricultural Statistics ( EARAS), Improvement of Crop Statistics
( ICS) & General Crop Estimation Surveys (GCES) for estimating land use, crop-wise
area, irrigated area, yield and production etc. and suggest institutional framework for
improvement of agricultural statistics, review experience of remote sensing technology
for estimating area and yield of important crops, assess its potential for generating
reliable and timely data and suggest measures to effectively exploit this potential.
The committee observed that the system does not deliver complete, timely and reliable
data. One of the reasons for the failure is the scale of effort required. The area estimates
require complete enumeration of plots in large number of villages by exclusive reliance
on a large number of poorly trained, over burdened and poorly supervised village
officials. Fragmentation of responsibilities for data collection, supervision and
validation among different organizations working more or less independently has
compounded the problem. Indiscriminate increase in the number of crop cutting
experiments to generate yield estimates at district and sub-district levels has made it
very difficult to ensure that they are done properly and without any bias.

79
The committee suggested radical restructuring of the system. It suggested setting up of a
National Crop Statistics Centre (NCSC), an autonomous, professional organization in
the Ministry of Agriculture of the Government of India for generation of crop area and
production statistics at the state and national level. The committee observed that Remote
Sensing technology should be complementary to, rather than a substitute for, improving
conventional methods of collecting agricultural statistics. Further, the committee
commented on some methodological issues in the application of remote sensing
technology for crop acreage and production estimation. Vigorous research efforts are
needed to resolve some of the remote sensing related issues.
Some of the typical problems facing Indian agricultural statistics system are:
• Limited staff and capacity of the units that is responsible for collection,
compilation, analysis, and dissemination of agricultural statistics.
• Inability of the system to use modern technology and tools to the extent it is
desirable.
• Insufficient funding allocated for agricultural statistics
• Lack of institutional coordination which results in the lack of harmonized and
integrated data sources.
• Lack of capacity to analyze data in a policy perspective, which results in a
significant waste of resources as large amounts of raw data are not properly used.
• Difficulty for data users in accessing existing data especially disaggregated data
6.1 Revamping The Indian Agricultural Statistics System
The revamping of the agricultural statistics system needs to be carried out keeping in
view the global strategy to improve agricultural and rural statistics. The global strategy
views agriculture as essentially an economic activity. However, it acknowledges
increasing relationship of agriculture with social and environmental issues.

80
The economic dimension of agriculture includes land, labour and capital which are
critical inputs in the production process. Use of inputs, result in output in the form of
production. Some of the output is self consumed, part of the output is used as seed/feed
and the bulk of the remaining amount goes in the market. The economic dimension,
therefore, also covers agricultural production, markets and farm and nonfarm income.
Agriculture production has direct bearing on food security, poverty and economy of the
country.
The environmental dimension of agriculture arises out of use of natural resources in
agriculture. The environmental dimension comprises land, water, land cover and land
use, including forestry. The environmental aspect also includes waste and emission by-
products produced in the process of production. Agriculture is directly linked to climate
change and biodiversity. This points out towards the need of producing statistics on role
of agriculture in economy and environment.
The social dimension covers the need to reduce risk and vulnerability, including food
security, and issues related to gender.
Under the global strategy a conceptual framework has been developed keeping into
account the user’s needs. The conceptual framework points to many emerging
requirements from user’s point of view. The emerging requirements are in the form of
issues related to agriculture like poverty and hunger, environment and climate change,
land and water use and biofuels production. Thus, under the conceptual framework,
besides agricultural statistics the other items included are fisheries, forestry and rural
development. The conceptual framework highlights the need for survey framework to
link farm as an economic unit, household as the social unit and the occupied land as the
natural environment. It identifies the three pillars of global strategy i.e. identifying a
minimum set of core data, the integration of agriculture into the national statistical

81
system; and the sustainability of the agricultural statistical system through governance
and capacity building.
The global strategy provides a framework for national and international statistical
systems which will enable the countries to produce the required data and use the data
for decision making in the 21st century. The global strategy is based on three pillars:
The first pillar is the establishment of a minimum set of core data that needs to be
collected to meet current and emerging needs. The core data set shall meet the national
as well international need. Core data items can be selected on the basis of their
importance to agricultural production globally. For example, only about 10 crops and 4
livestock species account for over 95 percent of the world’s production of cereals, meat,
and fibre. A core item is one whose data enter into a multitude of indicators needed to
monitor and evaluate development policies, food security, and progress toward meeting
the Millennium Development Goals (MDG). In what follows, various items are given
which may form part of minimum set of core data.
Core crop items: Wheat, maize, barley, sorghum, rice, sugar cane, soybeans, and cotton
are core crop items.
Data required for these core items include:
a. Area planted and harvested, yield, and production.
b. Amounts in storage at the beginning of harvest.
c. Area of cropland that is irrigated.
d. Producer and consumer prices.
e. Amounts utilized for own consumption, food, feed, seed, fibre, oil for food, bio-
energy, and net trade or imports and exports.
f. Early warning indicators such as precipitation, windshield surveys of crop conditions,
and vegetative indices provided by satellite observations.

82
Core livestock items: These include cattle, sheep, pigs, goats, and poultry. These are
major sources of food supply and agricultural income. Consumption increases as
countries develop and incomes grow. Increased demand for livestock products leads
directly to increased usage of feed grains, and can lead to situations in which feed
production competes with food production, even though the feed is ultimately an input
to food production. Livestock are also sources of methane emissions, water pollutants,
and disease risk. All of these factors can be affected by policy decisions.
Data required for these livestock items include:
a. Inventory and annual births.
b. Production of products such as meat, milk, eggs, and wool, and net trade or imports
and exports.
c. Producer and consumer prices.
Core aquaculture and fisheries products: These contribute significantly to food
supplies. Data under this head comprise
a. Area cultured, production, prices, and net trade or imports and exports for
aquaculture.
b. Quantity landed and discarded, number of days fished, amounts processed for food
and non-food uses, prices, and imports and exports.
Core forestry production: Forestry is a major land use. It is another source of income
and has a significant role in understanding the forces affecting climate change. Data
required under this head include:
a. Area in woodlands and forests, quantities removed, and their prices for land
associated with agricultural holdings.

83
b. Area in woodlands and forests, quantities removed, and their prices for products from
non-agricultural holdings and respective utilizations.
Core agricultural inputs: Core inputs to agricultural production include labor,
chemicals, water, energy, and capital stocks. Inputs are considered core because, in
combination with data about outputs, they provide measures of agricultural productivity
important to monitoring and evaluating steps to reduce poverty and hunger. Core data
required for this purpose are the following:
a. Quantities of fertilizer and pesticides utilized.
b. Water and energy consumed.
c. Capital stocks such as machinery by purpose (i.e.tillage or harvesting).
d. Number of people of working age by sex.
e. Number of workers hired by agricultural holders.
f. Employment of household members on the agricultural holding.
Core socioeconomic data: Data under this head is required on household income by
source. Besides, data about the number of households, employment, population, age,
gender, and education levels are required.
Land cover: Land use and land cover are the two important indicators for assessment of
affect of agriculture on environment. Land cover does not change rapidly and data are
not, therefore, required on an annual basis. However, mapping products or digitized data
from remote sensing should provide complete coverage for the entire land mass of a
country with the following classifications:
a. Cropland b. Forest land c. Grassland d. Wetlands e. Settlements f. Other land g.
Water

84
Public expenditures on subsidies, infrastructure, and health and education in rural areas
are core items. This should include the availability of roads, transport services,
communications, and extension services.
The data on core item ought to be collected every year. However, data on minor
commodities can be collected after a gap of 5 or 10 years.
The second pillar is the integration of agriculture into national statistical systems. This
will provide the administrators and policy planners comparable data across locations
and over time for better decision making. One of the major defects of the agricultural
statistics system prevailing in our country is that the data are collected sector wise using
different sampling frames and surveys. It becomes difficult to integrate data from
different surveys. Thus, cross-tabulation for different variables is not possible. As an
example, crop and livestock related data are collected through different samples. It is,
therefore, not possible to analyse the characteristics of farms having both or to compare
farms which possess either crop or livestock. Similarly, household surveys are carried
out independently of production surveys which make integration of data impossible. A
similar situation prevails with respect to agriculture, fishery and forest data. Sometimes
it is seen that more or less same set of data are generated by more than one agency and
there are considerable variations in data emanating from different sources. All these
factors make interpretation difficult. Integrated statistical systems can resolve many of
these problems by avoiding duplications of effort, preventing the release of conflicting
statistics, and ensuring the best use of resources. One big advantage with an integrated
system is that the concepts, definitions, and classifications become standardized,
allowing more systematic data collection across sources.
Development of a master sample frame is a prerequisite to the development of an
integrated system. Samples selected from a master frame will ensure comparability,
avoid unnecessary duplication, facilitate concentration of resources from multiple
sources and help in data management. The basic units of sampling are either household,

85
holding or land parcel. A link between these can be established by geo-referencing. In
this context the use of area frame methodologies is very important. The FAO advocates
the multiple frame approach to create a master frame that utilizes both area frames and
registers. The master frame will have the capability to link farm with the households.
These two in turn can be connected to land cover and land use. The area sample frame
meets this requirement. The methodology for use of population census is recommended
for the World Program for the Census of Agriculture (FAO 2005). This will also meet
the requirement—if households from the population census are geo-referenced and used
as the frame for the agricultural census and linked to satellite images of land use.
A master sample frame can be developed in a number of ways. It can be developed
through coordinated population and agricultural census data. Many countries develop
Master sample frame with an agricultural census. The development of the master
sample frame using the agricultural census includes the need to associate farms with
households and both with land use. The basic reporting unit in the agriculture census is
the farm. For the purpose of development of master frame there is a need to connect the
farm with the household i.e. to obtain information about the household as well its
various characteristic. It should therefore be possible to develop a register containing
items related to household and its characteristic.
Ultimately land associated with each farm and associated household needs to be linked
to the appropriate geo-referenced census enumeration areas or administrative units, or
both. In this example, the master sample frame for agriculture will be a register of farms
or households and commercial farm enterprises with their land geo-referenced to
enumeration areas or administrative units. The only additional work required for this is
that the register needs to be updated in the interval between the two censuses.
Wherever a full census is not possible the required information can be generated using,
for instance, a two stage sampling design with first stage units as enumeration areas.
The first stage units need to be updated at regular interval. The geo-referencing of farms
or households to the census enumeration or the administrative units that are part of the

86
data layer in the satellite imagery in effect establishes an area sample frame—and
becomes the master sample frame for agriculture.
An alternative way to develop master frame is to use administrative data to develop
registers of farms. Thus, information obtained from tax record, licenses etc. can be used
to develop register of farms. In some cases information on small farms may not be
available. Data on these farms can be obtained through specialised efforts on sample
basis. Again, the geo-referencing of the farms or households in the business register to
either census enumeration or administrative areas is required for establishing an area
sampling frame. This becomes the master sample frame for agriculture.
Master sample frame when there is not a recent agricultural census. The starting point
should be the development of an area sample frame. The geo-referenced satellite
imagery by land-use category can also be used as the basis for an area sample frame.
Plenty of literature is available to achieve this.
6.2 Steps to Implement an Integrated Survey Framework
The various steps are
a) Identification of core data items for which data are required annually
b) Select replicated sample. This means some sample units can be selected at
different time points for longitudinal analysis
c) Designing a questionnaire
d) Each year, one of the sets of panel data (data to be collected periodically) will be
linked to the annual core items
Surveys can be conducted on sub-sample basis within a year.
The additional data sources needed for integrated survey frameworks are:

87
a. Administrative data Governmental interventions such as subsidies, regulation,
and legislation often require agricultural holders to report production information.
Land ownership and cadastral surveys provide useful information for
constructing registers. Food inspections, animal health inspections, and trade data
provide input to the utilization accounts.
b. Remotely sensed data These include vegetative indices that show overall crop
conditions and information about changes in land cover and use. The survey
framework should include the need to provide ground truth data if remote sensing
information is to be used to estimate cropland areas.
c. Agribusinesses are the source of utilization data and prices.
d. Expert judgment and windshield surveys can be used to collect data from
experts whose judgments inform evaluations of agricultural conditions. For
instance, the Sourcebook (World Bank 2008b) refers to a procedure in which
experts travel a specified route on a periodic basis and record the condition of
crops, which provide an input into crop yield forecasts.
e. Community surveys The World Programme for the Census of Agriculture (FAO
2005b) provides an overview of data that can be collected at the village level.
These data include information about the infrastructure and services available to
households and agricultural holdings, occurrences of food shortages, frequency of
natural disasters, etc.
6.3 The Data Management System
The data management system fulfils three functions—access to official statistics for
dissemination purposes; storage and retrieval of survey results; and access to farm,
household, and geo-referenced data for research. The data management system should:
i. Support the dissemination of data to ensure that the official statistics are readily
available, clearly identified by source and time, and are comparable for aggregation
purposes, both within and across countries. If more than one institution is involved in

88
the national statistical system, there should either be a single database, or the
databases should be coordinated to avoid duplication of official statistics. Such
duplication can lead to different numbers, causing confusion among those using the
data. These data should become part of FAOSTAT, the FAO statistical data base,
which becomes a public good for data access.
ii. Provide the framework for the storage of the aggregated survey results and geo-
referenced land use data along with the supporting administrative and other data
sources built on the capabilities provided by the master sample frame’s link to land
use. The data management system should provide for the storage and maintenance of
the farm and household survey data and for the link between the different sets of data
that are geo-referenced to a common land use.
6.4 Governance
Effective governance is must for efficient functioning of the system. Although the
Indian Agricultural Statistics System is built on a very strong foundation, it needs to be
ensured that there is no unnecessary duplication in the system. There is a need for
coordinating mechanism to ensure that duplication does not happen. This will avoid the
embarrassment of conflicting data for the same variable. It may be noted that the
creation of a position of Chief Statistician in the Indian Statistical System is a welcome
development.
Further, it is necessary to adopt internationally recognized definitions, concepts,
classifications and codes for agricultural production and prices data, and application of a
web based information technology system for food and agricultural statistics at national,
sub-national and district levels which could provide decision makers access to statistics,
support analysis and monitoring across thematic area such as production, prices, trade
etc.

89
6.5 Capacity Building
The use of remote sensing technologies, the design of an integrated survey framework,
and the use of a data management system require experienced technical personnel.
While building and maintaining technical capacity in every country will be problematic,
there are ways to solve this problem. One of the way out is to establish regional centres
of excellence that can provide remote sensing capabilities, develop statistical methods,
and guide the implementation of information technologies in providing support to
national institutions. These centres can be established with support from donors and
international organizations.
Capacity building should, therefore, focus on to:
• Develop national strategies for the development of statistics; where such strategies
are in place, review them to determine where revisions are needed.
• Build a network of statisticians and supporting staff including data collectors.
• Educate staff on statistical methodology for sampling, survey design, data
compilation, and data analysis.
• Develop and maintain the master sample frame, implement the new survey
framework, and develop the data management system.
• Provide computers, software, and other technical equipment.
• Provide the satellite imagery geo-referenced by land use.
• Disseminate the results and respond to requests.
6.6 Recommendations
1. Generation of Crop Estimates at Lower Level
In view of decentralised system of planning in our country, reliable micro level
estimates are required. The traditional approach of estimation is not suitable for

90
generation of reliable estimates at micro level. In such situations, newer methodology
such as small area estimation techniques needs to be explored to develop estimates at
the lower level. For this activity which is highly technical in nature, the first step is to
strengthen different agencies with suitable and qualified personnel with adequate
statistical as well as computer background and knowledge.
2. Use of Remote Sensing and GIS Technology
The potential of remote sensing technology and Geographic Information Systems (GIS)
need to be exploited for development of master frame either through the use of
agricultural census or the administrative data. Samples selected from a master frame
will ensure comparability, avoid unnecessary duplication, facilitate concentration of
resources from multiple sources and help in efficient data management. Further GIS can
usefully be employed for acquisition, verification, compilation, storage, and analysis of
data. These techniques have many advantages like integration of data from many
different sources, identification of the spatial relationships between map features,
analysis, and visualization of the data etc.
3. Suggestions of Vaidyanathan Committee
The Vaidyanathan committee has recommended setting up a National Crop Statistics
Centre. This is a very good suggestion and should be implemented for improving the
quality of agricultural statistics in India. Secondly, the committee has suggested
significant reduction in the crop cutting experiments. This recommendation relating to
reduction of sample size for area and crop yield estimation needs to be verified
thoroughly on the basis of in depth analysis of available data for arriving at valid
estimates of sample size. Further, the committee has recommended two different
mechanisms for generation of national/state level and district level estimates. It is
visualised that these two sets of estimates are not likely to match with each other and
may create confusion. A mechanism thus needs to be identified for reconciliation of two

91
sets of estimates before implementation of committee’s recommendations. In this
endeavour exploitation of small area estimation techniques prove to be useful for such
situations i.e. generating district level estimates.
4. Additional Information for Official Records
The scope of khasra register need to be expanded to include details like crop variety
(local/desi/improved/hybrid), chemical fertilizer used or not, irrigation source owned by
the farmer or borrowed/hired, source of energy used for lifting the irrigation water i.e.
electricity/diesel/animal etc., total number of fruit trees and number of bearing fruit
trees. This information will help in designing future surveys in a better way.
5. Assessment of True Area under Crop
For ascertaining the reliability of land utilisation statistics in the context of high
diversion of agriculture land to other uses for residential, industrial, urbanisation, roads
etc., there is a need for conducting a study for checking the land records through khasra
registers/other records of those villages where the area have come under diversion of
agriculture land to non-agriculture uses particularly in the vicinity of the metropolitan
cities. There is also a need for checking up about the type of land/agriculture land
diverted for the above purposes as well as area reclaimed for agriculture purposes.
6. Methodology for Horticultural Crops
The estimates of area and production of important fruits and vegetables are being
obtained under the scheme of Crop Estimation Survey on Fruits and Vegetables (CES-
F&V). A simplified methodology has been developed by the IASRI. The methodology
developed at IASRI needs to be tested in some more states before it can be
recommended for adoption. Further, the existing data base relating to horticulture sector
needs to be strengthened. Efforts need to be made for the conduct of horticulture census.

92
An effective Horticultural Information System is also needed for quick assessment and
dissemination of data.
7. Methodology for generation of Fishery Statistics
There is a need to fine tune the existing methodology for generation of fishery statistics.
Possibility of application of remote sensing and GIS tools need to be explored for
improving the efficiency and timeliness of the statistics.
8. Methodology for estimation of feed consumed by the livestock
Considerable amount of feed is consumed by the livestock population of the country.
Development of appropriate methodology for estimation of feed consumed by livestock
will help in updation of ratios which are currently used by the National Accounts
Division.
9. Need for Availability of Data Relating to Mechanization
The information on different power sources e.g. Tractors, Power Tillers, Diesel Engines,
Electric Pumps and other power-operated agricultural implements and machinery used
to be collected through the Livestock Census. However, these data items have been
deleted in the 18th Indian Livestock Census, conducted by Department of Animal
Husbandry, Dairying and Fisheries (DAHDF), Ministry of Agriculture, Government of
India. The total annual investment on Agricultural Implements and Machinery is more
than Rs. 50,000/- crores. Moreover, data on these power sources and power-operated
agricultural implements and machinery shall be required by the policy makers/planners
for formulation of appropriate mechanization strategies. Accordingly, it is
recommended that regular data on the above-mentioned aspects need to be collected by
some government agency.

93
10. Methodology for generation of acreage statistics under agro-forestry
Reliable estimates of area under agro-forestry are currently not available. There is a
need to develop implementable methodology using remote sensing and GIS tools for
estimation of area under agro-forestry for mono species as well as multiple species.
There is an urgent need to undertake pilot studies in this direction.
11. Precision of Estimates
Generally in official statistics system, only estimates of parameter of interest are made
available. If the precision of these estimates are also made available along with the
estimates of different crops, this will add very useful information and knowledge to
policy planners. Thus it is suggested that it may be obligatory on the part of official
agencies to provide standard errors or confidence intervals of the estimates. This will
provide an idea about the reliability of the estimates and help in decision making on
appropriateness of sample sizes.
12. Use of Modern Data Capturing, Geographical Position System (GPS) and
Information Communication Technology (ICT) Tools
For an efficient statistical organization, the capacity and activities of existing data
collection agencies have to be strengthened through the effective use of existing
Information Communication Technology (ICT) and GPS for its data collection, data
capturing, data processing, analysis and dissemination. In addition, provision of data
also involves harmonizing and integrating statistical data, filling the gap between data
produced and data available, laying down efficient ICT infrastructure, improving the
quality and comparability of data, solving the challenges emerging from data and
metadata exchange and harmonizing different standards with the data management
system. All these need strengthening and proper utilization of ICT at all levels

94
The use of (Personal Digital Assistant) PDA in data collection in different surveys and
censuses need to be encouraged. This will reduce the delays caused in data entry as well
as various non-sampling errors. The traditional paper based data collection system need
to be fully replaced by the digital system. In order to further reduce data processing time
an automated excel spreadsheet need to developed. This further reduces the time for
data collection to data dissemination on the web. A manual on the utilization of the
automated spreadsheet needs to be developed by subject matter specialists. Data quality
is a critical issue to meet the statistical objectives and is expected to be significantly
improved by the introduction of these small initiatives.
One of the important variables in terms of generating reliable agricultural data is data on
land, be it cultivated land, grazing land, fertilized land or wood land. This thus requires
a reliable method of measuring the specific land size with its purpose. The total
production itself is associated with the yield and the total area cultivated. Therefore, a
reliable statistics in area is a very determining factor for agricultural statistics. In most
of developing countries, farmers are not able to provide the land size in standard units
and as such there is no standard conversion factor to the local units either. The
traditional rope and compass method of area measurement has been in place for several
years with its limitation and increased non sampling error due its complication.
Moreover, as this traditional method requires more time in the field, provision of
estimates on a timely fashion cannot be easily attained. Area estimates are provided by
revenue agencies and they generally employ either traditional method of measurement
or from already collected information. There is a great degree of subjectivity. Thus there
is strong need to obtain reliable estimates of area cultivated in the possible shortest time.
Taking advantage of new technological advances in geo-positioning, there is a need to
test this new technology for crop area measurements. The GPS provides the cropped
area directly thus doing away with the need of cumbersome distance and angle
measurements. This thus leads to objective way of area measurements.

95
13. Development of Information System similar to Country STAT of FAO
CountrySTAT of FAO is a statistical framework and applied information system for
analysis and policy-making designed in order to organize, integrate and disseminate
statistical data and metadata on food and agriculture coming from different sources.
CountrySTAT gathers and harmonizes scattered institutional statistical information both
at country and international level. The main objectives are to facilitate decision-maker's
access to information and to bind data sources that are currently spread across the
different institutions. It also helps to sustainably improve the quality, accessibility,
relevance and reliability of national statistics particularly related to food and agriculture.
It is an integrated information system with fast web-based interface and it is accessible
from anywhere. The CountrySTAT approach is based on the application of data and
metadata standards of FAOSTAT and SDMX (Statistical Data and Metadata Exchange
promoted by IMF, WB, UNSD, EUROSTAT, FAO, OECD, BIS and ECB) and GAUL
(Global Administrative Unit Layers). Many countries have shown interest and are
adopting it into their national statistical system. Furthermore, CountrySTAT is
accompanied by a capacity-building strategy at country level to make the system
sustainable in the long-term. CountrySTAT is networking with FAOSTAT and other
sister information systems like GIEWS workstation.
The Indian Agricultural Statistical System needs a similar type of web based
information system wherein the timeliness and quality of data will be ensured.
14. Capacity Building
There has been rapid growth in remote sensing technology, small area estimation
techniques, information communication technology and various survey data related
packages. Effective capacity building in these areas is utmost important to achieve the
desired goal of quality and reliable agricultural statistics in the country.

96
15. E-Governance
Although the Indian Agricultural Statistics System is built on a very strong foundation,
it needs to be ensured that there is no unnecessary duplication in the system. There is a
need for coordinating mechanism and e-governance to ensure that duplication does not
happen. This will avoid the embarrassment of conflicting data for the same variable.
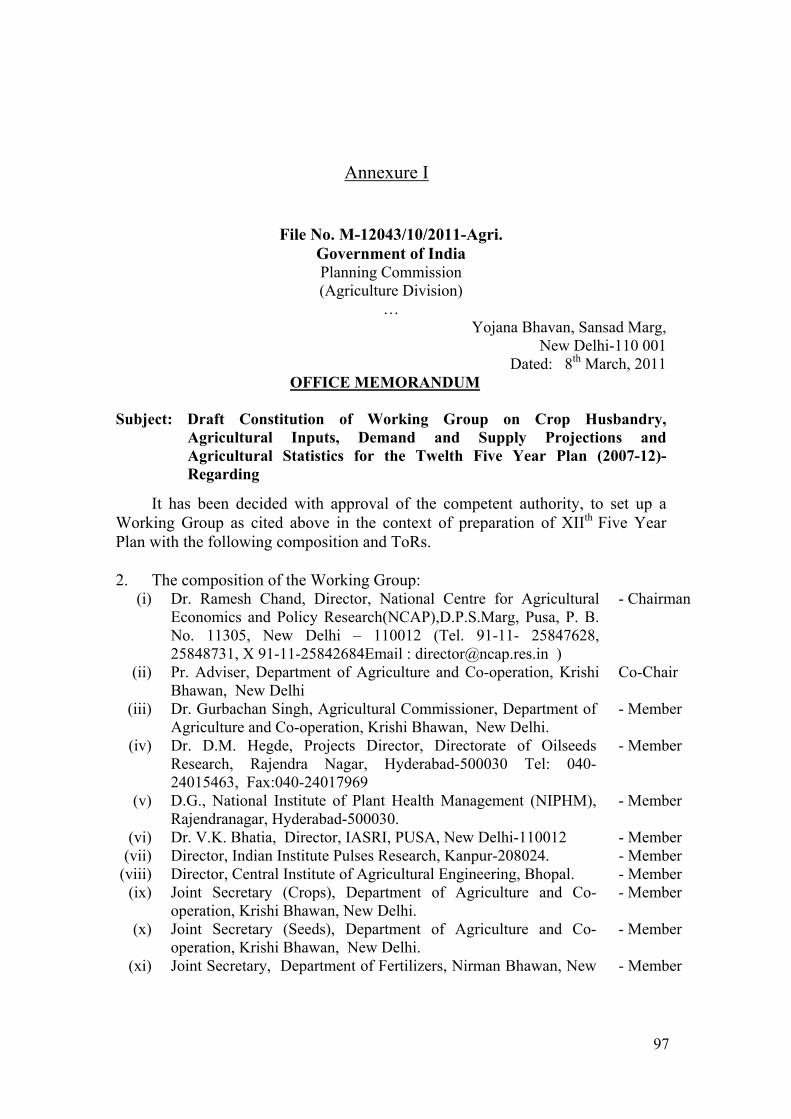
97
Annexure I
File No. M-12043/10/2011-Agri. Government of India Planning Commission (Agriculture Division)
… Yojana Bhavan, Sansad Marg,
New Delhi-110 001 Dated: 8th March, 2011
OFFICE MEMORANDUM Subject: Draft Constitution of Working Group on Crop Husbandry,
Agricultural Inputs, Demand and Supply Projections and Agricultural Statistics for the Twelth Five Year Plan (2007-12)- Regarding
It has been decided with approval of the competent authority, to set up a Working Group as cited above in the context of preparation of XIIth Five Year Plan with the following composition and ToRs. 2. The composition of the Working Group:
(i) Dr. Ramesh Chand, Director, National Centre for Agricultural Economics and Policy Research(NCAP),D.P.S.Marg, Pusa, P. B. No. 11305, New Delhi – 110012 (Tel. 91-11- 25847628, 25848731, X 91-11-25842684Email : [email protected] )
- Chairman
(ii) Pr. Adviser, Department of Agriculture and Co-operation, Krishi Bhawan, New Delhi
Co-Chair
(iii) Dr. Gurbachan Singh, Agricultural Commissioner, Department of Agriculture and Co-operation, Krishi Bhawan, New Delhi.
- Member
(iv) Dr. D.M. Hegde, Projects Director, Directorate of Oilseeds Research, Rajendra Nagar, Hyderabad-500030 Tel: 040-24015463, Fax:040-24017969
- Member
(v) D.G., National Institute of Plant Health Management (NIPHM), Rajendranagar, Hyderabad-500030.
- Member
(vi) Dr. V.K. Bhatia, Director, IASRI, PUSA, New Delhi-110012 - Member (vii) Director, Indian Institute Pulses Research, Kanpur-208024. - Member
(viii) Director, Central Institute of Agricultural Engineering, Bhopal. - Member (ix) Joint Secretary (Crops), Department of Agriculture and Co-
operation, Krishi Bhawan, New Delhi. - Member
(x) Joint Secretary (Seeds), Department of Agriculture and Co-operation, Krishi Bhawan, New Delhi.
- Member
(xi) Joint Secretary, Department of Fertilizers, Nirman Bhawan, New - Member

98
Delhi (xii) DDG (Crops), ICAR, Krishi Bhawan, New Delhi-110001. - Member
(xiii) Prof. Pramod Kumar, Head, ADRTC, Institute of Social and Economic Research, Bangalore.
- Member
(xiv) Pr. Secretary, (Agriculture), Government of Gujarat, Sachivalaya, Ahmadabad.
- Member
(xv) Pr. Secretary, (Agriculture), Government of Punjab, Secretariat, Chandigarh.
- Member
(xvi) Dr. Praduman Kumar, Senior Consultant, National Centre for Agricultural Economics and Policy Research(NCAP), D.P.S. Marg, Pusa, P. B. No. 11305, New Delhi – 110012 (e-mail: [email protected]) (Mob No.8010099082).
- Member
(xvii) Pr. Secretary, (Agriculture), Government of Andhra Pradesh, Secretariat, Hyderabad.
- Member
(xviii) Pr. Secretary, (Agriculture), Government of West Bengal, Kolkatta.
- Member
(xix) Executive Director, National Horticulture Board, Gurgaon. - Member (xx) Managing Director, NABARD, Bandra, Kurla Complex, Mumbai. - Member
(xxi) DDG, NSSO, Patel Bhawan, New Delhi-110001. - Member (xxii) DDG, CSO (National Accounts), Patel Bhawan New Delhi-
110001. - Member
(xxiii) Dr. S. Radhakrishnan, Member-Secretary, Commission for Agricultural Costs and Prices, Krishi Bhavan, New Delhi.
-Member
(xxiv) Director, Directorate of Cotton Development, 4, Ramjibhai Kamani Marg, Ballard Estate, PB No. 1002, Mumbai-400 030 (Maharashta) (Tel: 2611449)
- Member
(xxv) Director, Directorate of Millets Development, Mini Secretariat Building, Bani Park, Jaipur, Rajasthan (Tel: 200038)
- Member
(xxvi) Dr. V. Raghunathan, Former Plant Protection Adviser, H-23/G-3, Sea Breeze Apts, Thiruvallur Nagar, Thiruvanmiyur, Chennai -600041 Tel 91-44-2451 3892 ® E-mail [email protected]
- Member
(xxvii) Adviser (Agriculture), Planning Commission. -Member (xxviii) Economic and Statistical Adviser, Directorate of Economics and
Statistics, Deptt. of Agriculture and Cooperation, Krishi Bhavan, New Delhi.
-Member-Secretary
3. The Terms of Reference (ToR) of the Working Group will be as follows: (i) To study and analyze the trends in agricultural sector, agricultural
productivity, investment in agriculture sector and farmers’ income and suggest policy initiatives and other interventions required to increase these.
(ii) To review the performance of the central sector and centrally sponsored schemes/programmes implemented by the Department of Agriculture and

99
Cooperation during the Eleventh Plan with reference to their objectives and targets and to suggest modifications, if to be continued, to improve the efficacy of schemes taking RKVY into consideration.
(iii) To assess the demand and supply of fertilizers, seeds, and other inputs during the XII Five Year Plan and suggest measures to meet the demand and to suggest measures for judicious management of inputs to achieve higher use efficiency and to effectively address issues concerning adverse impact of imbalanced/ excessive input use and over-exploitation of natural resources on environment.
(iv) To assess the extent of farm mechanization and suggest strategies for its promotion, also covering small farm implements and indigenously developed machines/equipments.
(v) To study the priority in the expenditure on agriculture and allied sectors by the States and the Central Government, suggest ways to augment it.
(vi) To work out the requirements of rice, wheat, maize, other coarse serials, foodgrains, oilseeds, sugarcane, cotton, jute and other commodities including their demand for export, domestic use and make the supply projections for the terminal year of the Twelth Five Year Plan.
(vii) To review the present system of reporting of agricultural statistics, re- look on the recommendations of the National Commission/any other Expert Committee Statistics, suggest measures to improve the quality and efficiency of agricultural data-base and identify training needs of the statistical officials.
4. The Chairman of the Working Group may co-opt any other official/ non-official expert/ representative of any organization as a member(s), if required. 5. The Working Group may examine and address any other issues which are important though not specifically spelt out in the ToR. The Working Group may devise its own procedures for conducting its business/meetings/field visists/constitution of Sub-Groups etc. 6. The expenditure of the members on TA/DA in connection with the meetings of the Working Group or any work incidental to the functions of the Working Group/ Sub Group will be borne by the parent Department/Ministry/Organization/State Government for official members, and by the Planning Commission for non-officials members as admissible to Class-I Officers of the Government of India. 7. The Working Group will submit its Draft Report to the Planning Commission by June 2011 and final one by Sept. 2011.
100
8. Shri Daljeet Singh, Director (Agriculture), Room No. 466. Yojana Bhawan, New Delhi-110001, (Telfax. No. 23096543, e-mail [email protected]) will be the nodal officer for this Group in Planning Commission. Any further queries/correspondence in this regards may be made with him, and also with the Member-Secretary of the Working Group.
(G Rajeev)
Under Secretary to the Go
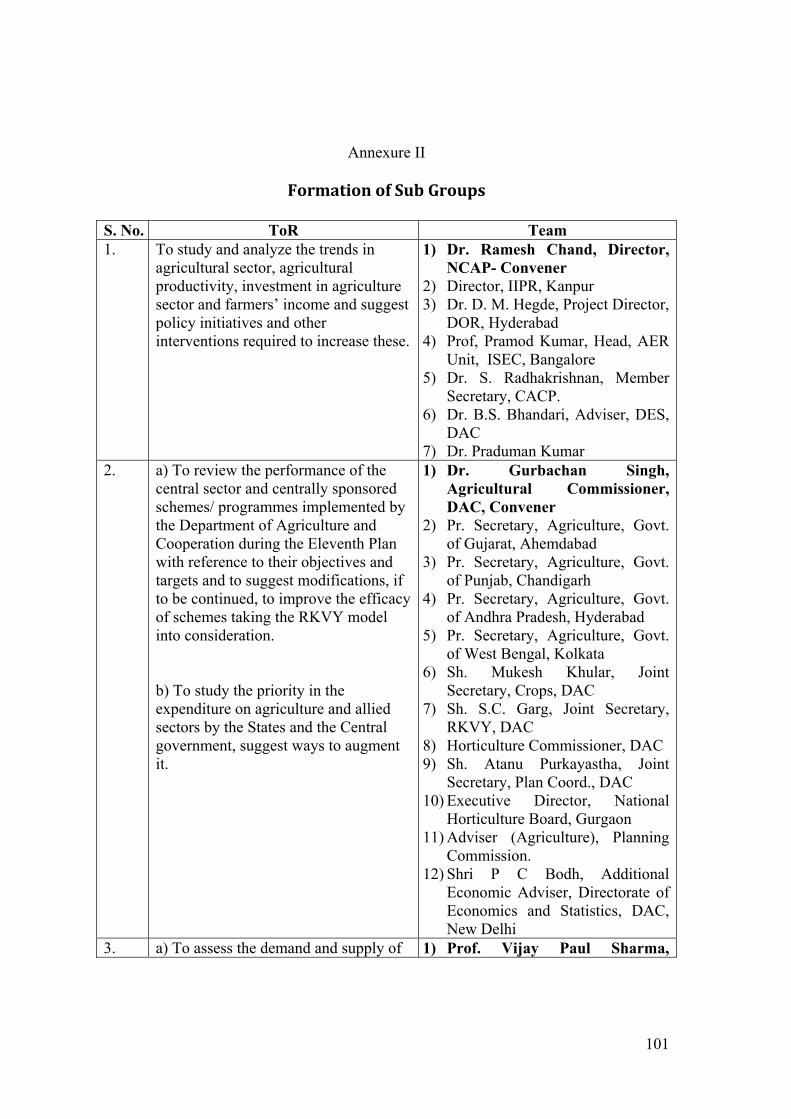
101
Annexure II
Formation of Sub Groups
S. No. ToR Team 1. To study and analyze the trends in
agricultural sector, agricultural productivity, investment in agriculture sector and farmers’ income and suggest policy initiatives and other interventions required to increase these.
1) Dr. Ramesh Chand, Director, NCAP- Convener
2) Director, IIPR, Kanpur 3) Dr. D. M. Hegde, Project Director,
DOR, Hyderabad 4) Prof, Pramod Kumar, Head, AER
Unit, ISEC, Bangalore 5) Dr. S. Radhakrishnan, Member
Secretary, CACP. 6) Dr. B.S. Bhandari, Adviser, DES,
DAC 7) Dr. Praduman Kumar
2. a) To review the performance of the central sector and centrally sponsored schemes/ programmes implemented by the Department of Agriculture and Cooperation during the Eleventh Plan with reference to their objectives and targets and to suggest modifications, if to be continued, to improve the efficacy of schemes taking the RKVY model into consideration. b) To study the priority in the expenditure on agriculture and allied sectors by the States and the Central government, suggest ways to augment it.
1) Dr. Gurbachan Singh, Agricultural Commissioner, DAC, Convener
2) Pr. Secretary, Agriculture, Govt. of Gujarat, Ahemdabad
3) Pr. Secretary, Agriculture, Govt. of Punjab, Chandigarh
4) Pr. Secretary, Agriculture, Govt. of Andhra Pradesh, Hyderabad
5) Pr. Secretary, Agriculture, Govt. of West Bengal, Kolkata
6) Sh. Mukesh Khular, Joint Secretary, Crops, DAC
7) Sh. S.C. Garg, Joint Secretary, RKVY, DAC
8) Horticulture Commissioner, DAC 9) Sh. Atanu Purkayastha, Joint
Secretary, Plan Coord., DAC 10) Executive Director, National
Horticulture Board, Gurgaon 11) Adviser (Agriculture), Planning
Commission. 12) Shri P C Bodh, Additional
Economic Adviser, Directorate of Economics and Statistics, DAC, New Delhi
3. a) To assess the demand and supply of 1) Prof. Vijay Paul Sharma,

102
fertilizers, seeds and other inputs during the XII Five Plan and suggest measures to meet the demand and to suggest measures for judicious management of inputs to achieve higher use efficiency and to effectively address issues concerning adverse impact of imbalanced/excessive input use and over-exploitation of natural resources on environment. b) To work out the requirements of rice, wheat, maize, other coarse serials, foodgrains, oilseeds, sugarcane, cotton, jute and other commodities including their demand for export, domestic use and make the supply projections for the terminal year of the Twelfth five Year Plan.
Chairman, CMA, IIM, Ahmedabad, Convener
2) D. G., NIPHM, Hyderabad 3) Joint Secretary (Crops), DAC,
Krishi Bhawan, N. D. 4) Joint Secretary (Seeds), DAC,
Krishi Bhawan, N. D. 5) Joint Secretary, Department of
Fertilizer, Nirman Bhawan, N. D. 6) Joint Secretary, Department of
Water Resources 7) CGM, Technical Services
Division, NABARD, Mumbai 8) Dr. V. Raghunathan, Former Plant
Protection Adviser, Chennai 9) Mr. Sudhir Bhargav CEO, Agro-
Man Systems Pvt. Ltd., Mumbai 10) Dr. B.S. Bhandari, Adviser, DES,
DAC 11) Sh. Abinash Mishra, Deputy
Adviser (Irrigation), Planning Commission
1) Dr. Praduman Kumar, Senior
Consultant, NCAP, New Delhi Convener
2) Dr. D. M. Hegde, Project Director, DOR, Hyderabad
3) Director, IIPR, Kanpur 4) Prof, Pramod Kumar, Head, ISEC,
Bangalore 5) Director, DCD, Mumbai 6) Director, DMD, Jaipur, Rajasthan 7) DDG(Crops), ICAR 8) DDG(NSSO-Household
Expenditure Survey) 9) Dr. B.S. Bhandari, Adviser, DES,
DAC 4. To assess the extent of farm
mechanization and suggest strategies for its promotion, also covering small implements and indigenously developed machines/equipments.
1) Dr. Pritam Chandra, Director, CIAE, Bhopal, Convener
2) Dr. D. M. Hegde, Project Director, DOR, Hyderabad
3) Mr. G. Shankar, NIPHM, Hyderabad
4) Director, IIPR, Kanpur

103
5) Director, DCD, Mumbai 6) Er. Baldev Singh, AMMA
5. To review the present system of reporting of agricultural statistics, re-look on the recommendations of the National Commission/any other Expert Committee on improvement of Agriculture Statistics, suggest measures to improve the quality and efficiency of agricultural data-base and identify training needs of the statistical officials. With a view to promote consistency and comparative information across the countries, the sub group may explore the possibility of recommending adoption of internationally recognized definitions, concepts, classifications and codes such as International Standard Trade Classification (SITC), Central Product Classification (CPC) or the Harmonized System Classification (HS) for agricultural production and prices data. Further, the sub group may explore the possibility of using some web based information technology system for food and agricultural statistics at national, sub-national and district levels to provide decision makers access to statistics, support analysis and monitoring across thematic area such as production, prices, trade etc.
1) Dr. V. K. Bhatia, Director, IASRI, Pusa, New Delhi, Convener
2) DDG, NSSO, New Delhi 3) DDG, CSO (National Accounts),
New Delhi 4) Shri A. K. Jena, Adviser (Cost),
CACP. Shastri Bhawan, New Delhi
5) Director, DCD, Mumbai 6) Sh. U.C. Sood, 7) Sh. Rajeev Lochan, Adviser, DES,
DAC 8) Dr. B.S. Bhandari, Adviser, DES,
DAC