chapter 1 scope and objective of financial management page
TRANSCRIPT

Chapter 1 Scope and Objective of Financial Management Page No.1.1
CA. ADITYA SHARMA 7887 7887 07 V Smart Academy
Exam M12 N12 M14 M15 N16 M17 N17 M18 M19 N19
Marks 4 4 4 4 4 4 4 4 2 3
Q1.Explain two Basic aspects/
functions of Financial Management.
[Nov 09,19]
1. Procurement of fund
(Least cost, Risk and Control)
2. Effective utilisation of fund
(invest properly and profitably, no
fund to be kept idle, return must be
greater than cost)
Q2. What are the three Phases of
Evolution of Financial Management?
[Nov 02, 09]
1. Traditional Phase
Merger, acquisition, takeovers,
liquidations
2. Transitional Phase
day-to-day problems
3. Modern Phase
efficient market, capital budgeting,
option pricing, valuation models
Q3. What is the interrelation
between Financing, Investment and
Dividend decision? [Nov 2017]
1. Financing decision
2. Investment decision
3. Dividend decision
Q4. The two objectives of Financial
Management
a) Profit Maximisation ( Short term)
b) Wealth maximisation (Long term)
Q5. Profit Maximisation -
Advantages
1. Primary objective
2. Implied objective
3. Growth and development
4. Impact on society
5. Only profit making firms
Q6. Profit Maximisation –
Dis-advantages
1. Not an operationally feasible
2. Term profit is ‘Vague’
3. Ignores the risk factor.
4. Ignores time pattern of return
5. Too narrow
Q7. What is Wealth Maximization?
The value/wealth of a firm is defined
as the market price of the firm’s
stock.
Q8. Wealth Maximization
Advantages
1. Considers all future cash flows,
dividends, earning per share, risk of
a decision etc.
2. Pay regular dividends
3. Considers risk and recognizes the
importance of distribution of
returns.
Q9. Wealth Maximization
Disadvantages
1. No clear relationship
2. anxiety and frustration

Chapter 1 Scope and Objective of Financial Management Page No.1.2
CA. ADITYA SHARMA 7887 7887 07 V Smart Academy
Q10. . Distinguish between Financial
management and financial accounting
[Nov 09]
FM FA
Cash flow Accrual system
Future oriented Past oriented
a. Procurement
of fund
b. Effective
utilisation
a. Measurement,
b. Recognition
c. Disclosure
Q11. Functions of Finance Manager
or CFO
[ May 10, Nov 11]
[Hint- our index of FM syllabus]
1. Estimating requirement of the
fund
2. Financial negotiation
3. Performance evaluation
4. Capital structure decision
5. Investment decision
6. Risk management
7. Dividend decision
8. Cash Management
9. Market impact analysis
Q12. Explain the role of Finance
Manager in the changing scenario of
financial management in India
Occupies key position,
responsible for shaping fortune of
an organisation,
earlier role and new roles,
New era brings new challenges,
role is bigger due to liberalization,
deregulation and globalization
Q13. Emerging issues affecting the
role of CFO [ May 2014, Nov 2016]
MT- RT RT RT GSS
1. Regulation-
2. Technology
3. Risk-
4. Transformation
5. Reporting-
6. Talent and capabilities-
7. Globalisation-
8. Stakeholder management-
9. Strategy-
Q14. What do you understand by
Finance Function
raising of fund----deciding the
cheapest source of finance----
utilisation of fund-------
provision for refund when money is
not required in the business----
deciding most profitable investment
in the business----managing the
fund raised------paying the
returns to the provider of the fund
Q15. Financial distress
1. There are various factors like –
a. price of the product/service,
demand, price
b. Proportion of debt
c. short term and long term
creditors
2. If all the above factors are not
managed by the firm, it can create
situation like distress,
3. Financial distress is a position where
the cash inflows of a firm are
inadequate to meet all its current
obligations.
Q16. Insolvency-
1. Now if the distress continues for
the long time,
2. Revenue is inadequate to revive
the situation firm
3. Inability of a firm to repay
various debts
Chapter 1 Scope and Objective of Financial Management Page No.1.3
CA. ADITYA SHARMA 7887 7887 07 V Smart Academy
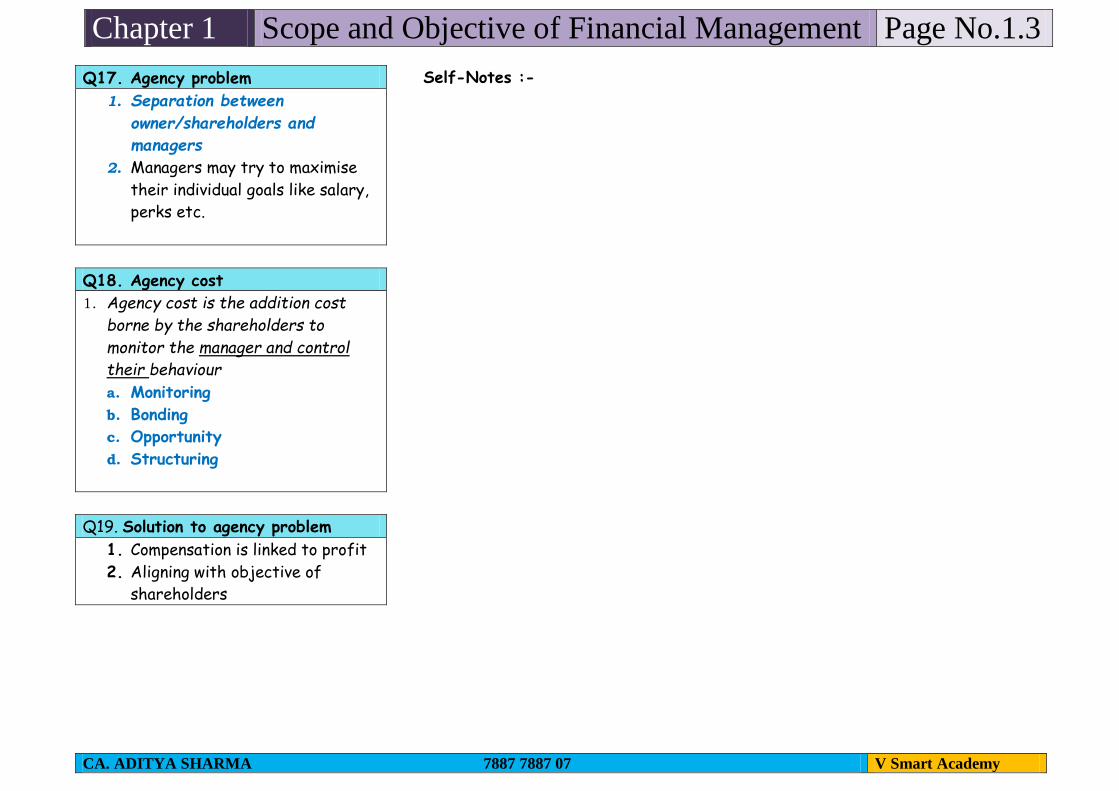
Q17. Agency problem
1. Separation between
owner/shareholders and
managers
2. Managers may try to maximise
their individual goals like salary,
perks etc.
Q18. Agency cost
1. Agency cost is the addition cost
borne by the shareholders to
monitor the manager and control
their behaviour
a. Monitoring
b. Bonding
c. Opportunity
d. Structuring
Q19. Solution to agency problem
1. Compensation is linked to profit
2. Aligning with objective of
shareholders
Self-Notes :-

Chapter 2 Types of Financing Page No. 2.1
CA ADITYA SHARMA 7887 7887 07 V Smart Academy
Q1.Features of equity shares
1. Permanent capital
2. No liability for cash outflows
3. Right to elect board of directors
4. Redeemed only in case of
liquidation
5. Provides a security to other
suppliers
6. Costliest but least risky
7. Not obliged legally to pay
dividends
8. Cost of ordinary shares is higher
9. Increases company’s financial base
Q2. Features of preference share
capital
1. Hybrid security because it has
features of both ordinary share
capital and bonds.
2. No dilution in EPS
3. There is leveraging advantage
4. The preference dividends are fixed
and pre-decided
5. There are no voting rights
Q3. Retained earnings/ explain the
term ‘Ploughing back of Profits’.
What do you understand by internal
cash accruals
1. Long-term funds may also be
provided by accumulating the
profits
2. Increase the net worth
3. Increases the debt borrowing
capacity
4. This is a form of internal cash
accrual.
5. A public limited company must
plough back a reasonable keeping in
view the legal requirements
Q4. Salient features of term loan
1. Issued for Long term
2. Low cost
3. Tax deductible
4. Low admin cost
5. Interest depend on credit rating
6. Can put nominee director
Q5. What are the features of
Debentures? Or,
Financing a business through
borrowing is cheaper than using
equity
1. Low cost
2. Tax deductible
3. No control dilution
4. Finance leverage
5. Low admin cost
Q6. What do you understand by
Bonds? What are the different types
of Bond
Bond is fixed income security created
to raise fund.
Types of Bond-
1. Callable bonds: A callable bond has
a call option which gives the issuer
the right to redeem the bond
before maturity at a predetermined
price known as the call price
2. Puttable bonds: Puttable bonds give
the investor a put option (i.e. the
right to sell the bond) back to the
company before maturity
Q7. Masala Bond
1. It is an Indian name used for Rupee
denominated bond that Indian
corporate borrowers can sell to
investors in overseas markets
2. Issued outside India but
denominated in Indian Rupees
3. First issued by NTPC for 2000
crore.
Chapter 2 Types of Financing Page No. 2.2
CA ADITYA SHARMA 7887 7887 07 V Smart Academy
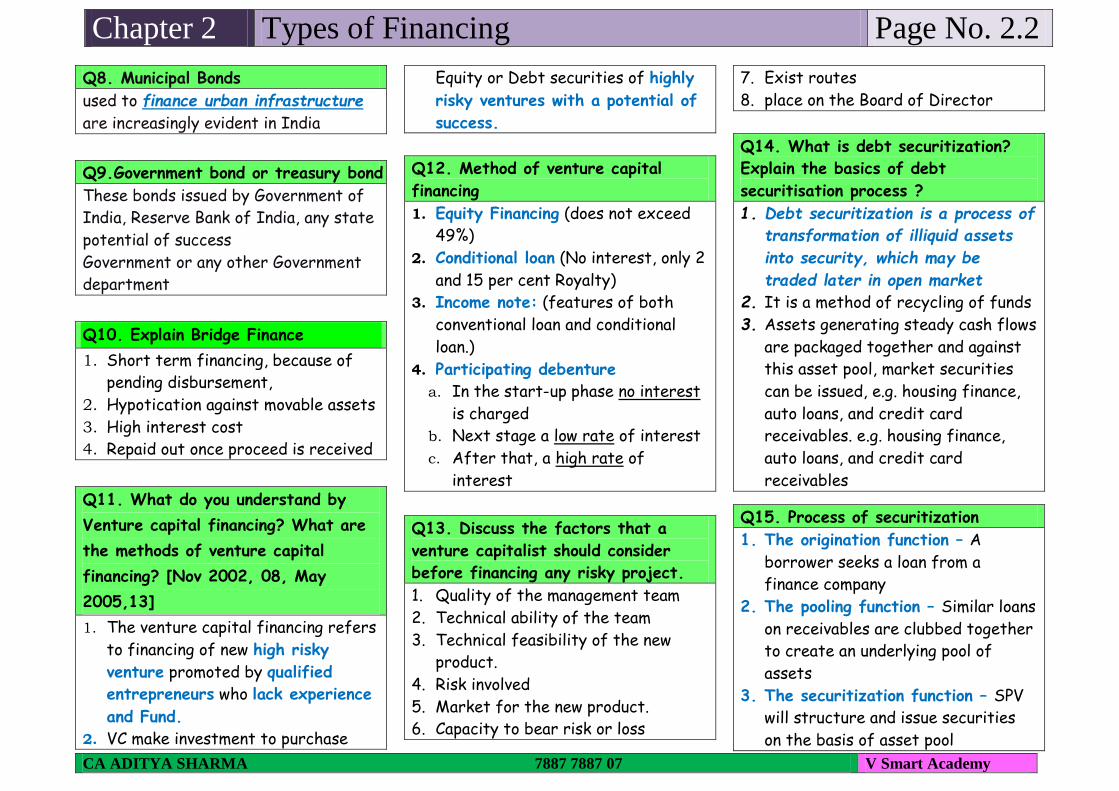
Q8. Municipal Bonds
used to finance urban infrastructure
are increasingly evident in India
Q9.Government bond or treasury bond
These bonds issued by Government of
India, Reserve Bank of India, any state
potential of success
Government or any other Government
department
Q10. Explain Bridge Finance
1. Short term financing, because of
pending disbursement,
2. Hypotication against movable assets
3. High interest cost
4. Repaid out once proceed is received
Q11. What do you understand by
Venture capital financing? What are
the methods of venture capital
financing? [Nov 2002, 08, May
2005,13]
1. The venture capital financing refers
to financing of new high risky
venture promoted by qualified
entrepreneurs who lack experience
and Fund.
2. VC make investment to purchase
Equity or Debt securities of highly
risky ventures with a potential of
success.
Q12. Method of venture capital
financing
1. Equity Financing (does not exceed
49%)
2. Conditional loan (No interest, only 2
and 15 per cent Royalty)
3. Income note: (features of both
conventional loan and conditional
loan.)
4. Participating debenture
a. In the start-up phase no interest
is charged
b. Next stage a low rate of interest
c. After that, a high rate of
interest
Q13. Discuss the factors that a
venture capitalist should consider
before financing any risky project.
1. Quality of the management team
2. Technical ability of the team
3. Technical feasibility of the new
product.
4. Risk involved
5. Market for the new product.
6. Capacity to bear risk or loss
7. Exist routes
8. place on the Board of Director
Q14. What is debt securitization?
Explain the basics of debt
securitisation process ?
1. Debt securitization is a process of
transformation of illiquid assets
into security, which may be
traded later in open market
2. It is a method of recycling of funds
3. Assets generating steady cash flows
are packaged together and against
this asset pool, market securities
can be issued, e.g. housing finance,
auto loans, and credit card
receivables. e.g. housing finance,
auto loans, and credit card
receivables
Q15. Process of securitization
1. The origination function – A
borrower seeks a loan from a
finance company
2. The pooling function – Similar loans
on receivables are clubbed together
to create an underlying pool of
assets
3. The securitization function – SPV
will structure and issue securities
on the basis of asset pool

Chapter 2 Types of Financing Page No. 2.3
CA ADITYA SHARMA 7887 7887 07 V Smart Academy
Q16. Advantages of Debt
Securitization
1. Method of recycling of funds
2. The asset is shifted off the Balance
Sheet
3. Converts illiquid assets to liquid
portfolio
4. Better balance sheet management
5. Credit rating enhances
Short term sources
of finance
Q17. Name few instruments of Short
term finance
1. Trade Credit
2. Advances from Customers
3. Bank Advances:
4. Accrued Expenses and Deferred
Income
Q18. What is Commercial Paper?
What are its features? Explain the
eligibility criteria for issue of
commercial paper
1. It is an Unsecured money market
instrument
2. Vaghul working group 1990 made
recommendation for criteria of
issue
3. Maturity may range from 7days- 1
year.
4. Issued in multiple of 5 lakh
5. Only high rated corporate
borrowers can issue Commercial
paper
Q19. Conditions are eligible to issue
commercial paper.
1. tangible net worth of the company
is Rs. 5 crores or more
2. Working capital limit is not less
than Rs. 5 crores
3. Necessary credit rating
4. Minimum current ratio of 1.33:1
5. Listed on one or more stock
exchanges
6. All issue expenses shall be borne by
the company
Finance related to
Export-
Pre-Shipment Finance
Q20. What do you understand by
packing credits
1. Advance for buying goods and
capital equipment to the exporter
2. Advance given against Export order
or Irrevocable Letter of Credit
3. liquidated within 180 days from
the date of its commencement by
negotiation of export bills or
receipt of export
Q21. What are the different types
of packing credits
a. Clean packing credit -advance
made available to firm export order
or a letter of credit without
exercising any charge
b. Packing credit against
hypothecation of goods -
pledgeable interest and the goods
are hypothecated to the bank as
security
c. Packing credit against pledge of
goods
d. E.C.G.C. guarantee
e. Forward exchange contract –
f. exporter should enter into a
forward exchange contact with the
bank,
Q22. Post shipment packing credits
Banks provide finance to exporters by
purchasing export bills drawn payable
at sight or by discounting usance
export bill covering confirmed sales
and backed by documents including

Chapter 2 Types of Financing Page No. 2.4
CA ADITYA SHARMA 7887 7887 07 V Smart Academy
documents of title of goods such as
bill of lading, post parcel receipt, or
air consignment notes.
Q23. Certificate of Deposit (CD)
1. Document of title similar to a time
deposit receipt
2. No prescribed interest rate on such
funds
3. Banker is not required to encash the
deposit before maturity
4. He can sell the CD in secondary
market.
Q24. Public Deposits
1. Deposit from public
2. Max 35% of paid up share capital &
reserves
3. Accepter for 6M to 3 Years
4. Raised mainly for working capital
Q25. Seed capital assistance’
1. Scheme of IDBI
2. Professionally qualified
entrepreneurs
3. Max 2cr project cost
4. Max loan is 50% of owner’s
contribution or 15 Lakh which is low
5. Initially no interest but service
charge of 1%, moratorium period 5
Years.
Q26. Secured Premium Notes
1. Secured Premium Notes is issued
along with a detachable warrant
2. Redeemable after a notified period
of say 4 to 7 years.
3. Tradable instrument whereby
investor gets right to apply for
equity share
Q27. Deep discount bonds (DDB)
1. It is issued by IDBI
2. Deeply discounted
3. No interest is paid during lock-in
period
4. IDBI was first to issue DDB in
January 1992 with maturity period
of 25 years. The bond was issued
for 2,700 with face value of
1,00,000.
Q28. Zero Coupon Bonds
1. No interest is paid till maturity.
2. It is deeply discounted
3. Difference between issue price and
redemption value represents
interest
4. Indexation and concessional tax
rate
5. Lesser lock-in compared to DDB
Q29. International Financing
1. External commercial Borrowings
(ECB)
2. Euro Bonds:
3. Foreign Bonds:
4. Medium Term Notes
5. Euro Convertible bond
6. Fully Hedged Bonds
7. Euro Commercial paper
8. Foreign currency Options:
9. Foreign Currency Futures
10. Floating Rate Notes (FRN):
Q30. American Depository Receipts
(ADR)
1. These are securities offered by
non-US companies who want to list
on any of the US exchange
2. ADR represents a certain number of
a non US company’s regular shares
3. ADRs are issued by an approved
New York bank or trust company..
4. ADRs goes through US brokers,
Helsinki Exchanges and DTC as well
as Deutsche Bank
5. The most onerous aspect of a US
listing for the companies is to
provide full, half yearly & quarterly
accounts to Security Exchange
Commission USA.
Chapter 2 Types of Financing Page No. 2.5
CA ADITYA SHARMA 7887 7887 07 V Smart Academy
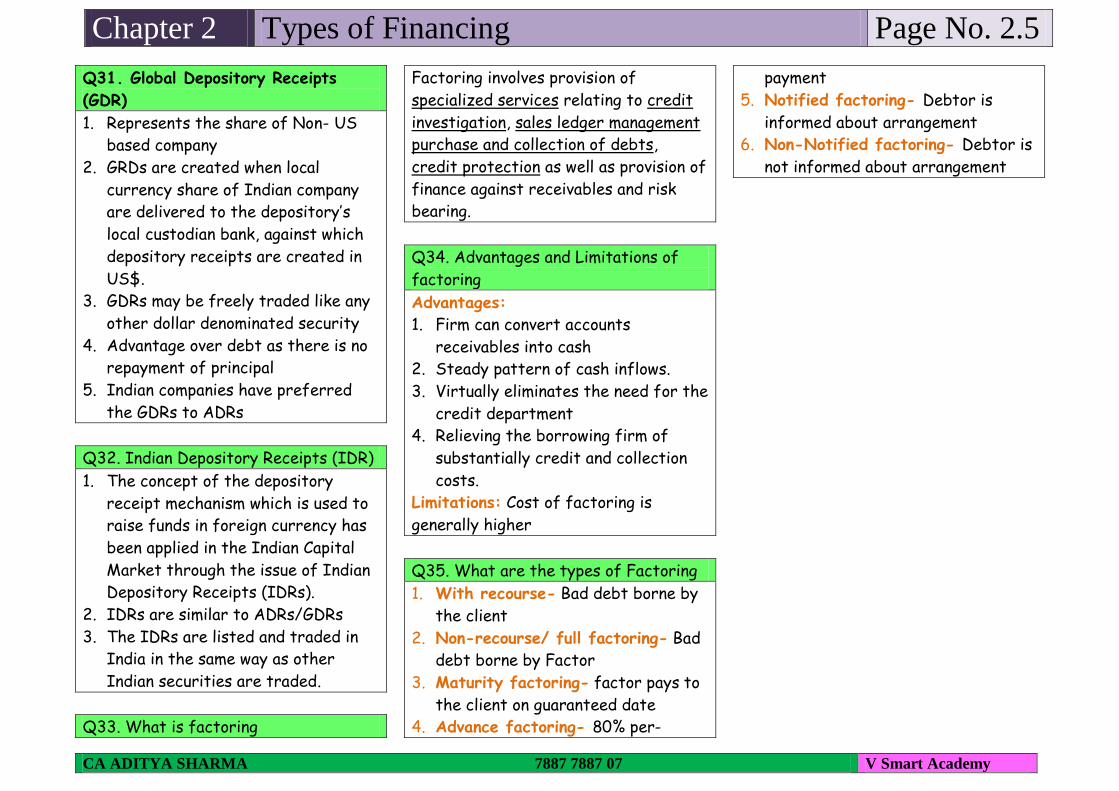
Q31. Global Depository Receipts
(GDR)
1. Represents the share of Non- US
based company
2. GRDs are created when local
currency share of Indian company
are delivered to the depository’s
local custodian bank, against which
depository receipts are created in
US$.
3. GDRs may be freely traded like any
other dollar denominated security
4. Advantage over debt as there is no
repayment of principal
5. Indian companies have preferred
the GDRs to ADRs
Q32. Indian Depository Receipts (IDR)
1. The concept of the depository
receipt mechanism which is used to
raise funds in foreign currency has
been applied in the Indian Capital
Market through the issue of Indian
Depository Receipts (IDRs).
2. IDRs are similar to ADRs/GDRs
3. The IDRs are listed and traded in
India in the same way as other
Indian securities are traded.
Q33. What is factoring
Factoring involves provision of
specialized services relating to credit
investigation, sales ledger management
purchase and collection of debts,
credit protection as well as provision of
finance against receivables and risk
bearing.
Q34. Advantages and Limitations of
factoring
Advantages:
1. Firm can convert accounts
receivables into cash
2. Steady pattern of cash inflows.
3. Virtually eliminates the need for the
credit department
4. Relieving the borrowing firm of
substantially credit and collection
costs.
Limitations: Cost of factoring is
generally higher
Q35. What are the types of Factoring
1. With recourse- Bad debt borne by
the client
2. Non-recourse/ full factoring- Bad
debt borne by Factor
3. Maturity factoring- factor pays to
the client on guaranteed date
4. Advance factoring- 80% per-
payment
5. Notified factoring- Debtor is
informed about arrangement
6. Non-Notified factoring- Debtor is
not informed about arrangement
Chapter 2 Types of Financing Page No. 2.6
CA ADITYA SHARMA 7887 7887 07 V Smart Academy
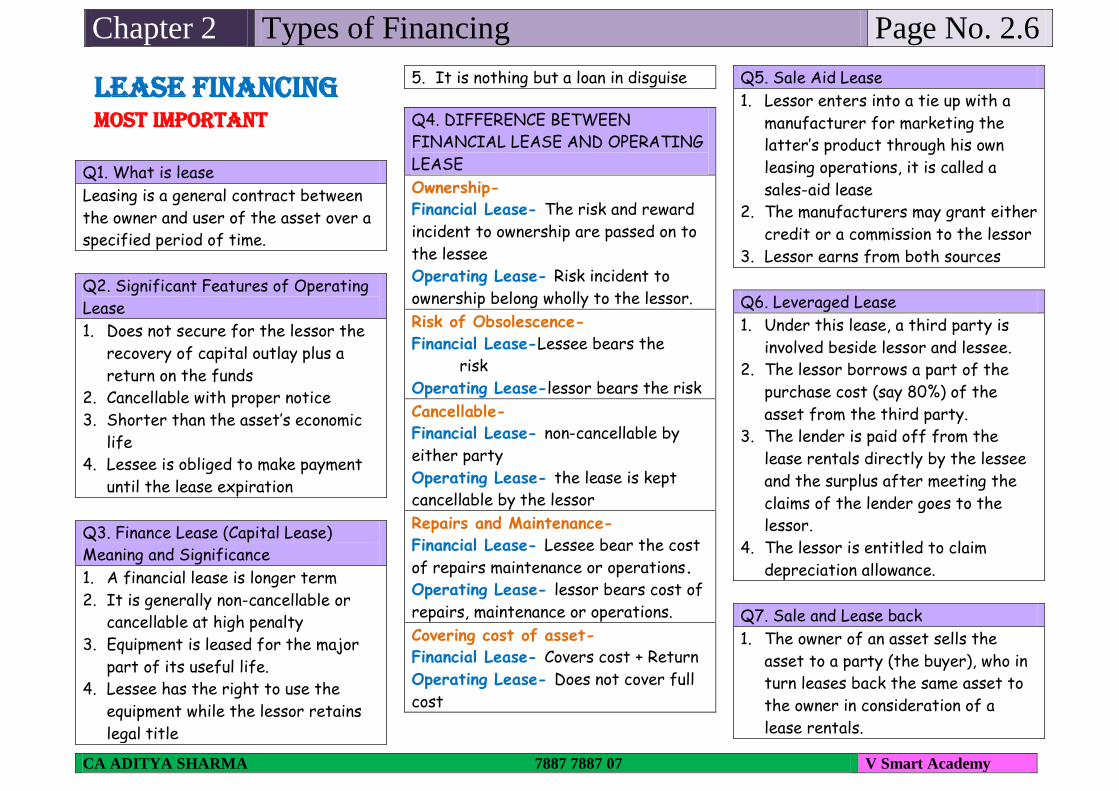
Lease Financing Most Important
Q1. What is lease
Leasing is a general contract between
the owner and user of the asset over a
specified period of time.
Q2. Significant Features of Operating
Lease
1. Does not secure for the lessor the
recovery of capital outlay plus a
return on the funds
2. Cancellable with proper notice
3. Shorter than the asset’s economic
life
4. Lessee is obliged to make payment
until the lease expiration
Q3. Finance Lease (Capital Lease)
Meaning and Significance
1. A financial lease is longer term
2. It is generally non-cancellable or
cancellable at high penalty
3. Equipment is leased for the major
part of its useful life.
4. Lessee has the right to use the
equipment while the lessor retains
legal title
5. It is nothing but a loan in disguise
Q4. DIFFERENCE BETWEEN
FINANCIAL LEASE AND OPERATING
LEASE
Ownership-
Financial Lease- The risk and reward
incident to ownership are passed on to
the lessee
Operating Lease- Risk incident to
ownership belong wholly to the lessor.
Risk of Obsolescence-
Financial Lease-Lessee bears the
risk
Operating Lease-lessor bears the risk
Cancellable-
Financial Lease- non-cancellable by
either party
Operating Lease- the lease is kept
cancellable by the lessor
Repairs and Maintenance-
Financial Lease- Lessee bear the cost
of repairs maintenance or operations.
Operating Lease- lessor bears cost of
repairs, maintenance or operations.
Covering cost of asset-
Financial Lease- Covers cost + Return
Operating Lease- Does not cover full
cost
Q5. Sale Aid Lease
1. Lessor enters into a tie up with a
manufacturer for marketing the
latter’s product through his own
leasing operations, it is called a
sales-aid lease
2. The manufacturers may grant either
credit or a commission to the lessor
3. Lessor earns from both sources
Q6. Leveraged Lease
1. Under this lease, a third party is
involved beside lessor and lessee.
2. The lessor borrows a part of the
purchase cost (say 80%) of the
asset from the third party.
3. The lender is paid off from the
lease rentals directly by the lessee
and the surplus after meeting the
claims of the lender goes to the
lessor.
4. The lessor is entitled to claim
depreciation allowance.
Q7. Sale and Lease back
1. The owner of an asset sells the
asset to a party (the buyer), who in
turn leases back the same asset to
the owner in consideration of a
lease rentals.
Chapter 2 Types of Financing Page No. 2.7
CA ADITYA SHARMA 7887 7887 07 V Smart Academy
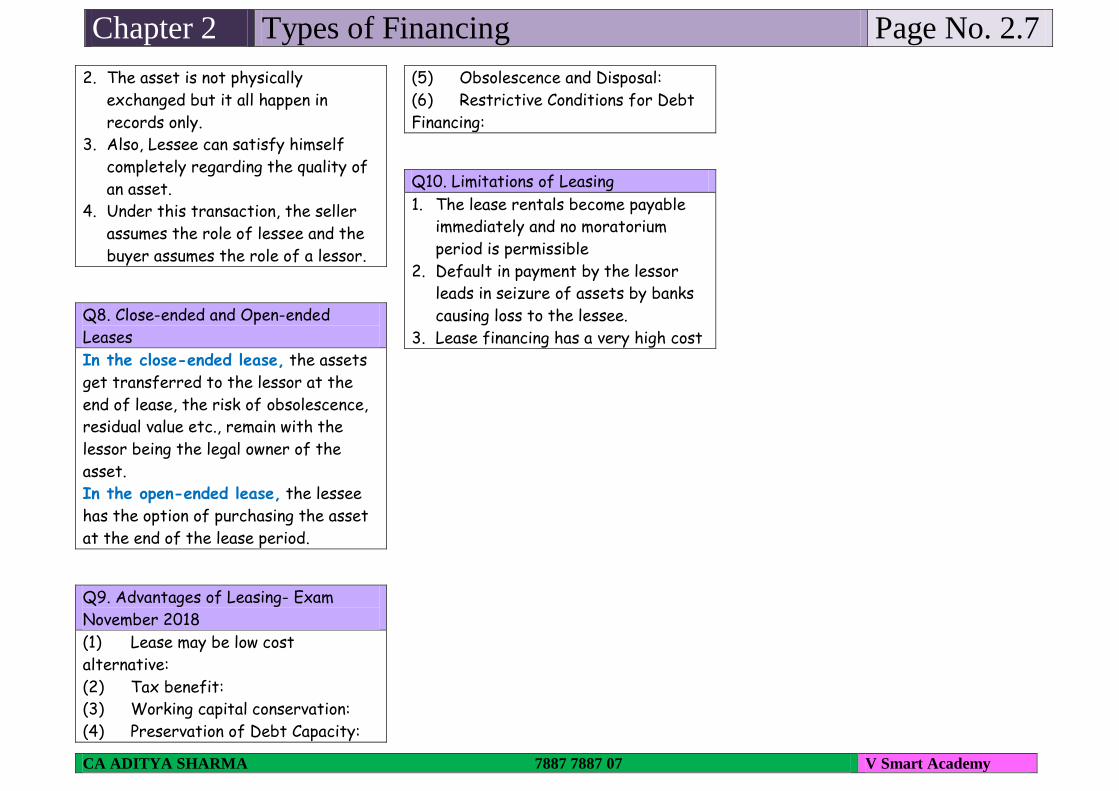
2. The asset is not physically
exchanged but it all happen in
records only.
3. Also, Lessee can satisfy himself
completely regarding the quality of
an asset.
4. Under this transaction, the seller
assumes the role of lessee and the
buyer assumes the role of a lessor.
Q8. Close-ended and Open-ended
Leases
In the close-ended lease, the assets
get transferred to the lessor at the
end of lease, the risk of obsolescence,
residual value etc., remain with the
lessor being the legal owner of the
asset.
In the open-ended lease, the lessee
has the option of purchasing the asset
at the end of the lease period.
Q9. Advantages of Leasing- Exam
November 2018
(1) Lease may be low cost
alternative:
(2) Tax benefit:
(3) Working capital conservation:
(4) Preservation of Debt Capacity:
(5) Obsolescence and Disposal:
(6) Restrictive Conditions for Debt
Financing:
Q10. Limitations of Leasing
1. The lease rentals become payable
immediately and no moratorium
period is permissible
2. Default in payment by the lessor
leads in seizure of assets by banks
causing loss to the lessee.
3. Lease financing has a very high cost
Chapter 2 Types of Financing Page No. 2.8
CA ADITYA SHARMA 7887 7887 07 V Smart Academy
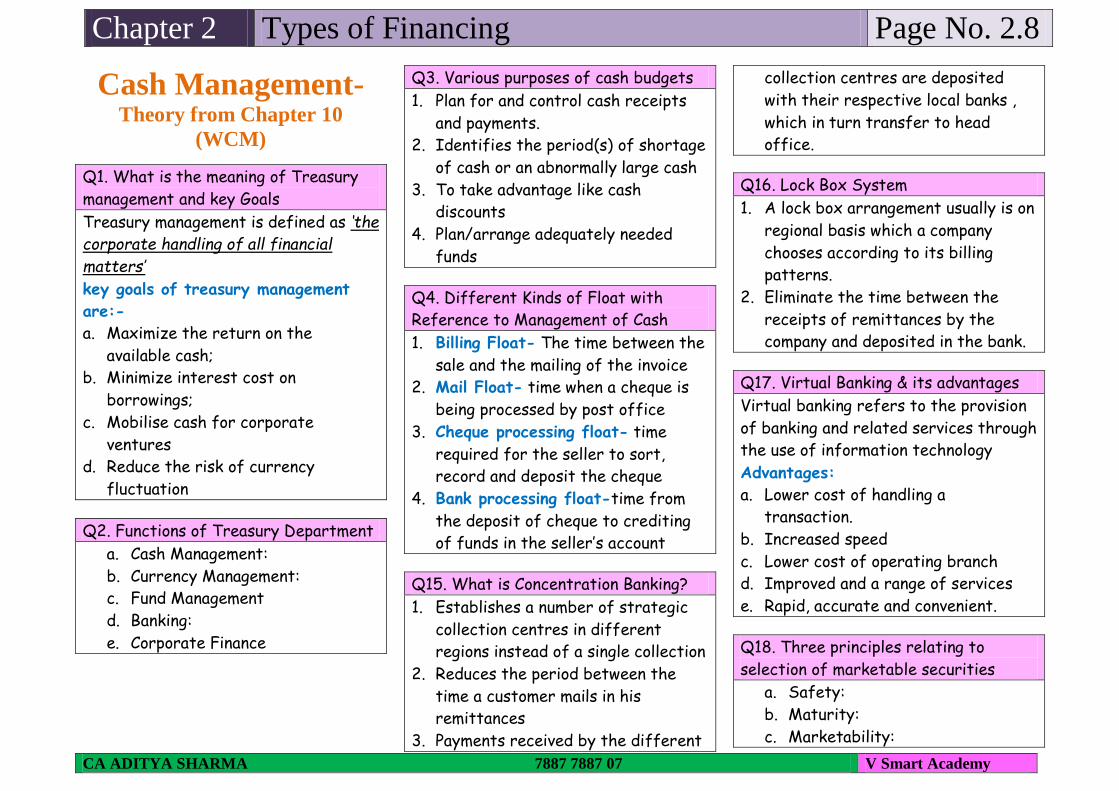
Cash Management-Theory from Chapter 10
(WCM)
Q1. What is the meaning of Treasury
management and key Goals
Treasury management is defined as ‘the
corporate handling of all financial
matters’
key goals of treasury management
are:-
a. Maximize the return on the
available cash;
b. Minimize interest cost on
borrowings;
c. Mobilise cash for corporate
ventures
d. Reduce the risk of currency
fluctuation
Q2. Functions of Treasury Department
a. Cash Management:
b. Currency Management:
c. Fund Management
d. Banking:
e. Corporate Finance
Q3. Various purposes of cash budgets
1. Plan for and control cash receipts
and payments.
2. Identifies the period(s) of shortage
of cash or an abnormally large cash
3. To take advantage like cash
discounts
4. Plan/arrange adequately needed
funds
Q4. Different Kinds of Float with
Reference to Management of Cash
1. Billing Float- The time between the
sale and the mailing of the invoice
2. Mail Float- time when a cheque is
being processed by post office
3. Cheque processing float- time
required for the seller to sort,
record and deposit the cheque
4. Bank processing float-time from
the deposit of cheque to crediting
of funds in the seller’s account
Q15. What is Concentration Banking?
1. Establishes a number of strategic
collection centres in different
regions instead of a single collection
2. Reduces the period between the
time a customer mails in his
remittances
3. Payments received by the different
collection centres are deposited
with their respective local banks ,
which in turn transfer to head
office.
Q16. Lock Box System
1. A lock box arrangement usually is on
regional basis which a company
chooses according to its billing
patterns.
2. Eliminate the time between the
receipts of remittances by the
company and deposited in the bank.
Q17. Virtual Banking & its advantages
Virtual banking refers to the provision
of banking and related services through
the use of information technology
Advantages:
a. Lower cost of handling a
transaction.
b. Increased speed
c. Lower cost of operating branch
d. Improved and a range of services
e. Rapid, accurate and convenient.
Q18. Three principles relating to
selection of marketable securities
a. Safety:
b. Maturity:
c. Marketability:
Chapter 2 Types of Financing Page No. 2.9
CA ADITYA SHARMA 7887 7887 07 V Smart Academy
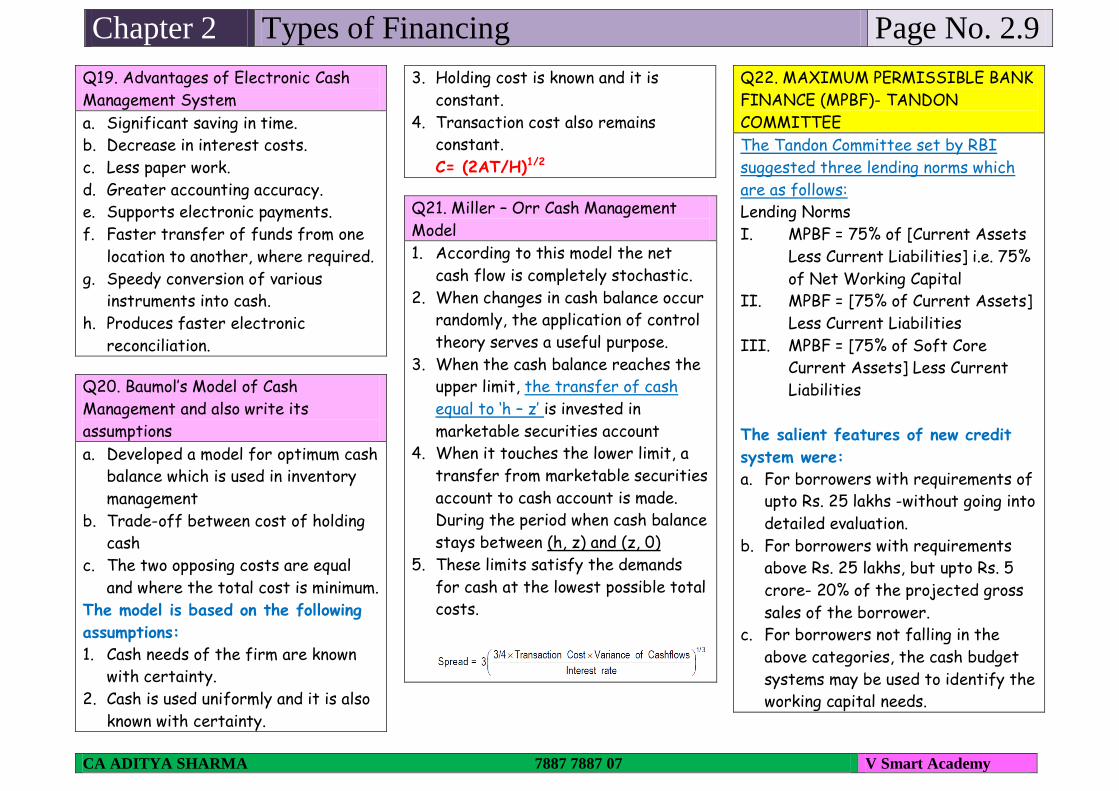
Q19. Advantages of Electronic Cash
Management System
a. Significant saving in time.
b. Decrease in interest costs.
c. Less paper work.
d. Greater accounting accuracy.
e. Supports electronic payments.
f. Faster transfer of funds from one
location to another, where required.
g. Speedy conversion of various
instruments into cash.
h. Produces faster electronic
reconciliation.
Q20. Baumol’s Model of Cash
Management and also write its
assumptions
a. Developed a model for optimum cash
balance which is used in inventory
management
b. Trade-off between cost of holding
cash
c. The two opposing costs are equal
and where the total cost is minimum.
The model is based on the following
assumptions:
1. Cash needs of the firm are known
with certainty.
2. Cash is used uniformly and it is also
known with certainty.
3. Holding cost is known and it is
constant.
4. Transaction cost also remains
constant.
C= (2AT/H)1/2
Q21. Miller – Orr Cash Management
Model
1. According to this model the net
cash flow is completely stochastic.
2. When changes in cash balance occur
randomly, the application of control
theory serves a useful purpose.
3. When the cash balance reaches the
upper limit, the transfer of cash
equal to ‘h – z’ is invested in
marketable securities account
4. When it touches the lower limit, a
transfer from marketable securities
account to cash account is made.
During the period when cash balance
stays between (h, z) and (z, 0)
5. These limits satisfy the demands
for cash at the lowest possible total
costs.
Q22. MAXIMUM PERMISSIBLE BANK
FINANCE (MPBF)- TANDON
COMMITTEE
The Tandon Committee set by RBI
suggested three lending norms which
are as follows:
Lending Norms
I. MPBF = 75% of [Current Assets
Less Current Liabilities] i.e. 75%
of Net Working Capital
II. MPBF = [75% of Current Assets]
Less Current Liabilities
III. MPBF = [75% of Soft Core
Current Assets] Less Current
Liabilities
The salient features of new credit
system were:
a. For borrowers with requirements of
upto Rs. 25 lakhs -without going into
detailed evaluation.
b. For borrowers with requirements
above Rs. 25 lakhs, but upto Rs. 5
crore- 20% of the projected gross
sales of the borrower.
c. For borrowers not falling in the
above categories, the cash budget
systems may be used to identify the
working capital needs.

Chapter 3 Ratio Analysis Page No. 3.1
1 a. Current ratio
b. Working capital ratio
c. Solvency ratio
Current Assets
Current liabilities
2 a. Quick ratio
b. Acid ratio
c. Liquid ratio
Quick Assets
Current Liabilities
3 Net Working Capital ratio Current assets- Current liabilities
4 a. Absolute cash Ratio
b. Absolute Liquidity ratio
Cash and Bank Balance +
Marketable securities
Current liabilities
5 a. Basic defense
b. Interval measure
Cash and Bank Balance +
Marketable securities
Operating expense/ Number of
days
Current Assets- Inventories + Sundry Debtors + Cash and Bank
Balances + Receivables/ Accruals + Loans and Advances + Disposable
Investments + Any other current assets.
Current Liabilities- Creditors for goods and services + Short-term
Loans +Bank Overdraft + Cash Credit + Outstanding Expenses +
Provision for Taxation + Proposed Dividend + Unclaimed Dividend +
Any other current liabilities
Quick Assets -Current Assets - Inventories – Prepaid expenses
6 Interest coverage ratio EBIT
Interest
7 Preference dividend
coverage ratio
Earnings after tax or Net profit
Preference dividend liability
8 EQUITY RATIO Shareholder’s equity
Capital employed
9 DEBT RATIO Total long term liability
Total Capital
10 DEBT TO EQUITY RATIO Total long term liability
Share Holder’s Equity
11 DEBT TO TOTAL ASSETS
RATIO
Total long Term debt
Total Assets
12 CAPITAL GEARING RATIO Preference share capital+
Debentures+ other borrowed funds
Equity share capital+ R&S – Losses
13 PROPRIETARY RATIO Proprietary Assets
Total Assets
1) Shareholder’s equity = Equity share capital + preference share
capital+ Reserves and surplus- Fictitious assets
2) Shareholder’s equity is also known as NET WORTH or NET
Assets
3) Proprietary assets = Eq. share capital+ pref. share cap+ R&S-
losses- Fictitious assets
4) Total Long term fund = Total Assets- Current liability
5) Net Worth= Total Assets- Current liability- Long Term Liablity
14 Total Assets turnover ratio Sales
Total assets
15 Fixed asset Turnover ratio Sales
Fixed assets
16 Capital T/O ratio Sales
Net assets
17 Current Asset T/O ratio Sales
Current assets
18 Working capital turnover
ratio
Sales
Working capital
19 Inventory T/O ratio COGS
Average Inventory
Average inventory =
(Op. stock + Cl. Stock)/2
Or
Sales
Average Inventory

Chapter 3 Ratio Analysis Page No. 3.2
20 Debtor T/O ratio Credit sales
Average Account receivable
21 Debtor velocity ratio Average account receivables
Average daily credit sales
or
360days/52 weeks/ 12 months
Debtor turnover ratio
22 Payable T/O ratio Annual Credit purchase
Average Account payable
23 Creditor/ payable velocity
ratio
Average account payable
Average daily credit purchase
or
360days/52 weeks/ 12 months
Creditor turnover ratio
24 Gross Profit ratio Gross Profit
Sales
25 Net Profit ratio Net Profit
Sales
26 Operating profit ratio Operating Profit / Sales
27 Expense ratio-
Cost of goods sold ratio
Cost of goods sold
Sales
28 Expense ratio-
Operating EXPENSE ratio
admin + Selling and distribution
OHDS
Sales
29 Expense ratio-
Operating ratio
COGS+ Operating. Expense
Sales
30 Expense ratio-
Financial expense ratio
Financial expense
Sales
31 Return on investment (ROI) Return/ Profit/ Earnings
Investment
32 Return on assets (ROA) EBIT (1- tax)
Average Total assets
33 Return on capital employed
(ROCE) – pre tax
EBIT
Capital employed
34 Return on capital employed
(ROCE) – post tax
EBIT (1-tax)
Capital employed
35 Return on Equity EAT- Preference dividend
Net worth/ Equity shareholder’s
fund
36 Earnings Per share Net profit available to equity
shareholders
Number of equity shares
outstanding
37 Dividend per share Dividend paid to equity
shareholders
Number of equity shares
outstanding
38 Dividend payout ratio Dividend per share
Earnings per share
39 Price Earnings Ratio
P/E ratio
= Market Price per Share(MPS)
Earnings per Share(EPS)
40 Dividend Yield Dividend
Market price per share
41 Earnings Yield Earnings per share (EPS)
Market price per share (MPS)
RETURN ON EQUITY USING DU- PONT MODEL
= NET PROFIT MARGIN x ASSET TURNOVER RATIO x EQUITY
MULTIPLIER
Net Profit x Revenue x Total Assets
Revenue Total assets Net worth
Equity multiplier adds the leverage effects.

Chapter 4 Cost Of Capital Page No. 4.1
CA ADITYA SHARMA 7887 7887 07 V SMART ACADEMY
Particular Formula
Debt and term loan Cost of
redeemable debt
Interest (1-tax) + (RV- NP)/n
(RV+NP)/2
Cost of
Irredeemable
debt
Interest (1-tax)
Net proceed of the issue
Cost Of Term
Loan
Interest (1-t)
Cost of
redeemable debt With Capital Gain tax
– Special case
Interest (1-tax) + (RV- NP)/n (1-t)
(RV+NP)/2
CMP is to be used when question mentions the word
current Market price
Preference Share Cost of
redeemable
Preference Share
Preference Dividend + (RV- NP)/n
(RV+NP)/2
Cost of
Irredeemable
Preference Share
Preference dividend
Net proceed of the issue
CMP is to be used when question mentions the word
current Market price
Special Note:- In the above formulas, it is the
amount of interest and not the percentage of
interest
Equity Share capital As per Dividend
Price Approach-
with Zero Growth
Ke = D
P0
As per Dividend
Price Approach-
with Growth
Ke = D1 + g
P0
As per Dividend
Price Approach-
with Growth and
Flotation cost
Ke = D1 + g
P-F
As per Dividend
Price Approach-
with Growth and
Flotation cost in %
Ke= D1 +g
P0 (1-f)
As per Earning Price
Approach- with NO
Growth
Ke = E
P0
As per Earning Price
Approach- with
Growth
Ke = E1 + g
P0
CAPM Ke= Rf + (Rm-Rf) β.
Where, Rf = Risk Free rate
Rm= Market risk
(Rm-Rf) = risk premium
Retained Earnings
Cost of Retained
earnings
Ks= Ke

Chapter 4 Cost Of Capital Page No. 4.2
CA ADITYA SHARMA 7887 7887 07 V SMART ACADEMY
Cost of Retained
earnings- under
personal tax
Ks= Ke-tp
Or
Ke x (1-t) x (1-tp)
Growth formula Steps to be followed:
1. Take the number on your calculator
2. Press the root button 12 times
3. Subtract 1 from it
4. Divide by the root you wanted. If
suppose u wanted 5th root divide it
by 5
5. Add 1
6. Press ‘x’ ‘=’ 12 times
7. Subtract 1 and press 100
Growth formula-
Only for Gordon
Growth (g) = b x r
r = rate of return on the fund
b = earnings retention ratio/ rate
Weighted Average Cost of capital Book Value Weight Market Value Weight 1. Derived From Book
value
2. Retained earnings are
Available at Book value
3. Data is Available from
Balance sheet
1. Derived From values in
the market.
2. Can be calculated by
multiplying
number of securities x
price per security
3. Retained earnings are not
available directly. Rather
they are hidden in the
value of equity share
capital.
4. Thus we need to divide
the value of Equity in two
parts- Share capital and
reserve and surplus using
book value as weight
5. No of share x price
Equity Retained earnings
(Ke) (ks/Kr)
Using Book value as weight
Calculation of WACC using Book value
or Market Value as weight Particular Cost Capital Weight WACC
Equity Ke Xx W1 Ke x W1
Pref. sh. Kp Xx W2 Kp x W2
Ret. Eng. Kr or Ks Xx W3 Ks x W3
Debt Kd xx W4 Kd x W4
Ko = WACC
Note:
1. capital May be book value or Market value but will be
specified in question
2. Also, Note that a single table with 3 additional column
can be used to solve question with both Book value and
Market Value as weight

Chapter 5 Capital Structure Page No. 5.1
CA. Aditya Sharma 7887 7887 07 V Smart Academy
Very Important Formulas Formula
for Value
of Debt
Value of debt x Cost of debt = Coupon
(interest)
Or
Value of debt = Interest / cost of debt
Value of
equity
Value of Equity x cost of equity = EBT
(since under this assumption there is no
tax rate).
Or
Value of equity = EBT/ cost of equity
Value of
Firm
Value of the firm = Value of debt +
Value of equity
Or
Value of the firm = EBIT/WACC
These Formulas are used to find value of
the firm. All these 4 Formulas are to be
used simultaneously
EBIT Indifference
EBIT- I1 (1-t) –PD1 = EBIT- I2 (1-t) – PD2
E1 E2
Where I= Interest
PD = Preference dividend
E1 and E2 are no of equity shares
Financial
BEP
Interest + PD
(1-t)
Or,
(x- Int.) (1-t) - PD
Optimum
Capital
Structure
Where EPS under given plans is maximum
Capital Structure Theories
1. Net Income Approach (NI) Approach-
(Crux- WACC is affected by cap. Structure. Both Ke
and Kd remains constant) a) Kd = cost of debt
b) Ke is cost of equity
c) Cost of debt Kd is always less than Ke.
d) Kd and Ke remains constant at all the levels of debt- equity
mix.
e) This Theory suggests maximum use of cheaper fund, Debt
Traditional Approach (Crux- WACC is affected by cap. Structure. Both Ke and Kd
changes, with steeper rise in Ke, and thus WACC changes)
a) Cost of Debt Kd is always less than cost of equity Ke
b) Kd and Ke varies with the change in debt equity mix
c) Increase in cost of equity is steeper and higher that
increase in cost of debt
d) Thus the WACC is affected by change in capital structure
Indifference Approach
Net Operating Income Approach
(Crux- WACC is not affected by cap. Structure. Both
Ke and Kd changes but in opp. direction and thus
WACC remains constant) a. The market capitalizes the value of the firm as whole.
b. Thus the split between debt and equity is not important.
c. advantage of low cost debt is set off exactly by increase in
equity capitalization rate.
d. overall cost of capital (Ko) remains constant

Chapter 5 Capital Structure Page No. 5.2
CA. Aditya Sharma 7887 7887 07 V Smart Academy
Modigliani- Miller Approach (MM)
(Crux- WACC is not affected by cap. Structure. Both Ke
and Kd changes but in opp. direction and thus WACC
remains constant)
MM Approach is refinement of Net operating income approach.
The theory is same with some additional propositions.
MM approach – 1958 without tax
Propositions were derived by MM approach 1. Value of levered firm (Vg) = Value of unlevered firm (Vu).
2. Value of a firm = Net operating income (NOI)/ Ko
3. Ke = K0 + (K0 – Kd)x Debt/Equity
7 Steps in Calculation of MM Problems under
NO TAX approach
7 Steps in Calculation of MM Problems under
WITH TAX approach Step 1 Calculate/ Find EBIT Calculate/ Find EBIT
Step 2 Find the Value of Equity of Unlevered firm.
Veu= EAT ………...(EBT or EBIT, since no int and tax)
Ke
Find the Value of Equity of Unlevered firm.
Veu= EAT …………………….[ (where EAT= EBIT-int.) –tax]
Ke Step 3 Value of Equity of Unlevered firm =Value of
unlevered firm = Value of Levered firm
Ve = Vu Since in Ungeared firm there in no debt
Vf= Ve+Vd ……………(since no debt)
Value of Equity of Unlevered firm =Value of unlevered firm =
Veu = Vfu Since in Ungeared firm there in no debt
Vf= Ve+Vd ……………(since no debt)
Step 4 Find the value of geared firm
Vu = Vg …………………. As per NOI approach
Find the value of geared firm
Vg = Vu + Tb …………………. As per NOI approach
Tb = tax benefit = amount of debt x rate of tax Step 5 Vg= Vd+ Veg Vg= Vd+ Veg Step 6 Keg = EAT or EBT
Veg
Keg = EAT
Veg Step 7 Calculation of WACC
Kog = (Kd x Weight of debt) + (Ke x Weight of equity)
Calculation of WACC Kog = (Kd x Weight of debt) + (Ke x Weight of equity)
Note Be careful while calculating WACC under tax approach .You may mistakenly take Kd = Interest instead of
Kd= Interest (1-tax)

Chapter 6 Leverage Page No. 6.1
CA. Aditya Sharma 7887 7887 07 V Smart Academy
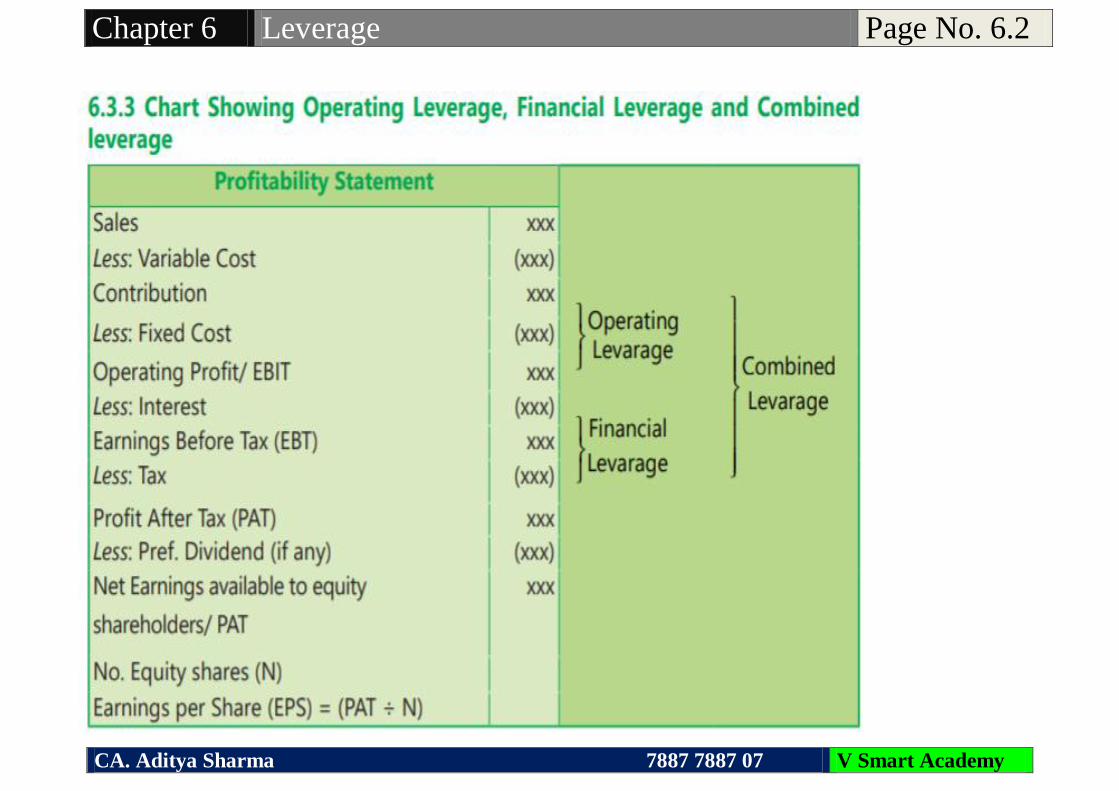
Chapter 6- Leverage
Particular Operating leverage
Or
Degree of Operating
leverage
or
DOL
Finance leverage
Or
Degree of Finance leverage
or
DFL
Combined leverage
Or
Degree of Combined
leverage
or
DCL
Advantage of
What?
Taking The Advantage of
Operational Fixed Cost
(Fixed cost)
Taking The Advantage of
Fixed Financial Obligation
(Interest and Preference
dividend)
Taking The Advantage of
both Operational Fixed
Cost and Fixed Financial
Obligation
What does it
signifies
Signifies that for every 1%
change in sale there will be
(1x OL)% change in EBIT
Signifies that for every 1%
change in EBIT there will be
(1x FL)% change in EPS
Signifies that for every
1% change in sale there
will be
(1x CL)% change in EPS
Formula No. 1 DOL = Contribution
EBIT
DFL = EBIT
EBT- PD
(1-t)
DCL = Contribution
EBT- PD
(1-t)
When to use the
formula?
When Data is given for Single years
Formula No. 2 DOL = % Change in EBIT
% Change in Sales
DFL = % Change in EPS
% Change in EBIT
DCL = % Change in EPP
% Change in Sales
When to use the
formula?
When Data of two years is Given
Chapter 6 Leverage Page No. 6.2
CA. Aditya Sharma 7887 7887 07 V Smart Academy

Chapter 7 Capital Budgeting Page No 7.1
CA Aditya Sharma 7887 7887 07 V Smart Academy
Particulars Payback period ARR or Average rate of return
or, Accounting rate of return
Reciprocal payback
Whether Discounting
or Non Discounting
Non Discounting Non Discounting Non Discounting
What does it signifies It is the time required to recover back
the principal amount invested
This method gives rate of return
of the project without
considering time value of Money.
This method use Profit after tax
and not cash flow for analysis
The reciprocal of the
payback would be a
close approximation
of the Internal Rate
of Return
Formula Max year of Insufficient recovery +
Balance Recovery
recovery in next year
ARR= Average PAT x 100
Average Investment
Or,
ARR= Average PAT x 100
Original Investment
Where average PAT =
Total PAT ÷ No. of years
Reciprocal payback=
1/ Payback Period
Steps Make table of-
1. Year, Cash Flow, Cumulative cash
flow.
2. Select the year till when the
investment is not recovered fully.
3. Then apply the formula
Calculate Average PAT
Calculate Average investment or
original Investment ( as the case
may be)
Apply the formula
Criteria of selection Project with lower payback is beneficial Higher ARR is Preferable Higher Reciprocal
Payback gives Higher
approximate Payback.
Precaution None ARR is to be calculated on PAT
and not cash flow
None
Reference with table
below
Refer Column – A,B and E Refer Cash Flow Format

Chapter 7 Capital Budgeting Page No 7.2
CA Aditya Sharma 7887 7887 07 V Smart Academy
Particulars Discounted Payback NPV Profitability Index
Whether Discounting
or Non Discounting
Discounting Discounting Discounting
What does it signifies It is the time required to recover back
the principal amount invested
considering the impact of Discounting
Signifies that how
much is the gain or loss
on the project after
considering TVM
Signifies how much is earned
for every rupee invested
Formula Max year of Insufficient recovery +
Balance Recovery
Discounted recovery in next year
PV of Inflow – PV of
outflow
= PV of Inflow
PV of Outflow
Steps Make table of-
1. Year, Cash Flow, PV factor, DCF,
CDCF Cumulative discounted cash
flow.
2. Select the year till when the
investment is not recovered fully.
3. Then apply the formula
Make Table-
1. Year, Cashflow,
PV factor, DCF
2. Make sum total
of PV of Inflows
3. Then apply the
formula
Make Table-
1. Year, Cashflow, PV
factor, DCF
2. Make sum total of PV
of Inflows
3. Take PV of Outflow
4. Then apply the formula
Criteria of selection Project with lower Discounted payback is
beneficial
Higher or Zero NPV will
lead to project
selection
Higher PI is selected
Precaution While applying the formula, consider
discounted cashflow column and not
cashflow column
None None
Reference with table
below
Refer Column – A,B, C, D and F Refer Column – A,B, C,
and D
Refer Column – A,B, C, and D
What about project
with unequal life
Equated annual Value
NPV ÷ PVAF ( of
two projects)

Chapter 7 Capital Budgeting Page No 7.3
CA Aditya Sharma 7887 7887 07 V Smart Academy
Particulars Internal Rate of Return (IRR) or Internal rate of return (ERR)
Whether Discounting
or Non Discounting
Discounting
What does it signifies Signifies that how much the PROJECT IS ACTUALLY EARNING
What happens at IRR 1. NPV= 0
2. Therefore, at IRR PV of Inflow = PV of Outflow
3. At IRR, Profitability Index (PI) = 1
Formula Lower rate + NPV of lower rate x (difference in rate)
Difference in NPV
Steps Make table of-
1. Year, Cash Flow, PV factor at 1st rate, DCF at 1st rate
and then PV factor at 2nd rate DCF using 2nd rate.
2. Then apply the formula
Criteria of selection Higher IRR
Precaution None
Reference with table
below
A, B, C, D and H
Table 1- calculation of Payback, Discounted Payback, NPV, IRR
Year Cash flow PV factor @10 % DCF CCF CDCF PV factor
@ y rate
DCF @ y%
A B C D E F G H
0 (xxxxx) 1 B x C 1 B x E
1 xxxxx 0.909 B x C Sum B Sum D 0.869 B x E
2 xxxxx 0.826 B x C Sum B Sum D 0.756 B x E
3 xxxxx 0.751 B x C Sum B Sum D 0.657 B x E
4 xxxxx 0.683 B x C Sum B Sum D 0.571 B x E
NPV XXXXXX NPV XXXXX
When the project is
discounted using Ko,
it gives PV of inflow.
When the project is
discounted using
IRR rate it gives PV
of Outflow.
PV of outflow is also
known as cost the
project
Chapter 8 Risk Analysis in Capital Budegting Page No. 1
CA Aditya Sharma 7887 7887 07 V Smart Academy
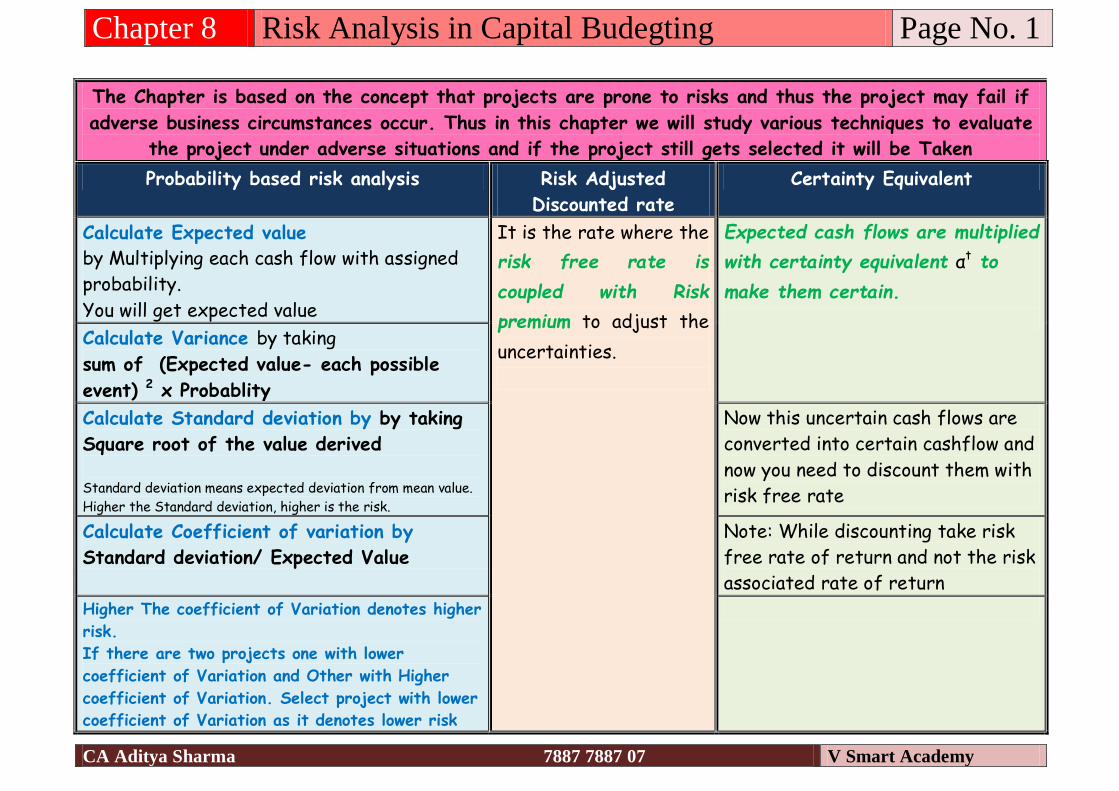
The Chapter is based on the concept that projects are prone to risks and thus the project may fail if
adverse business circumstances occur. Thus in this chapter we will study various techniques to evaluate
the project under adverse situations and if the project still gets selected it will be Taken
Probability based risk analysis Risk Adjusted
Discounted rate
Certainty Equivalent
Calculate Expected value
by Multiplying each cash flow with assigned
probability.
You will get expected value
It is the rate where the
risk free rate is
coupled with Risk
premium to adjust the
uncertainties.
Expected cash flows are multiplied
with certainty equivalent αt to
make them certain.
Calculate Variance by taking
sum of (Expected value- each possible
event) 2 x Probablity
Calculate Standard deviation by by taking
Square root of the value derived Standard deviation means expected deviation from mean value.
Higher the Standard deviation, higher is the risk.
Now this uncertain cash flows are
converted into certain cashflow and
now you need to discount them with
risk free rate
Calculate Coefficient of variation by
Standard deviation/ Expected Value
Note: While discounting take risk
free rate of return and not the risk
associated rate of return
Higher The coefficient of Variation denotes higher
risk.
If there are two projects one with lower
coefficient of Variation and Other with Higher
coefficient of Variation. Select project with lower
coefficient of Variation as it denotes lower risk
Chapter 8 Risk Analysis in Capital Budegting Page No. 2
CA Aditya Sharma 7887 7887 07 V Smart Academy
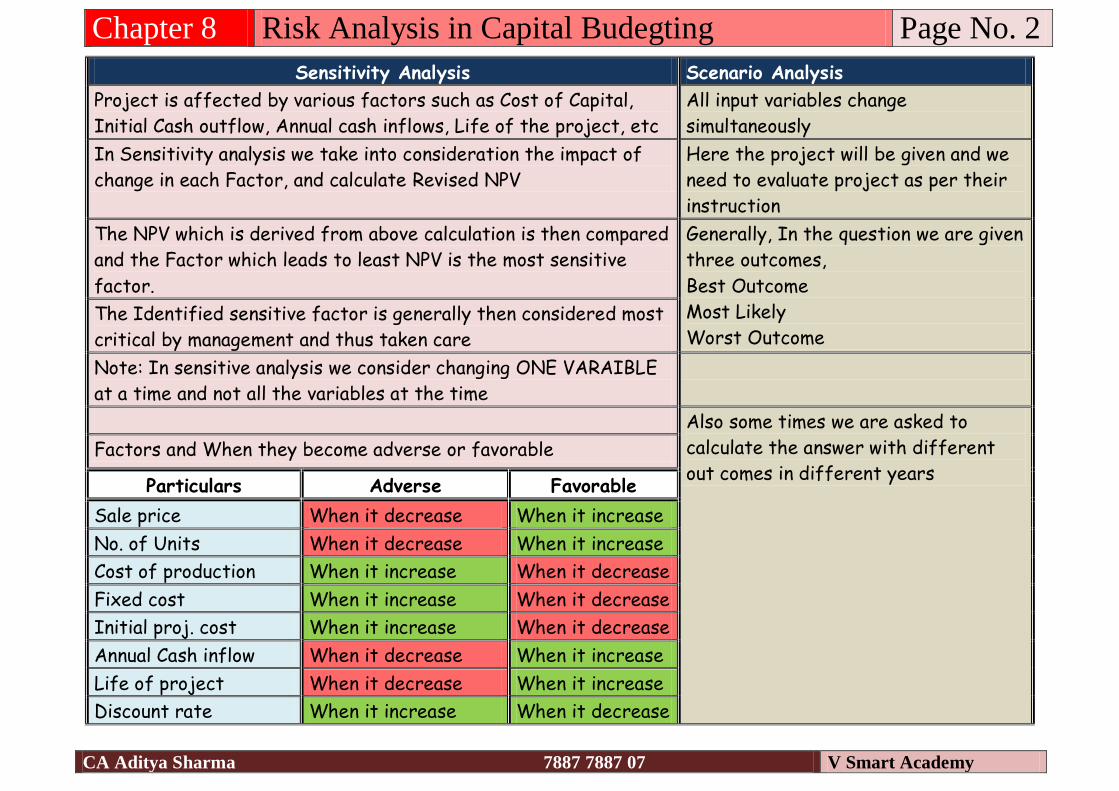
Sensitivity Analysis Scenario Analysis
Project is affected by various factors such as Cost of Capital,
Initial Cash outflow, Annual cash inflows, Life of the project, etc
All input variables change
simultaneously
In Sensitivity analysis we take into consideration the impact of
change in each Factor, and calculate Revised NPV
Here the project will be given and we
need to evaluate project as per their
instruction
The NPV which is derived from above calculation is then compared
and the Factor which leads to least NPV is the most sensitive
factor.
Generally, In the question we are given
three outcomes,
Best Outcome
Most Likely
Worst Outcome The Identified sensitive factor is generally then considered most
critical by management and thus taken care
Note: In sensitive analysis we consider changing ONE VARAIBLE
at a time and not all the variables at the time
Also some times we are asked to
calculate the answer with different
out comes in different years Factors and When they become adverse or favorable
Particulars Adverse Favorable
Sale price When it decrease When it increase
No. of Units When it decrease When it increase
Cost of production When it increase When it decrease
Fixed cost When it increase When it decrease
Initial proj. cost When it increase When it decrease
Annual Cash inflow When it decrease When it increase
Life of project When it decrease When it increase
Discount rate When it increase When it decrease

Chapter 9 Dividend Decision Page No. 9.1
CA Aditya Sharma 7887 7887 07 V Smart Academy
Particular Formula
Basic Formulas Earnings per share Net income (EATESH)
No. of Shares
Payout Ratio Dividend per share
Earning per share
Retention ratio 1 - Payout ratio
Or Retained earnings
Total Earnings
Dividend per share Total equity Dividend
No. of Share
Dividend rate Dividend per share
Face Value per share
Dividend Yield Dividend per share
Market Value per share
Growth (g) b x r
Where b = retention ratio and
r = rate of return on investment
********* 1/ PE ratio = Ke
MM Model – Most Important Approach says that the value of the firm is independent
of Dividend payout ratio.
Thus if the company pays 100% dividend or 0%, value of
the firm remains constant Step 1 calculate the share price, assuming no
dividend is paid
P0 = (P1+D1)
(1+Ke) Step 2- Calculate the number of shares required
= I-(E-D)n
(1+Ke) Step 3- Calculate the value of the firm
Vf= (∆n+n) P1 –I+E
(1+Ke)
1. Po = Current market price
2. P1= Expected market Price
3. D1= Expected dividend
4. Ke= Cost of equity
5. E= Earnings
6. N= original number of shares
7. ∆= additional ni. Of shares
8. I= Fixed investment
Repeat the same procedure when divided is paid
Chapter 9 Dividend Decision Page No. 9.2
CA Aditya Sharma 7887 7887 07 V Smart Academy
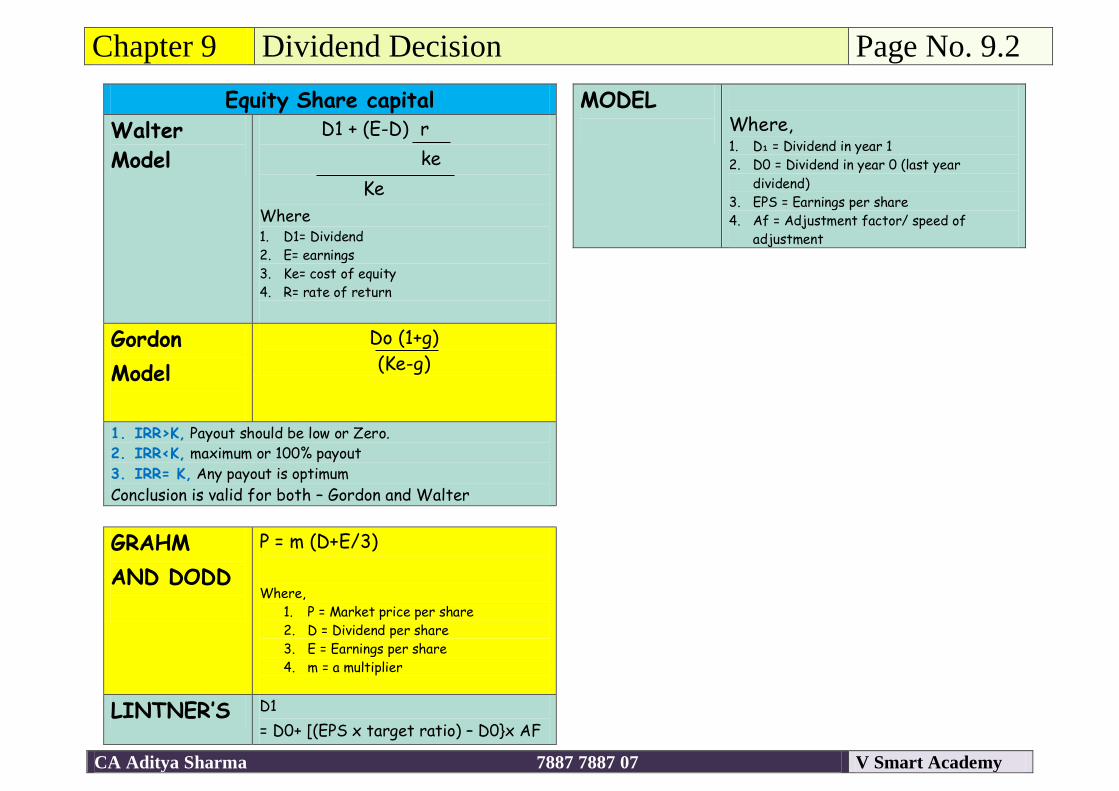
Equity Share capital
Walter
Model
D1 + (E-D) r
ke
Ke
Where 1. D1= Dividend
2. E= earnings
3. Ke= cost of equity
4. R= rate of return
Gordon
Model
Do (1+g)
(Ke-g)
1. IRR>K, Payout should be low or Zero.
2. IRR<K, maximum or 100% payout
3. IRR= K, Any payout is optimum
Conclusion is valid for both – Gordon and Walter
GRAHM
AND DODD
P = m (D+E/3)
Where,
1. P = Market price per share
2. D = Dividend per share
3. E = Earnings per share
4. m = a multiplier
LINTNER’S D1
= D0+ [(EPS x target ratio) – D0}x AF
MODEL
Where, 1. D₁ = Dividend in year 1
2. D0 = Dividend in year 0 (last year
dividend)
3. EPS = Earnings per share
4. Af = Adjustment factor/ speed of
adjustment

Chapter 10 Working Capital Management Page No. 10.1
Working Capital (WC) Gross Working
Capital
Current asset
Net Working
capital
Current Assets- Current Liabilities
Part A
Management of Working capital Method 1- Operating Cycle Method
What it
signifies?
1. It signifies the time required for
conversion of RM into WIP into FG into
Debtor and then back into cash
2. It gives the time required for
completion of one cycle and thus the
fund required for Working capital
Formula RM storage Period + WIP Holding
period+ FG storage period+ Debtors
collection period – Creditors credit
period allowed
R+W+F+D –C
How to
Calculate WC
requirement
1. Calculate Operating cycle
2. Calculate no. of cycle in one year
3. Divide annual operating expenditure .
. No of operating cycles
Formula for Calculation of Holding period
Raw material
storage
period
Average cost of stock of raw material
Average cost of raw material per day
365/ raw material turnover ratio
WIP holding
period
Average cost of stock of Work in progress
Average cost production per day
365/ WIP turnover ratio
FG holding
period
Average cost of stock of Finished goods
Average cost of goods sold per day
365/ FG turnover ratio
Debtors
Holding
period
Average accounts receivable
Average credit sales per day
365/ Debtor turnover ratio
Creditors
payment
period
Average accounts payable
Average credit purchase per day
365/ Creditors turnover ratio

Chapter 10 Working Capital Management Page No. 10.2
COST SHEET
For calculation of various wc requirement
Opening stock of Raw material
Add: purchase
Less Closing Stock
Raw Material consumed (Used for calculation of
RM requirement)
Add opening WIP
Direct manufacturing expense
Direct wages
Less closing WIP
Cost of production (Used for Calculation of
WIP requirement)
Add opening Stock of FG
Less Closing stock of FG
COGS (used for calculation of
FG)
Add Admin expense
Add S&D expense
Cost of sales
Method 2
Estimating WC requirement through
estimation of each individual element
What does it signifies Requirement of WCM for each
individual element
Steps in this type of Questions
Step 1 Determine the elements of current assets and
current liabilities
Step 2 Determine the holding period and the units
Step 3 Determine the rate at which it should be value
– Refer table below
Step 4 Find out the amount of each item
Step 5 Ascertain the net working capital considering
cash balance, loans and advances etc.
Statement of WC requirement Current Assets Lead/lag Amount Total Inventory
- Raw Material
- Work in progress
- Finished goods
Receivable
- Trade debtors
- Bills
Minimum Cash balance Gross Working capital Current Liabilities:
- Trade Payables/
bills payable
- Wages Payables
- Payables for
overheads
Excess of Current Assets
over Current Liabilities
Add: Safety Margin Net Working Capital
[III + IV]
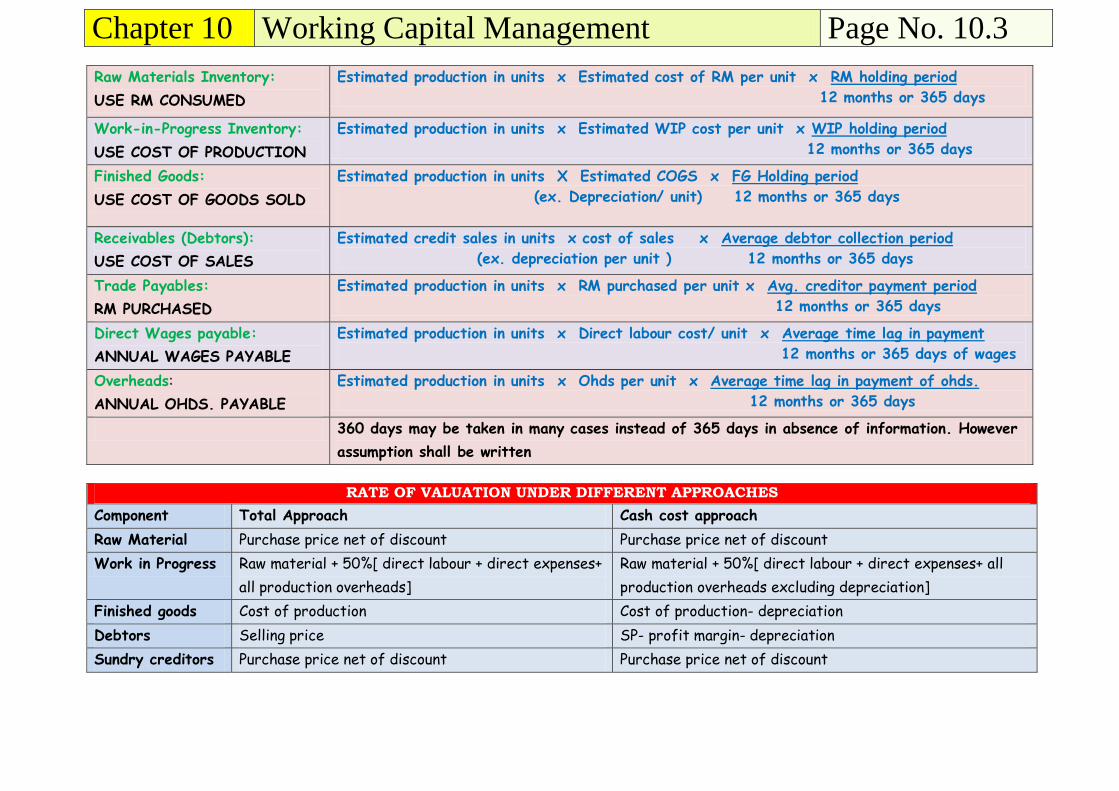
Chapter 10 Working Capital Management Page No. 10.3
Raw Materials Inventory:
USE RM CONSUMED
Estimated production in units x Estimated cost of RM per unit x RM holding period
12 months or 365 days
Work-in-Progress Inventory:
USE COST OF PRODUCTION
Estimated production in units x Estimated WIP cost per unit x WIP holding period
12 months or 365 days
Finished Goods:
USE COST OF GOODS SOLD
Estimated production in units X Estimated COGS x FG Holding period
(ex. Depreciation/ unit) 12 months or 365 days
Receivables (Debtors):
USE COST OF SALES
Estimated credit sales in units x cost of sales x Average debtor collection period
(ex. depreciation per unit ) 12 months or 365 days
Trade Payables:
RM PURCHASED
Estimated production in units x RM purchased per unit x Avg. creditor payment period
12 months or 365 days
Direct Wages payable:
ANNUAL WAGES PAYABLE
Estimated production in units x Direct labour cost/ unit x Average time lag in payment
12 months or 365 days of wages
Overheads:
ANNUAL OHDS. PAYABLE
Estimated production in units x Ohds per unit x Average time lag in payment of ohds.
12 months or 365 days
360 days may be taken in many cases instead of 365 days in absence of information. However
assumption shall be written
RATE OF VALUATION UNDER DIFFERENT APPROACHES
Component Total Approach Cash cost approach
Raw Material Purchase price net of discount Purchase price net of discount
Work in Progress Raw material + 50%[ direct labour + direct expenses+
all production overheads]
Raw material + 50%[ direct labour + direct expenses+ all
production overheads excluding depreciation]
Finished goods Cost of production Cost of production- depreciation
Debtors Selling price SP- profit margin- depreciation
Sundry creditors Purchase price net of discount Purchase price net of discount

Chapter 10 Working Capital Management Page No 10.4
Cash Management Format
Receipts: M1 M2 M3 M4 Mn
1. Opening balance
2. Collection from
debtors
3. Cash sales
4. Loans from banks
5. Share capital
6. Miscellaneous receipts
7. Other items
Total
Payments:
1. Payments to creditors
2. Wages
3. Overheads
4. Interest
5. Dividend
6. Corporate tax
7. Capital expenditure
8. Other items
Total
Closing balance
[Surplus (+)/Shortfall (-)]
Boumol Model Boumoul Model (2AT/H) 1/2
A = Annual Cash requirement
T= Transaction cost per
transaction
H= holding cost in %
Calculation of Interest
forgone
Op bal +Cl. Bal x Interest rate
2
Calculation of Conversion
cost
No. of Transaction x cost per
transaction
Total cost Transaction cost + interest cost
These Variety ofQuestions
are not generally asked in
exam

Chapter 10 Working Capital management - Receivable Page No. 10.5
CA Aditya Sharma 7887 7887 07 V Smart Academy
Evaluation of Credit Policy Particulars Present
Policy
Proposed
Policy I
Proposed
Policy II
Proposed
Policy
III
(Rs.) (Rs.) (Rs.) (Rs.)
A. Expected Profit:
(a) Credit Sales
(b) Total Cost other than
Bad Debts
(i) Variable Costs
(ii) Fixed Costs
(c) Bad Debts
(d) Cash discount
(e) Expected Net Profit
before Tax (a-b-c-d)
(f) Less: Tax
(g) Expected EAT
B. Opportunity Cost
of Investments in
Receivables locked up
in Collection Period
Net Benefits (A – B)
Ranking
Opportunity cost Total cost of Debtors x Interest x HP
. 365
For calculation of opp. Cost take cost of Drs. And not
sales unless data of sales in not is given
Format of Factoring
Particulars Amount
I Cost of In-house Debtors Management
a Administration cost (avoidable)
b Bad Debt
c Holding period (Refer note)
Total Cost (a+b + c ) XXX
II Cost of Factoring
a Total Annual Sales
b No of Debtors Cycle
360/ Drs holding period
c Credit sales/ cycle (a/b)
d Commission (% of c )
e Factor reserve (% of c)
f Amount forwarded [ c-d-e]
g Interest (% on f)
h Total cost per cycle (d+g)
i Total annual cost of Factoring (b x h) YYY
Total annual cost of Factoring YYY
Less Total In house management cost XXX
Additional cost of factoring ZZZ
Effective cost of factoring = Additional factoring
cost x amount forwarded per cycle x 100