chapter 10 global climate systems geosystems 5e an introduction to physical geography robert w....
TRANSCRIPT

Chapter 10Global Climate Systems
Geosystems 5eAn Introduction to Physical Geography
Robert W. ChristophersonCharlie Thomsen

Key Learning Concepts• After reading the chapter you should be able to:1. Define climate and climatology and explain the
difference between climate and weather.2. Review the role of temperature, precipitation, air
pressure, and air mass patterns used to establish climatic regions.
3. Review Köppen’s development of an empirical climate classification system and compare his with other ways of classifying climate.
4. Describe the A, C, D, and E climate classification categories and locate these regions on a world map.
5. Explain the precipitation and moisture efficiency criteria used to determine the B climates and locate them on a world map.
6. Outline future climate patterns from forecasts presented and explain the causes and potential consequences.

What is climate/climatology?
• Earth experiences an almost infinite variety of weather. Even the same location may go through periods of changing weather. This variability, when considered along with the average conditions at a place over time, constitutes climate. In a traditional frame work, early climatologists faced the challenge of identifying patterns as a basis for establishing climatic classifications. Currently at the forefront of scientific effort by climatologists are developing models that can simulate the vast interactions and causal relationships of the atmosphere and hydrosphere. Climatology, the study of climate, involves analysis of the patterns in time and space created by various physical factors in the environment.

How a climatic region synthesizes climate statistics.
• Weather observations, gathered simultaneously from different points within a region, are plotted on maps and are compared to identify climatic regions. The weather components that combine to produce climatic regions include insolation, temperature, humidity, seasonal precipitation, atmospheric pressure and winds, air masses, types of weather disturbances, and cloud coverage. Similar climatic regions experience many of the same weather components.
• This site for example (http://www.cru.uea.ac.uk) has weather statistics spanning centuries. Lastly, the Climatic Research Unit at the University of East Anglia, England has information about current weather, climatic research and links to other climate research facilities around the world.

How does the How does the El NiñoEl Niño phenomenon produce the largest phenomenon produce the largest interannual variability in climate? What are some of the interannual variability in climate? What are some of the changes and effects that occur world-wide?changes and effects that occur world-wide?
• Normally, as shown in the next slide, the region off the West coast of South America is dominated by the northward-flowing Peru Current. These cold waters move toward the equator and join the westward movement of the south equatorial current. The Peru current is part of the overall counter-clockwise circulation that normally guides the winds and surface ocean currents around the subtropical high-pressure cell dominating the eastern subtropical Pacific. Occasionally, and for unexplained reasons, pressure patterns alter and shift from their usual locations, thus affecting surface ocean currents and weather on both sides of the Pacific. Unusually high pressure develops in the western Pacific and lower pressure in the eastern Pacific. This regional change is an indication of large-scale ocean-atmosphere interactions. Trade winds normally moving from east to west weaken and can be replaced by an eastward (west-to-east) flow. Sea-surface temperatures off South America then rise above normal, sometimes becoming more than 8 C° (14 F°) warmer, replacing the normally cold, upwelling, nutrient-rich water along Peru's coastline.

El Niño wind and weather patterns across the Pacific Ocean and TOPEX/Poseidon satellite image for November 10, 1997 (white and
red colors indicate warmer surface water- a warm pool. (p. 279).

How do radiation receipts, temperature, air pressure inputs, and precipitation patterns interact to produce climate types? (Examples from a humid environment and from an arid environment.)
• Uneven insolation over Earth's surface, varying with latitude, is the energy input for the climate system. Daylength and temperature patterns vary diurnally (every day) and seasonally. The principal controls of temperature are latitude, altitude, land-water heating differences, and the amount and duration of cloud cover. The moisture input to climate is precipitation in the forms of rain, sleet, snow, and hail. Figure 10-2 (next slide) shows the worldwide distribution of precipitation and identifies several patterns.
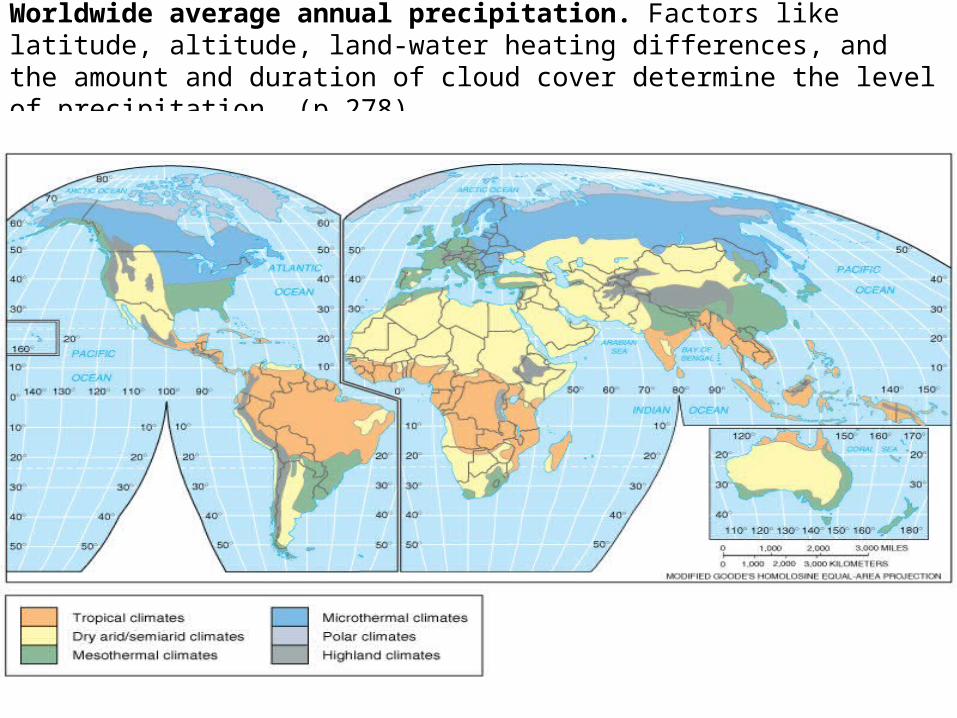
Worldwide average annual precipitation. Factors like latitude, altitude, land-water heating differences, and the amount and duration of cloud cover determine the level of precipitation. (p.278).

The relationships among a climatic region, ecosystem, and biome.
• One type of climatic analysis involves discerning areas of similar weather statistics and grouping these into climatic regions that contain characteristic weather patterns. Climate classifications are an effort to formalize these patterns and determine their related implications to humans. Interacting populations of plants and animals in an area forms a community. An ecosystem involves the interplay between a community of plants and animals and its abiotic physical environment. A biome is a large, stable terrestrial ecosystem.

What are the differences between a genetic and an empirical classification system?
• Classification is the process of ordering or grouping data or phenomena in related classes. A classification based on causative factors—for example, the genesis of climate based on the interaction of air masses–is called a genetic classification. An empirical classification is based on statistics or other data used to determine general categories. Climate Climate classifications based on temperature and classifications based on temperature and precipitation data are empirical classifications.precipitation data are empirical classifications.

Köppen's approach to climatic classification and the factors used in this system
• Wladimir Köppen (1846-1940), a German climatologist and botanist, designed the Köppen classification system, widely used for its ease of comprehension. First pub lished in stages, his classification began with an article on heat zones in 1884. By 1900, he was considering plant communities in his selection of some temperature criteria, using a world vegetation map prepared by French plant physiologist A. de Candolle in 1855. Letter symbols then were added to designate climate types. Later he reduced the role played by plants in setting boundaries and moved his system strictly toward climatological empiri cism. The first wall map showing world climates, co-authored with his student Rudolph Geiger, was introduced in 1928 and soon was widely used. The Köppen system is best viewed for what it is: a valuable tool for general understanding, best limited to small scale hemispheric and world maps showing general climatic relationships and patterns. Most criticism of his system stems from asking the classification model to do what it was not designed to do, that is, produce specific climatic descriptions for local areas.

The Thornthwaite system
• Some background on the Thornthwaite system:• The development of a simple method for the
determination of potential evapo-transpiration led Thornthwaite to his climate classification system. Thornthwaite was critical of Köppen's choice of criteria for his climatic boundaries, and especially, the boundaries between the humid and dry climates. Temperature efficiency and precipitation effectiveness were concepts contributed by Thornthwaite. His 1948 classification introduced a moisture index concept as a basis for classification. Thornthwaite's classification is marred only by its complexity and lack of widespread use. Otherwise, the system in several ways is more accurate than is the Köppen system in its depiction of the humid-dry boundaries, especially those in North America.

Thornthwaite Cont’d• The key to Thornthwaite's approach is that temperature
and precipitation alone are not the most active factors in the distribution of vegetation; rather, Thornthwaite regarded POTET (the amount of water needed for maximized plant growth) and its relation to precipitation and plant moisture needs as the critical factor. Whereas Köppen used average annual temperature and precipitation for the determination of a moisture index, Thornthwaite used POTET and established a moisture index based on calculations of water balance moisture surpluses and moisture deficits. The moisture index can range from +100 as a measure of the degree PRECIP exceeds POTET, to a low of –100, where no PRECIP is received. When the moisture index is at zero, it is at the midpoint along the boundary line between the humid and dry climates. Thornthwaite established five climate classifications: arid, semiarid, subhumid, humid, and perhumid.

The principal climate designations according to Köppen. In which one of these general types do you live? See next slide.
• Köppen Guidelines:• A Climate: Tropical Climates
• B Climate: Dry arid and semiarid climates.
• C Climate: Mesoothermal climates.
• D Climate: Microtheraml climates.
• E Climate: Polar climates.
• H Climate: Highland climate. Denotes cold climate due to elevation.

Tropical Climates (A)

Dry, Arid, and Semiarid Climates (B)

Mesothermal Climates (C)


Microthermal Climates (D)

Polar Climates (E)

Köppen Climate System (Fig. 10.5)
Figure 10.5

Example, characterizing the tropical A climates in terms of temperature, moisture,
and location.• The key temperature criterion for an A climate is that the
coolest month must be warmer than 18°C (64.4°F), making these climates truly winterless. The consistent daylength and almost perpendicular Sun angle throughout the year generates this warmth. Subdivisions of the A climates are based upon the distribution of precipitation during the year. Thus, in addition to consistent warmth, an Af climate (tropical rain forest climate) is constantly moist, with no month recording less than 6 cm (2.4 in.) of pre cipitation. Indeed, most stations in Af climates receive in excess of 250 cm (100 in.) of rainfall a year. Not surprisingly, the water balances in these regions exhibit enormous water surpluses, creating the world's largest stream dis charges in the Amazon and Congo (Zaire) Rivers.

Which of the major climate types occupies the most land and ocean area on Earth?
• In terms of total land and ocean area, tropical A climates are the most extensive, occupying about 36% of Earth's surface. The A climate classification extends along all equa torial latitudes, straddling the tropics from about 20° N to 20° S and stretching as far north as the tip of Florida and south-central Mexico, central India, and southeast Asia.

Mesothermal C climatesMesothermal C climates occupy the second-largest portion of Earth's entire surface. Description (temperature, moisture, and precipitation characteristics).
• The word mesothermal suggests warm and temperate conditions, with the coldest month averaging below 18°C (64.4°F) but with all months averaging above 0°C (32°F). The C climates, and nearby portions of the D climates, are regions of great weather variability, for these are the latitudes of greatest air-mass conflict. The C climatic region marks the beginning of true seasonality, with contrasts in temperature as evidenced by vegetation, soils, and human lifestyle adaptations. Subdivisions of the C classification are based on precipitation variability.

Explaining the distribution of the humid continental CfaCfa and Mediterranean dry-summer CsaCsa climates (part of the C mesothermal climate) at similar latitudes and the difference in precipitation patterns between the two types. Also, the difference in vegetation associated with these two climate types.
• Cfa climates are located in the eastern and east-central portions of the continents and are influenced during the summer by the maritime tropical air masses generated over warm coastal waters off eastern coasts. The warm, moist, unstable air forms convectional showers over land. In fall, winter, and spring, maritime tropical and continental polar air masses interact, generating frontal activity and frequent midlatitude cyclonic storms.

Cfa/Csa continued.
• Across the planet during summer months, shifting cells of subtropical high pressure block moisture-bearing winds from adjacent regions. As an example, in summer the continental tropical air mass over the Sahara in Africa shifts northward over the Mediterranean region and blocks maritime air masses and cyclonic systems. This shifting of stable, warm-to-hot, dry air over an area in summer and away from these regions in the winter creates a pronounced dry-summer and wet-winter pattern. The designation “s” (hence Csa) specifies that at least 70% of annual precipitation occurs during the winter months.

Which climates are characteristic of the Asian
monsoon region? • Cwa or C (mesothermal) w (winter dry) a (hot summer,
warmest month above 22°C) climates are related to the winter-dry, seasonal pulse of the monsoons and extend poleward from the Aw (tropical savanna) climates. Köppen identified the wettest Cwa summer month as receiving 10 times more precipitation than the driest winter month. Cherrapunji, India, receiving the most precipitation in a single year, is an extreme example of this classification. In that location the contrast between the dry and wet monsoons is most severe, ranging from dry winds in the winter to torrential rains and floods in the summer. Downstream from the Assam Hills, such heavy rains produced floods in Bangladesh in 1988 and 1991, among other years.

How can a marine west coast Cfb climate type can occur in the Appalachian region of the eastern United States?
• An interesting anomaly relative to the marine west coast climate occurs in the eastern United States. Increased elevation in portions of the Appalachian highlands moderates summer temperatures in the Cfa humid continental classification, producing a Cfb marine west coast designation. Vegetation similarities between the Appalachians and the Pacific Northwest are quite noticeable, enticing many emigrants who relocate from the East to settle in this climatically familiar environment in the west.

The climatic designation for the coldest places on Earth outside the poles. What do each of the letters in the Köppen classification indicate?
• The Dwc and Dwd microthermal subarctic climates occur only within Russia. Köppen selected the tertiary letter d for the intense cold of Siberia and north-central and eastern Asia; it designates a coldest month with an average temperature lower than –38°C (–36.4°F). A typical Dwd station is Verkhoyansk, Siberia. For four months of the year average temperatures fall below –34°C (–29.2°F). Verkhoyansk frequently reaches minimum winter temperatures that are lower than –68°C (–90°F). However, higher summer temperatures in the same area produce the world's greatest annual temperature range from winter to summer, a remarkable 63C° (113.4F°).
Global Warming• Significant climatic changes has occurred on Earth in the
past and most certainly will occur in the future. There is nothing society can do about long-term influences that cycle Earth through swings from ice ages to warmer periods. However, our global society must address short-term changes that are influencing global temperatures within the life span of present generations.
• Record-high global temperatures dominated the past two decades, records for both land and ocean and for both day and night. 1998 was the all-time record year for warmth, 2001 was second and eclipsed the previous records set in 1997 and 1995. Understanding the warming and all related impacts is an important applied topic of Earth systems science and the spatial analysis ability of physical geography. (Movie at the end of lecture).

Global Temperatures
Figure 10.28
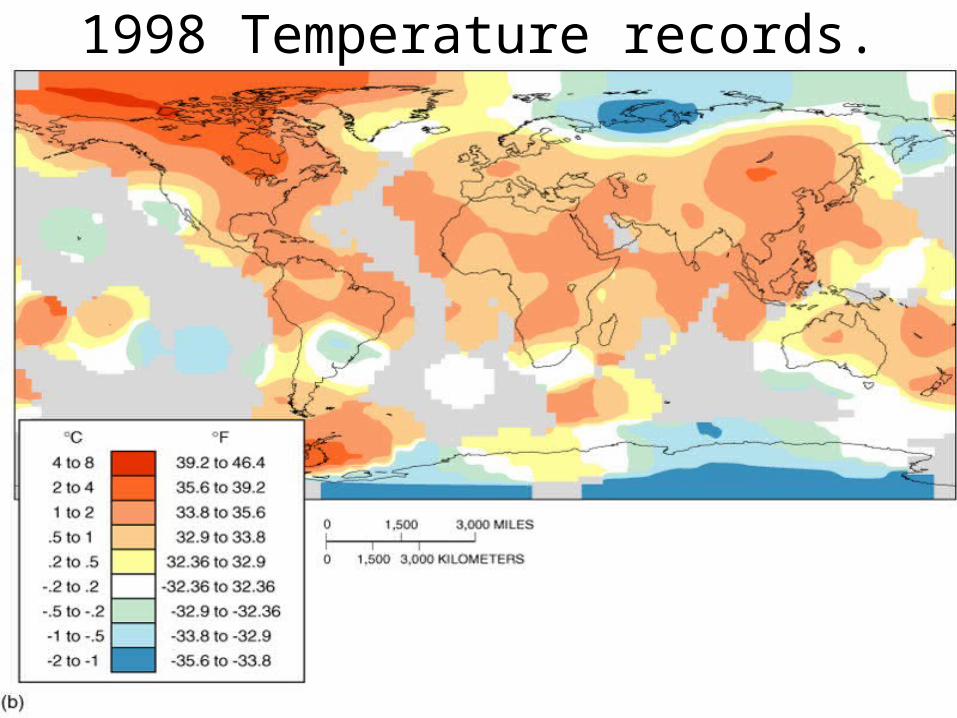
1998 Temperature records.

Carbon Dioxide Sources
Figure 10.29

July 2029 Temperature Forecast
Figure 10.31

Antarctic Peninsula Ice Disintegration
Figure 10.32

HealthWeather-related mortalityInfectious diseasesAir-quality respiratory illnesses
AgricultureCrop yieldsIrrigation demands
Water ResourcesChanges in water supplyWater qualityIncreased competition for water
Coastal AreasErosion of beachesInundation of coastal landsCosts to protect coastal communities
ForestsChange in forest compositionShift geographic range of forestsForest health and productivity
Species and Natural AreasShift in ecological zonesLoss of habitat and species
Potential Climate Change ImpactsPotential Climate Change Impacts
Climate Changes
Sea Level Rise
Temperature
Precipitation
Source: EPA

Global Warming Questions
• What is the potential climatic effects of global warming on polar and high-latitude regions. What are the implications of these climatic changes for persons living at lower latitudes?
Answers:• Perhaps the most pervasive climatic effect of increased
warming would be the rapid escalation of ice melt. The additional water, especially from continental ice masses that are grounded, would raise sea level worldwide. Scientists are currently studying the ice sheets of Greenland and Antarctica for possible changes in the operation of the hydrologic cycle, including snowlines and the rate at which icebergs break off (calve) into the sea. The key area being watched is the West Antarctic ice sheet, where the Ross Ice Shelf holds back vast grounded ice masses.
• Loss of polar ice mass, augmented by melting of alpine and mountain glaciers, will affect sea-level rise. A quick survey of world coastlines shows that even a moderate rise could bring change of unparalleled proportions. At stake are the river deltas, lowland coastal farming valleys, and low-lying mainland areas, all contending with high water, high tides, and higher storm surges. There will be both internal and international migration of affected populations, spread over decades, away from coastal flooding if sea levels continue to rise.

How is climatic change affecting agricultural and food production? Natural environments? Forests? The possible spread of disease?
• Modern single-crop agriculture is more delicate and susceptible to temperature change, water demand and irrigation needs, and soil chemistry than is traditional multicrop agriculture. Specifically, the southern and central grain-producing areas of North America are forecast to experience hot and dry weather by the middle of the next century as a result of higher temperatures. An increased probability of extreme heat waves is forecast for these U.S. grain regions. Also, available soil moisture is projected to be at least 10% less throughout the midlatitudes over the next 30 years than present levels. Scientists are considering changing to late-maturing, heat-resistant crop varieties and adjusting fertilizer applications and irrigation.
•

Cont’d
• Biosphere models predict that a global average of 30% of the present forest cover will undergo major species redistribution, the greatest change occurring in high latitudes. Many plant species are already "on the move" to more favorable locations. Land dwellers must also adapt to changing forage. Warming is already stressing some embryos as they reach their thermal limit. Particularly affected are amphibians, whose embryos develop in shallow water. The warming of large bodies of water may benefit some species, and harm others.
• Recent studies suggest that climate change may affect health on a global basis. Populations previously unaffected by malaria, schistosomiasis, sleeping sickness, and yellow fever would be at greater risk in subtropical and midlatitude areas.

What are the present actions being taken to delay the effects of global climate change? What is the Kyoto Protocol? The operation of the Conference of the Parties? What is the current status of the United States and Canadian government action on the Protocol?
• A product of the 1992 Earth Summit in Rio de Janeiro, the largest environmental gathering of countries ever, was the United Nations Framework Convention on Climate Convention (FCCC). The leading body of the Convention is the Conference of the Parties (COP) operated by the countries that ratified the FCCC, some 170 by 1998. Subsequent meetings were held in Berlin (COP-1, 1995) and Geneva (COP-2, 1996). These meetings set the stage for COP-3 in Kyoto, Japan, December 1997, where 10,000 participants adopted the Kyoto Protocol by consensus. The latest gatherings were COP-6 held in the Hague in late 2000 and COP-7 in Marrakech, Morocco, in 2001. Seventeen national academies of sciences endorsed the Kyoto Protocol. (For updates on the status of the Kyoto Protocol see http://www.unfccc.int/ resource/kpstats.pdf
•

Cont’d• The Protocol binds more developed countries to a collective 5.2%
reduction in greenhouse gas emissions as measured at 1990 levels for the period 2008 to 2012. Within this group goal, various countries promised cuts: U.S. 7% (the 105th Senate leadership announced they would not ratify the Protocol), Canada 6%, European Union 8%, Australia 8%, among many others. The Group of 77 countries plus China favor a 15% reduction by 2010.
• The Protocol is far-reaching in scope, including calling for international cooperation in meeting goals, technology development and transfers, leniency for less developed countries, “clean development” initiatives, and “emissions trading” schemes between industrialized countries and individual industries. The goal, simply and boldly stated is to “…prevent dangerous anthropogenic interference with the climate system.” In 2001 and 2002 the U.S. Administration abandoned the protocol process and the agreement reached at COP-7.
• This momentum lead to Earth Summit 2002 (http://www.earthsummit2002.orghttp://www.earthsummit2002.org/) in Johannesburg, South Africa, with an agenda including climate change, freshwater, gender issues, global public goods, HIV/AIDS, sustainable finance, and the five Rio Conventions.

Ten Steps to Reduce Your Global Warming Impact

• Individual choices can have an impact on global climate change. Reducing your family's heat-trapping emissions does not mean forgoing modern conveniences; it means making smart choices and using energy-efficient products, which may require an additional investment up front, but often pay you back in energy savings within a couple of years.
• Since Americans' per capita emissions of heat-trapping gases is 5.6 tons—more than double the amount of western Europeans—we can all make choices that will greatly reduce our families' global warming impact.

1. The car you drive: the most important personal climate decision.
• When you buy your next car, look for the one with the best fuel economy in its class. Each gallon of gas you use releases 25 pounds of heat-trapping carbon dioxide (CO2) into the atmosphere. Better gas mileage not only reduces global warming, but will also save you thousands of dollars at the pump over the life of the vehicle. Compare the fuel economy of the cars you're considering and look for new technologies like hybrid engines.

2. Choose clean power. • More than half the electricity in the United
States comes from polluting coal-fired power plants. And power plants are the single largest source of heat-trapping gas. None of us can live without electricity, but in some states, you can switch to electricity companies that provide 50 to 100 percent renewable energy.
•

3. Look for Energy Star. • When it comes time to replace appliances, look for
the Energy Star label on new appliances (refrigerators, freezers, furnaces, air conditioners, and water heaters use the most energy). These items may cost a bit more initially, but the energy savings will pay back the extra investment within a couple of years. Household energy savings really can make a difference: If each household in the United States replaced its existing appliances with the most efficient models available, we would save $15 billion in energy costs and eliminate 175 million tons of heat-trapping gases.

4. Unplug a freezer.
• One of the quickest ways to reduce your global warming impact is to unplug the extra refrigerator or freezer you rarely use (except when you need it for holidays and parties). This can reduce the typical family's carbon dioxide emissions by nearly 10 percent.

5. Get a home energy audit.
• Take advantage of the free home energy audits offered by many utilities. Simple measures, such as installing a programmable thermostat to replace your old dial unit or sealing and insulating heating and cooling ducts, can each reduce a typical family's carbon dioxide emissions by about 5 percent.

6. Light bulbs matter.• If every family in the United States
replaced one regular light bulb with an energy-saving model, we could reduce global warming pollution by more than 90 billion pounds, the same as taking 7.5 million cars off the road. So, replace your incandescent bulbs with more efficient compact fluorescents, which now come in all shapes and sizes. You'll be doing your share to cut back on heat-trapping pollution and you'll save money on your electric bills and light bulbs.

7. Think before you drive.
• If you own more than one vehicle, use the less fuel-efficient one only when you can fill it with passengers. Driving a full minivan may be kinder to the environment than two midsize cars. Whenever possible, join a carpool or take mass transit.

8. Buy good wood.
• When buying wood products, check for labels that indicate the source of the timber. Supporting forests that are managed in a sustainable fashion makes sense for biodiversity, and it may make sense for the climate too. Forests that are well managed are more likely to store carbon effectively because more trees are left standing and carbon-storing soils are less disturbed.

9. Plant a tree.
• You can also make a difference in your own backyard. Get a group in your neighborhood together and contact your local arborist or urban forester about planting trees on private property and public land. In addition to storing carbon, trees planted in and around urban areas and residences can provide much-needed shade in the summer, reducing energy bills and fossil fuel use.

10. Let policymakers know you are concerned about global warming.
• Our elected officials and business leaders need to hear from concerned citizens. Sign up for the Union of Concerned Scientists Action Network to ensure that policymakers get the timely, accurate information they need to make informed decisions about global warming solutions.
• http://www.ucsaction.org/join/index.asp

Movie: What’s Up With the Weather?
• A look at the greenhouse effect and global warming. Explores the question of whether or not the global climate is altered by human activity.
• NOVA C2000
• WGBH Television Station: Boston, Mass.