chapter 10 introduction to estimation sir naseer shahzada
TRANSCRIPT

Chapter 10
Introduction to EstimationSir Naseer Shahzada

Statistical Inference…
Statistical inference is the process by which we acquire information and draw conclusions about populations from samples.
In order to do inference, we require the skills and knowledge of descriptive statistics, probability distributions, and sampling distributions.
Parameter
Population
Sample
Statistic
Inference
Data
Statistics
Information

Estimation…
There are two types of inference: estimation and hypothesis testing; estimation is introduced first.
The objective of estimation is to determine the approximate value of a population parameter on the basis of a sample statistic.
E.g., the sample mean ( ) is employed to estimate the population mean ( ).

Estimation…
The objective of estimation is to determine the approximate value of a population parameter on the basis of a sample statistic.
There are two types of estimators:
Point Estimator
Interval Estimator

Point Estimator…
A point estimator draws inferences about a population by estimating the value of an unknown parameter using a single value or point.
We saw earlier that point probabilities in continuous distributions were virtually zero. Likewise, we’d expect that the point estimator gets closer to the parameter value with an increased sample size, but point estimators don’t reflect the effects of larger sample sizes. Hence we will employ the interval estimator to estimate population parameters…
Interval Estimator…
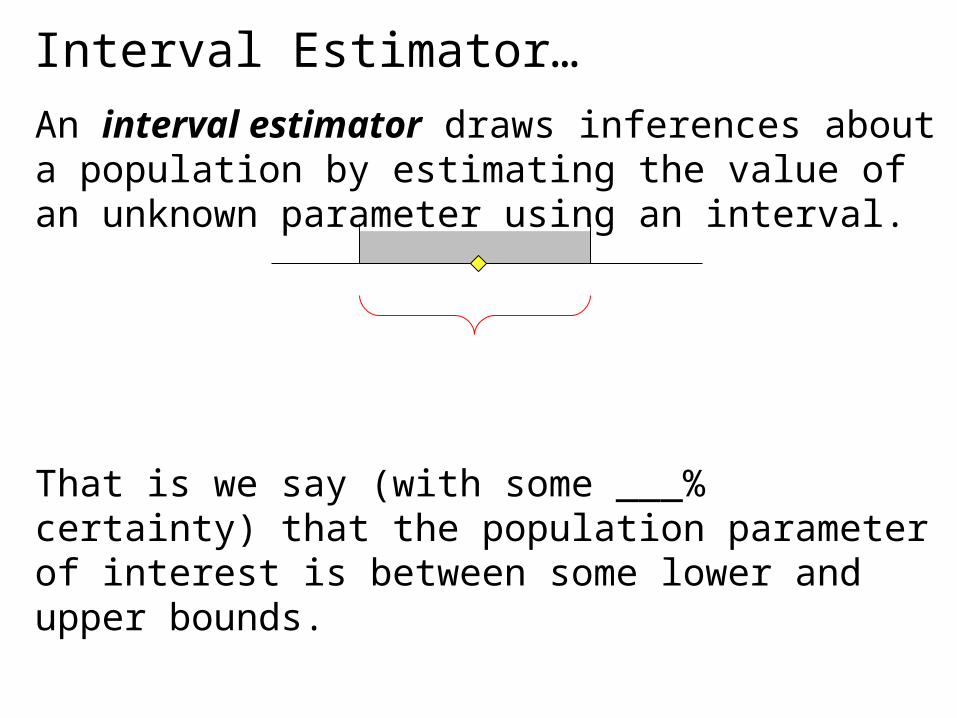
An interval estimator draws inferences about a population by estimating the value of an unknown parameter using an interval.
That is we say (with some ___% certainty) that the population parameter of interest is between some lower and upper bounds.

Point & Interval Estimation…
For example, suppose we want to estimate the mean summer income of a class of business students. For n=25 students,
is calculated to be 400 $/week.
point estimate interval estimate
An alternative statement is:
The mean income is between 380 and 420 $/week.

Qualities of Estimators…
Qualities desirable in estimators include unbiasedness, consistency, and relative efficiency:
• An unbiased estimator of a population parameter is an estimator whose expected value is equal to that parameter.
• An unbiased estimator is said to be consistent if the difference between the estimator and the parameter grows smaller as the sample size grows larger.
• If there are two unbiased estimators of a parameter, the one whose variance is smaller is said to be relatively efficient.

Unbiased Estimators…
An unbiased estimator of a population parameter is an estimator whose expected value is equal to that parameter.
E.g. the sample mean X is an unbiased estimator of the population mean , since:
E(X) =

Consistency…
An unbiased estimator is said to be consistent if the difference between the estimator and the parameter grows smaller as the sample size grows larger.
E.g. X is a consistent estimator of because:
V(X) is
That is, as n grows larger, the variance of X grows smaller.

Relative Efficiency…
If there are two unbiased estimators of a parameter, the one whose variance is smaller is said to be relatively efficient.
E.g. both the the sample median and sample mean are unbiased estimators of the population mean, however, the sample median has a greater variance than the sample mean, so we choose since it is relatively efficient when compared to the sample median.

Estimating when is known…
We can calculate an interval estimator from a sampling distribution, by:
Drawing a sample of size n from the population
Calculating its mean,
And, by the central limit theorem, we know that X is normally (or approximately normally) distributed so…
…will have a standard normal (or approximately normal) distribution.

Estimating when is known…
Looking at this in more detail…
Known, i.e. standard normal
distribution
Known, i.e. sample mean
Unknown, i.e. we want to estimate
the population mean
Known, i.e. the number of items
sampled
Known, i.e. its assumed we
know the population standard
deviation…

Estimating when is known…We established in Chapter 9:
Thus, the probability that the interval:
contains the population mean is 1– . This is a confidence interval estimator for .
the sample mean is in the center of
the interval…
the confidence interval

Confidence Interval Estimator for :
The probability 1– is called the confidence level.
lower confidence limit (LCL)
upper confidence limit (UCL)
Usually represented with a “plus/minus”
( ± ) sign

Graphically…
…here is the confidence interval for :
width

Graphically…
…the actual location of the population mean …
…may be here… …or here……or possibly even
here…
The population mean is a fixed but unknown quantity. Its incorrect to interpret the confidence interval estimate as a probability statement about . The interval acts as the
lower and upper limits of the interval estimate of the population mean.

Four commonly used confidence levels…Confidence Level
cut & keep handy!
Table 10.1

Example 10.1…
A computer company samples demand during lead time over 25 time periods:
Its is known that the standard deviation of demand over lead time is 75 computers. We want to estimate the mean demand over lead time with 95% confidence in order to set inventory levels…
235 374 309 499 253421 361 514 462 369394 439 348 344 330261 374 302 466 535386 316 296 332 334
Example 10.1…
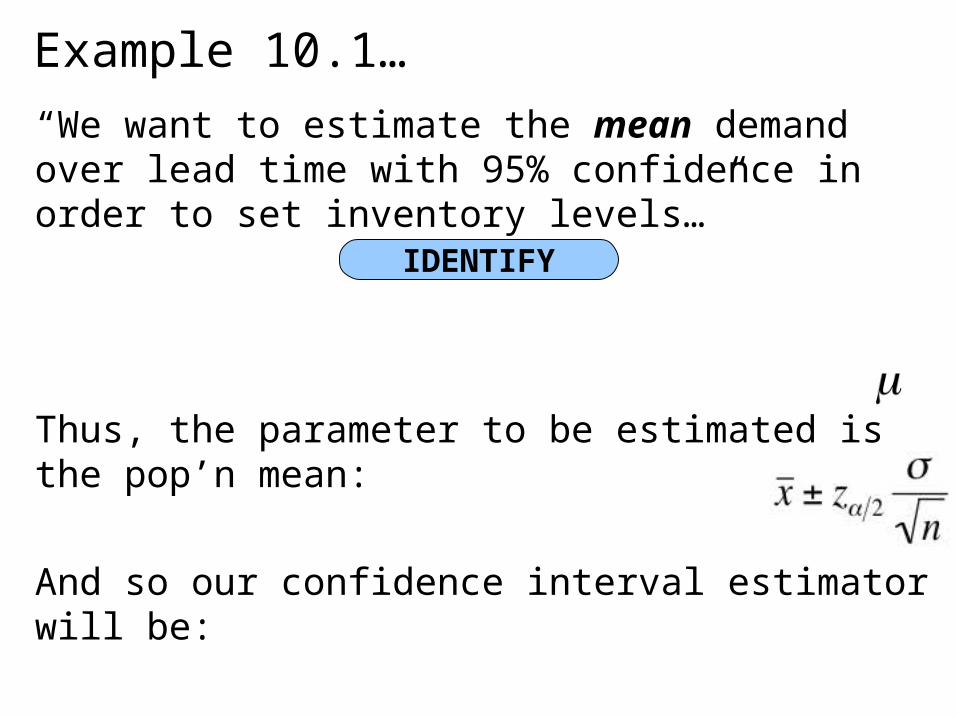
“We want to estimate the mean demand over lead time with 95% confidence in order to set inventory levels…”
Thus, the parameter to be estimated is the pop’n mean:
And so our confidence interval estimator will be:
IDENTIFY

Example 10.1…In order to use our confidence interval estimator, we need the following pieces of data:
therefore:
The lower and upper confidence limits are 340.76 and 399.56.
370.16
1.96
75
n 25 Given
Calculated from the data…
CALCULATE

Using Excel…
By using the Data Analysis Plus™ toolset, on the Xm10-01 spreadsheet, we get the same answer with less effort…
Tools > Data Analysis Plus > Z-Estimate: Mean
CALCULATE

Example 10.1…The estimation for the mean demand during lead time lies between 340.76 and 399.56 — we can use this as input in developing an inventory policy.
That is, we estimated that the mean demand during lead time falls between 340.76 and 399.56, and this type of estimator is correct 95% of the time. That also means that 5% of the time the estimator will be incorrect.
Incidentally, the media often refer to the 95% figure as “19 times out of 20,” which emphasizes the long-run aspect of the confidence level.
INTERPRET
Interval Width…
A wide interval provides little information.
For example, suppose we estimate with 95% confidence that an accountant’s average starting salary is between $15,000 and $100,000.
Contrast this with: a 95% confidence interval estimate of starting salaries between $42,000 and $45,000.
The second estimate is much narrower, providing accounting students more precise information about starting salaries.

Interval Width…
The width of the confidence interval estimate is a function of the confidence level, the population standard deviation, and the sample size…

Interval Width…
The width of the confidence interval estimate is a function of the confidence level, the population standard deviation, and the sample size…
A larger confidence level
produces a w i d e r
confidence interval:
Interval Width…
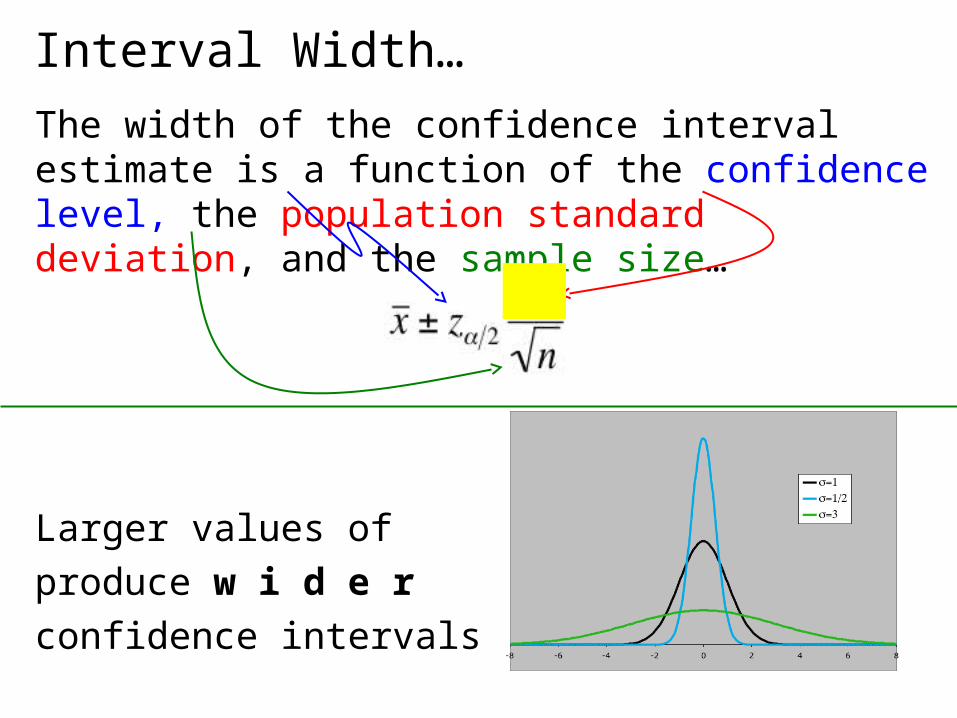
The width of the confidence interval estimate is a function of the confidence level, the population standard deviation, and the sample size…
Larger values of
produce w i d e r
confidence intervals

Interval Width…
The width of the confidence interval estimate is a function of the confidence level, the population standard deviation, and the sample size…
Increasing the sample size decreases the width of the confidence interval while the confidence level can remain unchanged.
Note: this also increases the cost of obtaining additional data

Selecting the Sample Size…
We can control the width of the interval by determining the sample size necessary to produce narrow intervals.
Suppose we want to estimate the mean demand “to within 5 units”; i.e. we want to the interval estimate to be:
Since:
It follows that
Solve for n to get requisite sample size!

Selecting the Sample Size…
Solving the equation…
that is, to produce a 95% confidence interval estimate of the mean (±5 units), we need to sample 865 lead time periods (vs. the 25 data points we have currently).

Sample Size to Estimate a Mean…
The general formula for the sample size needed to estimate a population mean with an interval estimate of:
Requires a sample size of at least this large:

Example 10.2…
A lumber company must estimate the mean diameter of trees to determine whether or not there is sufficient lumber to harvest an area of forest. They need to estimate this to within 1 inch at a confidence level of 99%. The tree diameters are normally distributed with a standard deviation of 6 inches.
How many trees need to be sampled?

Example 10.2…Things we know:
Confidence level = 99%, therefore =.01
We want , hence W=1.We are given that = 6.
1

Example 10.2…
We compute…
That is, we will need to sample at least 239 trees to have a
99% confidence interval of 1