chapter 10. stratospheric ozone - harvard...
TRANSCRIPT

162
CHAPTER 10. STRATOSPHERIC OZONE
The stratospheric ozone layer, centered at about 20 km above thesurface of the Earth (Figure 10-1), protects life on Earth byabsorbing UV radiation from the Sun. In this chapter we examinethe mechanisms controlling the abundance of ozone in thestratosphere and the effect of human influence.
Figure 10-1 The natural ozone layer: vertical and latitudinal distribution of theozone number density (10 12 molecules cm -3) at the equinox, based on
measurements taken in the 1960s. From Wayne, R.P., Chemistry of Atmospheres,Oxford, 1991.
10.1 CHAPMAN MECHANISM
The presence of a high-altitude ozone layer in the atmosphere wasfirst determined in the 1920s from observations of the solar UVspectrum. A theory for the origin of this ozone layer was proposedin 1930 by a British scientist, Sydney Chapman, and is known as theChapman mechanism. It lays the foundation for currentunderstanding of stratospheric ozone.
10.1.1 The mechanism
Chapman proposed that the ozone layer originates from thephotolysis of atmospheric O2. The bond energy of the O2 molecule
(498 kJ mol-1) corresponds to the energy of a 240 nm UV photon;
50
40
30
20
10
0—90 —75 —60 —45 —30 —15 0 15 30 45 60 90
AutumnLatitude
75
0.5
Spring
0.5
0.1
0.5
1
1
2
2
3
3
4
4
5
67
Alti
tude
(km
)

163
only photons of wavelengths less than 240 nm can photolyze the O2
molecule. Such high-energy photons are present in the solarspectrum at high altitude (Figure 10-2). Photolysis of O2 yields two
O atoms:
(R1)
where the O atoms are in the ground-level triplet state O(3P)(section 9.4) and are highly reactive due to their two unpairedelectrons. They combine rapidly with O2 to form ozone:
(R2)
where M is a third body (section 9.1.2).
Figure 10-2 Solar actinic flux at different altitudes, for typical atmosphericconditions and a 30 o solar zenith angle. From DeMore, W.B., et al., Chemical Kinetics
and Photochemical Data for Use in Stratospheric Modeling, JPL Publication 97-4, JetPropulsion Lab, Pasadena, CA, 1997.
O2 hν+ O O (λ < 240 nm)+→
O O2 M O3 M+→+ +
Wavelength (nm)
Act
inic
Flu
x (p
hoto
n cm
-2 s
-1 n
m-1
)
150109
1010
1011
1012
1013
1014
1015
200
20
30
40
50 km
0 km
20
30
250 300 350 400

164
The O3 molecules produced in reaction (R2) go on to photolyze.
Because the bonds in the O3 molecule are weaker than those in the
O2 molecule, photolysis is achieved with lower-energy photons:
(R3)
where O(1D) is the O atom in an excited singlet state (section 9.4)
and is rapidly stabilized to O(3P) by collision with N2 or O2. Note
that (R3) is not a terminal sink for O3 since the O atom product may
recombine with O2 by (R2) to regenerate O3. For O3 to actually be
lost the O atom must undergo another reaction, which in theChapman mechanism is
(R4)
10.1.2 Steady-state solution
A schematic for the Chapman mechanism is shown in Figure 10-3.Rate constants for reactions (R1)-(R4) have been measured in thelaboratory. Reactions (R2) and (R3) are found to be much fasterthan reactions (R1) and (R4), as might be expected from ourdiscussion above. We thus have a rapid cycle between O and O3 by
reactions (R2) and (R3), and a slower cycle between O2 and (O+O3)
by (R1) and (R4). Because of the rapid cycling between O and O3 it
is convenient to refer to the sum of the two as a chemical family, oddoxygen (Ox≡ O3 + O), which is produced by (R1) and consumed by
(R4).
Figure 10-3 The Chapman mechanism
O3 hν+ O2 O( D)1
(λ < 320 nm)+→
O( D)1 M O M+→+
Net: O3 hν+ O2 O+→
O3 O 2O2→+
Odd oxygenfamilyOx = O3+O2
3
4
1
slow
slow
fastO2 O O3

165
Simple relationships between O2, O, and O3 concentrations can be
derived from a chemical steady-state analysis of the Chapmanmechanism. As we saw in section 3.1.2, chemical steady state canbe assumed for a species if its production and loss rates remainroughly constant over its lifetime. We first examine if chemicalsteady state is applicable to the shortest-lived species in Figure10-3, the O atom. The lifetime τO of the O atom against conversion
to O3 by (R2) is
(10.1)
where we have used the low-pressure limit in the rate expressionfor (R2), as is appropriate for atmospheric conditions. In equation(10.1), [M] is the air number density na, and [O2] = CO2na where CO2= 0.21 mol/mol is the mixing ratio of O2. Thus:
(10.2)
All terms on the right-hand side of (10.2) are known. Substitutingnumerical values one finds that τO in the stratosphere is of the
order of seconds or less (problem 10. 2). Production and loss ratesof the O atom depend on the meteorological environment(pressure, temperature, radiation) and on the O3 abundance,
neither of which vary significantly over a time scale of seconds. Wecan therefore assume chemical steady state for O atoms betweenproduction by (R3) and loss by (R2), neglecting reactions (R1) and(R4) which are much slower:
(10.3)
Rearrangement of (10.3) yields
(10.4)
Substituting numerical values one finds [O]/[O3] << 1 throughout
the stratosphere (problem 10. 2). Observed concentrations (Figure
τOO[ ]
k2 O[ ] O2[ ] M[ ]-------------------------------------- 1
k2 O2[ ] M[ ]----------------------------= =
τO1
k2CO2na2
------------------------=
k2 O[ ] O2[ ] M[ ] k3 O3[ ]=
O[ ]O3[ ]
------------k3
k2CO2na2
------------------------=

166
10-4) obey closely this steady state.
Figure 10-4 Simultaneous measurements of O and O 3 concentrations in thestratosphere over Texas in December 1977. Adapted from R.P. Wayne, op. cit.
An important result of our steady-state analysis for the O atom isthat O3 is the main component of the Ox family: [Ox] = [O3} + [O] ≈[O3]. This result has two implications:
• The concentration of O3 is controlled by the slow production
and loss of Ox from reactions (R1) and (R4) rather than by the
fast production and loss of O3 from reactions (R2) and (R3);• The effective lifetime of O3 against chemical loss is defined by
the lifetime of Ox.
The lifetime of Ox is given by:
(10.5)
where we have included a factor of 2 in the denominator because(R4) consumes two Ox (one O3 and one O). The factor of 2 can be
derived formally from a mass balance equation for Ox as the sum of
the mass balance equations for O3 and O:
(10.6)
10728
30
32
34
36
38
40
42
108 109
Atomic oxygen, atoms cm-3
Ozone, molecules cm-3
Alti
tude
, km
1010
1013101210111010
O
O3
τOxOx[ ]
2k4 O[ ] O3[ ]------------------------------ 1
2k4 O[ ]------------------≈=
tdd Ox[ ]
tdd O3[ ] O[ ]+( )
tdd O3[ ]
tdd O[ ]+= =
rate(2) - rate(3) - rate(4)[ ] 2x rate(1) + rate(3) - rate(2) - rate(4)[ ]+=
2x rate(1) - 2x rate(4)=

167
Values of τOx computed from (10.5) range from less than a day in
the upper stratosphere to several years in the lower stratosphere,reflecting the abundance of O atoms (Figure 10-4, problem 10. 2).In the upper stratosphere at least, the lifetime of Ox is sufficiently
short that chemical steady state can be assumed to hold. Thissteady state is defined by
(10.7)
Substituting (10.4) into (10.7) yields as solution for [O3]:
(10.8)
The simplicity of equation (10.8) is deceiving. Calculating [O3]
from this equation is actually not straightforward because thephotolysis rate constants k1(z) and k3(z) at altitude z depend on the
local actinic flux Iλ(z), which is attenuated due to absorption of
radiation by the O2 and O3 columns overhead. From (9.13), the
general expression for a photolysis rate constant is
(10.9)
The actinic flux Iλ(z) at altitude z is attenuated relative to its value
Iλ,∞ at the top of the atmosphere by
(10.10)
where θ is the solar zenith angle, that is the angle between the Sunand the vertical (section 7.6), and δ is the optical depth of theatmosphere above z computed from (7.30):
(10.11)
2k1 O2[ ] 2k4 O[ ] O3[ ]=
O3[ ]k1k2
k3k4----------
12---
= CO2na
32---
k qX λ( )σX λ( )Iλ λdλ∫=
Iλ z( ) Iλ ∞, eδ
θcos------------–
=
δ σO2 O2[ ] σO3 O3[ ]+( ) z'dz
∞
∫=

168
10
20
3
4
5
AL
TIT
UD
E,
km
Values of Iλ at UV wavelengths decrease rapidly with decreasing
altitude in the stratosphere because of efficient absorption by O2
and O3 (Figure 10-2), and k1 and k3 decrease correspondingly
(Figure 10-5).
Figure 10-5 Chapman mechanism at low latitudes. Left panel: Lifetime of O x.Center panel: O 2 and O3 photolysis rate constants. Right panel: calculated and
observed vertical profiles of O 3 concentrations.
Since k1(z) and k3(z) depend on the O3 column overhead through
(10.9)-(10.11), equation (10.8) is not explicit for [O3] (the
right-hand-side depends on [O3]). Solution to (10.8) must be
obtained numerically by starting from the top of the atmospherewith Iλ = Iλ,∞ and [O3] = 0, and progressing downward by small
increments in the atmosphere, calculating Iλ(z) and the resulting
values of k1(z), k3(z), and [O3](z) as one penetrates in the
atmosphere.
The resulting solution (Figure 10-5, right panel) is able to explain atleast qualitatively the observed maximum of O3 concentrations at
20-30 km altitude. The maximum reflects largely the verticaldependence of Ox production by (R1), 2k1[O2], which we have seen
is the effective source for O3. The O2 number density decreases
exponentially with altitude following the barometric law, while k1decreases sharply with decreasing altitude due to absorption of UVradiation by O3 and O2. The product k1[O2] thus has a maximum
value at 20-30 km altitude. See problem 10. 1 for an analytical
105 107 109
0
0
0
1 day
1 month
1 year
τOx
10
20
30
40
50
10-14 10-12 10-10
k1, s-1
10-4 10-3 10-2
k3, s-1
k1k3
10
20
30
40
50
0 5 10
[O3], 1012 molecules cm-2 s-1
Chapman(steady state)
obs

169
derivation of this maximum.
Although the Chapman mechanism is successful in reproducingthe general shape of the O3 layer, it overestimates the observed O3
concentrations by a factor of 2 or more (Figure 10-5). In the lowerstratosphere, a steady state solution to the mechanism would notnecessarily be expected because of the long lifetime of Ox; there,
transport may play a dominant role in shaping the O3 distribution.
In the upper stratosphere, however, where the lifetime of Ox is
short, the discrepancy between theory and observations points to aflaw in the theory. Either the source of Ox in the Chapman
mechanism is too large, or the sink is too small. Considering thatthe source from (R1) is well constrained by spectroscopic data, thelogical conclusion is that there must be additional sinks for O3 not
accounted for by the Chapman mechanism. This flaw was notevident until the 1950s, because the relatively poor quality of thestratospheric ozone observations and the uncertainties on the rateconstants of reactions (R1)-(R4) could accommodate thediscrepancies between theory and observations. As theexperimental data base improved, however, the discrepancybecame clear.
10.2 CATALYTIC LOSS CYCLES
10.2.1 Hydrogen oxide radicals (HOx)
In the late 1950s it was discovered that catalytic cycles initiated byoxidation of water vapor could represent a significant sink for O3 in
the stratosphere. Water vapor is supplied to the stratosphere bytransport from the troposphere, and is also produced within thestratosphere by oxidation of CH4. Water vapor mixing ratios in the
stratosphere are relatively uniform, in the range 3-5 ppmv. In the
stratosphere, water vapor is oxidized by O(1D) produced from(R3):
(R5)
The high-energy O(1D) atoms are necessary to overcome thestability of the H2O molecule.
The hydroxyl radical OH produced by (R5) can react with O3,
producing the hydroperoxy radical HO2 which in turn reacts with
H2O O( D)1
+ 2OH→

170
O3:
(R6)
(R7)
We refer to the ensemble of OH and HO2 as the HOx chemical
family. The sequence of reactions (R6) and (R7) consumes O3 while
conserving HOx. Therefore HOx acts as a catalyst for O3 loss;
production of one HOx molecule by (R5) can result in the loss of a
large number of O3 molecules by cycling of HOx through (R6) and
(R7). Termination of the catalytic cycle requires loss of HOx by a
reaction such as
(R8)
The sequence (R5)-(R8) is a chain reaction for O3 loss in which (R5) is
the initiation step, (R6)-(R7) are the propagation steps, and (R8) is thetermination step. There are several variants to the HOx-catalyzed
mechanism, involving reactions other than (R6)-(R8); see problem10. 4. From knowledge of stratospheric water vapor concentrationsand rate constants for (R5)-(R8), and assuming chemical steadystate for the HOx radicals (a safe assumption in view of their short
lifetimes), one can calculate the O3 loss rate. Such calculations
conducted in the 1950s and 1960s found that HOx catalysis was a
significant O3 sink but not sufficient to reconcile the chemical
budget of O3. Nevertheless, the discovery of HOx catalysis
introduced the important new idea that species present at tracelevels in the stratosphere could trigger chain reactions destroyingO3. This concept was to find its crowning application in subsequent
work, as described below. Another key advance was theidentification of (R5) as a source for the OH radical, a strongoxidant. As we will see in chapter 11, oxidation by OH providesthe principal sink for a large number of species emitted in theatmosphere. Finally, recent work has shown that theHOx-catalyzed mechanism represents in fact the dominant sink of
O3 in the lowest part of the stratosphere (section 10.4).
10.2.2 Nitrogen oxide radicals (NOx)
The next breakthrough in our understanding of stratospheric O3
OH O3+ HO2→ O2+
HO2 O3+ OH→ 2O2+
Net: 2O3 3O2→
OH HO2+ H2O O2+→

171
came about in the late 1960s when the United States and othercountries considered the launch of a supersonic aircraft fleet flyingin the stratosphere. Atmospheric chemists were called upon toassess the effects of such a fleet on the O3 layer. An important
component of aircraft exhaust is nitric oxide (NO) formed byoxidation of atmospheric N2 at the high temperatures of the aircraft
engine. In the stratosphere NO reacts rapidly with O3 to produce
NO2, which then photolyzes:
(R9)
(R10)
(R2)
This cycling between NO and NO2 takes place on a time scale of
about one minute during daytime. It has no net effect on O3 and is
called a null cycle. It causes, however, rapid exchange between NOand NO2. We refer to the ensemble of NO and NO2 as a new
chemical family, NOx.
Further investigation of NOx chemistry in the stratosphere showed
that a fraction of the NO2 molecules produced by (R9) reacts with
oxygen atoms produced by (R3):
(R11)
The sequence of reactions (R9) and (R11) represents a catalytic cyclefor O3 loss with a net effect identical to (R4):
(R9)
(R11)
Each cycle consumes two Ox molecules, which is equivalent to two
O3 molecules (see section 10.1.2). The rate-limiting step in the cycle
is (R11) because NO2 has the option of either photolyzing (null
cycle) or reacting with O (O3 loss cycle). The O3 loss rate is
therefore given by
(10.12)
NO O3+ NO2 O2+→
NO2 hν NO O+→+
O O2 M O3 M+→+ +
NO2 O NO O2+→+
NO O3+ NO2 O2+→
NO2 O NO O2+→+
net: O3 O 2O2→+
tdd O3[ ]
tdd Ox[ ]–≈– 2k11 NO2[ ] O[ ]=

172
Termination of the catalytic cycle involves loss of NOx radicals. In
the daytime, NOx is oxidized to HNO3 by the strong radical
oxidant OH (section 10.2.1):
(R12)
At night OH is absent, because there is no O(1D) to oxidize H2O by
(R5). Loss of NOx at night takes place through the oxidation of
NO2 by O3 and subsequent conversion of the NO3 radical to N2O5:
(R13)
(R14)
This formation of N2O5 can take place only at night, because during
daytime NO3 is photolyzed back to NO2 on a time scale of a few
seconds:
(R15)
The products of NOx oxidation, HNO3 and N2O5, are non-radical
species and have therefore relatively long lifetimes againstchemical loss (weeks for HNO3, hours to days for N2O5). They are
eventually converted back to NOx:
(R16)
(R17)
(R15)
(R18)
and serve therefore as reservoirs for NOx. We refer to the ensemble
of NOx and its reservoirs as yet another chemical family, NOy.
Ultimate removal of NOy is by transport to the troposphere where
HNO3 is rapidly removed by deposition.
A diagram of the ensemble of processes is shown in Figure 10-6.The loss rate of O3 can be calculated from knowledge of the aircraft
emission rate of NO, the chemical cycling within the NOy family,
NO2 OH M HNO3→ M+ + +
NO2 O3+ NO3 O2+→
NO3 NO2 M N2O5→ M+ + +
NO3 hν NO2→ O+ +
HNO3 hν NO2 OH+→+
HNO3 OH+ NO3 H2O+→
NO3 hν NO2→ O+ +
N2O5 hν NO3→ NO2+ +

173
and the residence time of air (and therefore NOy) in the
stratosphere. Model calculations conducted in the 1970s found thatan aircraft fleet in the stratosphere would represent a serious threatto the O3 layer. This environmental concern, combined with
economic considerations, led to scrapping of the supersonic aircraftplan in the United States (the Europeans still built the Concorde).
Figure 10-6 Sources and sinks of stratospheric NO x and NOy. The directconversion of N 2O5 to HNO3 takes place in aerosols and will be discussed in
section 10.4.
The identification of a NOx-catalyzed mechanism for O3 loss turned
out to be a critical lead towards identifying the missing O3 sink in
the Chapman mechanism. Beyond the source from supersonicaircraft, could there be a natural source of NOx to the stratosphere?
Further work in the early 1970s showed that N2O, a low-yield
product of nitrification and denitrification processes in thebiosphere (section 6.3), provides such a source. N2O is a very
stable molecule which has no significant sinks in the troposphere.It is therefore transported to the stratosphere where it encounters
high concentrations of O(1D), allowing oxidation to NO by
(R19)
Reaction (R19) actually accounts for only about 5% of loss of N2O in
the stratosphere; the remaining 95% are converted to N2 by
photolysis and oxidation by O(1D) via an alternate branch. Theconversion to N2 is however of no interest for driving stratospheric
chemistry.
N2O5
HNO3
Tropopause
Biosphere
Deposition
NOyAircraft
NOx
NO2NON2O
N2O O( D)1
+ 2NO→

174
On the basis of Figure 10-6, we see that the loss rate of O3 by the
NOx-catalyzed mechanism can be calculated from knowledge of
the production and loss rates of NOy, and of the chemical cycling
within the NOy family. We examine now our ability to quantify
each of these terms:
• Production rate of NOy. In the natural stratosphere, NOy is
produced as NO from oxidation of N2O by O(1D). The
concentration of N2O in the stratosphere is readily measurable
by spectroscopic methods, and the concentration of O(1D) canbe calculated from chemical steady state by reaction (R3), sothat the source of NOy is well constrained.
• Loss rate of NOy. The dominant sink for NOy in the stratosphere
is transport to the troposphere followed by deposition. We sawin chapter 4 that the residence time of air (and hence of NOy) in
the stratosphere is 1-2 years. Thus the loss rate of NOy is
relatively well constrained, to within a factor of two.• Chemical cycling within the NOy family. The rate of O3 loss
depends on the fraction of NOy present as NOx, that is, the
NOx/NOy ratio. This ratio can be calculated from the rate
equations for the different components of the NOy family.
Under most conditions, chemical steady state between thedifferent NOy components is a good approximation.
We therefore have all the elements needed to calculate the O3 loss
rate from the NOx-catalyzed mechanism. When atmospheric
chemists did these calculations in the 1970s they found that theycould fully account for the missing sink of O3 in the Chapman
mechanism! Figure 10-7 shows results from such a calculationconstrained with simultaneous observations of NOy, O3, H2O, and
CH4 through the depth of the stratosphere. The Ox loss rates in this
calculation are computed on the basis of the gas-phase mechanismsdescribed above, and the resulting total Ox loss (solid line) is
compared to the source of Ox from photolysis of O2 (long dashes).
Results show a close balance between Ox production and loss, with
NOx catalysis providing the dominant sink in most of the
stratosphere. The budget of stratospheric O3 finally appeared to be
closed. Paul Crutzen received the 1995 Nobel Prize in Chemistryfor this work.

175
Figure 10-7 24-hour average rates of O x production and loss computed with agas-phase chemistry model constrained with simultaneous observations of O 3,H2O, CH4, NOy, and Cl y from the space shuttle. We will see in section 10.4 that
consideration of aerosol chemistry modifies greatly the model results in the lowerstratosphere. From McElroy, M.B., and R.J. Salawitch, Science 243, 763-770, 1989.
Ice core data show that atmospheric concentrations of N2O have
risen from 285 ppbv in the 18th century to 310 ppbv today, andpresent-day atmospheric observations indicate a growth rate of 0.3
% yr-1 (Figure 7-1). There is much interest in understanding thisrise because of the importance of N2O not only as a sink for
stratospheric O3 but also as a greenhouse gas (chapter 7). Table
10.1 gives current estimates of the sources and sinks of atmosphericN2O. Although the estimates can provide a balanced budget
within their ranges of uncertainty (atmospheric increase ≈ sources -sinks), the uncertainties are in fact large. Biogenic sources in thetropical continents, cultivated areas, and the oceans provide thedominant sources of N2O. The increase of N2O over the past
century is thought to be due principally to increasing use offertilizer for agriculture.
10420
30
40
50
105 106 107 108
Reaction rate (cm-3 s-1)
Alti
tude
(km
)Oxloss
O2+hν
NO2+O
O3+O
HOx
ClO+O

176
10.2.3 Chlorine radicals (ClOx)
In 1974, Mario Molina and Sherwood Rowland pointed out thepotential for O3 loss associated with rising atmospheric
concentrations of chlorofluorocarbons (CFCs). CFCs are not foundin nature; they were first manufactured for industrial purposes inthe 1930s and their use increased rapidly in the following decades.During the 1970s and 1980s, atmospheric concentrations of CFCs
rose by 2-4% yr-1 (Figure 7-1). CFC molecules are inert in thetroposphere; they are therefore transported to the stratosphere,where they photolyze to release Cl atoms. For example, in the caseof CF2Cl2 (known by the trade name CFC-12):
(R20)
The Cl atoms then trigger a catalytic loss mechanism for O3
involving cycling between Cl and ClO (the ClOx family). The
sequence is similar to that of the NOx-catalyzed mechanism:
Table 10-1 Present-day global budget of N2O
Rate, Tg N yr-1
best estimateand range of uncertainty
SOURCES, natural 9 (6-12)
Oceans 3 (1-5)
Tropical soils 4 (3-6)
Temperate soils 2 (0.6-4)
SOURCES, anthropogenic 6 (4-8)
Cultivated soils 4 (2-5)
Biomass burning 0.5 (0.2-1.0)
Chemical industry 1.3 (0.7-1.8)
Livestock 0.4 (0.2-0.5)
SINK Stratosphere 12 (9-16)
ATMOSPHERIC INCREASE 4
CF2Cl2 hν+ CF2Cl Cl+→

177
(R21)
(R22)
The rate-limiting step for O3 loss in this cycle is (R22) (see problem
10. 5), so that the O3 loss rate is
(10.13)
The catalytic cycle is terminated by conversion of ClOx to
non-radical chlorine reservoirs, HCl and ClNO3:
(R23)
(R24)
The lifetime of HCl is typically a few weeks and the lifetime ofClNO3 is of the order of a day. Eventually these reservoirs return
ClOx:
(R25)
(R26)
Figure 10-8 Sources and sinks of stratospheric ClO x and Cl y
Cl O3 ClO O2+→+
ClO O Cl O2+→+
net: O3 O 2O2→+
tdd O3[ ]
tdd Ox[ ]–=– 2k22 ClO[ ] O[ ]=
Cl CH4 HCl CH3+→+
ClO NO2 M ClNO3 M+→+ +
HCl OH Cl H2O+→+
ClNO3 hν+ Cl NO3+→
Tropopause
Industry
Deposition
ClOx
ClOClHalocarbons
HCl
ClNO3
Cly

178
We thus define a chemical family Cly as the sum of ClOx and its
reservoirs. A diagram of the ensemble of processes is shown inFigure 10-8. Note the similarity to Figure 10-6.
Similarly to the NOx-catalyzed mechanism, the rate of O3 loss by
the ClOx-catalyzed mechanism can be calculated from knowledge
of the concentrations of CFCs and other halocarbons in thestratosphere, the residence time of air in the stratosphere, and theClOx/Cly chemical partitioning. Molina and Rowland warned that
ClOx-catalyzed O3 loss would become a significant threat to the O3
layer as CFC concentrations continued to increase. Their warning,backed up over the next two decades by increasing experimentalevidence and compounded by the discovery of the antarctic ozonehole, led to a series of international agreements (beginning with theMontreal protocol in 1987) which eventually resulted in a total banon CFC production as of 1996. For this work they shared the 1995Nobel Prize in Chemistry with Paul Crutzen.
Figure 10-9 Historical trend in the total ozone column measured spectroscopicallyover Halley Bay, Antarctica in October, 1957-1992. One Dobson unit (DU)represents a 0.01 mm thick layer of ozone under standard conditions of
temperature and pressure; 1 DU = 2.69x10 16 molecules cm -2s-1. From: ScientificAssessment of Ozone Depletion: 1994, World Meteorological Organization (WMO),
Geneva,1995.
10.3 POLAR OZONE LOSS
In 1985, a team of scientists from the British Antarctic Surveyreported that springtime stratospheric O3 columns over their
°°°°
°°°°
°°°
°°°
°° °°° ° °
° °°°°
°
°
°°
° °°
°
°°
400
300
200
1955 1965 1975Year
Tota
l Ozo
ne (
Dob
son
Uni
ts)
1985 1995
October Monthly Averages

179
station at Halley Bay had decreased precipitously since the 1970s(Figure 10-9). The depletion was confined to the spring months(September-November); no depletion was observed in otherseasons. Global satellite data soon confirmed the Halley Bayobservations and showed that the depletion of stratospheric O3
extended over the totality of the antarctic vortex, a large circumpolarregion including most of the southern polar latitudes. Thedepletion of O3 has worsened since 1985, and springtime O3
columns over Antarctica today are less than half of what they werein the 1960s (Figure 10-9). Measured vertical profiles show that thedepletion of O3 is essentially total in the lowest region of the
stratosphere between 10 and 20 km (Figure 10-10), which normallywould contain most of the total O3 column in polar spring (Figure
10-1).
Figure 10-10 Vertical profiles of ozone over Antarctica measured by chemicalsondes. In August the ozone hole has not developed yet, while in October it is fully
developed. From Harris, N.R.P., et al., Ozone measurements, in WMO, op. cit..
Discovery of this “antarctic ozone hole” (as it was named in thepopular press) was a shock to atmospheric chemists, who thoughtby then that the factors controlling stratospheric O3 were relatively
well understood. The established mechanisms presented insections 10.1 and 10.2 could not explain the O3 depletion observed
17 – 26 AUG 93 272 ± 26 DU12 OCT 93 91 DU11 OCT 92 105 DU
O3 PARTIAL PRESSURE (mPa)
SOUTH POLE STATION
ALT
ITU
DE
(km
)
35
30
25
20
15
10
5
00 5 10 15 20

180
over Antarctica. Under the low light conditions in that region,concentrations of O atoms are very low, so that reactions (R11) and(R22) cannot operate at a significant rate. This severe failure oftheory sent atmospheric chemists scrambling to understand whatprocesses were missing from their understanding of stratosphericchemistry, and whether the appearance of the antarctic O3 hole
could be a bellwether of future catastrophic changes instratospheric O3 levels over other regions of the world.
10.3.1 Mechanism for ozone loss
Several aircraft missions were conducted in the late 1980s tounderstand the causes of the antarctic ozone depletion. Thesestudies found the depletion of O3 to be associated with
exceptionally high ClO, a result confirmed by satellite data.Parallel laboratory experiments showed that at such high ClOconcentrations, a new catalytic cycle involving self-reaction of ClOcould account for most of the observed O3 depletion:
(R27)
(R28)
(R29)
(R21)
The key behind discovery of this catalytic cycle was the laboratoryobservation that photolysis of the ClO dimer (ClOOCl) takes placeat the O-Cl bond rather than at the weaker O-O bond. It waspreviously expected that photolysis would take place at the O-Obond, regenerating ClO and leading to a null cycle. The rate of O3
loss in the catalytic cycle is found to be limited by (R27) and istherefore quadratic in [ClO]; it does not depend on the abundanceof O atoms, in contrast to the ClOx-catalyzed mechanism described
in the previous section.
Another catalytic cycle found to be important in the depletion of O3
during antarctic spring involves Br radicals produced in thestratosphere by photolysis and oxidation of anthropogenicBr-containing gases such as CH3Br (see problem 6. 4):
(R21)
ClO ClO M ClOOCl M+→+ +
ClOOCl hν ClOO Cl+→+
ClOO M Cl O2+→+
(2x) Cl O3 ClO O2+→+
net: 2O3 3O2→
Cl O3 ClO O2+→+

181
(R30)
(R31)
Again, this catalytic cycle is made significant by the highconcentrations of ClO over Antarctica. According to currentmodels, the ClO+ClO mechanism accounts for about 70% of totalO3 loss in the antarctic ozone hole; the remaining 30% is accounted
for by the BrO+ClO mechanism.
Why are ClO concentrations over Antarctica so high? Furtherresearch in the 1990s demonstrated the critical role of reactionstaking place in stratospheric aerosols at low temperature.Temperatures in the wintertime antarctic stratosphere aresufficiently cold to cause formation of persistent ice-like cloudscalled polar stratospheric clouds (PSCs) in the lower part of thestratosphere. The PSC particles provide surfaces for conversion ofthe ClOx reservoirs HCl and ClNO3 to Cl2, which then rapidly
photolyzes to produce ClOx:
(R32)
(R33)
Reaction (R32) is so fast that it can be regarded as quantitative;either ClNO3 or HCl is completely titrated. Whereas in most of the
stratosphere the ClOx/Cly molar ratio is less than 0.1, in the
antarctic vortex it exceeds 0.5 and can approach unity. Recentresearch indicates that (R32) proceeds rapidly not only on PSCsurfaces but also in the aqueous H2SO4 aerosols present
ubiquitously in the stratosphere (section 8.1) when thetemperatures fall to the values observed in antarctic winter (below200 K). Low temperature rather than the presence of PSCs appearsto be the critical factor for (R32) to take place. Nevertheless, as wewill see below, PSCs play a critical role in the development of theO3 hole by providing a mechanism for removal of HNO3 from the
stratosphere.
10.3.2 PSC formation
Because the stratosphere is extremely dry, condensation of watervapor to form ice clouds requires extremely low temperatures. Thestratospheric mixing ratio of water vapor is relatively uniform at
Br O3 BrO O2+→+
BrO ClO Br Cl O2+ +→+
ClNO3 HCl Cl2→ HNO3+ +PSC
Cl2 hν 2Cl→+

182
3-5 ppmv. In the lower stratosphere at 100 hPa (16 km altitude),
this mixing ratio corresponds to a water vapor pressure of 3-5x10⁻⁴
hPa. The frost point at that vapor pressure is 185-190 K; such lowtemperatures are almost never reached except in antarctic winter.When temperatures do fall below 190 K, PSCs are systematicallyobserved. Observations show however that PSCs start to form at ahigher temperature, about 197 K (Figure 10-11), and this highertemperature threshold for PSC formation is responsible for thelarge extent of the O3 hole.
Figure 10-11 Frequency distributions of temperature (total bars) and PSCoccurrence (shaded bars) in the winter lower stratosphere of each hemisphere at65o-80o latitude. Adapted from McCormick, M.P., et al., J. Atmos. Sci., 39, 1387, 1982.
Discovery of the antarctic ozone hole spurred intense research intothe thermodynamics of PSC formation. It was soon established thatthe stratosphere contains sufficiently high concentrations of HNO3
that solid HNO3-H2O phases may form at temperatures higher
than the frost point of water. These solid phases are:
• HNO3⋅3H2O - Nitric acid trihydrate (NAT)
• HNO3⋅2H2O - Nitric acid dihydrate (NAD)
• HNO3⋅H2O - Nitric acid monohydrate (NAM)
Figure 10-12 is a phase diagram for the binary HNO3-H2O system.
The diagram shows the thermodynamically stable phases of thesystem as a function of PHNO3 and PH2O. There are six different
phases in the diagram: NAT, NAD, NAM, H2O ice, liquid
HNO3-H2O solution, and gas. The presence of a gas phase is
implicit in the choice of PHNO3 and PH2O as coordinates. From the
phase rule, the number n of independent variables defining thethermodynamically stable phases(s) of the system is
< 185 190
0
20
40
60
80
100
120
195 200 205 210
NU
MB
ER
OF
OB
SE
RVA
TIO
NS
SOUTH
TEMPERATURE (K)
< 185 190
0
20
40
60
80
100
120
195 200 205 210
NU
MB
ER
OF
OB
SE
RVA
TIO
NS
NORTH
TEMPERATURE (K)

183
(10.14)
where c is the number of components of the system (here two:HNO3 and H2O), and p is the number of phases present at
equilibrium. Equilibrium of a PSC phase with the gas phase (p = 2)is defined by two independent variables (n = 2). If we are given theHNO3 and H2O vapor pressures (representing two independent
variables), then we can define unambiguously the composition ofthe thermodynamically stable PSC and the temperature at which itforms. That is the information given in Figure 10-12.
Figure 10-12 Phase diagram for the HNO 3-H2O system. The shaded area identifiestypical ranges of PHNO3 and PH2O in the lower stratosphere.
n c 2 p–+=
10-1
10-3
10-7
10-5
10-9
10-5 10-3 10-1 10
H2O Vapor Pressure (torr)
HN
O3
Vap
or
Pre
ssu
re (
torr
)
E
D230 K
220 K
210 K
A
B
H2OICE
HNO3 •2H2O
C
Q
HNO3 • H2OHNO
3 • 3H2 O
L I Q U I D
205 K
200 K
195 K
190K

184
The shaded region in Figure 10-12 indicates the typical ranges ofPHNO3 and PH2O in the lower stratosphere. We see that
condensation of NAT is possible at temperatures as high as 197 K,consistent with the PSC observations. It appears from Figure 10-12that NAT represents the principal form of PSCs; pure water icePSCs can also form under particularly cold conditions (problem 10.10). Recent investigations show that additional PSC phases form inthe ternary HNO3-H2SO4-H2O system.
10.3.3 Chronology of the ozone hole
Figure 10-13 Chronology of the antarctic ozone hole
The chronology of the antarctic ozone hole is illustrated in Figure10-13. It begins with the formation of the antarctic vortex in austral
MAY JUL SEP NOV
PSC formation
vortex formation
vortexbreakup
MAY JUL SEP NOV
MAY JUL SEP NOV
MAY JUL SEP NOV
HCl
ClNO3
Cl2 + ClO + Cl2O2
sedimentationof HNO3-containing
PSCs
Ozone
Ab
un
dan
ceA
bu
nd
an
ceA
bu
nd
an
ceT
em
pera
ture
HNO3

185
fall (May). As we saw in chapter 4, there is a strong westerlycirculation at southern midlatitudes resulting from the contrast inheating between the tropics and polar regions. Because of the lackof topography or land-ocean contrast to disturb the westerly flowat southern midlatitudes, little meridional transport takes place andthe antarctic atmosphere is effectively isolated from lower latitudes.This isolation is most pronounced during winter, when thelatitudinal heating gradient is strongest. The isolated antarctic airmass in winter is called the antarctic vortex because of the strongcircumpolar circulation.
By June, temperatures in the antarctic vortex have dropped tovalues sufficiently low for PSC formation. Reaction (R32) thenconverts HCl and ClNO3 to Cl2, which photolyzes to yield Cl
atoms. In the winter, however, loss of O3 is limited by the lack of
solar radiation to photolyze the ClOOCl dimer produced in (R27).Significant depletion of O3 begins only in September when
sufficient light is available for ClOOCl photolysis to take placerapidly.
By September, however, temperatures have risen sufficiently thatall PSCs have evaporated. One would then expect HNO3 in the
vortex to scavenge ClOx by
(R16)
followed by
(R24)
suppressing O3 loss. This removal of ClOx is found to be
inefficient, however, because observed HNO3 concentrations in the
springtime antarctic vortex are exceedingly low (Figure 10-13).Depletion of HNO3 from the antarctic stratosphere is caused by
sedimentation of HNO3-containing PSC particles over the course of
the winter; it is still not understood how the PSC particles grow tosufficiently large sizes to undergo sedimentation. Betterunderstanding of this sedimentation process is critical for assessingthe temporal extent of the antarctic ozone hole, and also forpredicting the possibility of similar O3 depletion taking place in the
arctic.
There is indeed much concern at present over the possibility of anO3 hole developing in the arctic. Temperatures in arctic winter
HNO3 hν NO2 OH+→+
ClO NO2 M ClNO3 M+→+ +

186
occasionally fall to values sufficiently low for PSCs to form and forHCl and ClNO3 to be converted to ClOx (Figure 10-11), but these
conditions are generally not persistent enough to allow removal ofHNO3 by PSC sedimentation. As a result, O3 depletion in arctic
spring is suppressed by (R16)+(R24). If extensive PSCsedimentation were to take place in arctic winter, one would expectthe subsequent development of a springtime arctic O3 hole.
Observations indicate that the arctic stratosphere has cooled inrecent years, and a strong correlation is found between this coolingand increased O3 depletion. One proposed explanation for the
cooling is increase in the concentrations of greenhouse gases.Greenhouse gases in the stratosphere have a net cooling effect (incontrast to the troposphere) because they radiate away the heatgenerated from the absorption of UV by O3. Continued cooling of
the arctic stratosphere over the next decades could possibly causethe development of an “arctic ozone hole” even as chlorine levelsdecrease due to the ban on CFCs. This situation is being closelywatched by atmospheric chemists.
10.4 AEROSOL CHEMISTRY
Another major challenge to our understanding of stratosphericchemistry emerged in the early 1990s when long-term observationsof O3 columns from satellites and ground stations revealed large
declines in O3 extending outside the polar regions. The
observations (Figure 10-14) indicate a ∼6% decrease from 1979 to
1995 in the global mean stratospheric O3 column at 60oS-60oN, with
most of the decrease taking place at midlatitudes.
Figure 10-14 Trend in the global ozone column at 60 oS-60oN for the 1979-1995period. From WMO, op. cit.
1980
0
-2
-4
-6
1982 1984 1986 1988 1990 1992 1994Year
Per
cent
Dev
iatio
n fr
om M
onth
ly A
vera
ge

187
This large decline of O3 was again a surprise. It was not forecast by
the standard gas-phase chemistry models based on the mechanisms
in section 10.2, which predicted only a ∼0.1% yr−1 decrease in theO3 column for the 1979-1995 period. The models also predicted
that most of the O3 loss would take place in the upper part of the
stratosphere, where CFCs photolyze, but observations show thatmost of the decrease in the O3 column actually has taken place in
the lowermost stratosphere below 20-km altitude (Figure 10-15).This severe failure of the models cannot be explained by the polarchemistry discussed in section 10.3 because temperatures atmidlatitudes are too high. Dilution of the antarctic ozone holewhen the polar vortex breaks up in summer is not a viableexplanation either because it would induce a seasonality andhemispheric asymmetry in the trend that is not seen in theobservations.
Figure 10-15 Vertical distribution of the O 3 trend at northern midlatitudes for theperiod 1980-1996: best estimate (solid line) and uncertainties (dashed lines).
Adapted from Scientific Assessment of Ozone Depletion: 1998, WMO. Geneva ,1999.
-15.0
10
20
30
Alti
tude
(km
)
40
50
-12.5 -10.0 -7.5 -5.0 -2.5 0.0 2.5 5.0
Trend (%/decade)
188
Recent research indicates that aerosol chemistry in the lowerstratosphere could provide at least a partial explanation for theobserved long-term trends of O3 at midlatitudes. Laboratory
experiments have shown that the aqueous H2SO4 aerosol
ubiquitously present in the lower stratosphere (section 8.1)provides a medium for the rapid hydrolysis of N2O5 to HNO3:
(R34)
From the standpoint of the NOx-catalyzed O3 loss mechanism
discussed in section 10.2.2, (R34) simply converts NOy from one
inactive reservoir form to the other. However, HNO3 is a
longer-lived reservoir than N2O5, so that conversion of N2O5 to
HNO3 slows down the regeneration of NOx and hence decreases
the NOx/NOy ratio. Although one might expect O3 loss to be
suppressed as a result, the actual picture is more complicated.Lower NOx concentrations slow down the deactivation of ClOx by
conversion to ClNO3 (R24), so that ClOx-catalyzed O3 loss
increases. Also, a fraction of HNO3 produced by (R34) eventually
photolyzes by (R16), and the sequence (R34)+(R16) provides asource of HOx that enhances the HOx-catalyzed O3 loss discussed
in section 10.2.1.
When all these processes are considered, one finds in modelcalculations that (R34) has little net effect on the overall rate of O3
loss in the lower stratosphere, because the slow-down of theNOx-catalyzed loss is balanced by the speed-up of the HOx- and
ClOx-catalyzed losses; in this manner, the gas-phase models of the
1980s were lulled into a false sense of comfort by their ability tobalance Ox production and loss (Figure 10-7). The occurrence of
(R34) implies a much larger sensitivity of O3 to chlorine levels,
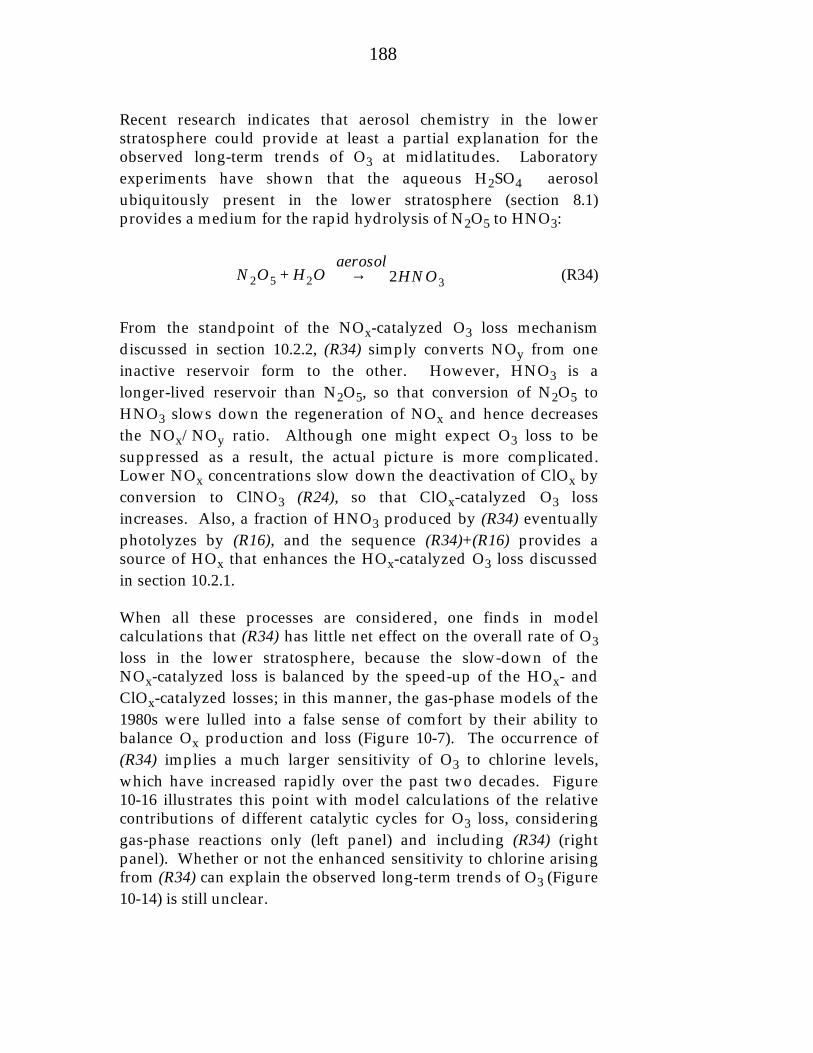
which have increased rapidly over the past two decades. Figure10-16 illustrates this point with model calculations of the relativecontributions of different catalytic cycles for O3 loss, considering
gas-phase reactions only (left panel) and including (R34) (rightpanel). Whether or not the enhanced sensitivity to chlorine arisingfrom (R34) can explain the observed long-term trends of O3 (Figure
10-14) is still unclear.
N2O5 H2O+aerosol
2HNO3→

189
Figure 10-16 Effect of N 2O5 hydrolysis in aerosols on model calculations of ozoneloss in the lower stratosphere at midlatitudes. The Figure shows the fractional
contributions of individual processes to the total loss of O 3 in model calculationsconducted without (left panel) and with (right panel) hydrolysis of N 2O5 in
aerosols. From McElroy, M.B., et al., The changing stratosphere, Planet. Space Sci., 40,373-401, 1992.
Field observations over the past five years have provided ampleevidence that N2O5 hydrolysis in aerosols does indeed take place
rapidly in the stratosphere. The observed NOx/NOy ratio in the
lower stratosphere at midlatitudes is lower than expected frompurely gas-phase chemistry mechanisms, and more consistent witha mechanism including (R34). In addition, the observed ClO/Clyratio is higher than expected from the gas-phase models, becauseof the slower ClNO3 formation resulting from the lower NOx levels.
Aircraft observations following the Mt. Pinatubo eruption in 1991indicated large decreases of the NOx/NOy ratio and increases of
the ClO/Cly ratio, as would be expected from (R34) taking place on
the volcanic aerosols. The resulting enhancement of ClO is thoughtto be responsible in part for the large decrease in the O3 column in
1992, the year following the eruption (Figure 10-14).
Further reading:
McElroy, M.B., R.J. Salawitch, and K.R. Minschwaner, The changingstratosphere, Planet. Space Sci., 40, 373-401, 1992. Catalytic loss cycles.
Warneck, P., Chemistry of the Natural Atmosphere, Academic Press, New York,1988. Historical survey, photochemistry of O2 and O3.
World Meteorological Organization, Scientific assessment of ozone depletion:1998, WMO, Geneva, 1999. Polar ozone loss, ozone trends.
30
28
26
24
22
20
1810-2 10-1 100
FRACTION OF TOTAL LOSS
ALT
ITU
DE
(km
)
NO2+O
HOx
O3+O
Brx
Cly
30
28
26
24
22
20
1810-2 10-1 100
FRACTION OF TOTAL LOSS
ALT
ITU
DE
(km
)
NO2+O
HOx
O3+O
BrxCly