chapter 10 the chi-square testnlucas/stat 145/145 powerpoint files/145 chapter 10... · •...
TRANSCRIPT

TOPIC SLIDE
When is the chi-square test used? 2
Formula for the one-way and two-way chi-square test 3
The one-way chi-square test 4
Example: One-way chi-square test – Grade Distribution 5
• Tutorial: Performing a one-way chi-square test in Excel 2007
The two-way chi-square test 13
• Tutorial: Performing a two-way chi-square test in Excel 2007
THE CHI-SQUARE TEST
Chapter 10
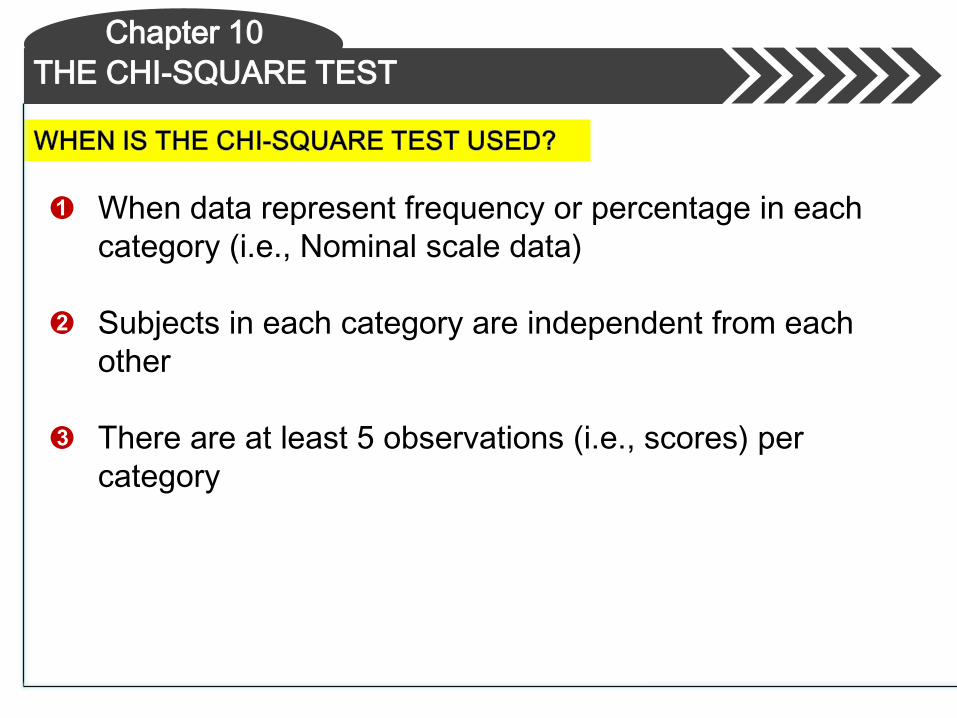
➊ When data represent frequency or percentage in each
category (i.e., Nominal scale data)
➋ Subjects in each category are independent from each
other
➌ There are at least 5 observations (i.e., scores) per
category
THE CHI-SQUARE TEST
Chapter 10
Chapter 10
E
EO2
2
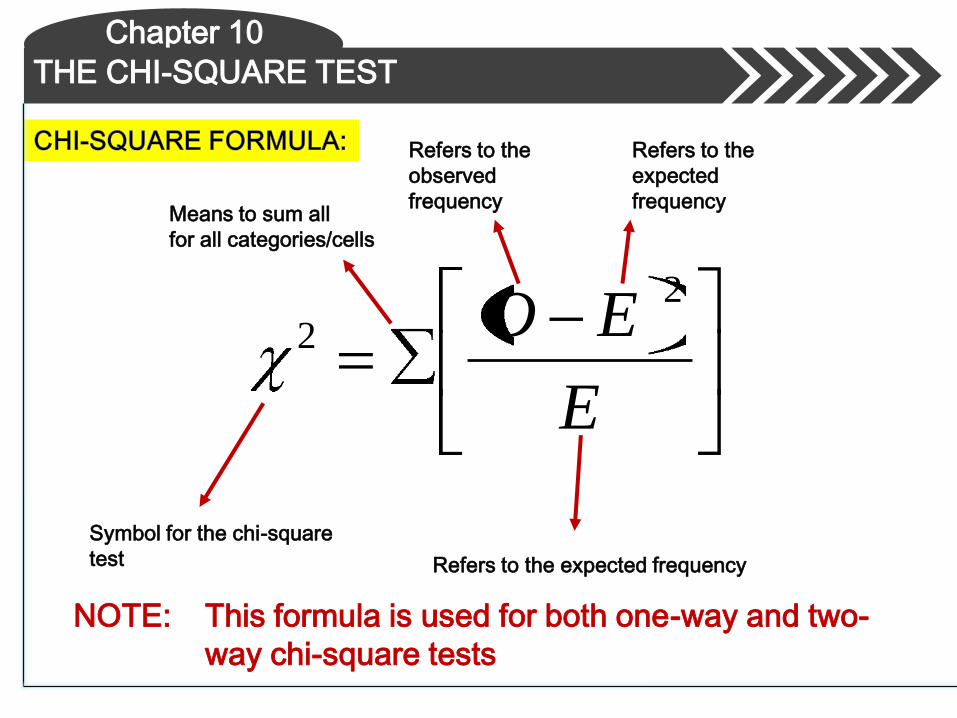
Means to sum all
for all categories/cells
Refers to the
observed
frequency
Refers to the
expected
frequency
Refers to the expected frequency
Symbol for the chi-square
test
NOTE: This formula is used for both one-way and two-
way chi-square tests
THE CHI-SQUARE TEST
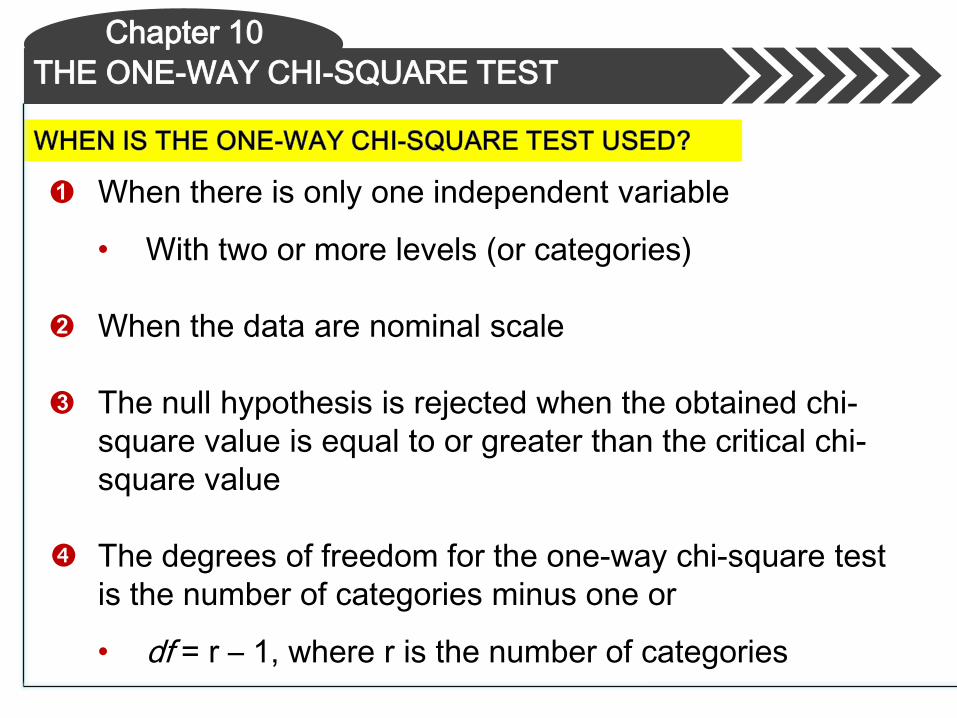
➊ When there is only one independent variable
• With two or more levels (or categories)
➋ When the data are nominal scale
➌ The null hypothesis is rejected when the obtained chi-
square value is equal to or greater than the critical chi-
square value
The degrees of freedom for the one-way chi-square test
is the number of categories minus one or
• df = r – 1, where r is the number of categories
THE ONE-WAY CHI-SQUARE TEST
Chapter 10

THE ONE-WAY CHI-SQUARE TEST
Chapter 10
An instructor makes out his final grades for 200
students in his introductory statistics class. He is
curious to see if his grade distribution resembles the
“normal curve” and notes from the college catalog
that in a normal distribution of grades 45% of them
would be C’s, 24% of them would be B’s, 24% D’s,
3.5% of them would be A’s, and 3.5% F’s. The
instructor compared the frequency of grades given in
his class to the normal curve. The frequency of each
grade is given on the following slide.
THE ONE-WAY CHI-SQUARE TEST
Chapter 10
➊ Null Hypothesis:
• The grade distribution used by the instructor will be
the same as the distribution described in the college
catalog. Any observed differences between the
frequencies of grades given by the instructor versus
what is recommended in the college catalog is
assumed to be solely due to random error.

THE ONE-WAY CHI-SQUARE TEST
Chapter 10
Observed Frequency Expected % Expected Frequency
15 3.5% 7
53 24.0% 48
87 45.0% 90
33 24.0% 48
12 3.5% 7
Total: 200 200
➊ The ‘Observed Frequency’ column represents the
frequency of grades given by the instructor
➋ The ‘Expected %’ column represents the percentage of
grades to be given for each category
➌ The ‘Expected Frequency’ column is the expected
frequency of grades suggested by the college catalog
THE ONE-WAY CHI-SQUARE TEST
Chapter 10
Observed Frequency Expected % Expected Frequency
15 3.5% 7
53 24.0% 48
87 45.0% 90
33 24.0% 48
12 3.5% 7
Total: 200 200
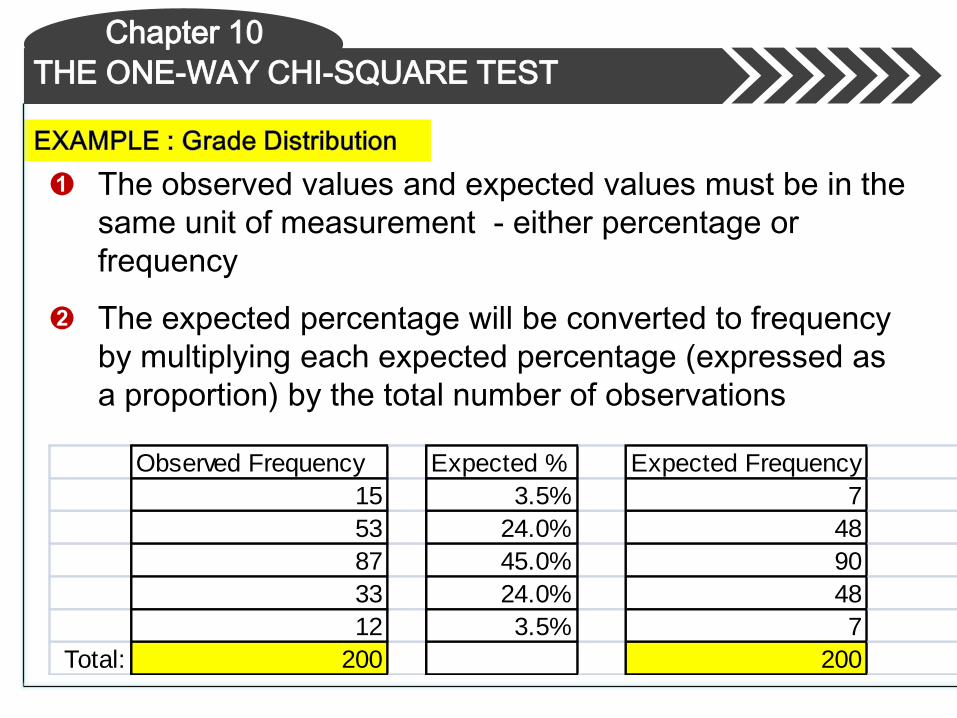
➊ The observed values and expected values must be in the
same unit of measurement - either percentage or
frequency
➋ The expected percentage will be converted to frequency
by multiplying each expected percentage (expressed as
a proportion) by the total number of observations
THE ONE-WAY CHI-SQUARE TEST
Chapter 10
Observed Frequency Expected % Expected Frequency
15 3.5% 7
53 24.0% 48
87 45.0% 90
33 24.0% 48
12 3.5% 7
Total: 200 200
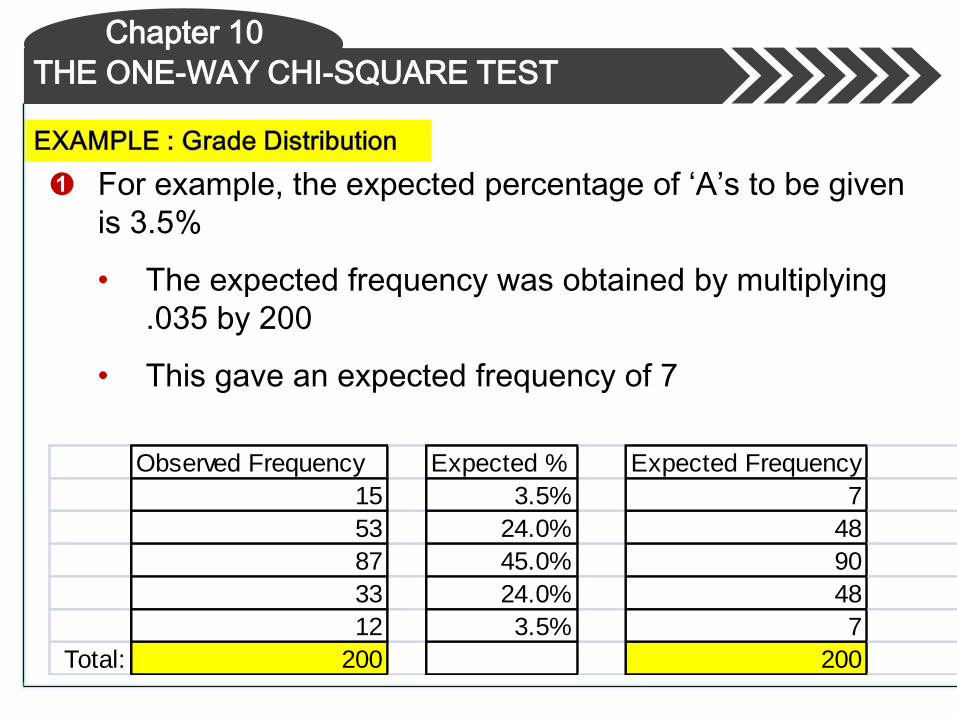
➊ For example, the expected percentage of ‘A’s to be given
is 3.5%
• The expected frequency was obtained by multiplying
.035 by 200
• This gave an expected frequency of 7
THE ONE-WAY CHI-SQUARE TEST
Chapter 10
Observed Frequency Expected % Expected Frequency
15 3.5% 7
53 24.0% 48
87 45.0% 90
33 24.0% 48
12 3.5% 7
Total: 200 200
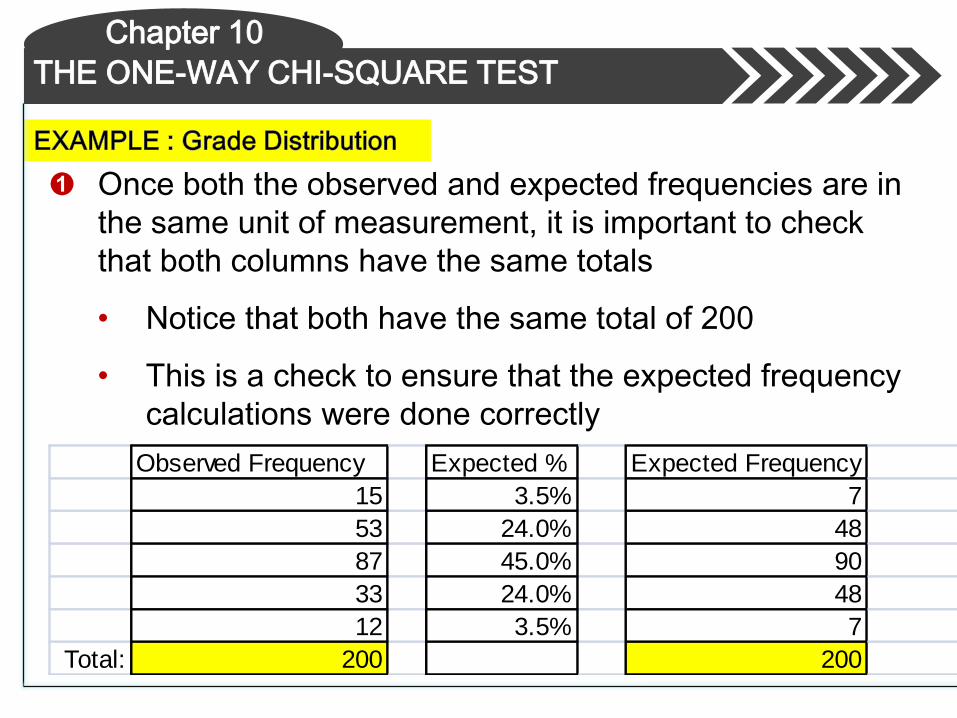
➊ Once both the observed and expected frequencies are in
the same unit of measurement, it is important to check
that both columns have the same totals
• Notice that both have the same total of 200
• This is a check to ensure that the expected frequency
calculations were done correctly

THE ONE-WAY CHI-SQUARE TEST
Chapter 10
Observed Frequency Expected Frequency
15 7
53 48
87 90
33 48
12 7
Total: 200 200
7
7152
2
obt 48
48532
90
90872
48
48332
7
7122
02.182
obt df = 5 – 1 = 4 488.92
05.
Chi-square Obtained Critical Chi-square from table
THE ONE-WAY CHI-SQUARE TEST
Chapter 10
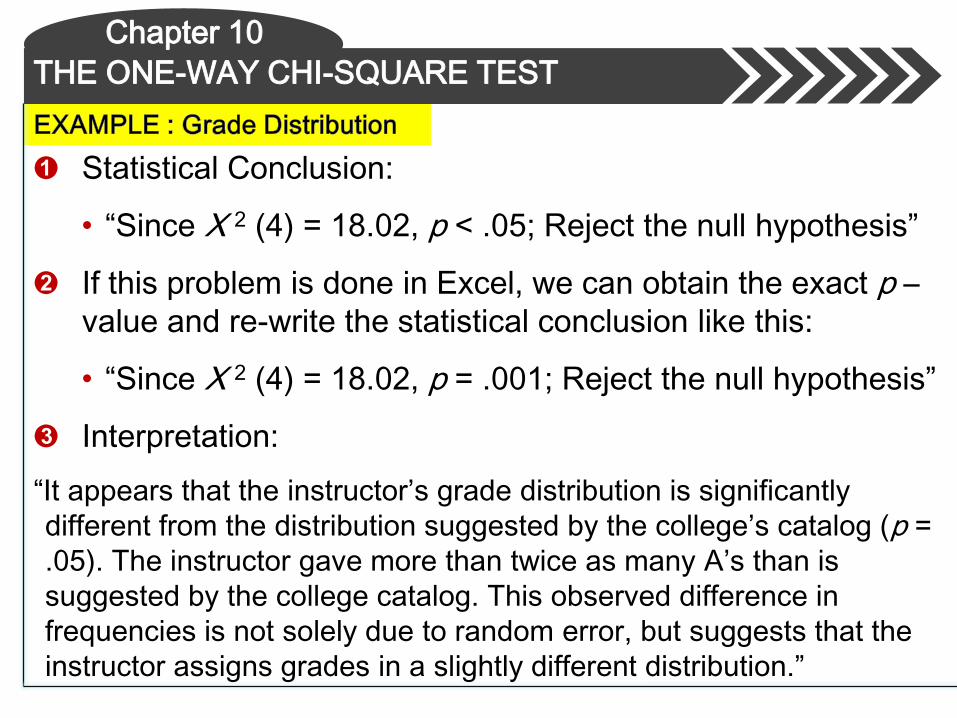
➊ Statistical Conclusion:
• “Since X 2 (4) = 18.02, p < .05; Reject the null hypothesis”
➋ If this problem is done in Excel, we can obtain the exact p –value and re-write the statistical conclusion like this:
• “Since X 2 (4) = 18.02, p = .001; Reject the null hypothesis”
➌ Interpretation:
“It appears that the instructor’s grade distribution is significantly
different from the distribution suggested by the college’s catalog (p =
.05). The instructor gave more than twice as many A’s than is
suggested by the college catalog. This observed difference in
frequencies is not solely due to random error, but suggests that the
instructor assigns grades in a slightly different distribution.”
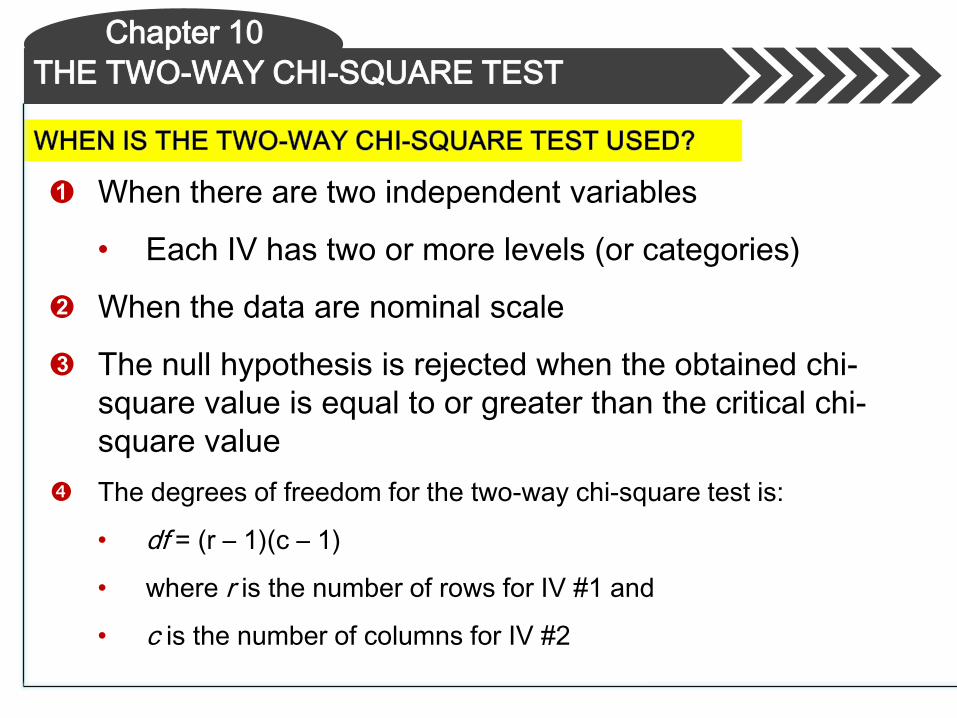
➊ When there are two independent variables
• Each IV has two or more levels (or categories)
➋ When the data are nominal scale
➌ The null hypothesis is rejected when the obtained chi-
square value is equal to or greater than the critical chi-
square value
The degrees of freedom for the two-way chi-square test is:
• df = (r – 1)(c – 1)
• where r is the number of rows for IV #1 and
• c is the number of columns for IV #2
THE TWO-WAY CHI-SQUARE TEST
Chapter 10
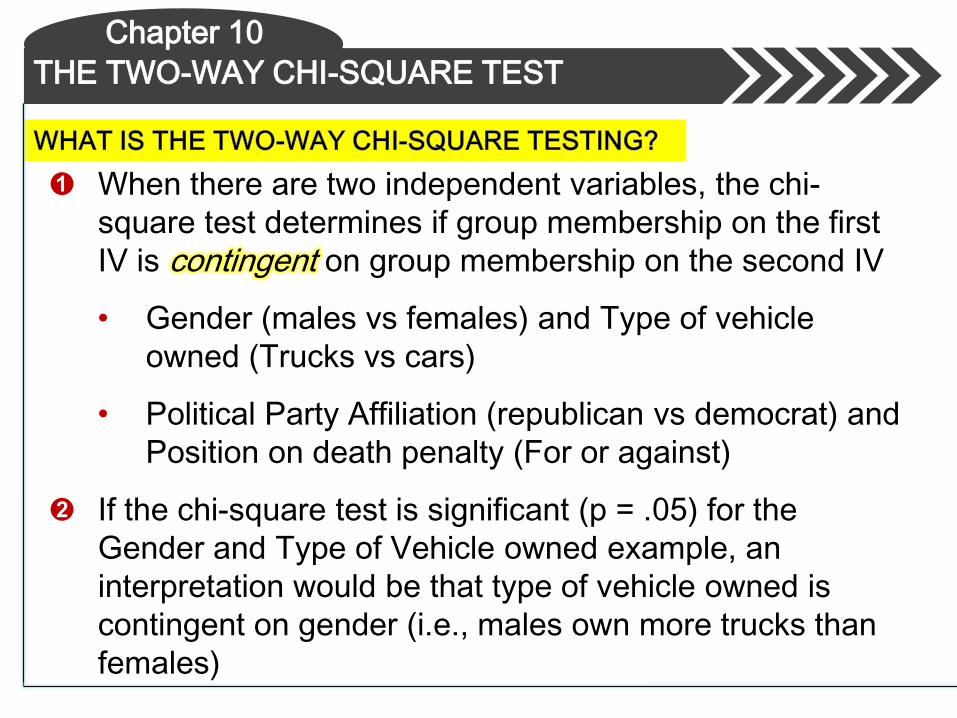
➊ When there are two independent variables, the chi-
square test determines if group membership on the first
IV is contingent on group membership on the second IV
• Gender (males vs females) and Type of vehicle
owned (Trucks vs cars)
• Political Party Affiliation (republican vs democrat) and
Position on death penalty (For or against)
➋ If the chi-square test is significant (p = .05) for the
Gender and Type of Vehicle owned example, an
interpretation would be that type of vehicle owned is
contingent on gender (i.e., males own more trucks than
females)
THE TWO-WAY CHI-SQUARE TEST
Chapter 10

➌ If the chi-square test is significant (p = .05) for the
Political Party Affiliation and Position on Death Penalty
example, an interpretation would be that being for or
against the death penalty is contingent on political party
affiliation (i.e., Republicans are more likely for the death
penalty)
When the chi-square test is non-significant, it suggests
that membership on the first IV is not contingent on
membership on the second IV
THE TWO-WAY CHI-SQUARE TEST
Chapter 10

THE CHI-SQUARE TEST
Chapter 10
That’s it for chapter 10!