chapter 11 hurricanes · 2008-11-12 · chapter 11 hurricanes 4 1971-2005 tropical cyclones in the...
TRANSCRIPT

Chapter 11 Hurricanes 1
Chapter 11
Hurricanes
Few phenomena in nature compare to the destructive force of a hurricane. Called the greatest
storm on Earth, a hurricane is capable of annihilating coastal areas with sustained winds over 100
mph, intense areas of rainfall, flooding ocean waters, and huge waves. In fact, during its life
cycle a hurricane can expend as much energy as 10,000 nuclear bombs!1 The term hurricane is
derived from Huracan, a god of evil recognized by the Mayan civilization in Central America
and the Tainos of the Caribbean.2
Beyond the soft winds and tranquil north shore waters of Hawaii, the late summer and fall
ushers in threatening tropical storms and hurricanes. Hurricanes, tropical storms, and typhoons
are collectively known as tropical cyclones. These disturbances are among the most devastating,
naturally occurring hazards in coastal areas of the tropics and middle latitudes. Constant media
reminders that it is “Hurricane Season” keep us all on guard and stimulate a somewhat closer
watch among residents on the weather forecast portion of the evening news.
Tropical cyclones3 are classified as follows:
Hurricane - An intense tropical weather system with a well-defined circulation and
maximum sustained winds of seventy-four miles per hour or higher. In the western Pacific,
hurricanes are called typhoons. Similar storms in the Indian Ocean are called cyclones.

Chapter 11 Hurricanes 2
Tropical Storm - An organized system of strong thunderstorms with a defined circulation
and maximum sustained winds of thirty-nine to seventy-three mph.
Tropical Depression - An organized system of clouds and thunderstorms with defined
circulation and maximum sustained winds of thirty-eight mph or less.
Hurricanes tend to form around a pre-existing atmospheric disturbance (an area of low
pressure) in warm tropical oceans where there is high humidity in the atmosphere, light winds
above the storm, and a high rate of condensation in the atmosphere. If the right conditions last
long enough, a hurricane can produce violent winds, incredible waves, torrential rains, and
floods.
There are on average six Atlantic hurricanes each year; over a 3-year period, approximately
five hurricanes strike the United States coastline from Texas to Maine. The Atlantic and Gulf of
Mexico coasts of the U.S. are famous for their vulnerability to hurricane damage but other areas
are also vulnerable. In fact, there are three regions in the Northern Hemisphere known for their
tendency to spawn hurricanes: the tropical Atlantic, the eastern tropical Pacific, and the western
tropical Pacific. In the Southern Hemisphere there are two primary areas: the western topical
Pacific, and Indian Ocean.
Saffir-Simpson Hurricane Scale
TD TS 1 2 3 4 5
This map shows the tracks of all Tropical cyclones which formed worldwide from 1985 to 2005.
The points show the locations of the storms at six-hourly intervals and use a color scheme shown
from the Saffir-Simpson Hurricane Scale. Notice that Hawai‘i lies in the corridor between the
east Pacific spawning grounds and the west Pacific.4 [2 page spread]
Chapter 11 Hurricanes 3
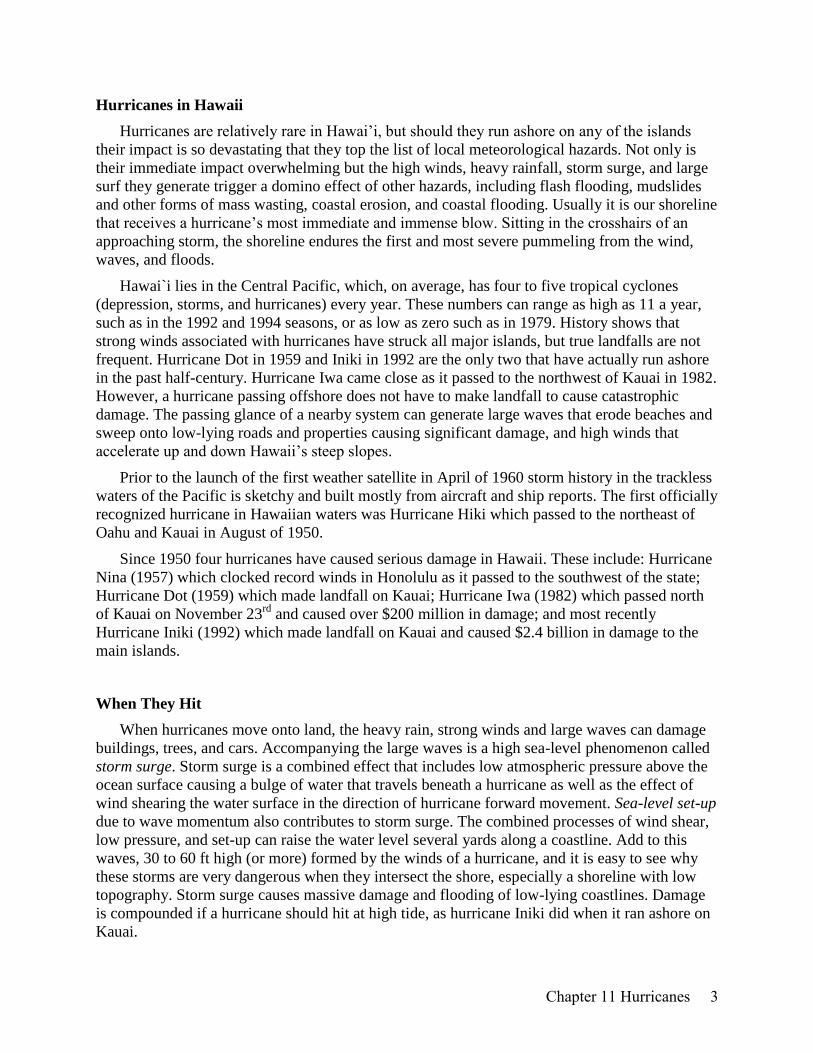
Hurricanes in Hawaii
Hurricanes are relatively rare in Hawai‟i, but should they run ashore on any of the islands
their impact is so devastating that they top the list of local meteorological hazards. Not only is
their immediate impact overwhelming but the high winds, heavy rainfall, storm surge, and large
surf they generate trigger a domino effect of other hazards, including flash flooding, mudslides
and other forms of mass wasting, coastal erosion, and coastal flooding. Usually it is our shoreline
that receives a hurricane‟s most immediate and immense blow. Sitting in the crosshairs of an
approaching storm, the shoreline endures the first and most severe pummeling from the wind,
waves, and floods.
Hawai`i lies in the Central Pacific, which, on average, has four to five tropical cyclones
(depression, storms, and hurricanes) every year. These numbers can range as high as 11 a year,
such as in the 1992 and 1994 seasons, or as low as zero such as in 1979. History shows that
strong winds associated with hurricanes have struck all major islands, but true landfalls are not
frequent. Hurricane Dot in 1959 and Iniki in 1992 are the only two that have actually run ashore
in the past half-century. Hurricane Iwa came close as it passed to the northwest of Kauai in 1982.
However, a hurricane passing offshore does not have to make landfall to cause catastrophic
damage. The passing glance of a nearby system can generate large waves that erode beaches and
sweep onto low-lying roads and properties causing significant damage, and high winds that
accelerate up and down Hawaii‟s steep slopes.
Prior to the launch of the first weather satellite in April of 1960 storm history in the trackless
waters of the Pacific is sketchy and built mostly from aircraft and ship reports. The first officially
recognized hurricane in Hawaiian waters was Hurricane Hiki which passed to the northeast of
Oahu and Kauai in August of 1950.
Since 1950 four hurricanes have caused serious damage in Hawaii. These include: Hurricane
Nina (1957) which clocked record winds in Honolulu as it passed to the southwest of the state;
Hurricane Dot (1959) which made landfall on Kauai; Hurricane Iwa (1982) which passed north
of Kauai on November 23rd
and caused over $200 million in damage; and most recently
Hurricane Iniki (1992) which made landfall on Kauai and caused $2.4 billion in damage to the
main islands.
When They Hit
When hurricanes move onto land, the heavy rain, strong winds and large waves can damage
buildings, trees, and cars. Accompanying the large waves is a high sea-level phenomenon called
storm surge. Storm surge is a combined effect that includes low atmospheric pressure above the
ocean surface causing a bulge of water that travels beneath a hurricane as well as the effect of
wind shearing the water surface in the direction of hurricane forward movement. Sea-level set-up
due to wave momentum also contributes to storm surge. The combined processes of wind shear,
low pressure, and set-up can raise the water level several yards along a coastline. Add to this
waves, 30 to 60 ft high (or more) formed by the winds of a hurricane, and it is easy to see why
these storms are very dangerous when they intersect the shore, especially a shoreline with low
topography. Storm surge causes massive damage and flooding of low-lying coastlines. Damage
is compounded if a hurricane should hit at high tide, as hurricane Iniki did when it ran ashore on
Kauai.

Chapter 11 Hurricanes 4
1971-2005 Tropical Cyclones in the Central Pacific5
Hurricanes Tropical
Storms
Tropical
Depressions
Total
Total Number 48 57 48 153
Average Per Year 1.4 1.6 1.4 4.4
Percent of All Systems 31% 36% 33%
Hurricane tracks around the Hawaiian Islands since 1949.6
Hurricanes are not the only type of storm to cause damage in coastal areas, but they are the
most damaging. High winds and storm surge are a primary cause of hurricane-inflicted loss of
life and property damage. When a hurricane makes landfall on low-lying coastal lands, ocean
waters sweep across beaches, roads, and into adjacent communities. Houses float, or are blown
off their foundations. Debris torn loose is carried by the water and wind to smash into
neighboring dwellings. Entire blocks of homes can be brought down in the hours that a hurricane
batters the coast. Winds blow onshore at first, and when the eye of the storm passes, they blow
from the opposite direction, often completing the total damage to structures severely weakened
by the first winds. Heavy rains compound the coastal flooding by saturating the ground and
forcing nearby streams to overtop their banks. Coastal erosion compromises any buffering effect

Chapter 11 Hurricanes 5
that beaches and wetlands may have because high waves and storm surge can strip a beach of its
sand and undermine homes, roadways, and businesses.
How can damage be mitigated? The simplest and most direct way is to avoid the hazard by
not developing the shoreline. If we stopped putting communities on the edge of the ocean, we
would greatly reduce the suffering, loss of life, and enormous damage caused by hurricanes and
other types of coastal hazards.
Hurricane Intensity
All hurricanes are ranked by the Saffir Simpson Scale according to the power of their winds.7
Yet, a storm‟s strength fluctuates. What appears to be a weak approaching tropical disturbance
may intensify into a full-blown hurricane. The vigilant National Weather Service‟s Central
Pacific Hurricane Center (CPHC) monitors weather patterns and tropical low-pressure centers,
and tracks any suspect tropical storms.8 If need be, the CPHC is able to issue storm warnings at
least several hours before a gale hits. When the shrill sirens blare out a state of emergency and
call for evacuation, citizens are encouraged not to second-guess the CPHC‟s judgment,
especially because high winds and flooding may occur before the storm‟s landfall.
Saffir Simpson Scale
Hurricane
Category
Sustained Winds
(mph) Damage Level
Typical Storm Surge
1 74-95 Minimal 5-7 ft
2 96-110 Moderate 7-12 ft
3 111-130 Extensive 12-15 ft
4 131-155 Extreme 15-20 ft
5 >155 Catastrophic 20-24 ft
Coastal flooding almost always accompanies hurricanes. In Hawai„i, the threat is doubled
because floodwaters arrive from the sea and the land. The heavy rainfall that accompanies most
hurricanes can overwhelm our tiny watersheds in a blink, and narrow streams turn into flooding
hazardous torrents. Standing water collects in poorly drained areas. This is especially the case
where a low-lying coastal plain is flooded by high ocean waters accompanying a storm. Run-off
simply cannot drain into the ocean when the storm drain system is already overwhelmed by high
sea level. Compounding the situation, unlike continental coastal areas, the islands of Hawai„i do
not have a continental shelf, which makes them prone to bigger waves and marine flooding that
overwhelms coastal lands.
As if flooding and high winds were not enough, hurricanes may be accompanied by bursts of
extremely intense winds. These concentrated winds, called microbursts, can reach over 200 mph
and literally blow apart any structure in their path.9 Another dangerous feature of hurricanes in
our mountainous topography is the tendency for winds to accelerate as they climb steep slopes.
Chapter 11 Hurricanes 6
As hurricane force winds blow across the flat ocean and low-lying coastal plains they will
encounter a sudden increase in elevation on the slopes of the high shield volcanoes. To maintain
the volume of airflow within the storm system these leading winds must accelerate to climb the
steep slopes. The wind gusts created by this process can approach and exceed 150 mph. Houses
perched on ridgelines, the edge of steep slopes, and even typical valley hillsides can have their
roofs torn off, leading to wall collapse and total structural failure.
These same winds can further accelerate as they cross the palis and hurtle downhill along
steep contours. During Hurricane Iwa in 1982, the highest wind speeds were measured in
Kāne„ohe even though the hurricane passed on the other side of the island.10
In either case of
upslope or down slope winds, homes among the hills get it coming and going. A good dictum for
siting your house: “If you have a nice view, you are vulnerable to wind damage.”
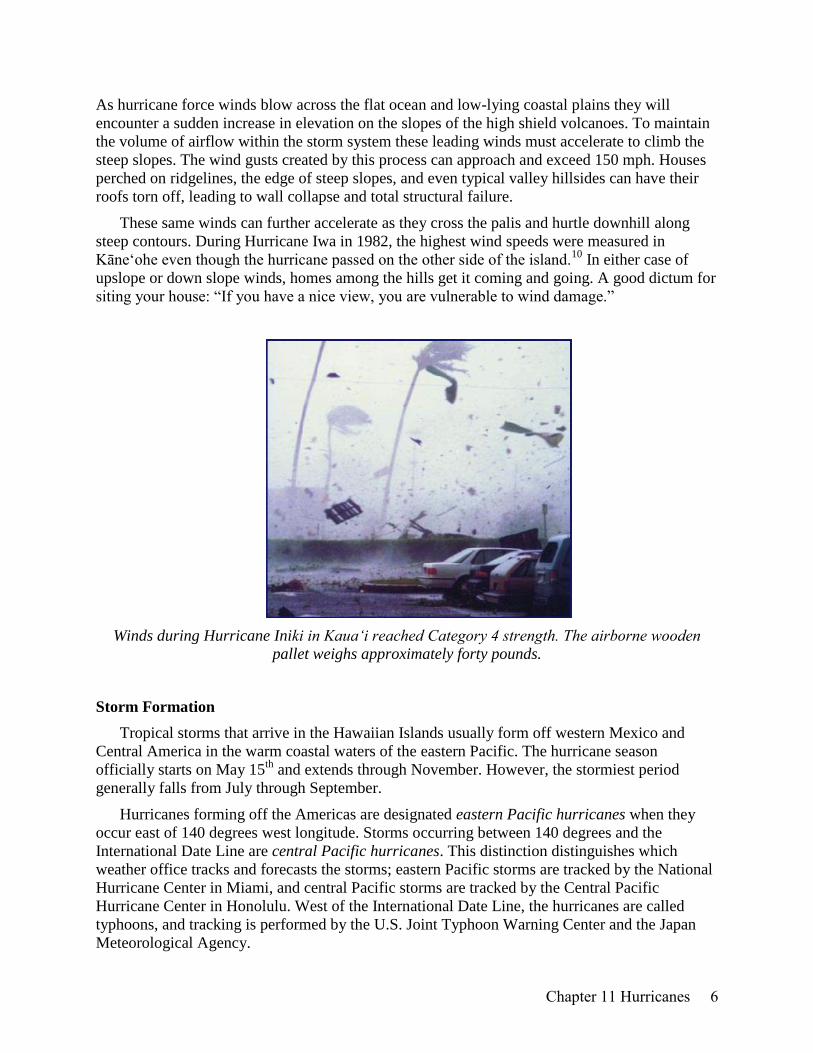
Winds during Hurricane Iniki in Kaua‘i reached Category 4 strength. The airborne wooden
pallet weighs approximately forty pounds.
Storm Formation
Tropical storms that arrive in the Hawaiian Islands usually form off western Mexico and
Central America in the warm coastal waters of the eastern Pacific. The hurricane season
officially starts on May 15th
and extends through November. However, the stormiest period
generally falls from July through September.
Hurricanes forming off the Americas are designated eastern Pacific hurricanes when they
occur east of 140 degrees west longitude. Storms occurring between 140 degrees and the
International Date Line are central Pacific hurricanes. This distinction distinguishes which
weather office tracks and forecasts the storms; eastern Pacific storms are tracked by the National
Hurricane Center in Miami, and central Pacific storms are tracked by the Central Pacific
Hurricane Center in Honolulu. West of the International Date Line, the hurricanes are called
typhoons, and tracking is performed by the U.S. Joint Typhoon Warning Center and the Japan
Meteorological Agency.

Chapter 11 Hurricanes 7
Contours show relative hurricane risk for the Hawaiian Islands, the number of times a hurricane
passes within seventy-five nautical miles in a ten year period. 11
Tropical storms have been identified using both men‟s and women‟s names since 1978. A
mix of English and Spanish names is used in the eastern Pacific Region, and Hawaiian names in
the central Pacific Region. Storm names in the eastern Pacific are recycled every six years, and
in the central Pacific four lists of names are used sequentially.
The conditions that lead to tropical cyclone formation in the eastern Pacific are the same as
elsewhere in the world. With the onset of summer, a large area of warm water, high humidity,
and light winds forms between 8o and 20
o north of the equator with a temperature that exceeds
80o F. This heat fuels the energy of the storm.
The first sign of hurricane development is the appearance of a cluster of thunderstorms over
the tropical oceans, called a tropical disturbance. Tropical disturbances most commonly form
where surface winds (such as trade winds) converge near the equator, accelerate, and develop
turbulences. Given favorable conditions, a tropical disturbance can grow, indicated by falling
surface pressure in the area around the storm and the development of a counter-clockwise
circulation of air. Surface pressure falls as water vapor condenses and releases heat into the air
causing it to rise. This lowers air pressure on the ocean surface and surrounding air flows inward
toward the area of low pressure.
As the warm air rises, it expands and cools triggering more condensation, the release of more
heat, and a further increase in upward air flow. This process essentially becomes a chain reaction
as the rising column of air in the center of the storm causes surface pressure to lower even more,
drawing air (wind) into the storm center. As the air flows in, it develops counter-clockwise
circulation in the northern hemisphere and clockwise circulation in the southern hemisphere – a
consequence of the Coriolis Effect caused by Earth‟s rotation. As the process of condensation,
heat release, and air circulation continues, it generates more thunderstorms, more heat, lower
surface pressure, stronger winds, and so on. In the right circumstances, this process can build and
gain strength.
At the top of the storm, atmospheric pressure begins to rise in response to the rising column
of warm air. This causes air to flow outward (diverge) around the top of the disturbance. Like a

Chapter 11 Hurricanes 8
chimney, this upper-level area “vents” the tropical system and prevents the air converging on the
ocean surface from piling up around the center. If it did, surface pressure would rise inside the
base of the storm and ultimately destroy it.
As a hurricane gathers strength, the center develops into a five to forty mile-diameter cloud
free area of sinking air and light winds, called the eye. The eye is the calmest part of the storm.
This is because the strong cyclonic winds that accelerate towards the center never actually reach
the exact center of the storm. Instead, the winds form a cylinder of intensely fast airflow, called
the eye wall, surrounding a cylinder of relatively calm, downward flowing air. Like an ice skater
whose body spins faster as her arms are drawn inward, air near the center speeds up as it spirals
in towards (but never reaching) the eye. Hence, the winds form an intense high velocity band
ringing the eye characterized by tall thunderstorms, heavy rain, and destructive winds.
Vertical cross-section of air circulation, clouds, and precipitation in a hurricane12
.
The most dangerous section of the storm is in the eye wall on the right side of the eye. This is
where the wind blows in the same direction as the storm's forward motion adding the forward
speed of the storm to the speed of the wind. For example, in a hurricane moving due north at
twenty mph with eye wall winds at 125 mph, the most intense airflow is found on the eastern
side of the storm where the winds blow north at 145 mph. On the west side of the eye the same
winds would be southerly at 105 mph.
Even when conditions are ripe for storm formation on the ocean surface, high altitude winds
or descending columns of air can prevent a disturbance from developing. For example, in the
region of 20° to 30° latitude, the air aloft is often sinking because of the presence of a semi-
permanent high pressure system called the North Pacific High.13
As the air in the North Pacific
High sinks, it warms. This prevents the formation of an upward-moving column of air necessary
Chapter 11 Hurricanes 9
to make a storm. In addition, strong upper-level winds in some areas tend to “decapitate”
thunderstorms by dispersing rising air and preventing a storm from getting organized.
Three conditions usually cause a hurricane‟s death:
1) the storm moves over cooler water that can't supply warm, moist tropical air;
2) the storm moves over land, also cutting of the source of warm, moist air; and
3) the storm migrates into an area where high altitude air flow disrupts storm circulation.
Tracking Hurricanes
Tropical storms formed in the eastern Pacific tend to drift westward or to the north into the
open North Pacific. As the season progresses, more hurricanes steer northward paralleling the
American Pacific Coast and ultimately meeting their fate in the colder waters. It is the trade
winds that steer most Pacific hurricanes from their place of birth westward into the open ocean.
This track ensures that few hit land.
The storms that do make landfall usually strike along the Mexican coast. If a storm were to
curl back toward the coast of California, its impact would be muted by the cold waters of the
California Current that flow southward along the coastline with temperatures that rarely exceed
60o F. In fact, because it is protected by the current of cold water, hurricanes are unlikely to hit
California.14
The same cannot be said of tropical storms however. In September 1939, winds of
fifty mph struck the Los Angeles–Long Beach area as part of a tropical Pacific storm that
produced 5.6 inches of rain in Los Angeles and over 11.6 inches at Mount Wilson. The storm
claimed forty-five lives (mostly at sea) and caused two million dollars of damage to crops and
coastal development.15
Has California ever been hit by a hurricane? The answer is “sort of.” In
1858 the coastline from San Diego to Long Beach was raked with damaging winds, some
reaching hurricane strength, generated by a low pressure system that tracked offshore, probably
without the eye actually making landfall.16
The majority of central Pacific hurricanes that capture our attention also originate in the
warm, tropical waters off the Mexico coast. Every few years a storm will move along a path that
is west by northwest toward Hawai„i. However, most of these diminish before reaching the
islands because waters to our east and northeast are generally too cool to sustain a hurricane's
intensity.
Figuring out the history of hurricanes in the Pacific has been complicated by the lack of
direct observations prior to the modern era of satellites. Most hurricanes spend their lives over
trackless waters of the east Pacific where few ships and even fewer islands are available to report
their position and intensity. The majority of hurricanes went undetected prior to the 1960s. But
as global weather satellites came on-line, meteorologists were surprised to learn that eastern
Pacific hurricanes are rather frequent phenomena with patterns of movement that follow semi-
predictable pathways.
Eastern Pacific hurricanes can make landfall along the Central American coast potentially
hitting the nations of Mexico, Guatemala, El Salvador, Nicaragua, Costa Rica, and Panama.
When these storms do make landfall they bring with them strong winds, raging surf, storm surge,
and heavy rains. These of course often lead to flash flooding, landslides, mudslides and other
associated hazards. In downgraded form as tropical storms, East Pacific hurricanes can lead to

Chapter 11 Hurricanes 10
heavy rainfall and gusty winds in the southwest states of California, Arizona, New Mexico and
as far east as Oklahoma and Texas.
Hurricane John in 1994 is the longest living Pacific hurricane on record.17
Over thirty-one
days it tracked across 4,000 miles of eastern and central Pacific waters. On two different
occasions John‟s winds reached the alarming speed of 170 mph, it crossed the international date
line twice (becoming “Typhoon John” in the process), and thankfully skirted the Hawaiian
Islands to the south and west in the process.
Lest you think there is no relationship between Atlantic and Pacific hurricanes, a few storms
have tracked across from the Gulf of Mexico into the Pacific, and (more rarely) from the Pacific
into the gulf. Hurricanes that cross the Central American landmass typically lose energy quickly
and degrade to tropical storms. But on occasion, a weakened storm re-entering the ocean can
strengthen and gather energy if it encounters a warm pool of water. Hurricane Cosme left the
Eastern Pacific in 1989 to become Atlantic Tropical Storm Allison.18
There was even a
“hurricane with three names” in 1961 when an Atlantic storm crossed into the Pacific, regained
hurricane strength in the east Pacific warm pool, and doubled back into the Gulf of Mexico
again!19
El Niño and Hurricanes
El Niño, in addition to controlling episodes of major drought, plays an important role in the
location of hurricane genesis in the Pacific. During the onset year of an El Niño, changes in the
wind pattern of the central Pacific create a zone of disturbances between equatorial west-flowing
winds and subtropical east-flowing winds. Under the right conditions, these disturbances can
grow into hurricanes.
El Niño warm phases in the Southern Oscillation have corresponded to some of the largest
annual storm counts in the central Pacific.20
However, the relationship is not unique because
although 1972, 1982, and 1992 were warm phase years and major storm years, 1978 was not an
El Niño year, yet it still had as many storms as the warm phase years, and 1977 was a warm
phase year and the central Pacific storm count was zero.
Pao-Shin Chu, a University of Hawai„i meteorology professor, reported in a 1997 study of
tropical cyclones that El Niño years produce more Pacific tropical storms, and that with some
exceptions, their tracks are more erratic than in non-El Niño years.21
If this is the case, then
terms like “100-year storm” or “50-year storm” are misleading, and may lull people into thinking
Iniki or Iwa, the last two hurricanes to strike Hawai„i, warrant our safety for many years to come.
Unfortunately, more often than we like or plan for, the path of a hurricane clips or intersects
the islands. Four hurricane-strength tropical cyclones have moved across the Hawaiian Islands
since statehood in 1956: Nina in 1957, Dot in 1959, Iwa in 1982, and Iniki in 1992.22
Kauai‟s
position is located further west than the other islands and therefore is more likely to lie in the
path of a hurricane hooking to the north after passing south of the Big Island. This effect was
seen in Hurricanes Dot, Iwa, and Iniki, all of which passed over the Kaua„i and Ni‟ihau Island
zone.23
More recently, hurricane Flossie, a category 4 storm when it began life in the east Pacific,
passed south of the Big Island in a downgraded state in August of 2007. The storm produced
strong swell that hit exposed shores of all the islands and heavy rainfall on the Big Island and
triggered a flash flood watch.

Chapter 11 Hurricanes 11
Hurricane Flossie on August 14, 2007; Flossie passed approximately 100 miles south of the Big
Island. In a typical year, four to five tropical cyclones form or cross into the central Pacific, two
of which on average r each hurricane intensity.24
Global Warming and Hurricanes
The theory that global warming will spawn more hurricanes and that more of them will be
big storms is well accepted. Proving it with direct observations of hurricane history, however, is
turning out to be vexing. Warmer air should lead to warmer water which should provide more
heat to both build and supercharge storms. The problem is that the history of instrumented
observations recording hurricanes is only as old as the global satellite network, and this is not
long enough to confirm an unequivocal link to global warming.
For example, one study in 2005 concluded that hurricanes and typhoons have become
stronger and longer-lasting over the past thirty years and that these changes correlate with a rise
in sea surface temperatures over the same time period.25
Kerry Emanuel, a professor of
atmospheric science at the Massachusetts Institute of Technology, reported that the duration and
strength of hurricanes increased by about 50% in the past three decades. This observation revised
existing models for measuring storm strength, which suggested that the intensity of hurricanes
and typhoons should only increase by 5% for every 1ºC (1.8ºF) rise in sea surface temperature.
Emanuel said “We‟ve had half a degree [Celsius] of warming, so that should have led to a 2.5%
increase [in intensity], which is probably not detectable. What we've seen is somewhat bigger
than that, and we don't really know why.”26
Emanuel speculated that ocean temperatures may be

Chapter 11 Hurricanes 12
increasing more quickly than atmospheric temperatures. “When that happens we've shown
theoretically you get an increase in the intensity of hurricanes,” he said.
However, by April of 2008, Emmanuel was changing his stand. He unveiled a novel
technique for predicting future hurricane activity suggesting that, even in a dramatically warming
world, hurricane frequency and intensity may not substantially rise during the next two
centuries.27
"The results surprised me," Emanuel said of his work, adding that global warming
may still play a role in raising the intensity of hurricanes. What that role is, however, remains far
from certain.
Another study by scientists at the Georgia Institute of Technology and the National Center
for Atmospheric Research in Boulder, Colorado, suggested that the number of category four and
five hurricanes has almost doubled globally over the past three decades.28
These results indicate
that a substantial increase has occurred in all the major tropical storm basins of the world with
the greatest increases in the north Pacific, Indian, and southwest Pacific oceans. However, a key
question for all studies of the relationship between hurricanes and global warming is the quality
and degree of agreement in the storm intensity and frequency data being used, a subject of
vigorous debate in the hurricane research community. Indeed the Georgia study has been
criticized for drawing conclusions from a historical database that may suffer from sampling
errors.
Is global warming changing the intensity or frequency of hurricanes? According to the 2007
Fourth Assessment Report of the Intergovernmental Panel on Climate Change (IPCC-AR4), it is
“more likely than not” (better than even odds) that there is a human contribution to the observed
trend of hurricane intensification since the 1970s. In the future, “it is likely [better than 2 to 1
odds] that future tropical cyclones (typhoons and hurricanes) will become more intense, with
larger peak wind speeds and more heavy precipitation associated with ongoing increases of

Chapter 11 Hurricanes 13
tropical [sea surface temperatures].” According to the IPCC-AR4, on a global scale, “[t]here is
no clear trend in the annual numbers [i.e. frequency] of tropical cyclones.” However, the
frequency of tropical storms has increased dramatically in the North Atlantic and this tends to
drive public awareness of the potential role of global warming. Reasons for the North Atlantic
increase are subject to intense debate among climate scientists. At least one peer-reviewed study
indicates a significant statistical link between increasing intensity of the strongest storms and
global warming29
, but research to identify a mechanism explaining this link is ongoing. Notably,
this study does not show a significant trend of growing storms in the Pacific, only in the Atlantic
and the Indian oceans.
Relevant to this discussion is the actual number of tropical cyclones happening in recent
years in the central north Pacific. In 2004, the total activity was slightly below normal, with three
cyclones occurring compared to the annual average of four to five. One tropical cyclone
developed within the central Pacific and the other two, Darby and Estelle, moved into the area
from the eastern Pacific. Estelle was the strongest of the three systems and the only one of
tropical storm intensity. There were no deaths recorded or property damage reported in the
central north Pacific due to these three tropical cyclones.
With three systems in 2005, the total activity for the tropical cyclone season was below
normal. One tropical cyclone developed within the central Pacific and the other two, Jova and
Kenneth, moved into the area from the eastern Pacific. Jova was the strongest of the systems,
maintaining category 3 strength for 36 hours, and the strongest tropical cyclone in the central
Pacific since Ele in 2002. Although two storm remnants contributed to some locally heavy
rainfall across Hawaii, there were no deaths recorded or significant property damage reported in
2005.
In 2006, the central Pacific tropical cyclone season had near normal activity despite the
development of a relatively weak El Nino in September 2006. A total of five tropical cyclones
occurred during the season, including two hurricanes. One of the hurricanes, Ioke, reached
category 5 intensity and set several central Pacific tropical cyclone records. The other three
systems only reached tropical depression intensity.
Although the average number of hurricanes between 1995 and 2006 is probably
unprecedented on a global basis, there has not been a long-term increase in hurricane frequency
overall. Instead, there have been periods of high hurricane activity that last for several decades,
followed by decades of low activity. The 1920s-30s and 1950s-60s were active periods.30
In
1995, we entered and are currently in the latest natural phase of high hurricane frequency, which
is expected to persist for another decade or two. What is the last word on the connection between
global warming and hurricanes? Leave it to the experts, they haven‟t figured it out yet.
Hurricane Iniki: The wake-up call.
Hurricane Iniki engulfed Kaua„i on September 11, 1992, with 130 mph winds and gusts up to
160 mph.31
Iniki‟s winds, waves, and flooding destroyed 1,421 buildings, and damaged another
6,292, totaling 90% of all houses, buildings, and structures on the island. An additional 607
buildings on other islands were damaged or destroyed from the pounding surf.32
This level of
damaged proved to be crushing to the economy of Kauai which was not seen to recover for
another decade.

Chapter 11 Hurricanes 14
The hurricane‟s devastating waves penetrated well beyond the shoreline, smashing buildings,
ripping up roads, tearing down power lines, filling swimming pools with sand so that they
disappeared from view, and spreading boulders, gravel, and debris across properties and roads.
Survey parties measured watermarks higher than fifteen feet above sea level on interior walls of
demolished homes, trees, and among the vegetation in open fields. At eye level, the trunks of
coconut trees were bruised, smashed, and had been laid open to their core by cobbles and coral
heads suspended in the swirling flood waters and surging waves. However, the most severe cause
of property damage from Iniki was its turbulent wind.
The wind sucked roofs and walls off of houses, leaving the interiors exposed to torrential
rains, and contributing to the wind-borne debris hurtling into adjacent buildings. Many houses
were uprooted and pulled from their footings by the strong winds or floodwaters. Almost
mysteriously, while one house blew to shreds, the next-door neighbor would survive with minor
damage – the product of proper engineering and careful construction. In some cases, the margin
between total structural failure and only moderate damage was determined by whether a single
line of roofing nails was well aimed and found the underlying joist, or missed and failed in its
job of anchoring a plywood roofing sheet to the frame of the house. 33
Although there were only six fatalities, Iniki was the most costly natural disaster in Hawaii‟s
recorded history. At $2.4 billion in losses, it ranks as one of the top ten costliest hurricanes in
U.S. history.34
Thousands of people were left homeless, 100 injured, and many lives were
disrupted for years after, as Kaua„i struggled to recover. For a decade following the event,
Kaua„i remained in the grip of a recession as tourism shifted to the less damaged islands.35
Iniki
was neither a particularly large hurricane nor unusual in terms of frequency of occurrence yet its
impact was still devastating over an extended period of time. The shock and destruction are
indelibly printed in the memory of those who experienced the storm and suffered through its
aftermath.
How Much Damage Can a Hurricane Cause?36
If a Category 1 storm as strong as Hurricane Iwa, with sustained winds at 74 mph, strikes any
of the islands in the state, we can estimate from past experience that about 12% of the houses and
apartments will be destroyed or heavily damaged and about 18% will experience minor damage.
If a Category 4 storm strikes any island with the force of Iniki, with winds raging at over 130
mph, we can estimate that about 38% of the homes will be heavily damaged or destroyed. An
additional 40% will probably have minor damage.
The following information was extrapolated from Kaua„i Damage in 1982 and 1992.
Potential Hurricane Damage in Hawai‘i (billions of $)
O‘ahu Maui Hawai‘i Kaua‘i
Iwa-Strength Storm $4.5-7.5 $0.8-1.4 $0.8-1.4 $0.3-0.6
Iniki-Strength Storm $13.9-23.3 $2.7-4.5 $2.6-4.4 $1.1-1.9

Chapter 11 Hurricanes 15
What Determines the Level of Damage During a Hurricane?
Although warning systems and evacuation procedures have improved over the years, the best
way to mitigate damage is to build in areas less susceptible to high winds and flood waters and
their associated hazards, and to upgrade building codes as new construction materials and
techniques become available. The single most important step to mitigate hurricane damage is to
build away from the coast, ridgelines, and exposed hillsides, to build homes with continuous load
paths from the foundation to the uppermost components of the roof, and to minimize external
features such as eaves, balconies, and other structural components that are easily ripped off by
high winds. These breach the envelop of a building and render it vulnerable to further destruction
by the high gusts associated with winds near the eye wall of the storm as it passes across an
island.
The greatest building damage during a hurricane occurs in the area of highest winds and
strongest storm surge. However, it is not so obvious where highest winds and storm surge will
occur. The damage a building may experience depends on several factors: the track of the storm,
position to the left or right of the eye, exposure to the open ocean and free or accelerated airflow,
the topography of the surrounding landscape, and the construction and design of the building.
There is no way of knowing the chances of a hurricane damaging a particular home. We can
only go on past history. Almost no one expected a hurricane as powerful as Iniki to strike
Hawai„i. The best we can guess is that hurricanes in the future will probably hit Hawai„i as
frequently as they have in the past. Unfortunately, this is like driving down the highway looking
in the rearview mirror, not the most desirable way to predict what lies ahead – especially since
the conditions of Pacific climatology appear to be changing with global warming.37
In addition,
increased development, increased alteration of watersheds, and increased loss of beaches add up
to the likelihood of increased property losses in future storms.
These maps show insurance claims island by island. Although they are no predictor of the
future, they do reveal regions on each island that have been subject to the greatest wind-related
damage claims for insurance in the past.

Chapter 11 Hurricanes 16
Homeowner insurance policy claims 1989 to 1999 – by island.38
Chapter 11 Hurricanes 17
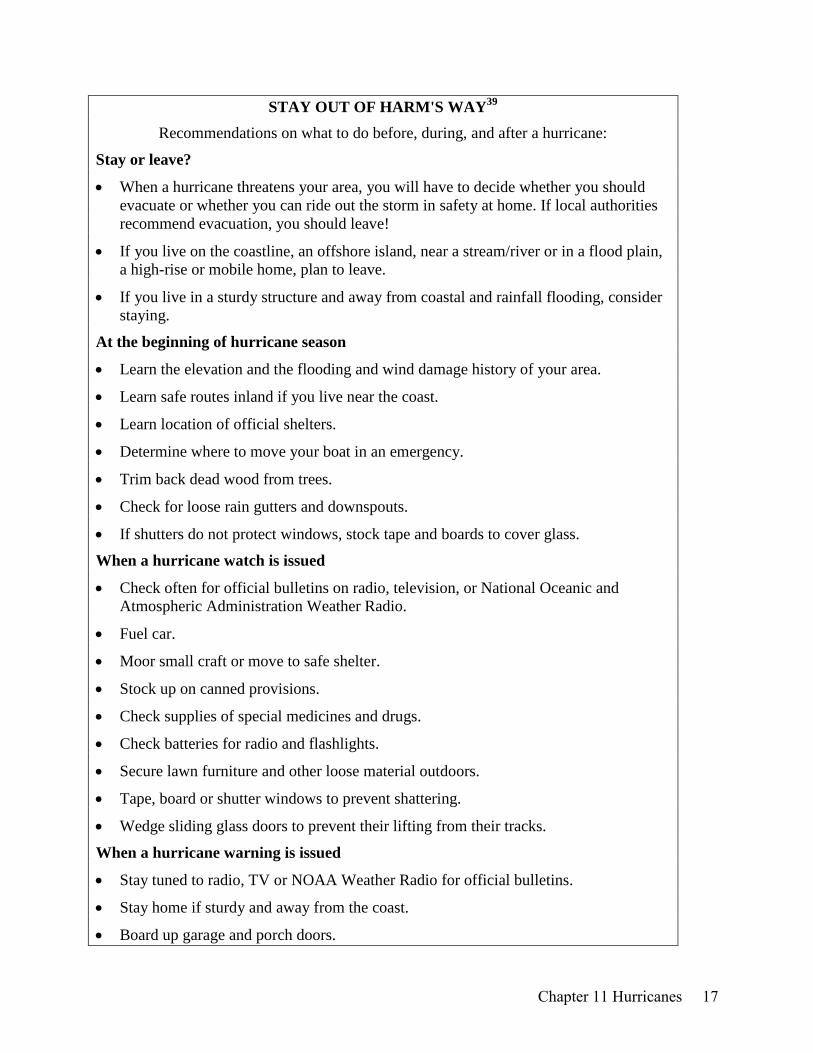
STAY OUT OF HARM'S WAY39
Recommendations on what to do before, during, and after a hurricane:
Stay or leave?
When a hurricane threatens your area, you will have to decide whether you should
evacuate or whether you can ride out the storm in safety at home. If local authorities
recommend evacuation, you should leave!
If you live on the coastline, an offshore island, near a stream/river or in a flood plain,
a high-rise or mobile home, plan to leave.
If you live in a sturdy structure and away from coastal and rainfall flooding, consider
staying.
At the beginning of hurricane season
Learn the elevation and the flooding and wind damage history of your area.
Learn safe routes inland if you live near the coast.
Learn location of official shelters.
Determine where to move your boat in an emergency.
Trim back dead wood from trees.
Check for loose rain gutters and downspouts.
If shutters do not protect windows, stock tape and boards to cover glass.
When a hurricane watch is issued
Check often for official bulletins on radio, television, or National Oceanic and
Atmospheric Administration Weather Radio.
Fuel car.
Moor small craft or move to safe shelter.
Stock up on canned provisions.
Check supplies of special medicines and drugs.
Check batteries for radio and flashlights.
Secure lawn furniture and other loose material outdoors.
Tape, board or shutter windows to prevent shattering.
Wedge sliding glass doors to prevent their lifting from their tracks.
When a hurricane warning is issued
Stay tuned to radio, TV or NOAA Weather Radio for official bulletins.
Stay home if sturdy and away from the coast.
Board up garage and porch doors.

Chapter 11 Hurricanes 18
Move valuables to upper floors.
Bring in pets.
Fill containers (bathtub) with several days' supply of drinking water.
Turn up refrigerator to maximum cold and don't open unless necessary.
Use phone only for emergencies.
Stay indoors on the downwind side of the house, away from windows.
Beware of the eye of the hurricane.
Leave areas that might be affected by storm tide or stream flooding.
Leave early, in daylight if possible.
Shut off water and electricity at main stations.
Take small valuables and papers, but travel light.
Leave food and water for pets (shelters will not take them).
Lock up house.
Drive carefully to nearest designated shelters using recommended evacuation routes.
After the "all-clear" is given
Drive carefully; watch for dangling electrical wires, undermined roads, flooded low
spots.
Don't sight-see.
Report broken or damaged water, sewer and electrical lines.
Use caution when re-entering home. Check for gas leaks. Check for food and water
spoilage.
Mitigation Activities at Home40
Homes can be destroyed by high winds. Flying debris can break windows and doors,
allowing high winds and rain into your house. High winds can also cause weak places in your
home to fail. Strengthen these areas in your house: roofs, exterior doors, windows, and garage
doors. Other mitigation activities include clearing debris from the area and building a safe room
in your home.
Roof:
Gable roofs need additional truss bracing to make your roof system stronger. Truss bracing
consists of 2x4s running the length of your roof and gable-end bracing consists of 2x4s in an X
pattern. Hurricane straps and clips can also keep your roof attached to your walls and are very
inexpensive. For a 1,200 square foot house, hurricane clips might cost between $400 and $600.
Learn more about protective measures from your local home improvement store.

Chapter 11 Hurricanes 19
Exterior Doors:
Most double-entry doors have an active and inactive door. Check to see if the fixed door is
secure enough. Some door manufactures provide reinforcing bolt kits or you can buy and install
door bolt materials. Check with your local home improvement store.
Windows:
There are many types of manufactured storm shutters or you can make your own plywood
shutters. Plywood shutters should be made of 5/8 inch exterior plywood and installed using bolts
and masonry anchors. Remember to cover all exposed windows and glass, even French doors
and skylights. Hurricane shutters cost between $1.67 per square foot to $50.00 per square foot
for motorized roll-up shutters. Check with your local home improvement store.
Garage Doors:
Two-car garage doors pose a problem because they wobble in high winds and can blow out of
their tracks and collapse. Some garage doors can be strengthened with retrofit kits. Installing
horizontal bracing on each can reinforce some garage doors. Backing a car up against the inside
of the garage door in the event of a hurricane can also help resist strong winds. Check with your
local home improvement store.
Clear Debris: Clear debris away from structures, so they do not become airborne missiles. Check with local
officials about tree pruning and clearing for additional information.
Safe Rooms:
There are several options for building a safe room. A safe room made of concrete would have 8-
inch mortar-filled tile walls and a 4-inch concrete ceiling, all supported with iron reinforcing rod.
A wood-framed safe room would have doubled 2-by-4 studs, set 16 inches on center, faced on
one side with ¾-inch plywood and on the other with 12-gauge steel, and sheathed inside and out
with ½-inch gypsum board. Go to your local library for additional information. (mothernature-
hawaii.com)
1 Joseph A. Angelo, Space Technology, pg 213 (Greenwood Publishing Group 2003).
2 Kerry A. Emanuel, Divine Wind: The History and Science of Hurricanes, p 18 (Oxford University Press 2005).
3 See Wikipedia entry for a discussion of Tropical Cyclones: http://en.wikipedia.org/wiki/Tropical_cyclone
4 Image from Wikipedia: http://en.wikipedia.org/wiki/Tropical_cyclone
5 National Weather Service, Climatology of Tropical Cyclones in the Central Pacific Basin:
http://www.prh.noaa.gov/cphc/pages/climatology.php 6 Charles Fletcher et al., Atlas of Natural Hazards in the Hawaiian Coastal Zone, Geological Investigations Series I-
2761 (U.S. Government Printing Office 2002). 7 For more information about the scale, see the National Hurricane Center
http://www.nhc.noaa.gov/aboutsshs.shtml. 8 The CPHC is run by the National Weather Service at NOAA. For more information, see
http://www.prh.noaa.gov/hnl/cphc/. 9 See Tetsuya Theodore Fujita, The Downburst: Microburst and Macroburst (University of Chicago 1985).
10 City and County of Honolulu, Hawaii Hazard Mitigation Forum, O‘ahu, http://www.mothernature-
hawaii.com/county_honolulu/hurricane_what_are-O‘ahu.htm. 11
O‘ahu Civil Defense Agency, 2003 12
See Physical Geography.net Fundamentals eBook. Illustration from
http://www.physicalgeography.net/fundamentals/7u.html

Chapter 11 Hurricanes 20
13
See Chapter 5. 14
Jack Williams, Background: California’s Tropical Storms, USA Today (May 17, 2005). 15
Tropical Storms, supra note 14. 16
Chenoweth, M., and Landsea, C., The San Diego hurricane of 2 October, 1858. Bulletin of the American
Meteorological Society, v. 85, Issue 11, p. 1689-1697. 17
NOAA, CPHC, The 1994 Central Pacific Tropical Cyclone Season,
http://www.prh.noaa.gov/cphc/summaries/1994.php. 18
To see the course Tropical Storm Allison took, see http://www.hpc.ncep.noaa.gov/tropical/rain/allison1989.html. 19
Bryon Norcross, Hurricane Almanac: The Essential Guide to Storms Past, Present and Future, p 74 (Macmillan
2007). 20
Fletcher et al., supra note 6. 21
P.S. Chu and J.X. Wang, Tropical Cyclone Occurrences in the Vicinity of Hawaii: Are the Differences Between
El-Nino and non-El-Nino Year Significant?, J. Climate 10, 2683-89 (1997). 22
Dennis Hwang, Hawaii Coastal Hazard Mitigation Guidebook, p 43 (January 2005). 23
Guidebook, supra note 22. 24
National Oceanic and Atmospheric Administration, NOAA expects slightly below average Central Pacific
hurricane season, May, 19, 2008: http://www.noaanews.noaa.gov/stories2008/20080519_pacific.html 25
Kerry Emanuel, Increasing Destructiveness of Tropical Cyclones Over the Past 30 Years, Nature, Vol. 436 (Aug.
4, 2005). 26
Increasing Destructiveness, supra note 25. 27
Emanuel, K., Sundararajan, R., Williams, J., 2008 Hurricanes and global warming: Results from downscaling
IPCC AR4 simulations; American Meteorological Society, v. 89, issue 3, p. 347-367. 28
P.J. Webster et al., Changes in Tropical Cyclone Number, Duration, and Intensity in a Warming Environment,
Science, Vol. 309, No. 5742, pp 1844-46 (Sep. 16, 2005). 29
The increasing intensity of the strongest tropical cyclones. James B. Elsner, James P. Kossin & Thomas H. Jagger
Nature 455, 92-95(4 September 2008) doi:10.1038/nature07234 30
See NOAA, Central Pacific Hurricane Center, Climatology of Tropical Cyclones in the Central Pacific Basin,
http://www.prh.noaa.gov/cphc/pages/climatology.php 31
County of Kauai, Hawaii Hazard Mitigation Forum, Hurricane, http://www.mothernature-
hawaii.com/text_only/kauai/hurricane_what_are-kauai.htm. 32
Cyclone Season, supra note 17. 33
FEMA, Building Performance: Hurricane Iniki, FIA-23 (Mar. 1993). 34
Cyclone Season, supra note 17. 35
Anthony Sommer, A Decade After the Disaster Iniki, Star Bulletin (Sep. 8, 2002). 36
See: http://www.mothernature-hawaii.com/index.html 37
See Chapter 8 for information on climate change. 38
See: http://www.mothernature-hawaii.com/index.html 39
See: http://starbulletin.com/2002/05/19/news/story2.html 40
See: http://www.mothernature-hawaii.com/index.html