chapter 11: air quality - welcome to nyc.gov
TRANSCRIPT

11-1
Chapter 11: Air Quality
A. INTRODUCTION This chapter examines the potential for direct and indirect air quality impacts associated with the proposed One Vanderbilt development. The proposed actions would facilitate a proposal by the applicant 317 Madison to construct an approximately 1.8 million-gross-square-foot (gsf) (1,299,390-zoning-square-foot [zsf]) mixed-use building. Built to a floor area ratio (FAR) of 30.0, the One Vanderbilt development would contain a mix of uses including office, trading floors, retail, restaurant, transit access, a transit hall at ground level, and rooftop amenity space. Chapter 19, “Conceptual Analysis,” considers the proposed Vanderbilt Corridor and potential future development that could occur in the Corridor beyond the One Vanderbilt site in 2021 and by 2033.
Direct impacts stem from emissions generated by stationary sources at a project site, such as emissions from on-site fuel combustion for heating and hot water systems. Indirect impacts include emissions from motor vehicle trips (“mobile sources”) generated by the project or other changes to future traffic conditions due to a project.
With respect to mobile sources, the maximum hourly incremental traffic with the proposed One Vanderbilt development would not exceed the 2014 City Environmental Quality Review (CEQR) Technical Manual carbon monoxide (CO) screening threshold of 140 peak hour trips at certain nearby intersections in the study area. However, the proposed One Vanderbilt development would exceed the fine particulate matter (PM2.5) emission screening threshold discussed in Chapter 17, Sections 210 and 311 of the CEQR Technical Manual. Therefore, a mobile source analysis for particulate matter was performed.
The proposed One Vanderbilt development would include natural gas-fired boilers and possibly a cogeneration plant. Therefore, a stationary source screening assessment was conducted to evaluate the potential for an impact on air quality with the proposed boiler and cogeneration systems.
PRINCIPAL CONCLUSIONS
As discussed below, the maximum predicted pollutant concentrations and concentration increments from mobile sources would be below the corresponding ambient air quality standards and guidance thresholds. Therefore, the proposed One Vanderbilt development would not have significant adverse impacts from mobile source emissions.
Based on stationary source screening assessments that considered the effect of nitrogen dioxide (NO2) and particulate matter (PM) emissions from the proposed One Vanderbilt development’s fossil fuel-fired combustion sources on pollutant levels, there would be no potential for significant adverse impacts on air quality from the proposed stationary sources for the proposed One Vanderbilt development. An air quality (E) designation (E-357) would require any fossil-

Vanderbilt Corridor and One Vanderbilt
11-2
fuel-fired equipment to utilize natural gas exclusively and to use low NOx burners, to ensure there are no significant adverse air quality impacts.
B. POLLUTANTS FOR ANALYSIS Ambient air quality is affected by air pollutants produced by both motor vehicles and stationary sources. Emissions from motor vehicles are referred to as mobile source emissions, while emissions from fixed facilities are referred to as stationary source emissions. Ambient concentrations of CO are predominantly influenced by mobile source emissions. PM, volatile organic compounds (VOCs), and nitrogen oxides (nitric oxide, or NO, and NO2, collectively referred to as NOx) are emitted from both mobile and stationary sources. Fine PM is also formed when emissions of NOx, sulfur oxides (SOx), ammonia, organic compounds, and other gases react or condense in the atmosphere. Emissions of SO2 are associated mainly with stationary sources, and some sources utilizing non-road diesel such as large international marine engines. On-road diesel vehicles currently contribute very little to SO2 emissions since the sulfur content of on-road diesel fuel, which is federally regulated, is extremely low. Ozone is formed in the atmosphere by complex photochemical processes that include NOx and VOCs. Ambient concentrations of CO, PM, NO2, SO2, and lead are regulated by the U.S. Environmental Protection Agency (EPA) under the Clean Air Act (CAA), and are referred to as ‘criteria pollutants.’ Emissions of VOCs, NOx, and other precursors to criteria pollutants are also regulated by EPA.
CARBON MONOXIDE
CO, a colorless and odorless gas, is produced in the urban environment primarily by the incomplete combustion of gasoline and other fossil fuels. In urban areas, approximately 80 to 90 percent of CO emissions are from motor vehicles. CO concentrations can diminish rapidly over relatively short distances; elevated concentrations are usually limited to locations near crowded intersections, heavily traveled and congested roadways, parking lots, and garages. Consequently, CO concentrations must be predicted on a local, or microscale, basis.
The proposed One Vanderbilt development would not increase traffic volumes in the study area above the CEQR Technical Manual CO screening threshold of 140 peak hour trips at nearby intersections in the study area. Therefore, a mobile source analysis of CO emissions was not conducted.
NITROGEN OXIDES, VOCS, AND OZONE
NOx are of principal concern because of their role, together with VOCs, as precursors in the formation of ozone. Ozone is formed through a series of reactions that take place in the atmosphere in the presence of sunlight. Because the reactions are slow, and occur as the pollutants are advected downwind, elevated ozone levels are often found many miles from sources of the precursor pollutants. The effects of NOx and VOC emissions from all sources are therefore generally examined on a regional basis. The contribution of any action or project to regional emissions of these pollutants would include any added stationary or mobile source emissions.
Compared with the No-Action condition, the proposed One Vanderbilt development would not have a significant effect on the overall volume of vehicular miles traveled in the metropolitan area; therefore, no measurable impact on regional NOx emissions or on ozone levels is predicted.

Chapter 11: Air Quality
11-3
An analysis of emissions of these pollutants from mobile sources was therefore not warranted, which is consistent with CEQR Technical Manual guidelines.
In addition to being a precursor to the formation of ozone, NO2 (one component of NOx) is also a regulated pollutant. Since NO2 is mostly formed from the transformation of NO in the atmosphere, it has mostly been of concern further downwind from large stationary point sources, and not a local concern from mobile sources. (NOx emissions from fuel combustion consist of approximately 90 percent NO and 10 percent NO2 at the source.) However, with the promulgation of the 2010 1-hour average standard for NO2, local sources such as vehicular emissions may become of greater concern for this pollutant.
In terms of emissions of NO2 from mobile sources, the incremental increases in NO2 concentrations are primarily due to relatively small increases in the number of vehicles (as compared to existing or No Build traffic in the study area). This increase would not be expected to significantly affect levels of NO2 experienced near roadways without the proposed One Vanderbilt development.
Potential impacts on local NO2 concentrations from the fuel combustion for the proposed One Vanderbilt development’s boilers and cogeneration systems were evaluated.
LEAD
Airborne lead emissions are currently associated principally with industrial sources. Lead in gasoline has been banned under the Clean Air Act, and therefore, lead is not a pollutant of concern for the proposed One Vanderbilt development. Therefore, an analysis of this pollutant was not warranted.
RESPIRABLE PARTICULATE MATTER—PM10 AND PM2.5
PM is a broad class of air pollutants that includes discrete particles of a wide range of sizes and chemical compositions, as either liquid droplets (aerosols) or solids suspended in the atmosphere. The constituents of PM are both numerous and varied, and they are emitted from a wide variety of sources (both natural and anthropogenic). Natural sources include the condensed and reacted forms of naturally occurring VOCs; salt particles resulting from the evaporation of sea spray; wind-borne pollen, fungi, molds, algae, yeasts, rusts, bacteria, and material from live and decaying plant and animal life; particles eroded from beaches, soil, and rock; and particles emitted from volcanic and geothermal eruptions and from forest fires. Naturally occurring PM is generally greater than 2.5 micrometers in diameter. Major anthropogenic sources include the combustion of fossil fuels (e.g., vehicular exhaust, power generation, boilers, engines, and home heating), chemical and manufacturing processes, all types of construction, agricultural activities, as well as wood-burning stoves and fireplaces. PM also acts as a substrate for the adsorption (accumulation of gases, liquids, or solutes on the surface of a solid or liquid) of other pollutants, often toxic, and some likely carcinogenic compounds.
As described below, PM is regulated in two size categories: particles with an aerodynamic diameter of less than or equal to 2.5 micrometers (PM2.5), and particles with an aerodynamic diameter of less than or equal to 10 micrometers (PM10, which includes PM2.5). PM2.5 has the ability to reach the lower regions of the respiratory tract, delivering with it other compounds that adsorb to the surfaces of the particles, and is also extremely persistent in the atmosphere. PM2.5 is mainly derived from combustion material that has volatilized and then condensed to form

Vanderbilt Corridor and One Vanderbilt
11-4
primary PM (often soon after the release from a source exhaust) or from precursor gases reacting in the atmosphere to form secondary PM.
Diesel-powered vehicles, especially heavy duty trucks and buses, are a significant source of respirable PM, most of which is PM2.5; PM concentrations may, consequently, be locally elevated near roadways with high volumes of heavy diesel powered vehicles.
The boilers and turbines of the proposed One Vanderbilt development would be fueled by natural gas. PM is not the critical pollutant of concern with the combustion of natural gas. Therefore, PM emissions from stationary sources were not analyzed. However, an analysis was conducted to assess the worst case PM2.5 impacts due to the increase in traffic associated with the proposed One Vanderbilt development.
SULFUR DIOXIDE
SO2 emissions are primarily associated with the combustion of sulfur-containing fuels (oil and coal). SO2 is also of concern as a precursor to PM2.5 and is regulated as a PM2.5 precursor under the New Source Review permitting program for large sources. Due to the federal restrictions on the sulfur content in diesel fuel for on-road and non-road vehicles, no significant quantities are emitted from vehicular sources. Vehicular sources of SO2 are not significant and therefore, analysis of SO2 from mobile sources was not warranted.
As part of the proposed One Vanderbilt development, natural gas would be combusted in the proposed boilers and cogeneration systems. The sulfur content of natural gas is negligible; therefore, an analysis of future levels of SO2 with the proposed One Vanderbilt development was not warranted.
C. AIR QUALITY REGULATIONS, STANDARDS, AND BENCHMARKS
NATIONAL AND STATE AIR QUALITY STANDARDS
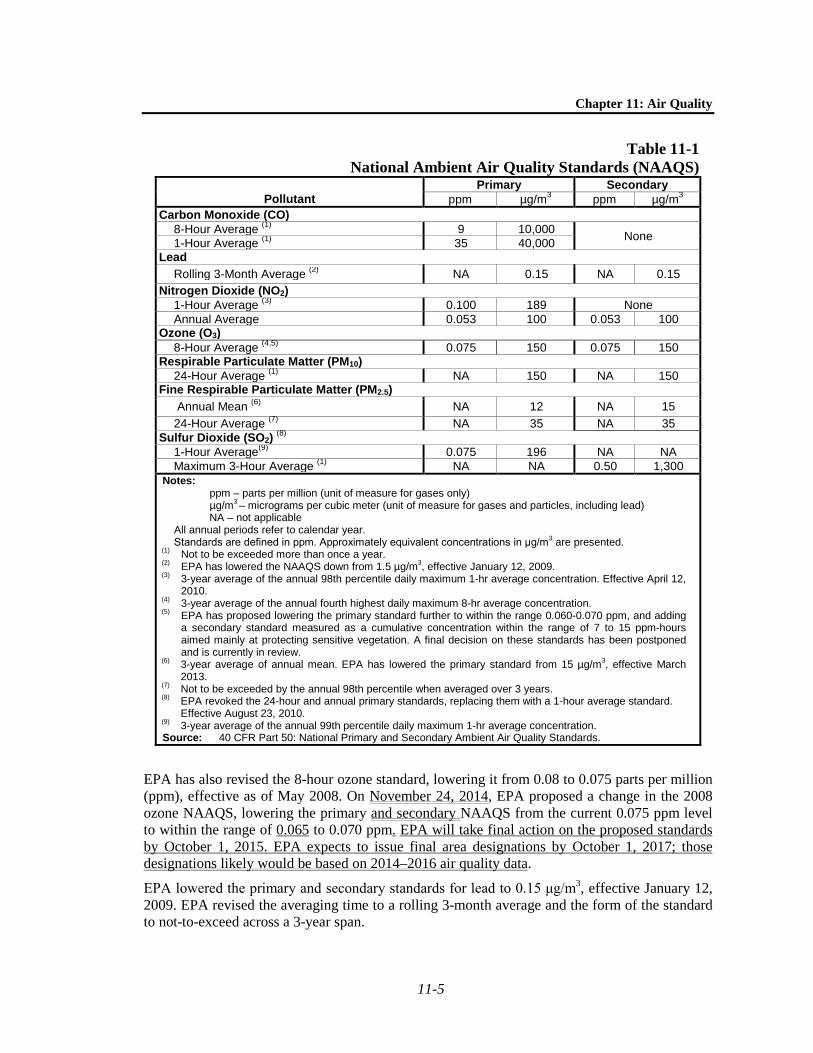
As required by the CAA, primary and secondary National Ambient Air Quality Standards (NAAQS) have been established for six major air pollutants: CO, NO2, ozone, respirable PM (both PM2.5 and PM10), SO2, and lead. The primary standards represent levels that are required to protect the public health, allowing an adequate margin of safety. The secondary standards are intended to protect the nation’s welfare, and account for air pollutant effects on soil, water, visibility, materials, vegetation, and other aspects of the environment. The primary standards are generally either the same as the secondary standards or more restrictive. The NAAQS are presented in Table 11-1. The NAAQS for CO, annual NO2, and 3-hour SO2 have also been adopted as the ambient air quality standards for New York State, but are defined on a running 12-month basis rather than for calendar years only. New York State also has standards for total suspended PM, settleable particles, non-methane hydrocarbons, 24-hour and annual SO2, and ozone which correspond to federal standards that have since been revoked or replaced, and for the noncriteria pollutants beryllium, fluoride, and hydrogen sulfide.
EPA has revised the NAAQS for PM, effective December 18, 2006. The revision included lowering the level of the 24-hour PM2.5 standard from 65 micrograms per cubic meter (µg/m3) to 35 µg/m3 and retaining the level of the annual standard at 15 µg/m3. The PM10 24-hour average standard was retained and the annual average PM10 standard was revoked. EPA lowered the primary annual PM2.5 average standard from 15 µg/m3 to 12 µg/m3, effective March 2013.
Chapter 11: Air Quality
11-5
Table 11-1 National Ambient Air Quality Standards (NAAQS)
Pollutant Primary Secondary
ppm µg/m3 ppm µg/m3 Carbon Monoxide (CO)
8-Hour Average (1) 9 10,000 None 1-Hour Average (1) 35 40,000 Lead
Rolling 3-Month Average (2) NA 0.15 NA 0.15 Nitrogen Dioxide (NO2)
1-Hour Average (3) 0.100 189 None Annual Average 0.053 100 0.053 100
Ozone (O3) 8-Hour Average (4,5) 0.075 150 0.075 150
Respirable Particulate Matter (PM10) 24-Hour Average (1) NA 150 NA 150
Fine Respirable Particulate Matter (PM2.5) Annual Mean (6) NA 12 NA 15 24-Hour Average (7) NA 35 NA 35
Sulfur Dioxide (SO2) (8) 1-Hour Average(9) 0.075 196 NA NA Maximum 3-Hour Average (1) NA NA 0.50 1,300
Notes: ppm – parts per million (unit of measure for gases only) µg/m3 – micrograms per cubic meter (unit of measure for gases and particles, including lead) NA – not applicable
All annual periods refer to calendar year. Standards are defined in ppm. Approximately equivalent concentrations in μg/m3 are presented.
(1) Not to be exceeded more than once a year. (2) EPA has lowered the NAAQS down from 1.5 µg/m3, effective January 12, 2009. (3) 3-year average of the annual 98th percentile daily maximum 1-hr average concentration. Effective April 12,
2010. (4) 3-year average of the annual fourth highest daily maximum 8-hr average concentration. (5) EPA has proposed lowering the primary standard further to within the range 0.060-0.070 ppm, and adding
a secondary standard measured as a cumulative concentration within the range of 7 to 15 ppm-hours aimed mainly at protecting sensitive vegetation. A final decision on these standards has been postponed and is currently in review.
(6) 3-year average of annual mean. EPA has lowered the primary standard from 15 µg/m3, effective March 2013.
(7) Not to be exceeded by the annual 98th percentile when averaged over 3 years. (8) EPA revoked the 24-hour and annual primary standards, replacing them with a 1-hour average standard.
Effective August 23, 2010. (9) 3-year average of the annual 99th percentile daily maximum 1-hr average concentration. Source: 40 CFR Part 50: National Primary and Secondary Ambient Air Quality Standards.
EPA has also revised the 8-hour ozone standard, lowering it from 0.08 to 0.075 parts per million (ppm), effective as of May 2008. On November 24, 2014, EPA proposed a change in the 2008 ozone NAAQS, lowering the primary and secondary NAAQS from the current 0.075 ppm level to within the range of 0.065 to 0.070 ppm. EPA will take final action on the proposed standards by October 1, 2015. EPA expects to issue final area designations by October 1, 2017; those designations likely would be based on 2014–2016 air quality data.
EPA lowered the primary and secondary standards for lead to 0.15 μg/m3, effective January 12, 2009. EPA revised the averaging time to a rolling 3-month average and the form of the standard to not-to-exceed across a 3-year span.

Vanderbilt Corridor and One Vanderbilt
11-6
EPA established a 1-hour average NO2 standard of 0.100 ppm, effective April 12, 2010, in addition to the annual standard. The statistical form is the 3-year average of the 98th percentile of daily maximum 1-hour average concentration in a year.
EPA also established a 1-hour average SO2 standard of 0.075 ppm, replacing the 24-hour and annual primary standards, effective August 23, 2010. The statistical form is the 3-year average of the 99th percentile of the annual distribution of daily maximum 1-hour concentrations (the 4th highest daily maximum corresponds approximately to 99th percentile for a year.)
NAAQS ATTAINMENT STATUS AND STATE IMPLEMENTATION PLANS
The CAA, as amended in 1990, defines non-attainment areas (NAA) as geographic regions that have been designated as not meeting one or more of the NAAQS. When an area is designated as non-attainment by EPA, the state is required to develop and implement a State Implementation Plan (SIP), which delineates how a state plans to achieve air quality that meets the NAAQS under the deadlines established by the Clean Air Act, followed by a plan for maintaining attainment status once the area is in attainment.
In 2002, EPA re-designated New York City as in attainment for CO. Under the resulting maintenance plans, New York City is committed to implementing site-specific control measures throughout the city to reduce CO levels, should unanticipated localized growth result in elevated CO levels during the maintenance period. The second CO maintenance plan for the region was approved by EPA on May 30, 2014.
Manhattan has been designated as a moderate non-attainment area (NAA) for PM10. On December 2, 2013, EPA approved New York State’s withdrawal of the 1995 SIP and redesignation request for the 1987 PM10 NAAQS, and made a clean data finding instead, based on data monitored from 2010-2012 indicating PM10 concentrations well below the 1987 NAAQS. Although not yet a redesignation to attainment status, this determination removes further requirements for related SIP submissions.
The five New York City counties and Nassau, Suffolk, Rockland, Westchester, and Orange Counties, which had been designated as a PM2.5 non-attainment area since 2004 under the CAA due to exceedance of the 1997 annual average standard, were redesignated as in attainment for that standard on April 18, 2014, and are now under a maintenance plan. As stated above, EPA lowered the annual average primary standard to 12 µg/m3 in December 2012. EPA designated the area as in attainment for the new 12 µg/m3 NAAQS effective January 15, 2015.
On April 18, 2014, EPA redesignated the New York City Metropolitan Area, which had been nonattainment with the 2006 24-hour PM2.5 NAAQS since November 2009, as in attainment. The area, now under a maintenance plan for this standard, includes the same 10-county area as the maintenance area for the 1997 annual PM2.5 NAAQS.
Effective June 15, 2004, EPA designated Nassau, Rockland, Suffolk, Westchester, and the five New York City counties (the NY portion of the New York–Northern New Jersey–Long Island, NY-NJ-CT, NAA) as a moderate NAA for the 1997 8-hour average ozone standard (0.08 ppm). Based on recent monitoring data (2007-2011), EPA determined that the NY-NJ-CT nonattainment area has attained the 1997 8-hour ozone NAAQS. Although not yet a redesignation to attainment status, this determination removes further requirements under the 1997 8-hour standard. In March 2008 EPA strengthened the 8-hour ozone standards. EPA designated the New York–Northern New Jersey–Long Island, NY-NJ-CT NAA as a marginal NAA for the 2008 ozone NAAQS, effective July 20, 2012. SIPs are due starting in 2015.

Chapter 11: Air Quality
11-7
New York City is currently in attainment of the annual-average NO2 standard. EPA has designated the entire state of New York as “unclassifiable/attainment” of the 1-hour NO2 standard effective February 29, 2012. Since additional monitoring is required for the 1-hour standard, areas will be reclassified once three years of monitoring data are available (likely 2017).
EPA has established a 1-hour SO2 standard, replacing the former 24-hour and annual standards, effective August 23, 2010. Based on the available monitoring data, all New York State counties currently meet the 1-hour standard. Additional monitoring will be required. Draft attainment designations were published by EPA in February 2013, indicating that EPA is deferring action to designate areas in New York State and expects to proceed with designations once additional data are gathered.
DETERMINING THE SIGNIFICANCE OF AIR QUALITY IMPACTS
The State Environmental Quality Review Act (SEQRA) regulations and CEQR Technical Manual indicate that the significance of a predicted consequence of a project (i.e., whether it is material, substantial, large or important) should be assessed in connection with its setting (e.g., urban or rural), its probability of occurrence, its duration, its irreversibility, its geographic scope, its magnitude, and the number of people affected.1 In terms of the magnitude of air quality impacts, any action predicted to increase the concentration of a criteria air pollutant to a level that would exceed the concentrations defined by the NAAQS (see Table 11-1) would be deemed to have a potential significant adverse impact.
In addition, in order to maintain concentrations lower than the NAAQS in attainment areas, or to ensure that concentrations will not be significantly increased in non-attainment areas, threshold levels have been defined for certain pollutants; any action predicted to increase the concentrations of these pollutants above the thresholds would be deemed to have a potential significant adverse impact, even in cases where violations of the NAAQS are not predicted.
PM2.5 DE MINIMIS CRITERIA
New York State Department of Environmental Conservation (DEC) has published a policy to provide interim direction for evaluating PM2.5 impacts.2 This policy applies only to facilities applying for permits or major permit modifications under SEQRA that emit 15 tons of PM10 or more annually. The policy states that such a project will be deemed to have a potentially significant adverse impact if the project’s maximum impacts are predicted to increase PM2.5 concentrations by more than 0.3 µg/m3 averaged annually or more than 5 µg/m3 on a 24-hour basis. Projects that exceed either the annual or 24-hour threshold will be required to prepare an environmental impact statement (EIS) to assess the severity of the impacts, to evaluate alternatives, and to employ reasonable and necessary mitigation measures to minimize the PM2.5 impacts of the source to the maximum extent practicable.
In addition, New York City uses de minimis criteria to determine the potential for significant adverse PM2.5 impacts under CEQR are as follows:
1 CEQR Technical Manual, Chapter 1, section 222, March 2014; and State Environmental Quality Review
Regulations, 6 NYCRR § 617.7 2 CP33/Assessing and Mitigating Impacts of Fine Particulate Emissions, DEC 12/29/2003.
Vanderbilt Corridor and One Vanderbilt
11-8
• Predicted increase of more than half the difference between the background concentration and the 24-hour standard;
• Annual average PM2.5 concentration increments which are predicted to be greater than 0.1 µg/m3 at ground level on a neighborhood scale (i.e., the annual increase in concentration representing the average over an area of approximately 1 square kilometer, centered on the location where the maximum ground-level impact is predicted for stationary sources; or at a distance from a roadway corridor similar to the minimum distance defined for locating neighborhood scale monitoring stations); or
• Annual average PM2.5 concentration increments which are predicted to be greater than 0.3 µg/m3 at a discrete receptor location (elevated or ground level).
Actions under CEQR predicted to increase PM2.5 concentrations by more than the above de minimis criteria will be considered to have a potential significant adverse impact.
The de minimis criteria have been used to evaluate the significance of predicted impacts of the proposed One Vanderbilt development on PM2.5 concentrations.
D. METHODOLOGY FOR PREDICTING POLLUTANT CONCENTRATIONS
MOBILE SOURCES
The prediction of vehicle-generated emissions and their dispersion in an urban environment incorporates meteorological phenomena, traffic conditions, and physical configuration. Air pollutant dispersion models mathematically simulate how traffic, meteorology, and physical configuration combine to affect pollutant concentrations. The mathematical expressions and formulations contained in the various models attempt to describe an extremely complex physical phenomenon as closely as possible. However, because all models contain simplifications and approximations of actual conditions and interactions, and since it is necessary to predict the reasonable worst-case condition, most dispersion analyses predict conservatively high concentrations of pollutants, particularly under adverse meteorological conditions.
The mobile source analyses for the proposed One Vanderbilt development employ a model approved by EPA that has been widely used for evaluating air quality impacts of projects in New York City, other parts of New York State, and throughout the country. The modeling approach includes a series of conservative assumptions relating to meteorology, traffic, and background concentration levels resulting in a conservatively high estimate of expected pollutant concentrations that could ensue from the proposed One Vanderbilt development.
VEHICLE EMISSIONS
Engine Emissions Vehicular PM engine emission factors were computed using the EPA mobile source emissions model, Motor Vehicle Emission Simulator, or MOVES.
1 This emissions model is capable of calculating engine emission factors for various vehicle types, based on the fuel type (gasoline, diesel, or natural gas), meteorological conditions, vehicle speeds, vehicle age, roadway types,
1 EPA, MOVES Model, User Guide for MOVES2014, December 2014.

Chapter 11: Air Quality
11-9
number of starts per day, engine soak time, and various other factors that influence emissions, such as inspection maintenance programs. The inputs and use of MOVES incorporate the most current guidance available from DEC.
Vehicle classification data were based on field studies. Appropriate credits were used to accurately reflect the inspection and maintenance program.1 County-specific hourly temperature and relative humidity data obtained from DEC were used.
Road Dust PM2.5 emission rates were determined with fugitive road dust to account for their impacts in local microscale analyses. However, fugitive road dust was not included in the neighborhood scale PM2.5 microscale analyses, since the New York City Department of Environmental Protection (DEP) considers it to have an insignificant contribution on that scale. Road dust emission factors were calculated according to the latest procedure delineated by EPA2 and the CEQR Technical Manual.
TRAFFIC DATA
Traffic data for the air quality analysis were derived from existing traffic counts, projected future growth in traffic, and other information developed as part of the traffic analysis for the proposed One Vanderbilt development (see Chapter 10, “Transportation”). Traffic data for the future No-Action and With-Action conditions were used for the respective air quality modeling scenarios. The weekday morning (8 to 9 AM), weekday midday (12 to 1 PM), weekday evening (5 to 6 PM), and Saturday midday (3 to 4 PM) peak periods were analyzed. These time periods were selected for the mobile source analysis because they produce the maximum anticipated project-generated traffic and, therefore, have the greatest potential for significant air quality impacts.
For PM2.5, the weekday morning (AM), weekday midday (MD), weekday evening (PM), and Saturday midday (Saturday MD) peak period traffic volumes were used as a baseline for determining off-peak volumes. Off-peak traffic volumes in the No-Action condition and off-peak increments from the proposed One Vanderbilt development were determined by adjusting the peak period volumes by the 24-hour distributions of actual vehicle counts collected at appropriate locations. For annual impacts, average weekday and weekend 24-hour distributions were used to more accurately simulate traffic patterns over longer periods.
DISPERSION MODEL FOR MICROSCALE ANALYSES
Particulate matter concentrations adjacent to streets within the surrounding area, resulting from vehicle emissions were predicted using the CAL3QHCR model, Version 2.03, which is an extended module of the CAL3QHC model. The CAL3QHC model employs a Gaussian (normal 1 The inspection and maintenance programs require inspections of automobiles and light trucks to
determine if pollutant emissions from each vehicle exhaust system are lower than emission standards. Vehicles failing the emissions test must undergo maintenance and pass a repeat test to be registered in New York State.
2 EPA, Compilations of Air Pollutant Emission Factors AP-42, Fifth Edition, Volume I: Stationary Point and Area Sources, Ch. 13.2.1, NC, http://www.epa.gov/ttn/chief/ap42, January 2011.
3 EPA, User’s Guide to CAL3QHC, A Modeling Methodology for Predicted Pollutant Concentrations Near Roadway Intersections, Office of Air Quality, Planning Standards, Research Triangle Park, North Carolina, EPA-454/R-92-006.

Vanderbilt Corridor and One Vanderbilt
11-10
distribution) dispersion assumption and includes an algorithm for estimating vehicular queue lengths at signalized intersections. CAL3QHC calculates dispersion of emissions from idling and moving vehicles. The queuing algorithm includes site-specific traffic parameters, such as signal timing and delay (from the 2000 Highway Capacity Manual traffic forecasting model), saturation flow rate, vehicle arrival type, and signal actuation (i.e., pre-timed or actuated signal) characteristics to project the number of idling vehicles. The CAL3QHCR module allows for the incorporation of hourly meteorological data into the modeling, instead of worst-case assumptions regarding meteorological parameters and is therefore more appropriate for calculating 24-hour and annual average concentrations.
METEOROLOGY
In general, the transport and concentration of pollutants from vehicular sources are influenced by three principal meteorological factors: wind direction, wind speed, and atmospheric stability. Wind direction influences the direction in which pollutants are dispersed, and atmospheric stability accounts for the effects of vertical mixing in the atmosphere. These factors, therefore, influence the concentration at a particular prediction location (receptor).
Following EPA guidelines1, a Tier II analysis performed with the CAL3QHCR model includes the modeling of hourly concentrations based on hourly traffic data and five years of monitored hourly meteorological data. The data consist of surface data collected at LaGuardia Airport and upper air data collected at Brookhaven, New York for the period 2009–2013. All hours were modeled, and the highest resulting concentration for each averaging period is presented.
ANALYSIS YEAR
The microscale analyses were performed for existing conditions and 2021, the year by which the proposed One Vanderbilt development is likely to be completed. The future analysis was performed both without the proposed One Vanderbilt development (the No-Action condition) and with the proposed One Vanderbilt development (the With-Action condition).
BACKGROUND CONCENTRATIONS
Background concentrations are those pollutant concentrations originating from distant sources that are not directly included in the modeling analysis, which directly accounts for vehicular emissions on the streets within 1,000 feet and in the line of sight of the analysis site. Background concentrations are added to modeling results to obtain total pollutant concentrations at an analysis site.
The background concentrations for the area of the development site are presented in Table 11-2. PM2.5 annual average impacts are assessed on an incremental basis and compared with the PM2.5 de minimis criteria, without considering the annual background. Therefore the annual PM2.5 background is not presented in the table. PM2.5 24-hour average background concentration of 26 µg/m3 (based on the 2011 to 2013 average of 98th percentile concentrations measured at the P.S. 19 monitoring station) was used to establish the de minimis value for the 24-hour increment,
1 Transportation Conformity Guidance for Quantitative Hot-Spot Analyses in PM2.5 and PM10
Nonattainment and Maintenance Areas, EPA Office of Transportation and Air Quality, Publication EPA-420-B-10-040, December 2010.

Chapter 11: Air Quality
11-11
Table 11-2 Maximum Background Pollutant Concentrations
For Mobile Source Sites (μg/m3) Pollutant Average Period Location Concentration NAAQS
PM2.5 24-hour P.S. 19, Manhattan 26 35 PM10 24-hour P.S. 19, Manhattan 40 150
Notes: Consistent with the NAAQS, PM10 concentrations are the 2nd highest of the latest 5 years. Sources: New York State Air Quality Report Ambient Air Monitoring System, DEC, 2009–2013.
consistent with the guidance provided in the CEQR Technical Manual. The 24-hour average background for PM10 is based on the second highest annual concentration measured during the 2009 to 2013 period at the P.S. 19 ambient air monitoring station.
ANALYSIS SITES
Intersections in the study area were reviewed for microscale analysis based on the CEQR Technical Manual guidance. The incremental traffic volumes for the AM, MD, PM, and Saturday MD periods were reviewed and intersections with increments exceeding the PM screening threshold were identified. Of those intersections, two were selected for microscale analysis (see Table 11-3): Site 1 was selected because it is projected to have the largest overall incremental traffic volume; Site 2 represents the site with the largest incremental traffic volume on a low-volume paved road. Low-volume paved roads have higher emissions of road dust.
Table 11-3 Mobile Source Analysis Intersections
Analysis Site Location 1 Park Avenue and East 46th Street 2 Vanderbilt Avenue and East 44th Street
RECEPTOR PLACEMENT
Multiple receptors (i.e., precise locations at which concentrations are predicted) were modeled at each of the selected sites; receptors were placed along the approach and departure links at spaced intervals. Ground-level receptors were placed at sidewalk or roadside locations near intersections with continuous public access, at a pedestrian height of 1.8 meters. Receptors in the analysis models for predicting annual average neighborhood-scale PM2.5 concentrations were placed at a distance of 15 meters from the nearest moving lane at each analysis location, based on the DEP guidance for neighborhood-scale corridor PM2.5 modeling.
STATIONARY SOURCES
Stationary source screening analyses were conducted to evaluate the potential for impacts on air quality from the proposed One Vanderbilt development’s boiler and cogeneration systems. Initially, a screening level analysis was performed following the CEQR Technical Manual procedures to evaluate potential impacts from the proposed One Vanderbilt development. Further analysis was performed using the EPA-approved AERSCREEN model to specifically evaluate potential impacts of 1-hour average NO2 with respect to the recently promulgated NAAQS.

Vanderbilt Corridor and One Vanderbilt
11-12
CEQR SCREENING ANALYSIS
A screening analysis was performed to assess air quality impacts associated with emissions from the proposed One Vanderbilt development’s boiler and cogeneration systems. The screening methodology described in the CEQR Technical Manual was used for the analysis, which determines the threshold of development size below which the action would not have a significant adverse impact.
To assess the effect of emissions from boiler and cogeneration units, the emissions screening analysis methodology described in the Air Quality Appendix of the CEQR Technical Manual was used rather than the screening analysis described in Chapter 17 the CEQR Technical Manual (which uses the total floor area to evaluate potential impacts associated with consumption of fuel for heating and hot water), since in addition to boilers that would supply heat and hot water, the proposed One Vanderbilt development may include cogeneration units that would generate electricity.
The emission screening analysis determines the closest distance beyond which there would be no significant impact using the emissions and the exhaust height. If the nearest building of similar or greater height is beyond the closest allowable distance from the exhaust location, the source passes the emissions-based screening analysis, and no further analysis is warranted. The proposed One Vanderbilt development’s boiler and cogeneration systems would be fueled by natural gas. The principal pollutant of concern from natural gas is NO2.
AERSCREEN ANALYSIS
Potential 1-hour NO2, 24-hour PM2.5 and annual average PM2.5 impacts from the proposed One Vanderbilt development’s boiler system were evaluated using the EPA-approved AERSCREEN model (version 14147, EPA, 2014). AERSCREEN predicts worst-case one-hour impacts downwind from a point, area, or volume source. The model generates worst-case meteorology using representative minimum and maximum ambient air temperatures, and site-specific surface characteristics such as albedo, Bowen ratio, and surface roughness1. The model incorporates the PRIME downwash algorithms that are part of the AERMOD refined model and utilizes the PRIME plume rise model enhancements to the Building Profile Input Program (BPIPRIM) to provide a detailed analysis of downwash influences on direction-specific basis. AERSCREEN also incorporates AERMOD’s complex terrain algorithms and utilizes the AERMAP terrain processor to account for the actual terrain in the vicinity of the source on a direction-specific basis.
The AERSCREEN model was run both with and without the influence of building downwash and with urban diffusion coefficients based on a review of land-use maps of the area to calculate ambient concentrations of NO2 from the proposed One Vanderbilt development. Other model options were selected based on EPA guidance.
Emission Rates and Stack Parameters Based on the current design, the boiler plant would consist of 10 condensing boilers each rated at 180 horsepower, equipped with low-NOx emission burners. The potential cogeneration plant
1 The albedo is the fraction of the total incident solar radiation reflected by the ground surface. The Bowen
ratio is the ratio of the sensible heat flux to the latent (evaporative) heat flux. The surface roughness length is related to the height of obstacles to the wind flow and represents the height at which the mean horizontal wind speed is zero.
Chapter 11: Air Quality
11-13
would consist of two natural-gas-fired reciprocating engines, each rated at 1 megawatt. The boiler and reciprocating engine combustion exhausts would be directed to the top of the proposed building.
The peak 1-hour NO2 and 24-hour PM2.5 emission rates for the boilers were calculated assuming that all the boilers would operate at full capacity, and applying the EPA’s Compilations of Air Pollutant Emission Factors (AP-42)1 emission factors for boilers with low-NOx burners (emitting less than 30 ppm). The average annual boiler emission rate was calculated by scaling down the peak hour emissions to account for a 100-day heating season. Using this methodology, the 1-hour and annual NOx emission rate from boilers was calculated to be 0.28 grams per second (g/s) and 0.08 g/s, respectively. For PM2.5, emission rates were calculated to be 0.06 g/s, and 0.02 g/s on a 24-hour and annual average basis, respectively.
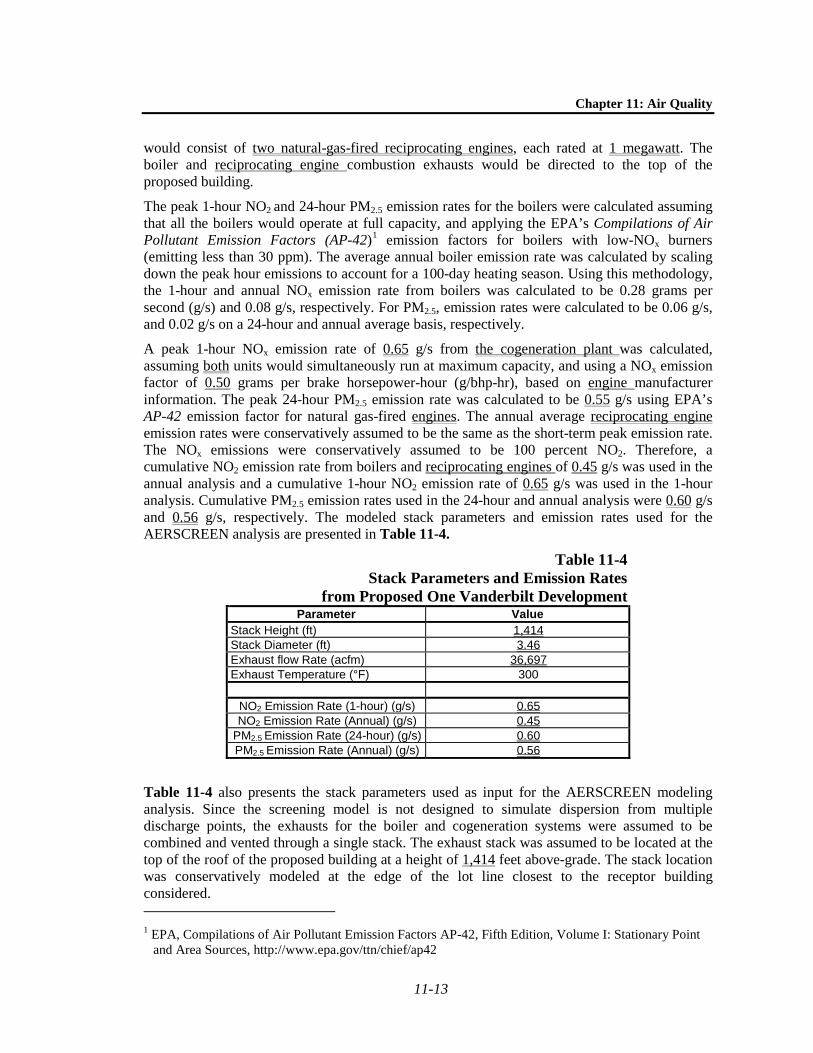
A peak 1-hour NOx emission rate of 0.65 g/s from the cogeneration plant was calculated, assuming both units would simultaneously run at maximum capacity, and using a NOx emission factor of 0.50 grams per brake horsepower-hour (g/bhp-hr), based on engine manufacturer information. The peak 24-hour PM2.5 emission rate was calculated to be 0.55 g/s using EPA’s AP-42 emission factor for natural gas-fired engines. The annual average reciprocating engine emission rates were conservatively assumed to be the same as the short-term peak emission rate. The NOx emissions were conservatively assumed to be 100 percent NO2. Therefore, a cumulative NO2 emission rate from boilers and reciprocating engines of 0.45 g/s was used in the annual analysis and a cumulative 1-hour NO2 emission rate of 0.65 g/s was used in the 1-hour analysis. Cumulative PM2.5 emission rates used in the 24-hour and annual analysis were 0.60 g/s and 0.56 g/s, respectively. The modeled stack parameters and emission rates used for the AERSCREEN analysis are presented in Table 11-4.
Table 11-4 Stack Parameters and Emission Rates
from Proposed One Vanderbilt Development Parameter Value
Stack Height (ft) 1,414 Stack Diameter (ft) 3.46 Exhaust flow Rate (acfm) 36,697 Exhaust Temperature (°F) 300
NO2 Emission Rate (1-hour) (g/s) 0.65 NO2 Emission Rate (Annual) (g/s) 0.45
PM2.5 Emission Rate (24-hour) (g/s) 0.60 PM2.5 Emission Rate (Annual) (g/s) 0.56
Table 11-4 also presents the stack parameters used as input for the AERSCREEN modeling analysis. Since the screening model is not designed to simulate dispersion from multiple discharge points, the exhausts for the boiler and cogeneration systems were assumed to be combined and vented through a single stack. The exhaust stack was assumed to be located at the top of the roof of the proposed building at a height of 1,414 feet above-grade. The stack location was conservatively modeled at the edge of the lot line closest to the receptor building considered. 1 EPA, Compilations of Air Pollutant Emission Factors AP-42, Fifth Edition, Volume I: Stationary Point
and Area Sources, http://www.epa.gov/ttn/chief/ap42
Vanderbilt Corridor and One Vanderbilt
11-14
Meteorological Data The meteorological data used by the AERSCREEN model are generated by the MAKEMET program, which uses application-specific worst-case meteorology, using representative minimum and maximum ambient air temperatures, and site-specific surface characteristics such as albedo, Bowen ratio, and surface roughness to determine worst-case hourly impacts. The default minimum and maximum air temperatures of 250 K and 310 K, a minimum wind speed of 0.5 m/s, and an anemometer height of 10 m were used in the model. Surface characteristics from the LaGuardia meteorological station were also used.
Receptor Locations Receptor information provides the distance from the source, terrain height, and height above ground for selected locations. There are no buildings of similar or greater height within 1,000 feet of the proposed site. The screening analysis considered the effect of the proposed One Vanderbilt development’s stationary source emissions on the MetLife Building, which is the nearest very tall building (a height of approximately 780 feet), approximately 200 feet away from the proposed site. This is conservative since the proposed boiler and cogeneration systems would vent to the roof of the proposed building, which would be significantly taller.
Background Concentrations To estimate the maximum expected pollutant concentration at a given receptor, the predicted impact must be added to a background value that accounts for existing pollutant concentrations from other sources that are not directly accounted for in the model. The 1-hr NO2 background level used in the analysis was based on concentrations monitored at the Queens College 2 DEC ambient air monitoring station. Consistent with the form of the standard for the 1-hour NO2 averaging period, the 3-year average of the annual 98th percentile daily maximum 1-hour average concentration was used. This background concentration, 114 µg/m3, was added to the maximum 1-hour NO2 concentration predicted using the AERSCREEN model to obtain the total 1-hour NO2 concentration.
ADDITIONAL SOURCES
The 2014 CEQR Technical Manual requires an analysis of projects that may result in a significant adverse impact due to certain types of new uses located near a “large” or “major” emissions source. Major sources are defined as those located at facilities that have a Title V or Prevention of Significant Deterioration air permit, while large sources are defined as those located at facilities that require a State Facility Permit.
To assess the potential effects of these types of existing sources on the proposed One Vanderbilt development, a review of existing permitted facilities was conducted. Within a 1,000-foot study area boundary (the distance referenced in the CEQR Technical Manual), sources permitted under NYSDEC’s Title V and State Facility Permit programs were considered. Three potential facilities were identified. After further review, one of the three emissions sources was determined to be beyond 1,000 feet. The two remaining sites consisted of a small cogeneration plant, located approximately 900 feet from the project site, and a diesel generator used for peak load shaving, with the stack exhaust located near ground level, approximately 250 feet from the One Vanderbilt site.
The potential air quality impact of these sources on the proposed One Vanderbilt development is not considered to be significant. The proposed One Vanderbilt development would have office and retail uses and would have sealed windows with ventilation air provided by mechanical air
Chapter 11: Air Quality
11-15
intake fans. Therefore, exposure to pollutants from these and other, minor emission sources in the area would be minimized. However, potential impacts on the proposed public place on Vanderbilt Avenue between East 42nd and 43rd Streets were analyzed due to the proximity of the diesel generator source previously identified (impacts from the other, more distant source are considered to be negligible since it is an elevated source and therefore, impacts at ground level are not critical; furthermore, there is no direct pathway for emissions to affect pollutant concentrations at the proposed ground-level public place).
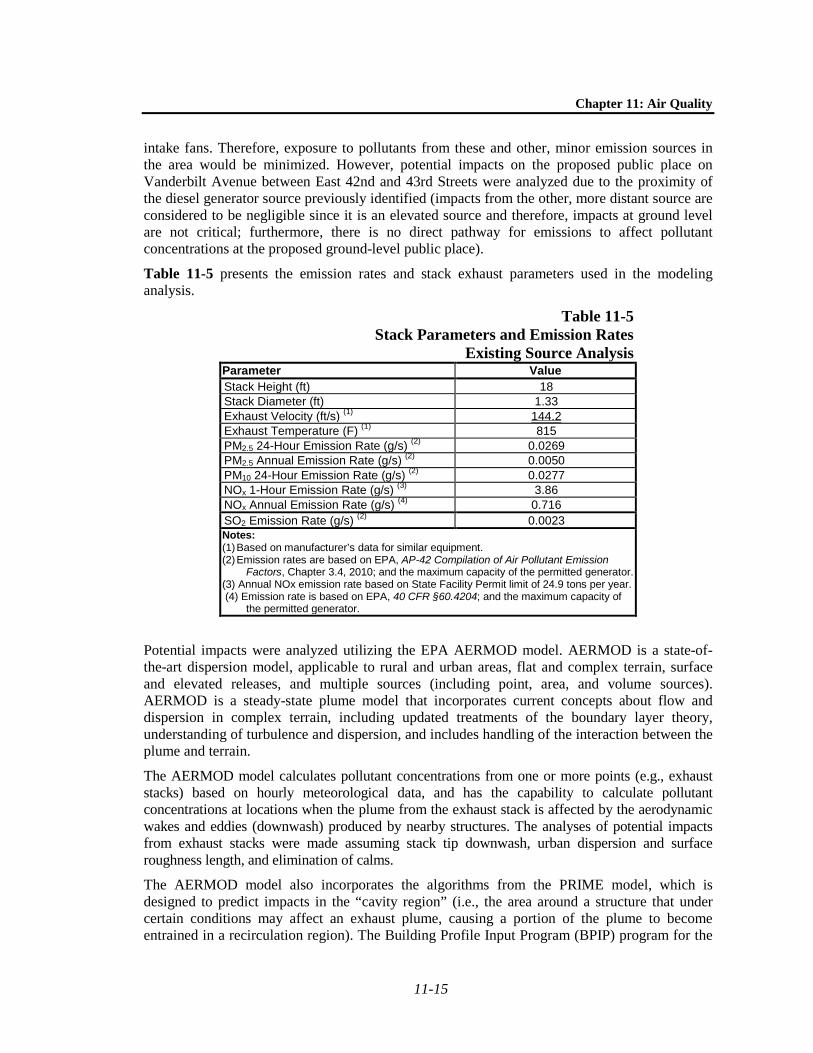
Table 11-5 presents the emission rates and stack exhaust parameters used in the modeling analysis.
Table 11-5 Stack Parameters and Emission Rates
Existing Source Analysis Parameter Value Stack Height (ft) 18 Stack Diameter (ft) 1.33 Exhaust Velocity (ft/s) (1) 144.2 Exhaust Temperature (F) (1) 815 PM2.5 24-Hour Emission Rate (g/s) (2) 0.0269 PM2.5 Annual Emission Rate (g/s) (2) 0.0050 PM10 24-Hour Emission Rate (g/s) (2) 0.0277 NOx 1-Hour Emission Rate (g/s) (3) 3.86 NOx Annual Emission Rate (g/s) (4) 0.716 SO2 Emission Rate (g/s) (2) 0.0023 Notes: (1) Based on manufacturer’s data for similar equipment. (2) Emission rates are based on EPA, AP-42 Compilation of Air Pollutant Emission
Factors, Chapter 3.4, 2010; and the maximum capacity of the permitted generator. (3) Annual NOx emission rate based on State Facility Permit limit of 24.9 tons per year. (4) Emission rate is based on EPA, 40 CFR §60.4204; and the maximum capacity of
the permitted generator.
Potential impacts were analyzed utilizing the EPA AERMOD model. AERMOD is a state-of-the-art dispersion model, applicable to rural and urban areas, flat and complex terrain, surface and elevated releases, and multiple sources (including point, area, and volume sources). AERMOD is a steady-state plume model that incorporates current concepts about flow and dispersion in complex terrain, including updated treatments of the boundary layer theory, understanding of turbulence and dispersion, and includes handling of the interaction between the plume and terrain.
The AERMOD model calculates pollutant concentrations from one or more points (e.g., exhaust stacks) based on hourly meteorological data, and has the capability to calculate pollutant concentrations at locations when the plume from the exhaust stack is affected by the aerodynamic wakes and eddies (downwash) produced by nearby structures. The analyses of potential impacts from exhaust stacks were made assuming stack tip downwash, urban dispersion and surface roughness length, and elimination of calms.
The AERMOD model also incorporates the algorithms from the PRIME model, which is designed to predict impacts in the “cavity region” (i.e., the area around a structure that under certain conditions may affect an exhaust plume, causing a portion of the plume to become entrained in a recirculation region). The Building Profile Input Program (BPIP) program for the

Vanderbilt Corridor and One Vanderbilt
11-16
PRIME model (BPIPRM) was used to determine the projected building dimensions modeling with the building downwash algorithm enabled. The modeling of downwash from sources accounts for all obstructions within a radius equal to five obstruction heights of the stack.
The analysis was performed both with and without downwash in order to assess the worst-case impacts at elevated receptors close to the height of the sources, which would occur without downwash, as well as the worst-case impacts at lower elevations and ground level, which would occur with downwash, consistent with the recommendations in the CEQR Technical Manual.
Annual NO2 concentrations from HVAC sources were estimated using a NO2 to NOx ratio of 0.75, as described in EPA’s Guideline on Air Quality Models at 40 CFR part 51 Appendix W, Section 5.2.4.1 1-Hour average NO2 concentration increments were conservatively estimated using AERMOD assuming all NOx is emitted as NO2.
The methodology used to determine the compliance of total 1-hour NO2 concentrations from the proposed sources with the 1-hour NO2 NAAQS was based on adding the monitored background to modeled concentrations, as follows: hourly modeled concentrations from proposed sources were first added to the seasonal hourly background monitored concentrations; then the highest combined daily 1-hour NO2 concentration was determined at each receptor location and the 98th percentile daily 1-hour maximum concentration for each modeled year was calculated within the AERMOD model; finally the 98th percentile concentrations were averaged over the latest five years. This refined approach to determining the background concentration is referenced in EPA modeling guidance.2
Meteorological Data The meteorological data set consisted of five consecutive years of meteorological data: surface data collected at La Guardia Airport (2009–2013) and concurrent upper air data collected at Brookhaven, New York. The meteorological data provide hour-by-hour wind speeds and directions, stability states, and temperature inversion elevation over the five-year period. These data were processed using the EPA AERMET program to develop data in a format which can be readily processed by the AERMOD model. The land uses around the site where meteorological surface data were available were classified using categories defined in digital United States Geological Survey (USGS) maps to determine surface parameters used by the AERMET program.
Receptor Placement A receptor network (i.e., locations with continuous public access) was developed for the modeling analyses. Discrete receptors were analyzed at publicly accessible ground-level locations within the proposed public place.
Background Concentrations To estimate the maximum expected total pollutant concentrations, the calculated impacts from the emission sources must be added to a background value that accounts for existing pollutant concentrations from other sources (see Table 11-6). The background levels are based on concentrations monitored at the nearest NYSDEC ambient air monitoring stations over the recent five-year period for which data are available, with the exception of PM10, which is based on three years of
1 http://www.epa.gov/scram001/guidance/guide/appw_05.pdf 2 http://www.epa.gov/ttn/scram/guidance/clarification/NO2_Clarification_Memo-20140930.pdf

Chapter 11: Air Quality
11-17
data, consistent with current guidance. For the 1-hour NO2 averaging period, the 3-year average of the annual 98th percentile daily maximum 1-hour average concentration is reported in the table. The 1-hour average SO2 concentration is based on the 3-year average of the annual 99th percentile of the daily maximum 1-hour SO2 concentrations. For the 24-hour PM10 concentration the highest second-highest measured values over the specified period were used. The NO2 annual average background value is the highest measured average concentrations for this pollutant.
Table 11-6 Maximum Background Pollutant Concentrations
For Stationary Source Analysis Pollutant Average Period Location Concentration (μg/m3) NAAQS (μg/m3)
NO2 1-Hour Queens College, Queens 114 188 NO2 Annual Botanical Garden, Bronx 41.0 100 SO2 1-Hour Botanical Garden, Bronx 80.9 196 SO2 3-Hour Botanical Garden, Bronx 67.3(1) 1,300 PM10
24-hour P.S. 19, New York 40 150 PM2.5 24-hour P.S. 19, New York 26 35
Note: (1) 3-hour SO2 background concentrations are based on latest available five years reported (2008-2012). Source: New York State Air Quality Report Ambient Air Monitoring System, NYSDEC, 2008–2013.
PM2.5 impacts are assessed on an incremental basis and compared with the PM2.5 de minimis criteria. The PM2.5 24-hour average background concentration of 26 µg/m3 (based on the 98th percentile concentrations, averaged over 2011 to 2013 was used to establish the de minimis value, consistent with the background concentration provided for P.S. 19 in the CEQR Technical Manual.
E. EXISTING CONDITIONS Recent concentrations of all criteria pollutants at DEC air quality monitoring stations nearest the study area are presented in Table 11-7. All data statistical forms and averaging periods are consistent with the definitions of the NAAQS. It should be noted that these values are somewhat different than the background concentrations presented in Table 11-2.
Table 11-7 Representative Monitored Ambient Air Quality Data
Pollutant Location Units Averaging Period Concentration NAAQS
CO CCNY, Manhattan ppm 8-hour 1.2 9 CCNY, Manhattan 1-hour 1.8 35
SO2 Botanical Garden, Bronx µg/m3 3-hour 67.3 1,300 1-hour 80.9 196
PM10 P.S. 19, Manhattan µg/m3 24-hour 40 150
PM2.5 P.S. 19, Manhattan µg/m3 Annual 11.7 12 24-hour 26 35
NO2 Botanical Garden, Bronx µg/m3 Annual 35 100 Queens College, Queens 1-hour 114 189
Lead IS 52, Bronx µg/m3 3-month 0.005 0.15 Ozone CCNY, Manhattan ppm 8-hour 0.072 0.075
Notes: Based on the NAAQS definitions, the CO and 3-hour SO2 concentrations for short-term averages are the second-highest from the year. PM2.5 annual concentrations are the average of 2011–2013, and the 24-hour concentration is the average of the annual 98th percentiles in 2011- 2013. 8-Hour average ozone concentrations are the average of the 4th highest-daily values from 2011 to 2013. SO2 1-hour and NO2 1-hour concentrations are the average of the 99th percentile and 98th percentile, respectively, of the highest daily 1-hour maximum from 2011 to 2013. The 3-hour SO2 concentration is based on 2012 data, which is the most recent available data from DEC. Source: DEC, New York State Ambient Air Quality Data.

Vanderbilt Corridor and One Vanderbilt
11-18
These existing concentrations are based on recent published measurements, averaged according to the NAAQS (e.g., PM2.5 concentrations are averaged over the three years); the background concentrations are the highest values in past years, and are used as a conservative estimate of the highest background concentrations for future conditions. As shown in the table, there were no monitored violations of the NAAQS for the pollutants at these sites.
F. THE FUTURE WITHOUT THE PROPOSED ACTIONS
MOBILE SOURCES
PM10 concentrations for the No-Action condition were determined using the methodology previously described. Table 11-8 presents the future maximum predicted PM10 24-hour concentrations, including background concentrations, at the analyzed intersections in the No-Action condition. The values shown are the highest predicted concentrations for the receptor locations.
Table 11-8 Maximum Predicted 24-Hour Average
PM10 No-Action Concentrations (µg/m3) Receptor Site Location Concentration
1 Park Avenue and East 46th Street 54.7 2 Vanderbilt Avenue and East 44th Street 48.4
Notes: NAAQS—24-hour average 150 μg/m3. Concentration includes a background concentration of 40.0 µg/m3.
PM2.5 concentrations for the No-Action condition are not presented, since impacts are assessed on an incremental basis.
STATIONARY SOURCES
Absent the proposed actions, the existing buildings will be demolished and it is expected that the 43,313-square-foot One Vanderbilt site will be redeveloped with a single office tower built to the maximum as-of-right density permitted under the existing C5-3 and Midtown Special District zoning regulations (15.0 FAR). The No-Action building will be approximately 678 feet tall and total approximately 811,034 gsf of space. It is anticipated that stationary sources of emissions will be lower than with the proposed actions; however, the height of exhaust stack(s) will be much lower than the exhaust stack assumed with the proposed actions.
G. THE FUTURE WITH THE PROPOSED ACTIONS
MOBILE SOURCES
PM10 concentrations for the With-Action condition were also determined using the methodology previously described. Table 11-9 presents the predicted PM10 24-hour concentrations at the analyzed intersections in the With-Action condition. The values shown are the highest predicted concentrations for the receptor locations and include background concentrations.

Chapter 11: Air Quality
11-19
Table 11-9 Maximum Predicted 24-Hour Average
PM10 Concentrations (µg/m3) Receptor
Site Location No-Action With-Action
1 Park Avenue and East 46th Street 54.7 54.8 2 Vanderbilt Avenue and East 44th Street 48.4 46.9
Notes: NAAQS—24-hour average 150 μg/m3. Concentrations presented include a background concentration of 40.0 µg/m3.
Using the methodology previously described, maximum predicted 24-hour and annual average PM2.5 concentration increments were calculated so that they could be compared with the de minimis criteria. Based on this analysis, the maximum predicted localized 24-hour average and neighborhood-scale annual average incremental PM2.5 concentrations are presented in Tables 11-10 and 11-11, respectively. Note that PM2.5 concentrations in the No-Action condition are not presented, since impacts are assessed on an incremental basis.
Table 11-10 Maximum Predicted 24-Hour Average
PM2.5 Incremental Concentrations Receptor
Site Location Increment (µg/m3) De Minimis
(µg/m3) 1 Park Avenue and East 46th Street 0.03 4.5 2 Vanderbilt Avenue and East 44th Street 0.13 4.5
Note: PM2.5 de minimis criteria — 24-hour average, not to exceed more than half the difference between the background concentration and the 24-hour standard of 35 µg/m3.
Table 11-11 Maximum Predicted Annual Average
PM2.5 Incremental Concentrations (µg/m3) Receptor
Site Location Increment 1 Park Avenue and East 46th Street 0.001 2 Vanderbilt Avenue and East 44th Street 0.012
Note: PM2.5 de minimis criteria—annual (neighborhood scale), 0.1 µg/m3.
The results show that the annual and daily (24-hour) PM2.5 increments are predicted to be below the de minimis criteria. Therefore, there would be no potential for significant adverse impacts on air quality from vehicle trips generated by the proposed One Vanderbilt development.
STATIONARY SOURCES
CEQR SCREENING ANALYSIS
Based on the annual average emission rate, the stack height for the proposed One Vanderbilt development, and Figure 17-9 in the CEQR Technical Manual Air Quality Appendix, the distance beyond which there would be no potential for significant air quality impact from NO2

Vanderbilt Corridor and One Vanderbilt
11-20
emissions would be 160 feet when firing natural gas. There are no buildings of similar or greater height within this distance of the proposed One Vanderbilt development. Therefore, the proposed One Vanderbilt development would not result in any significant adverse air quality impacts on annual NO2 concentrations from boiler and cogenerations systems.
AERSCREEN ANALYSIS
An analysis was performed using the AERSCREEN model to evaluate the 1-hour NO2 and PM2.5 concentrations with the operation of the boiler and cogeneration units proposed for development. The exhaust stack for the boilers and reciprocating engines would be at the top of the proposed building, at a height of approximately 1,414 feet.
The maximum predicted 1-hour NO2 concentration was added to the maximum ambient background concentration and compared with the NAAQS, while PM2.5 concentrations were compared with the PM2.5 de minimis criteria. The results of this analysis are presented in Table 11-12.
Table 11-12 Maximum Modeled Pollutant Concentrations (µg/m3)
Pollutant Averaging Period Maximum Modeled
Impact Background Total
Concentration NAAQS /
De Minimis NO2 1-hour 0.3 114 114.3 188
PM2.5 24-hour 0.15 26 N/A 4.52
Annual 0.02 N/A N/A 0.1/0.3 3
Notes: For the 1-hour NO2 averaging period, the 3-year average of the annual 98th percentile daily maximum 1-hour average concentration was taken from DEC’s New York State Ambient Air Quality Report for 2013. http://www.dec.ny.gov/chemical/8536.html 1 The NO2 background data was taken from Queens College 2 monitoring station. 2 PM2.5 de minimis criteria — 24-hour average, not to exceed more than half the difference between the background concentration and the 24-hour standard of 35 µg/m3. 3 PM2.5 de minimis criteria—annual (discrete receptor), 0.3 µg/m3 and (neighborhood scale), 0.1 µg/m3.
As shown in Table 11-12, the maximum predicted concentration does not exceed the 1-hour NO2 NAAQS standard or PM2.5 de minimis criteria. Therefore, there would be no potential for a significant adverse impact on air quality from the proposed One Vanderbilt development’s boilers and cogeneration systems.
To ensure that there are no significant adverse impacts from the proposed One Vanderbilt development’s boiler and cogeneration system emissions, a restriction would be required regarding fuel type and NOx emissions. The text of the (E) designations (E-357) would be as follows:
• Any new residential and/or commercial development on Block 1277, Lots 20, 27, 46, and 52 pursuant to Section 81-62 of the Zoning Resolution must ensure that fossil fuel-fired boilers and/or cogeneration systems be fitted with low-NOx emission burners firing natural gas, to avoid any potential significant impacts.
ADDITIONAL SOURCES
Potential stationary source impacts on the One Vanderbilt site from the existing source were determined using the AERMOD model. The maximum calculated concentrations from the modeling were added to the background concentrations to estimate total air quality

Chapter 11: Air Quality
11-21
concentrations on the proposed One Vanderbilt development. The results of the AERMOD model analysis for NO2, SO2 and PM10 are presented in Table 11-13. As shown in the table, the maximum predicted pollutant concentrations for all of the pollutant time averaging periods shown are below their respective standards.
Table 11-13 Future Maximum Predicted Concentrations on the
One Vanderbilt Site from Existing Source (in µg/m3)
Pollutant Averaging
Period Concentration Due to Stack Emission
Maximum Background Concentration
Total Concentration Standard
NO2 Annual(1) 1.7 41 42.7 100 1-hour(2) - - 181.8 188
SO2
3-hour 0.15 67.3 67.5 1,300 1-hour 0.15 80.9 81.1 196
PM10 24-hour 1.07 40 41.1 150 Notes: (1) Annual NO2 impacts were estimated using a NO2 /NOx ratio of 0.75. (2) Reported concentration is the maximum total 98th percentile concentration at any receptor using seasonal-hourly background concentrations.
The air quality modeling analysis also determined the highest predicted increase in PM2.5 concentrations. The maximum predicted 24-hour and localized annual average incremental PM2.5 increments are presented in Table 11-14. As presented in Table 11-14, the maximum 24-hour PM2.5 incremental concentration from the existing source was predicted to be 1.04 µg/m3. On an annual basis, the maximum projected PM2.5 increments would be below the applicable PM2.5 de minimis criterion of 0.3 µg/m3 for local impacts.
Table 11-14 Future Maximum Predicted PM2.5 Increments
on the One Vanderbilt Site from Existing Source (in µg/m3) Pollutant Averaging Period Maximum Concentration De Minimis
PM2.5 24-hour 1.04 4.5(1)
Annual (discrete) 0.02 0.3 Note: (1) PM2.5 de minimis criterion — 24-hour average, not to exceed more than half the difference between the background concentration and the 24-hour standard of 35 µg/m3. Therefore, no significant adverse air quality impacts are predicted from nearby large or major sources on the proposed One Vanderbilt development.