chapter 14 financial analysis and long- term financial planning © 2003 john wiley and sons
TRANSCRIPT
Chapter 14
Financial Analysis and Long-Term Financial Planning
© 2003 John Wiley and Sons

2
Chapter Outcomes
Describe what is meant by financial
statement analysis.
Describe the five basic types of financial
ratios.
Indicate what is meant by Du Pont analysis
and indicate its major components.
Explain the importance of the quality of
financial statements.

3
Chapter Outcomes, continued
Describe the link between asset
investment requirements and sales
growth.
Describe how internally generated
financing occurs.
Describe how additional external financing
requirements are determined.
Describe cost-volume-profit analysis.

4
Financial Statement Analysis
Why? Reflects effect of economic and
competitive environment Internal uses by management External uses
– Investors– Suppliers– Lenders

5
Ratio Analysis
Absolute numbers versus ratios Types of ratio analysis
– trend or time series– cross-sectional – industry average
6
Ratio Analysis
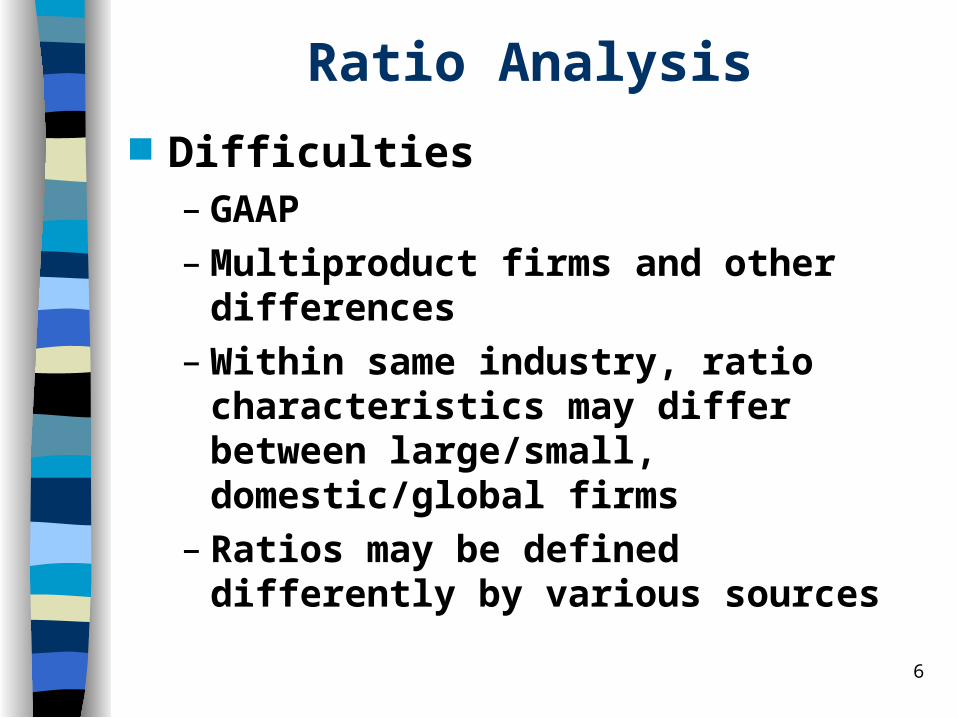
Difficulties– GAAP– Multiproduct firms and other differences– Within same industry, ratio
characteristics may differ between large/small, domestic/global firms
– Ratios may be defined differently by various sources

7
Ratio Analysis
Focus on different ratios depends on user:
– Bank loan officer
– Long-term lender/bondholder
– Equity investor

8
Types of Financial Ratios
Liquidity Asset Management Financial Leverage Profitability Market Value
9
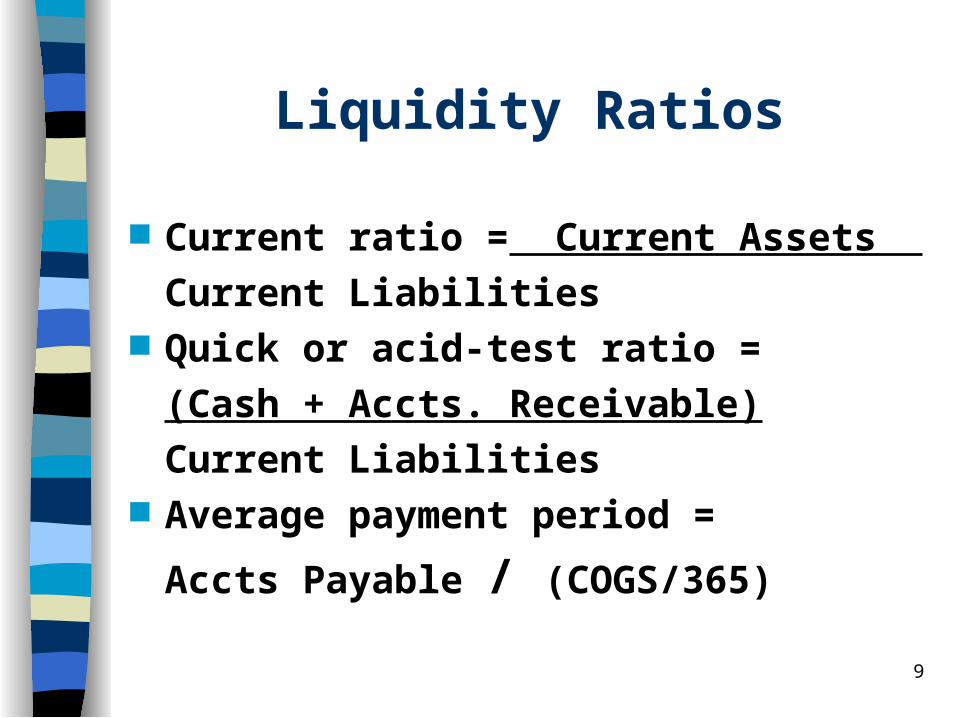
Liquidity Ratios
Current ratio = Current Assets
Current Liabilities Quick or acid-test ratio =
(Cash + Accts. Receivable)
Current Liabilities Average payment period =
Accts Payable / (COGS/365)

10
Asset Management
Total Asset Turnover = Net Sales / Total Assets
Fixed Asset Turnover = Net Sales/Fixed Assets

11
More Asset Management
Average collection period
= Accts Receivable / (Net Sales/365)
Inventory Turnover = Cost of goods sold
Inventory

12
Financial Leverage
Total Debt to Total Assets
= Total Liabilities / Total Assets Total Debt to Equity
= Total Liabilities/Stockholder’s Equity
Equity Multiplier = Total Assets / SE

13
Financial Leverage, continued
Interest Coverage =
EBIT / Interest expense Fixed Charge Coverage =
Earnings before Fixed Charges
Before-tax Fixed Charges Fixed Charges: interest, rent, lease,
sinking fund payments, etc.

14
Profitability Operating Profit Margin
= EBIT / Net Sales Net Profit Margin
= Net Income / Net Sales Operating Return on Assets
= EBIT / Total Assets Return on Assets (ROA)
= Net Income / Total Assets Return on Equity (ROE) = Net Income / Stockholder’s Equity

15
Market Value
Price / earnings (P/E) ratio
Price / book ratio

16
A Note on Quality Financial Statements
Quality Income Statement
Quality Balance Sheet

17
Ratios and Puzzles
Examine ratios to determine a firm’s strengths, weaknesses
Dig deeper to discover cause of disappointing or deteriorating ratios

18
DuPont Method ROA = profit margin x TA turnover
= NI/Sales x Sales/TA Indicates there are two ways to earn
a given level of ROA:
Low PM x High TATO
(grocery store)
High PM x Low TATO
(jewelry store)

19
More DuPont analysis... ROE = ROA x equity multiplier
= (NI / TA) x (TA / equity)
Breaking down ROA into its parts:
Net income x Sales x Assets
Sales Assets Equity

20
Analyzing ROE
ROE can change over time or differ across firms because of differing– profit margins– total asset turnover– financial leverage– some combination of these three
reasons

21
Long-Term Financial Planning
Failing to plan is planning to fail Future growth/asset needs Future financing arrangements
22
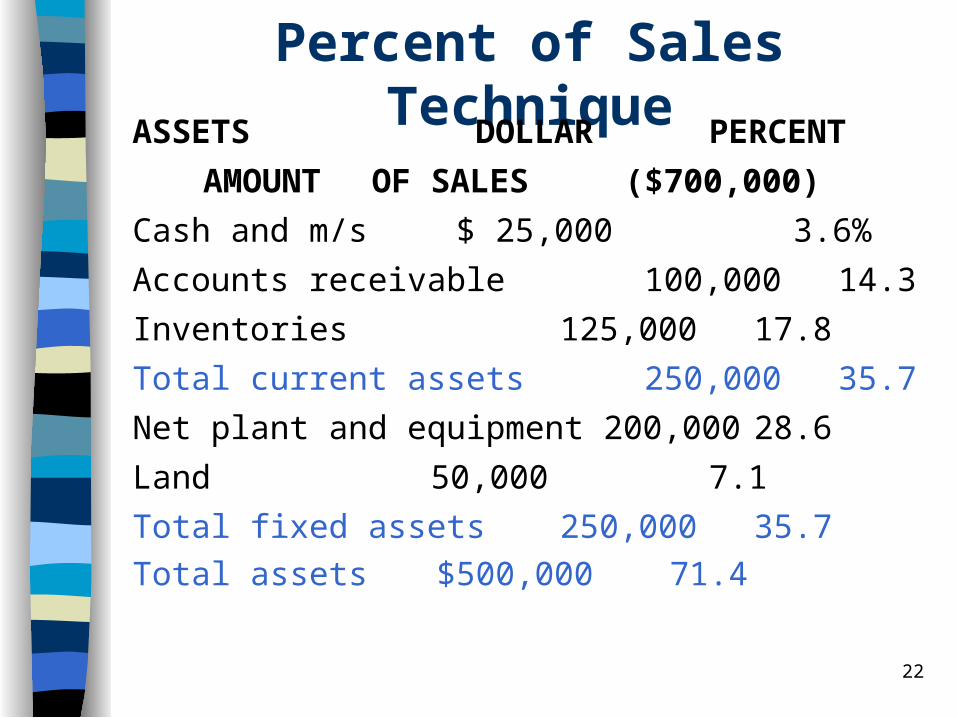
Percent of Sales TechniqueASSETS DOLLAR PERCENT
AMOUNT OF SALES ($700,000)
Cash and m/s $ 25,000 3.6%
Accounts receivable 100,000 14.3
Inventories 125,000 17.8
Total current assets 250,000 35.7
Net plant and equipment 200,000 28.6
Land 50,000 7.1
Total fixed assets 250,000 35.7
Total assets $500,000 71.4
23
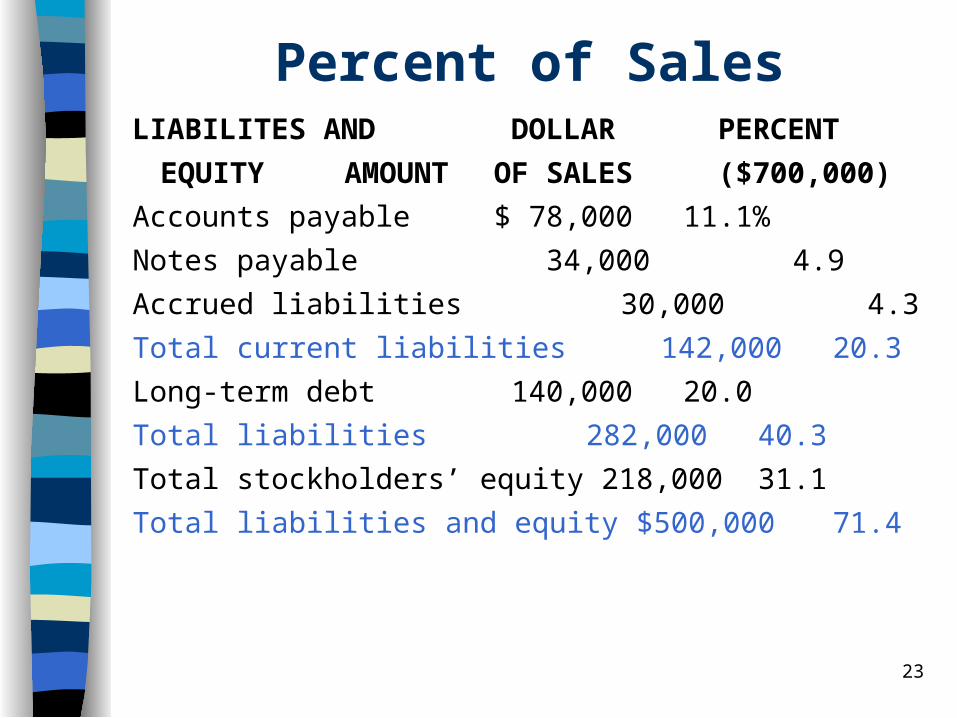
Percent of SalesLIABILITES AND DOLLAR PERCENT
EQUITY AMOUNT OF SALES ($700,000)
Accounts payable $ 78,000 11.1%
Notes payable 34,000 4.9
Accrued liabilities 30,000 4.3
Total current liabilities 142,000 20.3
Long-term debt 140,000 20.0
Total liabilities 282,000 40.3
Total stockholders’ equity 218,000 31.1
Total liabilities and equity $500,000 71.4

24
Using this information to forecast financing needs
Sales forecast:
Forecast asset needs
TA = Sales x (TA percent of sales)
Financing needs
TA = (TL + SE)

25
Getting the funds...
Needed financing can be raised from internal sources external sources
26
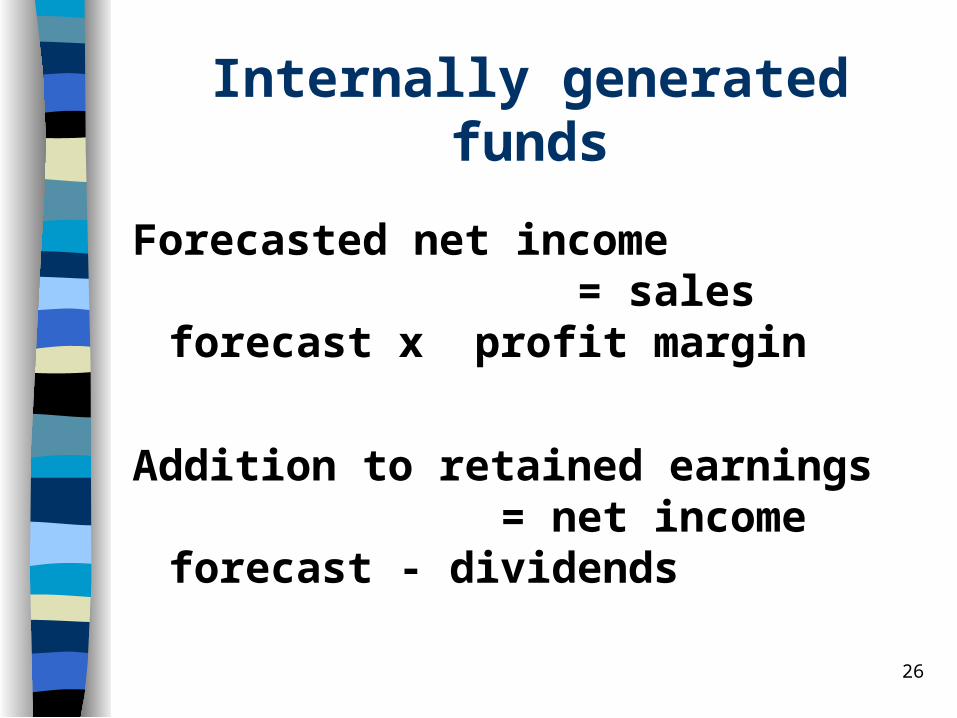
Internally generated funds
Forecasted net income = sales forecast x profit margin
Addition to retained earnings = net income forecast - dividends
27
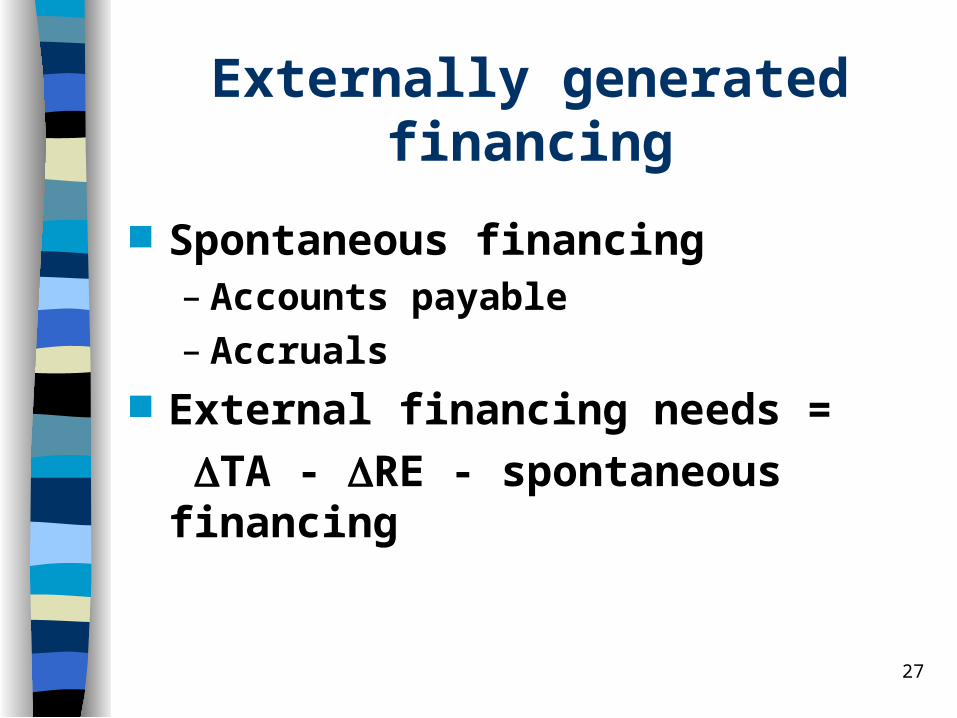
Externally generated financing
Spontaneous financing– Accounts payable– Accruals
External financing needs =
TA - RE - spontaneous financing
28
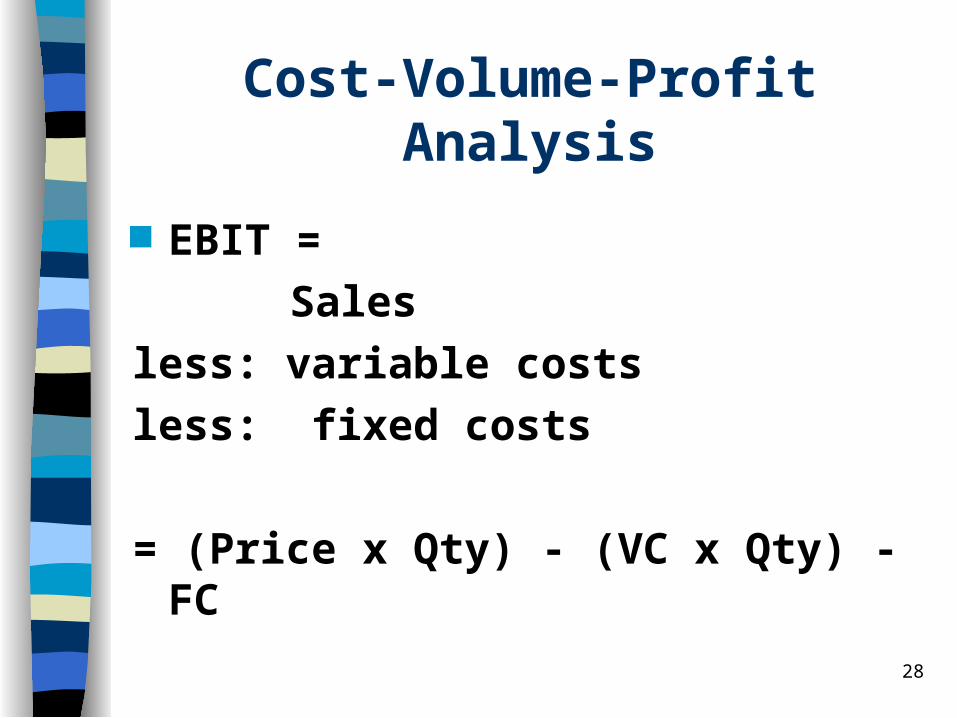
Cost-Volume-Profit Analysis
EBIT =
Sales
less: variable costs
less: fixed costs
= (Price x Qty) - (VC x Qty) - FC

29
Operating Profit Estimates
Given a unit sales or quantity estimate, we can estimate operating profit,
EBIT=(Price x Qty) - (VC x Qty) - FC A special case: Breakeven EBIT=0= (Price x Qty) - (VC x Qty) - FC QtyBE = Fixed Costs
(Price - VC)

30
Fixed Costs and Operating Leverage
Fixed operating costs result in a larger percentage change in EBIT for a given percentage change in sales
Net sales $700,000
Less: variable costs (60% of sales) 420,000
Less: fixed costs 200,000
Earnings before interest
and taxes $ 80,000

31
–10% +10%
Net sales $630,000 $770,000
Less: variable costs (60% of sales)
378,000 462,000
Less: fixed costs 200,000 200,000
EBIT $ 52,000 $108,000
Percent change
in EBIT: –35% +35%
32
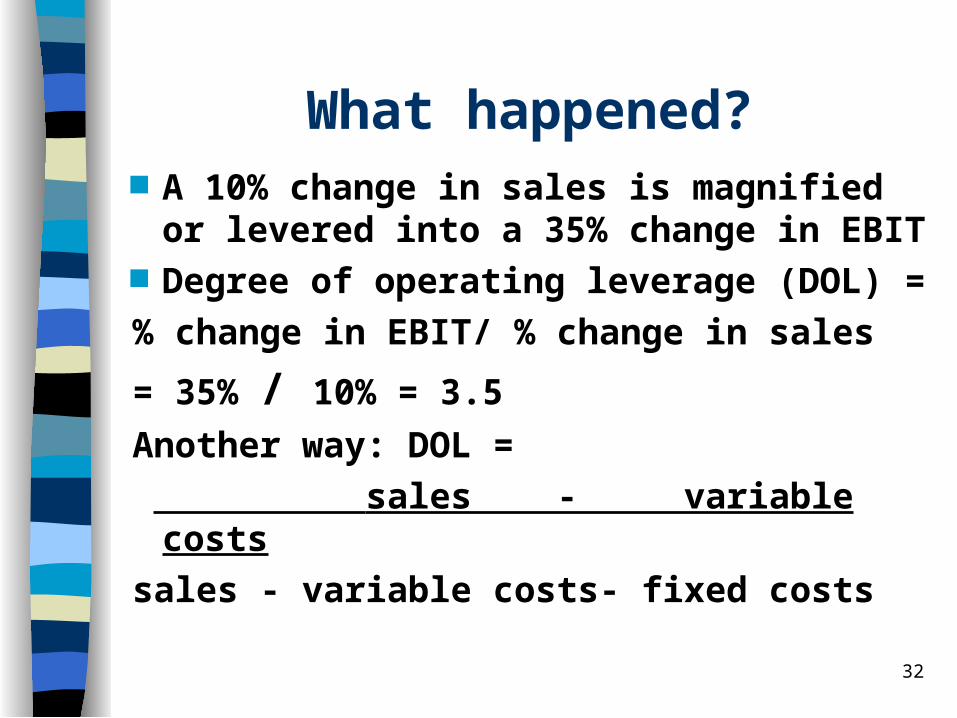
What happened? A 10% change in sales is magnified
or levered into a 35% change in EBIT Degree of operating leverage (DOL) =
% change in EBIT/ % change in sales
= 35% / 10% = 3.5
Another way: DOL =
sales - variable costs
sales - variable costs- fixed costs

33
As fixed costs rise, the leverage effect rises: use FC = $250,000
PERCENT CHANGE IN SALES
–10% base case +10%
Net sales $630,000 $700,000 $770,000
Less: variable costs
(60% of sales)378,000 420,000 462,000
Less: FC 250,000 250,000 250,000
EBIT $ 2,000 $ 30,000 $ 58,000
EBIT % change
from base case –93.3% 93.3%

34
Degree of operating leverage (DOL) =
% change in EBIT / % change in sales
= 93.3% / 10% = 9.33

35
Using DOL
Given DOL, we can estimate the change in operating income for a given change in sales
DOL= %change EBIT/% change sales
%change in EBIT=
% change in sales x DOL

36
Example
Going back to our base case:
Net sales $700,000
Less: variable costs (60% of sales) 420,000
Less: fixed costs 200,000
Earnings before interest
and taxes $ 80,000
Problem: Forecast EBIT if sales are expected to rise 10 percent

37
Forecasting EBIT Sales are expected to rise 10 percent Current EBIT = $80,000 DOL = 3.5%change in EBIT= % change in sales x DOL% change in EBIT = 10% x 3.5 = 35% EBIT estimate = $80,000 +
0.35($80,000)EBIT estimate = $108,000