chapter 15 qspr/qsar analyses by means of the coral...
TRANSCRIPT

560
Copyright © 2015, IGI Global. Copying or distributing in print or electronic forms without written permission of IGI Global is prohibited.
Chapter 15
DOI: 10.4018/978-1-4666-8136-1.ch015
QSPR/QSAR Analyses by Means of the CORAL Software:
Results, Challenges, Perspectives
Andrey A. ToropovIRCCS-Istituto di Ricerche Farmacologiche
Mario Negri, Italy
Alla P. ToropovaIRCCS-Istituto di Ricerche Farmacologiche
Mario Negri, Italy
Emilio BenfenatiIRCCS-Istituto di Ricerche Farmacologiche
Mario Negri, Italy
Orazio NicolottiUniversità degli Studi di Bari “Aldo Moro”, Italy
Angelo CarottiUniversità degli Studi di Bari “Aldo Moro”, Italy
Karel NesmerakCharles University in Prague, Czech Republic
Aleksandar M. VeselinovićUniversity of Niš, Serbia
Jovana B. VeselinovićUniversity of Niš, Serbia
Pablo R. DuchowiczInstituto de Investigaciones Fisicoquímicas
Teóricas y Aplicadas INIFTA (UNLP, CCT La Plata-CONICET), Argentina
Daniel BaceloUniversidad de Belgrano, Argentina
Eduardo A. CastroInstituto de Investigaciones Fisicoquímicas
Teóricas y Aplicadas INIFTA (UNLP, CCT La Plata-CONICET), Argentina
Bakhtiyor F. RasulevJackson State University, USA
Danuta LeszczynskaJackson State University, USA
Jerzy LeszczynskiJackson State University, USA

561
QSPR/QSAR Analyses by Means of the CORAL Software
INTRODUCTION
Almost seventy years ago one of the areas of theoretical chemistry named the quantitative structure – prop-erty / activity relationships (QSPRs/QSARs) was established (Wiener, 1947, pp. 17-20; Wiener, 1948, pp. 425-430). However, if one considers the publication of Hammett’s Free-energy relationship (Hammett, 1935, pp. 125–136) as the first exercise in the QSPR/QSAR analyses, then the introduction of this area of theoretical chemistry should be moved back by eighty years. This is obviously an evidence of the long lasting importance of the QSAR approaches. Such significance is due to their wide applications. The main target of QSPR/QSAR analyses is the prediction of the numerical data related to various endpoints (physicochemical in the case of QSPR; and biochemical, ecological, medicinal, etc., in the case of QSAR).
One can consider three periods of evolution in this field.
1. The first period can be defined as the construction of molecular descriptors and establishing of their correlation with various endpoints (Bonchev & Trinajstic, 1977; Balaban, 1982, pp. 399-404; Bonchev, 1995, pp. 137- 156; Diudea & Gutman, 1998; Ivanciuc, Ivanciuc, & Balaban, 1998; Randic, DeAlba, & Harris, 1998; Castro, Tueros, & Toropov, 2000; Randic & Basak, 2001; Nicolic, Kovacevic, Milicevic, & Trinajstic, 2003; Ren, 2003, pp. 29-39; González, Terán, Teijeira, & González-Moa, 2005; Melagraki, Afantitis, Sarimveis, Igglessi-Markopouloua, & Supuran, 2006).
2. The second period can be defined as the construction of molecular descriptors, establishing of their correlation with an endpoint for the compounds of “visible” training set with the further testing of the predictive potential of this correlation with “invisible” compounds (i.e. compounds which are not involved in building up of the model) involved in the test set (Cronin et al., 2002; Golbraikh & Tropsha, 2002; Taskinen & Yliruusi, 2003; Hemmateenejad, 2004, pp. 475–485; Duchowicz, Castro, Fernandez, & Gonzalez, 2005; Oberg, 2005, pp. 2189–2200; Afantitis et al., 2006; Coi et al., 2006; Leonard & Roy, 2006; Pan, Jiang, & Wang, 2007; Roy & Roy, 2008; Porto, Souza, Junkes, Yunes, & Heinzen, 2008; Toropova, Toropov, Benfenati, Leszczynska, & Leszczynski, 2010; Toropov et al., 2012a; Toropov, Toropova, Raska Jr, Benfenati, & Gini, 2012b; Nesmerak, Toropov, Toropova, & Kohoutova, 2013; Papa, van derWal, Arnot, & Gramatica, 2014).
3. The third period can be defined as building up of the QSPR/QSAR models according to OECD prin-ciples (Kruhlak, Contrera, Daniel Benz, & Matthews, 2007; Kar & Roy, 2010, 2012; Putz, Ionascu, Putz, & Ostafe, 2011; de Melo, 2012, pp. 213–222; Sahigara et al., 2012; Toropova & Toropov, 2014).
ABSTRACT
In this chapter, the methodology of building up quantitative structure—property/activity relationships (QSPRs/QSARs)—by means of the CORAL software is described. The Monte Carlo method is the basis of this approach. Simplified Molecular Input-Line Entry System (SMILES) is used as the representation of the molecular structure. The conversion of SMILES into the molecular graph is available for QSPR/QSAR analysis using the CORAL software. The model for an endpoint is a mathematical function of the correlation weights for various features of the molecular structure. Hybrid models that are based on features extracted from both SMILES and a graph also can be built up by the CORAL software. The conceptually new ideas collected and revealed through the CORAL software are: (1) any QSPR/QSAR model is a random event; and (2) optimal descriptor can be a translator of eclectic information into an endpoint prediction.
562
QSPR/QSAR Analyses by Means of the CORAL Software
According to the OECD principles, the QSPR/QSAR model should be characterized by:
1. A defined endpoint;2. An unambiguous algorithm;3. A defined domain of applicability;4. Clear measures of predictive potential; and5. A mechanistic interpretation, if possible (OECD, 2007).
It was during the second period of the methodology development, when optimal descriptors calculated with the molecular graph were suggested as a tool to solve the QSPR/QSAR tasks (Randic & Basak, 1999, 2001; Randic & Pompe, 2001; Toropov & Toropova, 2002; da Silva Junkes, Arruda, Yunes, Porto, & Heinzen, 2005). In fact, majority of molecular descriptors are not expected to correlate with a certain endpoint, but they can be involved in building up model for arbitrary endpoint. However, the optimal descriptor is aimed to correlate with a certain endpoint via a one-variable correlation.
Interestingly, simplified molecular input-line entry system (SMILES) is an attractive alternative for representation of the molecular structure by graph (Weininger, 1988, pp. 31-36; Weininger, 1990, pp. 237-243; Weininger,Weininger, & Weininger, 1989). There are databases available on the Internet where the molecular structure is represented by SMILES (Toropov, Toropova, Raska Jr, Leszczynska, & Leszczynski, 2014). Under such circumstances, the development of QSPR/QSAR approaches, where SMILES is the representation of the molecular structure becomes an attractive direction of research work in the field of the QSPR/QSAR theory and applications. The CORAL software is a tool of the QSPR/QSAR analyses with representation of the molecular structure by SMILES (Toropova, Toropov, Benf-enati, Leszczynska, & Leszczynski, 2010d; Toropova et al., 2011a,b). It is to be noted that the CORAL software is able to extract from the SMILES various graph theoretical invariants such as vertex degree and extended connectivity of higher orders (Toropov & Toropova, 2002), as well as invariants for the graph of atomic orbitals (Toropov & Toropova, 2001).
The description of:
1. The organization of the CORAL software,2. Results obtained using this software,3. Advantages and disadvantages of the approach, as well as4. Discussion of possible modifications of this software are the main aims of the chapter.
Background
The basic paradigm of the QSPR/QSAR prediction can be expressed as the following:
Endpoint = F(Molecular Structure).
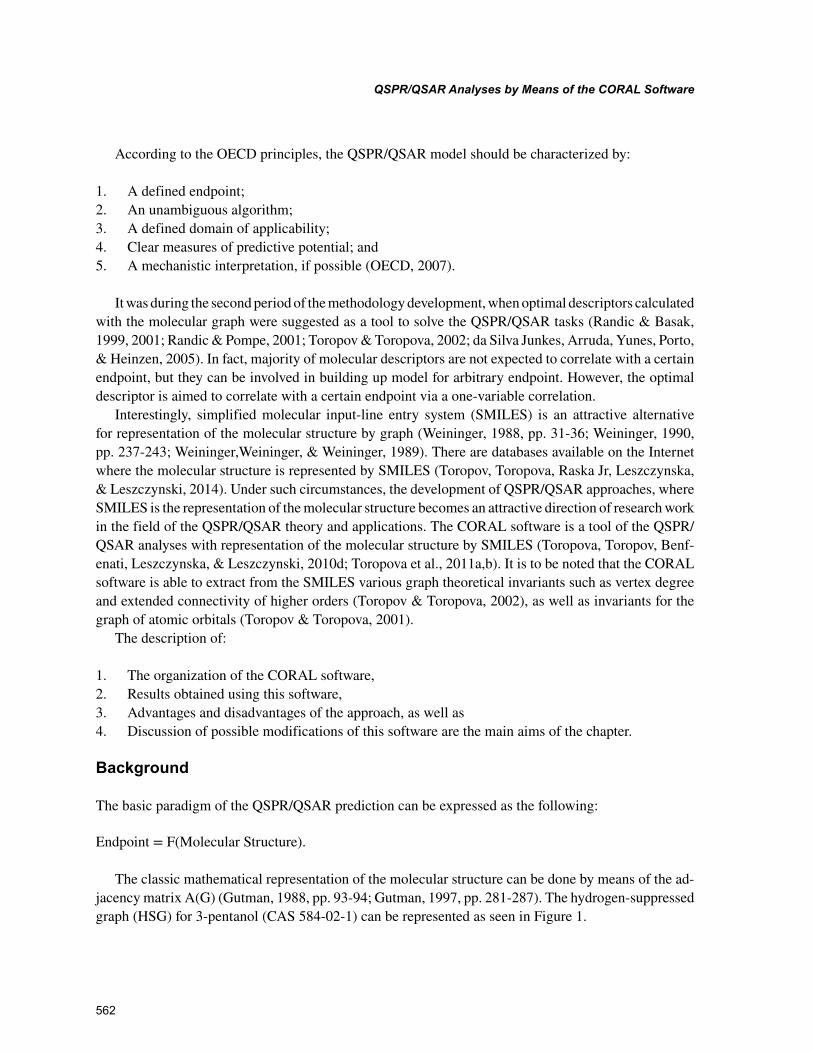
The classic mathematical representation of the molecular structure can be done by means of the ad-jacency matrix A(G) (Gutman, 1988, pp. 93-94; Gutman, 1997, pp. 281-287). The hydrogen-suppressed graph (HSG) for 3-pentanol (CAS 584-02-1) can be represented as seen in Figure 1.

563
QSPR/QSAR Analyses by Means of the CORAL Software
The hydrogen-suppressed graph is characterized by the following adjacency matrix A(HSG):
���������������� ���������������������������������� *A HSG A( ) HHSG( )
1 2 3 4 5 6
1 0 1 0 0 0 0
2 1 0 1 0 0 0
3 0 1 0 1 0 1
4 0 0 1 0 1 0
5 0 0 0 1 0 0
6 0 0 1 0 0 0
1
2
3
2
1
1
1 2δk
33 4 5 6
1 1 0 0 0 0
2 1 1 0 0 0
3 0 1 1 0 1
4 0 0 1 1 0
5 0 0 0 1 0
6 0 0 1 0 0
1
2
3
x
x
x
x
x
y
x
x
kδ*
+++ xxx
x
y
2
1
1
+++
Majority of the molecular descriptors are a mathematical function of the A(HSG), in particular the Randic index (Randic, 1975) is calculated as
1 0 5Xi j
i j edge
= −Σ( )( , )
.δ δ . (1)
The pioneer version of the optimal descriptor (Randic & Basak, 1999; Randic, 2001) is represented by the calculation of classic descriptors using the modified adjacency matrix A*(HSG):
1 0 5Xi j
i j edge
* * *
( , )
.( )= −Σ δ δ . (2)
The next step in the evolution of the optimal descriptors is the application instead of numerical contributions of vertex degrees (δk) the so-called correlation weight of the presence of a certain vertex degree, together with the correlation weight of a certain chemical element (Ak):
0X CW A CWCW k
k kk
= +∑ ∑( ) ( )δ . (3)
Figure 1. The hydrogen-suppressed graph for 3-pentanol (CAS 584-02-1)

564
QSPR/QSAR Analyses by Means of the CORAL Software
The correlation weights are calculated by the Monte Carlo method. The numerical data on the corre-lation weights being used for calculation of the 0XCW should provide maximum of correlation coefficient between the descriptor and a certain endpoint for the training set of compounds. Having the numerical data one can calculate the 0XCW for compounds of the training set and define the model:
Endpoint = C0 + C1 × 0XCW (4)
However, the predictive potential of the model calculated with Equation 4 should be checked up with external test set.
The representation of the molecular structure in databases by adjacency matrix is not convenient and non economical, in comparison to the representation by SMILES string. Consequently, one can define the descriptor similar to the above-mentioned 0XCW which can be calculated with SMILES:
DCW = F(SMILES) (5)
The simplest way is to define the descriptor as a mathematical function of SMILES atoms, i.e. as a mathematical function of each character of SMILES, except situations where two symbols cannot be examined separately (e.g. ‘Cl’, ‘Br’, etc.). In the case of 3-pentanol with SMILES= “CCC(O)CC”, the scheme can be illustrated as the following:
DCW
CW C CW C CW C CW CW O CW CW C
=+ + + + + +(' ') (' ') (' ') ('(') (' ') (') ') (' ')) (' ')
( )
+=
CW C
CW SAk
Σ. (6)
The scheme expressed by Equation 6, can be useful for relatively simple physicochemical proper-ties, such as the normal boiling point of a certain class of organic compounds (alkanes, alkylbenzenes, ethers, etc.). However, in the case of mixture of various classes of organic compounds, or in the case of more complex endpoints (toxicity, carcinogenicity, etc.), the scheme gives poor statistics for both the “visible” training set and for the “invisible” test set. Fortunately, the approach can be improved if in addition to correlation weights of SMILES atoms, combinations of two and / or three SMILES-atoms would be involved in the model.
However, in the cases of two or three SMILES atoms some paradoxical situations occur. For example, SMILES fragment “CN” and “NC” (similarly, “CCN” and “NCC”) will be examined as different mo-lecular features. Fortunately, one can avoid these cases if usees normalized combines of SMILES atoms. A simple way is to select order which obey principle: the first and last characters are placed according to their ASCII codes (Toropov, Toropova, & Benfenati, 2010b). In addition, SMILES attributes which are fragments of molecular structure, the global invariants of the molecular structure are involved to build up a model. These global attributes are a mathematical function of presence (absence) of various molecular features which are represented in Table 1.

565
QSPR/QSAR Analyses by Means of the CORAL Software
Table 1. The scheme of extraction of SMILES atoms and other SMILES attributes in order to build up a model
SMILES Attribute Example of the Representation for the CORAL Software
Sk SMILES-atoms, i.e. one symbol or two symbols which cannot be examined separately, e.g. ‘C’ and ‘Cl’: this information is represented by sequences of twelve symbols:
SSk A combination of two SMILES-atoms ‘CC’ and ‘CN’: this information is represented by sequences of twelve symbols:
SSSk A combination of three SMILES-atoms ‘CNC’ and ‘C#N’: this information is represented by sequences of twelve symbols:
BOND The presence / absence of double (‘=’), triple (‘#’), and stereo chemical (‘@’) bonds, e.g. if SMILES = “CCC(O)CC”
NOSP Presence (absence) of nitrogen, oxygen, sulphur, and phosphorus, e.g. if SMILES=“CCC(O)CC”
HALO Presence (absence) of fluorine, chlorine, bromine, and iodine atoms, e.g. if SMILES=’ClCC(=O)CCl
PAIR Simultaneous presence of two SMILES-atoms from the list: F, Cl, Br, I, N, O, S, P, #, =, and @; e.g. if SMILES=”ClCC(=O)CCl” the following pairs will be extracted:

566
QSPR/QSAR Analyses by Means of the CORAL Software
The above-mentioned Monte Carlo optimization in the case of the unlimited number of epochs will provide maximum of correlation coefficient for the training set. However (Figure 2), a maximum of cor-relation coefficient between optimal descriptor and endpoint for a certain number of the epochs exists for the external test set. This amount of epochs is preferable in calculations, because when the number of epochs reaches such a value the obtained model is characterized by a good predictive potential.
Vice versa, the increase of threshold is accompanied by decrease of the correlation coefficient for the training set, but again, the threshold which provide maximum correlation coefficient for the test set exists. This threshold is preferable from practical point of view. Consequently, in order to prepare a good model by means of the CORAL software, one should define preferable values of the threshold and the number of epochs of the Monte Carlo optimization (T* and N*) (Toropova et al., 2011a).
Table 2. The representations of the molecular structure which can be used to build up a model by means of the CORAL software
The Representation of the Molecular Structure Graphical Interpretation
SMILES CN(C)OC
Hydrogen-Suppressed Graph, HSG
Hydrogen-Filled Graph, HFG
Graph of Atomic Orbitals, GAO

567
QSPR/QSAR Analyses by Means of the CORAL Software
Table 2 contains the list of possible representations of the molecular structure which can be used to build up a model. Thus, the CORAL software is able to provide the following types of QSPR/QSAR models:
1. SMILES Based Models:
SMILESepoch
k k k
DCW Threshold N
CW S CW SS CW SSS
( , )
( ) ( ) ( )
=+ + +∑ ∑ ∑α β γ
xx CW NOSP y CW HALO z CW BOND t CW PAIR⋅ + ⋅ + ⋅ + ⋅( ) ( ) ( ) ( )
; (7)
2. Models Based on the Representation by Molecular Graphs: These are HSG, or HFG, or GAO (Table 2).
Graphepoch k
k k
DCW Threshold N CW A
CW EC CW EC
( , ) ( )
( ) ( )
= +
+ +∑
∑ ∑α β γ0 1 CCW EC CW ECk k
( ) ( )2 3∑ ∑+ δ; (8)
In Equations 7 and 8, coefficients α, β, γ, δ, t, x,y, and z can be 1 (yes) or 0 (no). Various combines of their values give possibility to define certain version of the optimal descriptor;
3. The Hybrid Models which Involves Molecular Feature Extracted from Both Smiles and Graph:
Hybridepoch
SMILESepoch
GrDCW Threshold N DCW Threshold N( , ) ( , )= + aaphepoch
DCW Threshold N( , ) ; (9)
4. Last but not least: the CORAL software is able to provide models for phenomena where eclectic information is the only basis for prediction, e.g. property and activity of proteins (Toropov, Toropova, Raska Jr, Benfenati, & Gini, 2012b) as well as endpoint related to nanomaterials (Toropova & Toropov, 2013). The generalized form of the optimal descriptor which can be used for the above-mentioned situations is the following:
DCW Threshold N CW CIEpoch k
( , ) ( )= Σ (10)
where CIk represent codes of available eclectic data (e.g. concentration, size, condition of synthesis, technological details, etc.).
Selected Technical Details Related to the CORAL Software
There are some limitations of the SMILES in CORAL software. The maximal length for SMILES is 500 symbols; the maximal number of atoms (or atomic orbitals in the case of the graph of atomic orbitals) is equal to 300; the maximal number of compounds (which are involved in building up model) is equal to 50,000.

568
QSPR/QSAR Analyses by Means of the CORAL Software
Development of a Model by Means of the CORAL Software Is Based on the Following Principles
1. Molecular structure of each compound can be represented by molecular features which are extracted from SMILES and/or from molecular graph;
2. There are local and global molecular features which can be extracted from SMILES. The local features represent some fragments (or individual atoms). The global features are some indexes which characterized molecules as whole.
3. Building up of QSPR/QSAR model for an arbitrary split into the training and validation sets can be examined as a random event.
4. The statistical quality of each QSPR/QSAR model is a mathematical function that represents split of the data into the “visible” training set and “invisible” test set.
5. The average statistical quality of QSPR/QSAR models that is obtained for several splits into training and test sets is more robust criterion for the estimation of an approach than the statistical quality for solely one split.
6. The average statistical quality of a model for external “invisible” validation sets is more significant information related to the quality of the model than the average statistical quality for “visible” (i.e. substances involved in building up model) sub-training and calibration sets.
Every model that includes geometry-dependent molecular descriptors usually involves a relatively expensive calculation of the optimum molecular geometry, involving high computational costs and long CPU time. In this context, the conformation-independent 0D, 1D and 2D-QSPR methods emerge as an alternative approach for developing models based on constitutional and topological molecular features of compounds (Duchowich, Comelli, Ortiz, & Castro, 2012; Talevi et al., 2012). The exclu-sion of 3D-structural aspects also avoids problems associated with ambiguities, resulting from an incorrect geometry optimization output due to the existence of compounds in various conformational states. Such kind of problems may also lead to the vanishing of predictive capability of the QSPR/QSAR when applied for the prediction of an external test set of compounds. In the realms of the CORAL approach, the calculated flexible descriptor is a molecular descriptor which depends both on the molecular structure and the property under analysis, but does not explicitly depend on details from the 3D-molecular geometry. In previous QSPR/QSAR studies the importance of this methodol-ogy has been shown. Such approach is able to provide models having a comparable or sometimes better quality than the ones found by searching the best descriptors in a pool containing thousands of 0D-3D descriptors (Mullen, Duchowicz, & Castro, 2011; Garcia et al., 2011; Ibezim, Duchowicz, Ortiz, & Castro, 2012).
THE COLLECTION OF QSPR/QSAR MODELS
Over the years the CORAL software has been used for QSPR/QSAR analyses of a group of various endpoints. The results are listed in the following sections.

569
QSPR/QSAR Analyses by Means of the CORAL Software
Water Solubility of Organic Compounds
Data on water solubility of 1311 substances, i.e. their CAS number, SMILES, and the values of negative logarithm of water solubility –log S (mol / L) were taken from the web site of Virtual Computational Chemistry Laboratory (http://www.vcclab.org/lab/alogps/). These substances were distributed by means of five random splits into the sub-training set (≈55%), calibration set (≈25%), and test set (≈20%). The statistical quality of the CORAL models (Table 3) is better than the statistical quality of the models suggested earlier in the literature for the same large database (Huuskonen, 2000, pp. 773-777; Tetko, Tanchuk, Kasheva, & Villa, 2001; Yan & Gasteiger, 2003). The best prediction is characterized by ntest=21, r2
test=0.91, stest=0.63 (Huuskonen, 2000, pp. 773-777).
Solubility of [C60] and [C70] Fullerene Derivatives
The numerical data on the solubility of [C60] and [C70] fullerene derivatives in chlorobenzene in mg/mL were taken from the literature (Troshin et al., 2009). Unfortunately, since at present, the QSPR analysis of these data by other methods is not available we are not able to compare the obtained results with various approaches.
Octanol/Water Partition Coefficient of Antineoplastic Drugs
The numerical data on octanol/water partition coefficient (logP) for 55 organic compounds have been taken from the literature (Wishart at al., 2008). The CORAL model (Table 3) is better than the model described in the literature (Fouchécourt, Béliveau, & Krishnan, 2001) for the same data (n=55, r2=0.8180).
Half-Wave Potential
The half-wave oxidation/reduction potential is very useful characteristic of electronic properties of the chemical compounds. The first SMILES-based QSPR analysis of half-wave potentials was performed for 40 benzoxazines (Toropov, Nesmerak, Raska Jr., Waisser, & Palat, 2006). The statistical quality this approach (r2 = 0.882) is fully comparable with classical approach based on Hammett constants (r2 = 0.897; Nesmerak, Nemec, Sticha, Waisser, & Palat, 2005). Other example of SMILES-based QSPR of half-wave potential using CORAL software is analysis of experimental data for 23 derivatives of N-benzylsalicylthioamides. From the statistical point of view, the model is comparable with data obtained in the experiment (Nesmerak, Toropov, Toropova, Kohoutova, & Waisser, 2013).
Rate Constants of Reactions between Organic Aromatic Pollutants and Hydroxyl Radical
The degradability of 78 compounds expressed in terms of second-order degradation rate constants, KOH, between OH⋅- and each targeted aromatic compound have been taken from the literature (Kušić, Rasulev, Leszczynska, Leszczynski, & Koprivanac, 2009). Decimal logarithm of the KOH was evaluated as the endpoint for the QSPR models. The model from the above-mentioned work (Kušić, Rasulev, Leszczynska, Leszczynski, & Koprivanac, 2009) is characterized by r2
test=0.760. Hence the statistics of the CORAL model (Table 3) are better, because for four random splits into the training and test sets for the CORAL models (Toropov et al., 2012a) the average r2
test=0.8253.

570
QSPR/QSAR Analyses by Means of the CORAL Software
Table 3. Statistical quality of QSPR/QSAR models for various types of property/activity for selected sets of data calculated with the CORAL software
Endpoint Ntrain r2train strain Ntest r2
test stest Rm2 References
Physicochemical Parameters
Water solubility of organic compounds
721 0.9231 0.565 261 0.9381 0.511 0.8963 Toropov et al., 2013a
Solubility of [C60] and [C70] fullerene derivatives
18 0.758 17.6 9 0.925 12.5 0.902 Toropova et al., 2011b
Octanol/water partition coefficient of antineoplastic drugs
22 0.9306 0.601 12 0.9776 0.727 - Toropov et al., 2010a
Half-wave potential 9 0.7333 0.021 5 0.7295 0.028 0.8294 Nesmerak et al., 2013
Rate Constants of Reactions Between Organic Aromatic Pollutants and Hydroxyl Radical
38 0.8207 0.183 20 0.8033 0.145 0.6731 Toropov et al., 2012a
Biochemical Activities
Toxicity towards Daphnia magna 149 0.7006 1.04 89 0.7680 0.878 0.7413 Toropova et al., 2012a
Toxicity in rats 344 0.7662 0.468 126 0.7237 0.315 0.6388 Toropova et al., 2011a
Toxicity of binary mixtures 14 0.9584 0.167 10 0.9362 0.200 0.7164 CORAL: Models of toxicity of binary mixtures. Chemometrics and Intelligent Laboratory Systems, 119
Carcinogenicity 170 0.6278 0.871 61 0.7576 0.602 - Toropova et al., 2010b
Carcinogenicity of drugs 1088 0.8700 1.46 376 0.8520 1.53 0.835 Toropova & Toropov, 2014
Anticancer agents Murine P388 Leukemia
75 0.7688 0.48 25 0.8025 0.49 - Toropov et al., 2010c
Anticancer agents SK-MEL-5 cell line UACC-62 cell line
19 19
0.9506 0.9409
0.14 0.13
6 6
0.752 0.760
0.36 0.40
- Mullen et al., 2011
Anti-malaria agents aryl-piperazine derivatives
16 0.9960 0.040 6 0.8836 - - Ibezim et al., 2012
Anti-malaria agents 4(1-H)-quinolone derivatives
20 0.7009 0.575 10 0.6130 0.89 0.55 Toropov et al., 2013b
Anti-HIV-1 7 0.8413 0.309 5 0.8379 0.642 - Toropov et al., 2010d
High-affinity 5-HT1A receptors 40 0.9457 0.223 18 0.9473 0.298 0.8325 Veselinovic et al., 2013a
Calcium Channel-Antagonistic Effect
50 0.8507 0.706 22 0.9269 0.521 0.8558 Veselinovic et al., 2013b
Anticonvulsant agents 46 0.7627 0.192 5 0.7001 0.313 0.6428 Garro Martinez et al., 2011
Alkaloid toxicty 26 0.83 0.19 8 0.70 0.44 - Turabekova et al., 2014
Membrane damage TiO2 nanoparticles
10 0.9893 0.025 5 0.9647 0.066 0.90 Toropova & Toropov, 2013

571
QSPR/QSAR Analyses by Means of the CORAL Software
Chromatographic Retention Data
The retention factors of 41 derivatives of 1-phenyl-5-benzylsulfanyltetrazole in reverse-phase HPLC were measured for various compositions of mobile-phase. The retention characteristics of the linear solvent strength model were calculated using the linear relationship between logarithm of retention factor and volume fraction of organic modifier in mobile phase. The logarithms of the solute retention factor extrapolated to a mobile phase composition with 0% organic modifier, and constants for a given solute in a given chromatographic system (i.e. the slopes of the linear regressions) were used as endpoints. The one-variable QSPRs developed show that the CORAL software is a tool for building up a robust quantitative structure-retention relationships (QSRR) model for retention characteristics (Nesmerak, Toropov, & Toropova, 2014).
Toxicity towards Daphnia magna
The descriptions of toxicity of organic chemicals related to 48 h Daphnia magna toxicity expressed in negative decimal logarithm of the dose that kills 50% of organisms i.e. pLC50 were taken from the literature (Kar & Roy, 2010). The data set covers range of octanol/water partition coefficient from −2 to 8. According the values, it could be more possibly logarithms of octanol/water partition coefficient. The range of toxicity (daphnia) is from 0.46 to 10.09. In regard to the chemical domain, the data set includes hydrocarbons, aliphatic alcohols, phenols, ethers, and esters; anilines, amines, nitriles, nitroaromatics, amides, and carbamates; urea and thiourea derivatives; iso-thiocyanates; thiols; phosphorothionate and phosphate esters; and halogenated derivatives. The statistical quality of the model described in the origi-nal article is the following: n=222, r2=0.695 (training set), and n=75, r2
pred=0.741, Rm2 =0.707 (test set).
Thus, the statistical quality of the Coral model (Table 3) is at least comparable with the model suggested in the above-mentioned work (Kar & Roy, 2010).
Toxicity in Rats
Rat toxicity data (LD50, in mg/kg, oral exposure, n=689) was taken from the U.S. Library of Medicine (http://toxnet.nlm.nih.gov/). The log10[1/LD50] has been used as endpoint. Unfortunately, information on QSAR analysis of these data by other approaches is not available. However, comparison of optimal descriptors and Multiple Linear Regression (MLR) has shown (Toropov, Rasulev, & Leszczynski, 2008) that the models for rat toxicity based on optimal descriptors calculated with SMILES have better statistical characteristics than one-, two-, three-, and four-variable MLR models based on the topological and quantum mechanical descriptors.
Toxicity of Binary Mixtures
The numerical data on the toxicity of binary mixtures was taken from the literature (Zhang, Zhou, Yang, & Wang, 2007). The toxicity is expressed as pEC50 (i.e. negative decimal logarithm log[1/EC50]), logarithm of the inverse of the effective concentration required to bring about a 50% decrease in light emission, for Photobacterium phosphoreum (T3 mutation). The statistical quality of four-variables model (calculated with involvement of the quantum mechanical descriptors) suggested in the literature (Zhang, Zhou, Yang, & Wang, 2007) for the toxicity of the same 50 binary mixtures is the following: n=50, r2=0.85, s=0.270. Consequently, the CORAL model for this endpoint provides better results (Table 3).
572
QSPR/QSAR Analyses by Means of the CORAL Software
Carcinogenicity
Experimental values for carcinogenicity were taken from the web site of United States Environmental Protection Agency (http://www.epa.gov/ncct/dsstox/sdf_cpdbas.html). Carcinogenicity is expressed as the potency dose that induces cancer in rats (TD50, in mg/kg body weight). These values have been converted into mmol/kg body weight. The log(TD50) was selected as endpoint for modeling. The cor-relation coefficient of the QSAR for carcinogenicity of 45 benzene derivatives amounts to about r2 = 0.7 (Vracko, 1997, pp.1037–1043). Another QSAR model for rodent carcinogenicity nitroso compounds obtained by multiple linear regression analysis (Helguera, Cordeiro, Pérez, Combes, & González, 2008) has the following statistical characteristics: n=48, r2 = 0.859, s=0.361, F=42 (training set) and n=6, Q2 = 0.71, s=0.488 (test set). The CORAL model for carcinogencity (Table 3) should be consider as com-parable with the above-mentioned models, since the number of examined compounds for the CORAL model is considerable larger.
Carcinogenicity of Drugs
Numerical data on carcinogenic potentials of the selected 1464 organic compounds (chemical domain which includes hydrocarbons, aliphatic alcohols, phenols, ethers, and esters; anilines, amines, nitriles, nitroaromatics, amides, and carbamates; urea and thiourea derivatives, isothiocyanates, thiols, phosphate esters, and halogenated derivatives) are expressed by DF (Discriminate Function). The range of DF is from -9.91 to 9.86. Positive value of DF is an indicator of carcinogenic compound, negative value of DF is an indicator of non-carcinogenic compound. The predictive potentials of QSAR models for the same series of compounds suggested in the literature are characterized by ntest= 732, r2
test=0.713 (Kar & Roy, 2011); and ntest= 732, r2
test=0.77 (Duchowicz, Comelli, Ortiz, & Castro, 2012). Thus the statistical quality of the CORAL model is better than those available in the literature (Table 3).
Anticancer Agents (Murine P388 Leukemia)
The decimal logarithm log(1/IC50), where IC50 represents the concentration of the agent necessary to reduce cell viability by 50% against Murine P388 Leukemia (in vitro cytotoxic activity) is considered as the endpoint. Numerical data on this endpoint was taken from the literature (Atanasova, Ilieva, & Galabov, 2007). The QSAR model suggested in the published work (Atanasova et al., 2007) is character-ized by ntest = 25; r2
test=0.700. Thus, predictive potential of the CORAL model for the anticancer activity is better that the previously published results.
Anticancer Agents (SK-MEL-5 Cell Line and UACC-62 Cell Line)
The observed cell anti-proliferative activities of the triphenylmethyl containing compounds inducing death in the human melanoma cell lines SK-MEL-5 and UACC-62 are extracted from the literature (Palchaudhuri, Nesterenko, & Hergenrother, 2008; Palchaudhuri & Hergenrother, 2008). The models calculated with MLR approch (Mullen, Duchowicz, & Castro, 2011) are characterized by ntrain=17, r2
train=0.781, strain=0.16, ntest=6, r2test=0.243, stest=0.44 (SK-MEL-5); and ntrain=19, r2
train=0.859, strain=0.17, ntest=4, r2
test=0.722, stest=0.30 (UACC-62). It can be compared to the results obtained using CORAL ap-proach, included in the Table 3.

573
QSPR/QSAR Analyses by Means of the CORAL Software
Anti-Malaria Agents (Aryl-Piperazine Derivatives)
The experimental inhibitory concentrations (IC50) in micromolar units of aryl-piperazine derivatives against the chloquine resistant strains W2 and FCR3 and against the chloroquine-sensitive strains D10 and NF54 are extracted from the literature (Molyneaux, Krugliak, Ginsburg, & Chibale, 2005). The QSAR calculated with optimal descriptors gave possibility to suggest some perspective molecular structures of anti-malaria agents.
Anti-Malaria Agents (4(1-H)-Quinolone Derivatives)
A series of 53 endochin analogs (4(1-H)-quinolone derivatives) with anti-malarial activity against the clinically relevant multidrug resistant malarial strain TM-90-C2B has been taken from the literature (Ojha & Roy, 2011). The statistical characteristics of the model suggested in the published work (Ojha & Roy, 2011) are the following: ntrain = 39, r2
train= 0.797, strain = 0.517; ntest = 14, r2test= 0.808. Thus, the statisti-
cal quality of the CORAL model is comparable with the above-mentioned model (Ojha & Roy, 2011).
Anti-HIV-1
The binding affinity values of fullerene derivatives pEC50 were taken from the literature (Durdagi, Mavromoustakos, & Papadopoulos, 2008). The QSAR analysis of these data has shown that even for the case of small set of data, the Monte Carlo technique gives reproducible results. In spite of relative lower statistical quality of the CORAL model for the endpoint, this model provides satisfactory predic-tion for a several splits of the data into the training and test sets. Thus, the optimal descriptors should be considered as reasonable alternative for the 3D QSAR analysis.
High-Affinity 5-HT1A Receptors
A dataset of 88 arylpiperazines considered as high affinity 5-HT1A receptor ligands, to which the in vitro affinity values (as measured by inhibition constants, Ki) were collected from the literature (Martinez-Esparza et al., 2001a,b) was analyzed. The CORAL software is able to be an efficient tool to build up a robust model for affinity of 5-HT1A receptor ligands of arylpiperazines. The suggested modeling process for affinity of 5-HT1A receptor ligands is based on the representation of the mo-lecular structure by SMILES and on the application of experimental data. The predictive potential of the applied approach was tested with four random splits of the data into the training and test sets. In addition, the SMILES attributes, which are promoters of increase/decrease ligand binding affinity to 5- HT1A receptor, were identified. The mechanistic interpretation of these models from probabilistic point of view was suggested.
Calcium Channel-Antagonistic Effect
A dataset of 72 1,4-dihydropyridine derivatives with values for pIC50 was taken from the literature (Gecen, Saripinar, Yanmaz, & Şahin, 2012). Almost identical statistical quality of the QSAR models has been obtained for four different random splits of data. The mechanistic interpretation of these models in terms of promoter increase / decrease of the endpoint was suggested.

574
QSPR/QSAR Analyses by Means of the CORAL Software
Anticonvulsant Agents
The experimental information on the antiepileptic activities ED50 of the molecular structures was obtained from the literature (Eddington et al., 2002, 2003; Edafiogho, Ananthalakshmi, & Kombian, 2006; Cox, Gao, Raje, Scott, & Eddington, 2001a; Cox, Scott, Gao, Raje, & Eddington, 2001b; Vamecq, Lambert, Poupaert, Masereel, & Stables, 1998). The MLR analysis gives preferable accuracy of the two ED50 models (Garro Martinez, Duchowicz, Estrada, Zamarbide, & Castro, 2011) r2
test=0.856 and r2test=0.948.
For this case the CORAL model provides worse results (Table 3).
Anesthetic Activity of Alkaloids
The duration of anesthesia (related to protein binding of a drug) and the onset time (determined by the pKa) are important characteristics in assessment of local anesthetic agents. In the study (Turabekova et al., 2014) we utilized toxicity, duration, and onset of action as endpoints to construct QSAR models for the series of 34 diterpenoid alkaloids characterized by local anesthetic activity using GA-MLRA/PLS and SMILES-based optimal descriptors approach (CORAL). SMILES-based optimal descriptor approach application resulted in models of relatively improved both statistical fit of toxicity and dura-tion of anesthesia models (r2≈85% and r2≈95%, respectively) and predicting ability (≈72%) for all three endpoints. This approach appeared to be more sensitive to structural peculiarities of molecules than regression methods that have to be taken into account in potential data splitting.
Membrane Damage TiO2 Nanoparticles
Large databases related to physicochemical and biological activity of nanomaterials remain scarce. Under such circumstances, the possible way to build up a predictive model is an analysis of eclectic available data on various phenomena related to nanomaterials. As a result of exchange of classic paradigm End-point = F (molecular structure) by paradigm Endpoint = F(eclectic information), an analogy of classic QSPR/QSAR approach applied to nanomaterials can be obtained (Toropova & Toropov, 2013). The data obtained using this approach are provided in the Table 3.
SOLUTIONS AND RECOMMENDATIONS
The variety of QSPR/QSAR models developed with the CORAL software indicates that this approach can be an efficient tool of the QSPR/QSAR analyses. However, it is to be noted, there are problems related to utilization of the CORAL software.
Problem 1: The involvement of combinations of two and three SMILES atoms in building up a model can lead to appearance of SMILES attributes (Table 1) with unclear physical meaning, e.g.:

575
QSPR/QSAR Analyses by Means of the CORAL Software
\...1.......
=...2.......
=...1...(...
[.../.......
[...=.......
Problem 2: The approach is able to detect three-atom fragments as basis for the mechanistic interpreta-tion. In reality, an active fragment can involve larger number of atoms.
Problem 3: If all SMILES contain certain, an indeed active fragment, this fragment cannot be recognized by the CORAL software as an active one.
Problem 4: If an active fragment is rare, the fragment cannot be recognized by CORAL software as an active one.
However, a preliminary analysis and classification (filtration) of dataset can help to solve these problems, at least partially.
FUTURE RESEARCH DIRECTIONS
The recently published works have shown, that the CORAL software can be a tool of QSPR/QSAR analyses for other endpoints in addition to results listed in Table 3 (Singh and Gupta, 2014; Achary, 2014, pp. 73-90; Worachartcheewan, Nantasenamat, Isarankura-Na-Ayudhya, &Prachayasittikul, 2014).
QSAR Prediction Reporting Format (QPRF) (version 1.1, May 2008) available on the Internet http://ihcp.jrc.ec.europa.eu/our_labs/predictive_toxicology/qsar_tools/qrf/QPRF_version_1%201_DEREK_SS.pdf is multi-component system. Most likely, the system can be useful and attractive for the case of standardized situations. However, in order to be widely applied as a research tool, it is preferable to use OECD principles together with the following probabilistic rules:
1. A QSPR/QSAR model should be represented for a group of splits of data into the “visible” training set (compounds involved in the modeling process) and the “invisible” test set (compounds which are not involved in the modeling process);
2. The splits should be random and different (they should be far from identity). The Monte Carlo technique in general, and the CORAL software in particular, can be basis for the QSAR Prediction Reporting Format, at least for the first steps of the QSPR/QSAR analyses of ecologic, pharmacologic and other systems of endpoints which are characterized by high complexity and wide prevalence.

576
QSPR/QSAR Analyses by Means of the CORAL Software
CONCLUSION
The CORAL software can be considered as an universal tool for the QSPR/QSAR analysis. As all software packages the CORAL has certain advantages and disadvantages. The software provides the following options:
1. QSPR/QSAR analysis for data represented in format described at http://www.insilico.eu/coral;2. The analyses should be carried out using a number of various data splits;3. The software can be involved in build up models for phenomena characterized by eclectic informa-
tion. Thus, the most important advantages of the approach are:a. The possibility of analysis of a QSPR/QSAR as a random event (not unique action); andb. The possibility of the translation of eclectic information into endpoint prediction.
ACKNOWLEDGMENT
We thank the EC project NANOPUZZLES (Project Reference: 309837). D.L. and J.L. acknowledge support from the National Science Foundation (NSF/CREST HRD-0833178). E.A.C., D.E.B. and P.R.D. thank for the financial support provided by the National Research Council of Argentina (CONICET) PIP11220100100151 project and to Ministerio de Ciencia, Tecnología e Innovación “Productiva for the electronic library facilities.”
REFERENCES
Achary, P. G. R. (2014). Simplified molecular input line entry system-based optimal descriptors: QSAR modelling for voltage-gated potassium channel subunit Kv7.2. SAR and QSAR in Environmental Research, 25(1), 73–90. doi:10.1080/1062936X.2013.842930 PMID:24580100
Afantitis, A., Melagraki, G., Sarimveis, H., Koutentis, P. A., Markopoulos, J., & Igglessi-Markopoulou, O. (2006). Prediction of intrinsic viscosity in polymer–solvent combinations using a QSPR model. Polymer, 47(9), 3240–3248. doi:10.1016/j.polymer.2006.02.060
Atanasova, M., Ilieva, S., & Galabov, B. (2007). QSAR analysis of 1,4-dihydro-4-oxo-1-(2-thiazolyl)-1,8-naphthyridines with anticancer activity. European Journal of Medicinal Chemistry, 42(9), 1184–1192. doi:10.1016/j.ejmech.2007.01.029 PMID:17408810
Balaban, A. T. (1982). Highly discriminating distance-based topological index. Chemical Physics Let-ters, 89(5), 399–404. doi:10.1016/0009-2614(82)80009-2
Bonchev, D. (1995). Topological order in molecules 1. Molecular branching revisited. Journal of Mo-lecular Structure THEOCHEM, 336(2-3), 137–156. doi:10.1016/0166-1280(94)04081-3

577
QSPR/QSAR Analyses by Means of the CORAL Software
Bonchev, D., & Trinajsti, N. (1977). Information theory, distance matrix, and molecular branching. The Journal of Chemical Physics, 67(10), 4517–4533. doi:10.1063/1.434593
Castro, E. A., Tueros, M., & Toropov, A. A. (2000). Maximum topological distances based indices as molecular descriptors for QSPR 2 — Application to aromatic hydrocarbons. Computers & Chemistry, 24(5), 571–576. doi:10.1016/S0097-8485(99)00095-9 PMID:10890366
Coi, A., Massarelli, I., Murgia, L., Saraceno, M., Calderone, V., & Bianuccia, A. M. (2006). Prediction of hERG potassium channel affinity by the CODESSA approach. Bioorganic & Medicinal Chemistry, 14(9), 3153–3159. doi:10.1016/j.bmc.2005.12.030 PMID:16426850
Cox, D. S., Gao, H., Raje, S., Scott, K. R., & Eddington, N. D. (2001a). Enhancing the permeation of marker compounds and enaminone anticonvulsants across Caco-2 monolayers by modulating tight junc-tions using zonula occludens toxin. European Journal of Pharmaceutics and Biopharmaceutics, 52(2), 145–150. doi:10.1016/S0939-6411(01)00172-2 PMID:11522479
Cox, D. S., Scott, K. R., Gao, H., Raje, S., & Eddington, N. D. (2001b). Influence of multidrug resistance (MDR) proteins at the blood-brain barrier on the transport and brain distribution of enaminone anticon-vulsants. Journal of Pharmaceutical Sciences, 90(10), 1540–1552. doi:10.1002/jps.1104 PMID:11745712
Cronin, M. T. D., Aptula, A. O., Judith, C., Duffy, J. C., Netzeva, T. I., & Rowe, P. H. et al. (2002). Comparative assessment of methods to develop QSARs for the prediction of the toxicity of phenols to Tetrahymena pyriformis. Chemosphere, 49(10), 1201–1221. doi:10.1016/S0045-6535(02)00508-8 PMID:12489717
da Silva Junkes, B., Arruda, A. C. S., Yunes, R. A., Porto, L. C., & Heinzen, V. E. F. (2005). Semi-empirical topological index: A tool for QSPR/QSAR studies. Journal of Molecular Modeling, 11(2), 128–134. doi:10.1007/s00894-004-0231-8 PMID:15723207
de Melo, E. B. (2012). A new quantitative structure–property relationship model to predict biocon-centration factors of polychlorinated biphenyls (PCBs) in fishes using E-state index and topological descriptors. Ecotoxicology and Environmental Safety, 75, 213–222. doi:10.1016/j.ecoenv.2011.08.026 PMID:21959189
Diudea, M. V., & Gutman, I. (1998). Wiener-type topological indices. Croatica Chemica Acta, 71(1), 21–51.
Duchowicz, P. R., Castro, E. A., Fernandez, F. M., & Gonzalez, M. P. (2005). A new search algorithm for QSPR/QSAR theories: Normal boiling points of some organic molecules. Chemical Physics Letters, 412(4-6), 376–380. doi:10.1016/j.cplett.2005.07.016
Duchowicz, P. R., Comelli, N. C., Ortiz, E. V., & Castro, E. A. (2012). QSAR study for carcinogenicity in a large set of organic compounds. Current Drug Safety, 7, 282–288. doi:10.2174/157488612804096623 PMID:23062240

578
QSPR/QSAR Analyses by Means of the CORAL Software
Durdagi, S., Mavromoustakos, T., & Papadopoulos, M. G. (2008). 3D QSAR CoMFA/CoMSIA, mo-lecular docking and molecular dynamics studies of fullerene-based HIV-1 PR inhibitors. Bioorganic & Medicinal Chemistry Letters, 18(23), 6283–6289. doi:10.1016/j.bmcl.2008.09.107 PMID:18951793
Edafiogho, I. O., Ananthalakshmi, K. V., & Kombian, S. B. (2006). Anticonvulsant evaluation and mecha-nism of action of benzylamino enaminones. Bioorganic & Medicinal Chemistry, 14(15), 5266–5272. doi:10.1016/j.bmc.2006.03.049 PMID:16621576
Eddington, N. D., Cox, D. S., Khurana, M., Salama, N. N., Stables, J. P., & Harrison, S. J. et al. (2003). Synthesis and anticonvulsant activity of enaminones part 7. Synthesis and anticonvulsant evaluation of ethyl 4-[(substituted phenyl)amino]-6-methyl-2-oxocyclohex-3-ene-1-carboxylates and their correspond-ing 5-methylcyclohex-2-enone derivatives. European Journal of Medicinal Chemistry, 38(1), 49–64. doi:10.1016/S0223-5234(02)00006-5 PMID:12593916
Eddington, N. D., Cox, D. S., Roberts, R. R., Butcher, R. J., Edafiogho, I. O., & Stables, J. P. et al. (2002). Synthesis and anticonvulsant activity of enaminones. 4. Investigations on isoxazole derivatives. European Journal of Medicinal Chemistry, 37(8), 635–648. doi:10.1016/S0223-5234(02)01377-6 PMID:12161061
Fouchécourt, M.-O., Béliveau, M., & Krishnan, K. (2001). Quantitative structure-pharmacokinetic relationship modeling. The Science of the Total Environment, 274(1-3), 125–135. doi:10.1016/S0048-9697(01)00743-4 PMID:11453289
García, J., Duchowicz, P. R., Rozas, M. F., Caram, J. A., Mirífico, M. V., Fernández, F. M., & Castro, E. A. (2011). A comparative QSAR on 1,2,5-thiadiazolidin-3-one 1,1-dioxide compounds as selec-tive inhibitors of human serine proteinases. Journal of Molecular Graphics & Modelling, 31, 10–19. doi:10.1016/j.jmgm.2011.07.007 PMID:21908217
Garro Martinez, J. C., Duchowicz, P. R., Estrada, M. R., Zamarbide, G. N., & Castro, E. A. (2011). QSAR study and molecular design of open-chain enaminones as anticonvulsant agents. International Journal of Molecular Sciences, 12(12), 9354–9368. doi:10.3390/ijms12129354 PMID:22272137
Geçen, N., Sarıpınar, E., Yanmaz, E., & Şahin, K. (2012). Application of electron conformational-genetic algorithm approach to 1,4-dihydropyridines as calcium channel antagonists: Pharmacophore identification and bioactivity prediction. Journal of Molecular Modeling, 18(1), 65–82. doi:10.1007/s00894-011-1024-5 PMID:21451963
Golbraikh, A., & Tropsha, A. (2002). Predictive QSAR modeling based on diversity sampling of experi-mental datasets for the training and test set selection. Journal of Computer-Aided Molecular Design, 16(5/6), 357–369. doi:10.1023/A:1020869118689 PMID:12489684
González, M. P., Terán, C., Teijeira, M., & González-Moa, M. J. (2005). GETAWAY descriptors to pre-dictingA2A adenosine receptors agonists. European Journal of Medicinal Chemistry, 40(11), 1080–1086. doi:10.1016/j.ejmech.2005.04.014 PMID:16006015
Gutman, I. (1988). Topological analysis of Eigenvalues of the adjacency matrices in graph theory: A difficulty with the concept of internal connectivity. Chemical Physics Letters, 148(1), 93–94. doi:10.1016/0009-2614(88)87267-1

579
QSPR/QSAR Analyses by Means of the CORAL Software
Gutman, I. (1997). Permanents of adjacency matrices and their dependence on molecular structure. Polycyclic Aromatic Compounds, 12(4), 281–287. doi:10.1080/10406639808233845
Hammett, L. P. (1935). Some relations between reaction rates and equilibrium constants. Chemical Reviews, 17(1), 125–136. doi:10.1021/cr60056a010
Helguera, A. M., Cordeiro, M. N. D. S., Pérez, M. A. C., Combes, R. D., & González, M. P. (2008). QSAR modeling of the rodent carcinogenicity of nitrocompounds. Bioorganic & Medicinal Chemistry, 16(6), 3395–3407. doi:10.1016/j.bmc.2007.11.029 PMID:18295489
Hemmateenejad, B. (2004). Optimal QSAR analysis of the carcinogenic activity of drugs by correlation ranking and genetic algorithm-based PCR. Journal of Chemometrics, 18(11), 475–485. doi:10.1002/cem.891
Huuskonen, J. (2000). Estimation of aqueous solubility for a diverse set of organic compounds based on molecular topology. Journal of Chemical Information and Computer Sciences, 40(3), 773–777. doi:10.1021/ci9901338 PMID:10850781
Ibezim, E., Duchowicz, P. R., Ortiz, E. V., & Castro, E. A. (2012). QSAR on aryl-piperazine derivatives with activity on malaria. Chemometrics and Intelligent Laboratory Systems, 110(1), 81–88. doi:10.1016/j.chemolab.2011.10.002
Ivanciuc, O., Ivanciuc, T., & Balaban, A. T. (1998). Quantitative structure-property relationship study of normal boiling points for halogen-/oxygen-/sulfur-containing organic compounds using the CODESSA program. Tetrahedron, 54(31), 9129–9142. doi:10.1016/S0040-4020(98)00550-X
Kar, S., & Roy, K. (2010). QSAR modeling of toxicity of diverse organic chemicals to Daphnia magna using 2D and 3D descriptors. Journal of Hazardous Materials, 177(1-3), 344–351. doi:10.1016/j.jhazmat.2009.12.038 PMID:20045248
Kar, S., & Roy, K. (2012). First report on development of quantitative interspecies structure–carci-nogenicity relationship models and exploring discriminatory features for rodent carcinogenicity of diverse organic chemicals using OECD guidelines. Chemosphere, 87(4), 339–355. doi:10.1016/j.che-mosphere.2011.12.019 PMID:22225702
Kar, S. K., & Roy, K. (2011). Development and validation of a robust QSAR model for prediction of carcinogenicity of drugs. Indian Journal of Biochemistry & Biophysics, 48, 111–122. PMID:21682143
Kruhlak, N. L., Contrera, J. F., Daniel Benz, R., & Matthews, E. J. (2007). Progress in QSAR toxicity screening of pharmaceutical impurities and other FDA regulated products. Advanced Drug Delivery Reviews, 59(1), 43–55. doi:10.1016/j.addr.2006.10.008 PMID:17229485
Kušić, H., Rasulev, B., Leszczynska, D., Leszczynski, J., & Koprivanac, N. (2009). Prediction of rate constants for radical degradation of aromatic pollutants in water matrix: A QSAR study. Chemosphere, 75(8), 1128–1134. doi:10.1016/j.chemosphere.2009.01.019 PMID:19201442
Leonard, J. T., & Roy, K. (2006). On selection of training and test sets for the development of predictive QSAR models. QSAR & Combinatorial Science, 25(3), 235–251. doi:10.1002/qsar.200510161

580
QSPR/QSAR Analyses by Means of the CORAL Software
Martinez-Esparza, J., Oficialdegui, A. M., Perez-Silanes, S., Heras, B. B., Orus, L., & Palop, J. A. et al. (2001a). New 1-Aryl-3-(4-arylpiperazin-1-yl)propane derivatives, with dual action at 5-HT1A serotonin receptors and serotonin transporter, as a new class of antidepressants. Journal of Medicinal Chemistry, 44(3), 418–428. doi:10.1021/jm001059j PMID:11462981
Martinez-Esparza, J., Perez-Silanes, S., Oficialdegui, A. M., Heras, B., Orus, L., & Villanueva, H. et al. (2001b). New 3-[4-(aryl)piperazin- 1-yl]-1-(benzo[b]thiophen-3-yl)propane derivatives with dual action at 5-HT1A serotonin receptors and serotonin transporter as a new class of antidepressants. European Journal of Medicinal Chemistry, 36(1), 55–61. doi:10.1016/S0223-5234(00)01198-3 PMID:11231049
Melagraki, G., Afantitis, A., Sarimveis, H., Igglessi-Markopouloua, O., & Supuran, C. T. (2006). QSAR study on para-substituted aromatic sulfonamides as carbonic anhydrase II inhibitors using to-pological information indices. Bioorganic & Medicinal Chemistry, 14(4), 1108–1114. doi:10.1016/j.bmc.2005.09.038 PMID:16213737
Molyneaux, C.-A., Krugliak, M., Ginsburg, H., & Chibale, K. (2005). Arylpiperazines displaying pref-erential potency against chloroquine-resistant strains of the malaria parasite Plasmodium falciparum. Biochemical Pharmacology, 71(1-2), 61–68. doi:10.1016/j.bcp.2005.10.023 PMID:16298348
Mullen, L. M. A., Duchowicz, P. R., & Castro, E. A. (2011). QSAR treatment on a new class of triphe-nylmethyl-containing compounds as potent anticancer agents. Chemometrics and Intelligent Laboratory Systems, 107(2), 269–275. doi:10.1016/j.chemolab.2011.04.011
Nesmerak, K., Nemec, I., Sticha, M., Waisser, K., & Palat, K. (2005). Quantitative structure–property relationships of new benzoxazines and their electrooxidation as a model of metabolic degradation. Electrochimica Acta, 50(6), 1431–1437. doi:10.1016/j.electacta.2004.08.031
Nesmerak, K., Toropov, A. A., & Toropova, A. (2014). SMILES-based quantitative structure–retention relationships for RP-HPLC of 1-phenyl-5-benzylsulfanyltetrazoles. Structural Chemistry, 25(1), 311–317. doi:10.1007/s11224-013-0293-2
Nesmerak, K., Toropov, A. A., Toropova, A. A., Kohoutova, P., & Waisser, K. (2013). SMILES-based quantitative structureeproperty relationships for half-wave potential of N-benzylsalicylthioamides. Euro-pean Journal of Medicinal Chemistry, 67, 111–114. doi:10.1016/j.ejmech.2013.05.031 PMID:23850571
Nikolic, S., Kovacevic, G., Milicevic, A., & Trinajstic, N. (2003). The Zagreb indices 30 years after. Croatica Chemica Acta, 76(2), 113–124.
Oberg, T. (2005). A QSAR for the hydroxylradicalreaction rate constant: Validation, domain of applica-tion, and prediction. Atmospheric Environment, 39(12), 2189–2200. doi:10.1016/j.atmosenv.2005.01.007
OECD. (2007). Quantitative structure-activity relationships project [(Q)SARs]. Available online: http://search.oecd.org/officialdocuments/displaydocumentpdf/?doclanguage=en&cote=env/jm/mono(2007)2

581
QSPR/QSAR Analyses by Means of the CORAL Software
Ojha, P. K., & Roy, K. (2011). Comparative QSARs for antimalarial endochins: Importance of descriptor-thinning and noise reduction prior to feature selection. Chemometrics and Intelligent Laboratory Systems, 109(2), 146–161. doi:10.1016/j.chemolab.2011.08.007
Palchaudhuri, R., & Hergenrother, P. J. (2008). Triphenylmethylamides (TPMAs): Structure-activity relationship of compounds that induce apoptosis in melanoma cells. Bioorganic & Medicinal Chemistry Letters, 18(22), 5888–5891. doi:10.1016/j.bmcl.2008.07.128 PMID:18710803
Palchaudhuri, R., Nesterenko, V., & Hergenrother, P. J. (2008). The complex role of the triphenylmethyl motif in anticancer compounds. Journal of the American Chemical Society, 130(31), 10274–10281. doi:10.1021/ja8020999 PMID:18611022
Pan, Y., Jiang, J., & Wang, Z. (2007). Quantitative structure–property relationship studies for predicting flash points of alkanes using group bond contribution method with back-propagation neural network. Journal of Hazardous Materials, 147(1-2), 424–430. doi:10.1016/j.jhazmat.2007.01.025 PMID:17292543
Papa, E., van derWal, L., Arnot, J. A., & Gramatica, P. (2014). Metabolic biotransformation half-lives in fish: QSAR modeling and consensus analysis. The Science of the Total Environment, 470–471, 1040–1046. doi:10.1016/j.scitotenv.2013.10.068 PMID:24239825
Porto, L. C., Souza, E. S., Junkes, B. S., Yunes, R. A., & Heinzen, V. E. F. (2008). Semi-empirical topological index: Development of QSPR/QSRR and optimization for alkylbenzenes. Talanta, 76(2), 407–412. doi:10.1016/j.talanta.2008.03.023 PMID:18585298
Putz, M. V., Ionascu, C., Putz, A.-M., & Ostafe, V. (2011). Alert-QSAR. Implications for electrophilic theory of chemical carcinogenesis. International Journal of Molecular Sciences, 12(12), 5098–5134. doi:10.3390/ijms12085098 PMID:21954348
Randić, M. (1975). Characterization of molecular branching. Journal of the American Chemical Society, 69(23), 6609–6615. doi:10.1021/ja00856a001
Randic, M. (2001). The connectivity index 25 years after. Journal of Molecular Graphics & Modelling, 20(1), 19–35. doi:10.1016/S1093-3263(01)00098-5 PMID:11760000
Randic, M., & Basak, S. C. (1999). Optimal molecular descriptors based on weighted path numbers. Journal of Chemical Information and Computer Sciences, 39(2), 261–266. doi:10.1021/ci9800763
Randic, M., & Basak, S. C. (2001). New descriptor for structure-property and structure-activity correla-tions. Journal of Chemical Information and Computer Sciences, 41(3), 650–656. doi:10.1021/ci000116e PMID:11410042
Randic, M., DeAlba, L. M., & Harris, F. E. (1998). Graphs with the same detour matrix. Croatica Chemica Acta, 71(1), 53–68.

582
QSPR/QSAR Analyses by Means of the CORAL Software
Randic, M., & Pompe, M. (2001). The variable connectivity index 1xf versus the traditional molecular descriptors: A comparative study of 1xf against descriptors of CODESSA. Journal of Chemical Informa-tion and Computer Sciences, 41(3), 631–638. doi:10.1021/ci000119r PMID:11410040
Ren, B. (2003). Atom-type-based AI topological descriptors for quantitative structure–retention index correlations of aldehydes and ketones. Chemometrics and Intelligent Laboratory Systems, 66(1), 29–39. doi:10.1016/S0169-7439(03)00004-2
Roy, P. P., & Roy, K. (2008). On some aspects of variable selection for partial least squares regression models. QSAR & Combinatorial Science, 27(3), 302–313. doi:10.1002/qsar.200710043
Sahigara, F., Mansouri, K., Ballabio, D., Mauri, A., Consonni, V., & Todeschini, R. (2012). Comparison of different approaches to define the applicability domain of QSAR models. Molecules (Basel, Switzer-land), 17(12), 4791–4810. doi:10.3390/molecules17054791 PMID:22534664
Singh, K. P., & Gupta, S. (2014). Nano-QSAR modeling for predicting biological activity of diverse nanomaterials. Royal Society of Chemistry Advances, 4(26), 13215–13230.
Talevi, A., Bellera, C. L., Ianni, M. D., Duchowicz, P. R., Bruno-Blanch, L. E., & Castro, E. A. (2012). An integrated drug development approach. Applying topological descriptors. Current Computer-aided Drug Design, 8, 172–181. doi:10.2174/157340912801619076 PMID:22734704
Taskinen, J., & Yliruusi, J. (2003). Prediction of physicochemical properties based on neural network modelling. Advanced Drug Delivery Reviews, 55(9), 1163–1183. doi:10.1016/S0169-409X(03)00117-0 PMID:12954197
Tetko, I. V., Tanchuk, V. Yu., Kasheva, T. N., & Villa, A. E. P. (2001). Estimation of aqueous solubility of chemical compounds using E-state indices. Journal of Chemical Information and Computer Sciences, 41(6), 1488–1493. doi:10.1021/ci000392t PMID:11749573
Toropov, A. A., Nesmerak, K., Raska, I. Jr, Waisser, K., & Palat, K. (2006). QSPR modeling of the half-wave potentials of benzoxazines by optimal descriptors calculated with the SMILES. Computational Biology and Chemistry, 30(6), 434–437. doi:10.1016/j.compbiolchem.2006.09.003 PMID:17092778
Toropov, A. A., Rasulev, B. F., & Leszczynski, J. (2008). QSAR modeling of acute toxicity by balance of correlations. Bioorganic & Medicinal Chemistry, 16(11), 5999–6008. doi:10.1016/j.bmc.2008.04.055 PMID:18482841
Toropov, A. A., & Toropova, A. P. (2001). Prediction of heteroaromatic amine mutagenicity by means of correlation weighting of atomic orbital graphs of local invariants. Journal of Molecular Structure THEOCHEM, 538(1-3), 287–293. doi:10.1016/S0166-1280(00)00713-2
Toropov, A. A., & Toropova, A. P. (2002). QSAR modeling of toxicity on optimization of correlation weights of Morgan extended connectivity. Journal of Molecular Structure THEOCHEM, 578(1-3), 129–134. doi:10.1016/S0166-1280(01)00695-9
Toropov, A. A., Toropova, A. P., & Benfenati, E. (2010b). SMILES-based optimal descriptors: QSAR modeling of carcinogenicity by balance of correlations with ideal slopes. European Journal of Medicinal Chemistry, 45(9), 3581–3587. doi:10.1016/j.ejmech.2010.05.002 PMID:20570021

583
QSPR/QSAR Analyses by Means of the CORAL Software
Toropov, A. A., Toropova, A. P., Benfenati, E., Gini, G., & Fanelli, R. (2013b). The definition of the molecular structure for potential anti-malaria agents by the Monte Carlo method. Structural Chemistry, 24(4), 1369–1381. doi:10.1007/s11224-012-0180-2
Toropov, A. A., Toropova, A. P., Benfenati, E., Gini, G., Leszczynska, D., & Leszczynski, J. (2010c). QSAR analysis of 1,4-dihydro-4-oxo-1-(2-thiazolyl)-1,8-naphthyridines exhibiting anticancer activity by optimal SMILES-based descriptors. Journal of Mathematical Chemistry, 47(2), 647–666. doi:10.1007/s10910-009-9593-6
Toropov, A. A., Toropova, A. P., Benfenati, E., Gini, G., Leszczynska, D., & Leszczynski, J. (2013a). CORAL: QSPR model of water solubility based on local and global SMILES attributes. Chemosphere, 90(2), 877–880. doi:10.1016/j.chemosphere.2012.07.035 PMID:22921649
Toropov, A. A., Toropova, A. P., Benfenati, E., Leszczynska, D., & Leszczynski, J. (2010d). SMILES-based optimal descriptors: QSAR analysis of fullerene-based HIV-1 PR inhibitors by means of balance of correlations. Journal of Computational Chemistry, 31, 381–392. PMID:19479738
Toropov, A. A., Toropova, A. P., Raska, I. Jr, & Benfenati, E. (2010a). QSPR modeling of octanol/water partition coefficient of antineoplastic agents by balance of correlation. European Journal of Medicinal Chemistry, 45(4), 1639–1647. doi:10.1016/j.ejmech.2009.12.043 PMID:20106561
Toropov, A. A., Toropova, A. P., Raska, I. Jr, Benfenati, E., & Gini, G. (2012b). QSAR modeling of endpoints for peptides which is based on representation of the molecular structure by a sequence of amino acids. Structural Chemistry, 23(6), 1891–1904. doi:10.1007/s11224-012-9995-0
Toropov, A. A., Toropova, A. P., Raska, I. Jr, Leszczynska, D., & Leszczynski, J. (2014). Comprehension of drug toxicity: Software and databases. Computers in Biology and Medicine, 45, 20–25. doi:10.1016/j.compbiomed.2013.11.013 PMID:24480159
Toropov, A. A., Toropova, A. P., Rasulev, B. F., Benfenati, E., Gini, G., Leszczynska, D., & Leszczynski, J. (2012a). Coral: QSPR modeling of rate constants of reactions between organic aromatic pollutants and hydroxyl radical. Journal of Computational Chemistry, 33(23), 1902–1906. doi:10.1002/jcc.23022 PMID:22641453
Toropova, A. P., & Toropov, A. A. (2013). Optimal descriptor as a translator of eclectic information into the prediction of membrane damage by means of various TiO2 nanoparticles. Chemosphere, 93(10), 2650–2655. doi:10.1016/j.chemosphere.2013.09.089 PMID:24161577
Toropova, A. P., & Toropov, A. A. (2014). CORAL software: Prediction of carcinogenicity of drugs by means of the Monte Carlo method. European Journal of Pharmaceutical Sciences, 52, 21–25. doi:10.1016/j.ejps.2013.10.005 PMID:24514451
Toropova, A. P., Toropov, A. A., Benfenati, E., Gini, G., Leszczynska, D., & Leszczynski, J. (2011a). CORAL: Quantitative structure-activity relationship models for estimating toxicity of organic compounds in rats. Journal of Computational Chemistry, 32(12), 2727–2733. doi:10.1002/jcc.21848 PMID:21656789
Toropova, A. P., Toropov, A. A., Benfenati, E., Gini, G., Leszczynska, D., & Leszczynski, J. (2011b). CORAL: QSPR models for solubility of [C60] and [C70] fullerene derivatives. Molecular Diversity, 15(1), 249–256. doi:10.1007/s11030-010-9245-6 PMID:20349134

584
QSPR/QSAR Analyses by Means of the CORAL Software
Toropova, A. P., Toropov, A. A., Benfenati, E., Gini, G., Leszczynska, D., & Leszczynski, J. (2012b). CORAL: Models of toxicity of binary mixtures. Chemometrics and Intelligent Laboratory Systems, 119, 39–43. doi:10.1016/j.chemolab.2012.10.001
Toropova, A. P., Toropov, A. A., Benfenati, E., Leszczynska, D., & Leszczynski, J. (2010). QSAR modeling of measured binding affinity for fullerene-based HIV-1 PR inhibitors by CORAL. Journal of Mathematical Chemistry, 48(4), 959–987. doi:10.1007/s10910-010-9719-x
Toropova, A. P., Toropov, A. A., Martyanov, S. E., Benfenati, E., Gini, G., Leszczynska, D., & Leszc-zynski, J. (2012a). CORAL: QSAR modeling of toxicity of organic chemicals towards Daphnia magna. Chemometrics and Intelligent Laboratory Systems, 110(1), 177–181. doi:10.1016/j.chemolab.2011.10.005
Troshin, P. A., Hoppe, H., Renz, J., Egginger, M., Mayorova, J. Yu., & Goryachev, A. E. et al. (2009). Ma-terial solubility-photovoltaic performance relationship in the design of novel fullerene derivatives for bulk heterojunction solar cells. Advanced Functional Materials, 19(5), 779–788. doi:10.1002/adfm.200801189
Turabekova, M. A., Rasulev, B. F., Dzhakhangirov, F. N., Toropov, A. A., Leszczynska, D., & Leszczyn-ski, J. (2014). Aconitum and Delphinium diterpenoid alkaloids of local anesthetic activity. Comparative QSAR analysis based on GA-MLRA/PLS and optimal descriptors approach. Journal of Environmental Science and Health, 32(Part C), 213–238. doi:10.1080/10590501.2014.938886 PMID:25226219
Vamecq, J., Lambert, D., Poupaert, J. H., Masereel, B., & Stables, J. P. (1998). Anticonvulsant activity and interactions with neuronal voltage-dependent sodium channel of analogues of ameltolide. Journal of Medicinal Chemistry, 41(18), 3307–3313. doi:10.1021/jm9608772 PMID:9719582
Veselinovic, A. M., Milosavljevic, J. B., Toropov, A., & Nikolic, G. M. (2013a). SMILES-based QSAR model for arylpiperazines as high-affinity 5-HT1A receptor ligands using CORAL. European Journal of Pharmaceutical Sciences, 48(3), 532–541. doi:10.1016/j.ejps.2012.12.021 PMID:23287365
Veselinovic, A. M., Milosavljevic, J. B., Toropov, A., & Nikolic, G. M. (2013b). SMILES-Based QSAR Models for the Calcium Channel-Antagonistic Effect of 1,4-Dihydropyridines. Archiv der Pharmazie Chemistry in Life Sciences, 346(2), 134–139. doi:10.1002/ardp.201200373 PMID:23280520
Vracko, M. (1997). A study of structure-carcinogenic potency relationship with artificial neural networks. The using of descriptors related to geometrical and electronic structures. Journal of Chemical Informa-tion and Computer Sciences, 37(6), 1037–1043. doi:10.1021/ci970231y
Weininger, D. (1988). SMILES, a chemical language and information system. 1. Introduction to meth-odology and encoding rules. Journal of Chemical Information and Computer Sciences, 28(1), 31–36. doi:10.1021/ci00057a005
Weininger, D. (1990) SMILES. 3. Depict. Graphical depiction of chemical structures. Journal of Chemi-cal Information and Computer Sciences, 30(3), 237-243.
Weininger, D., Weininger, A., & Weininger, J. L. (1989). SMILES. 2. Algorithm for generation of unique SMILES notation. Journal of Chemical Information and Computer Sciences, 29(2), 97–101. doi:10.1021/ci00062a008

585
QSPR/QSAR Analyses by Means of the CORAL Software
Wiener, H. (1947). Structural determination of paraffin boiling points. Journal of the American Chemi-cal Society, 69(1), 17–20. doi:10.1021/ja01193a005 PMID:20291038
Wiener, H. (1948). Vapor pressure-temperature relationships among the branched paraffin hydro-carbons. The Journal of Physical and Colloid Chemistry, 52(2), 425–430. doi:10.1021/j150458a014 PMID:18906414
Wishart, D. S., Knox, C., Guo, A. C., Cheng, D., Shrivastava, S., & Tzur, D. et al. (2008). DrugBank: A knowledgebase for drugs, drug actions and drug targets. Nucleic Acids Research, 36(Database), 901–906. doi:10.1093/nar/gkm958 PMID:18048412
Worachartcheewan, A., Nantasenamat, C., Isarankura-Na-Ayudhya, C., & Prachayasittikul, V. (2014). QSAR study of H1N1 neuraminidase inhibitors from influenza a virus. Letters in Drug Design & Dis-covery, 11(4), 420–427. doi:10.2174/15701808113106660085
Yan, A., & Gasteiger, J. (2003). Prediction of aqueous solubility of organic compounds based on a 3D structure representation. Journal of Chemical Information and Computer Sciences, 43(2), 429–434. doi:10.1021/ci025590u PMID:12653505
Zhang, L., Zhou, P., Yang, F., & Wang, Z. (2007). Computer-based QSARs for predicting mixture toxicity of benzene and its derivatives. Chemosphere, 67(2), 396–401. doi:10.1016/j.chemosphere.2006.09.018 PMID:17184822
KEY TERMS AND DEFINITIONS
Correlation Weight: A coefficient which should be added to optimal descriptor if a given SMILES attribute or graph invariant takes place in the given SMILES or in the given molecular graph.
Global SMILES Attribute: A characteristic of molecules in whole, e.g. the presence of nitrogen together with oxygen, presence of double bonds and cycles, the presence of nitrogen and sulphur and absence of oxygen, and others (Table 1).
Graph of Atomic Orbitals (GAO): Molecular graph where vertexes are the representation of atomic orbitals (e.g. 1s2, 2p3, 3d7, etc.).
Hydrogen-Filled Graph (HFG): Molecular graph where presence of hydrogen atoms is taken into account.
Hydrogen-Suppressed Graph (HSG): Molecular graph where presence of hydrogen atoms is ignored.Local SMILES Attribute: Fragment of SMILES line which contains one (‘C’, ‘N’, ‘=’, etc.) or two
symbols (‘Cl’, ‘Br’, ‘@@’, etc.) which cannot be examined separately.Monte Carlo Optimization: The calculation of the numerical data on the correlation weights which
give maximal value of the correlationn coefficient between an endpoint and the optimal descriptor.Optimal Descriptor: A descriptor which is calculated for a substances with simplified molecular
input-line entry system (SMILES) or with molecular graph using correlation weights for SMILES at-tributes or for graph invariant (vertex degree, valence shells, etc.).