chapter 16 econ 104 parks the phillips curve © onlinetexts.com p. ‹#›
TRANSCRIPT
Chapter 16Econ 104 Parks
The Phillips Curve The Phillips Curve
© OnlineTexts.com p. ‹#›
The Phillips Curve
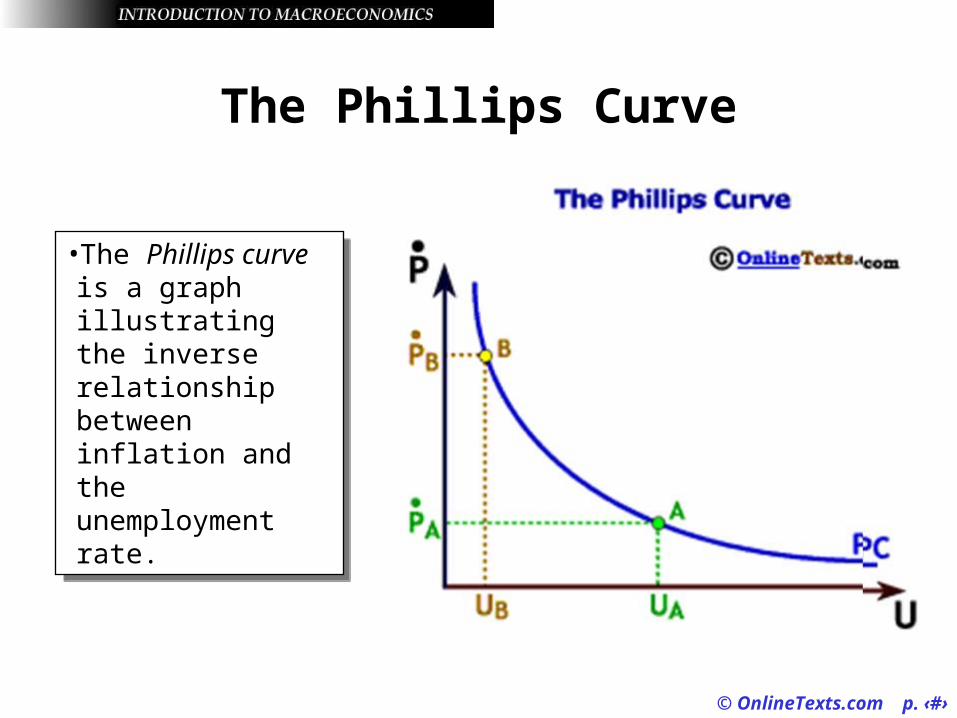
•The Phillips curve is a graph illustrating the inverse relationship between inflation and the unemployment rate.
•The Phillips curve is a graph illustrating the inverse relationship between inflation and the unemployment rate.
© OnlineTexts.com p. ‹#›
The Early Consensus
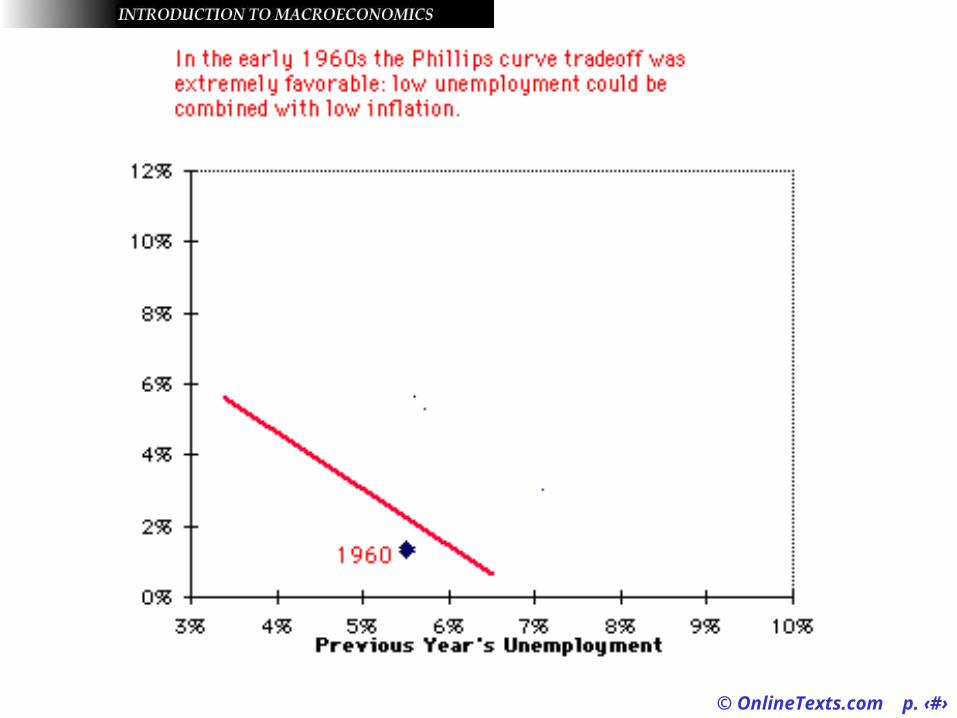
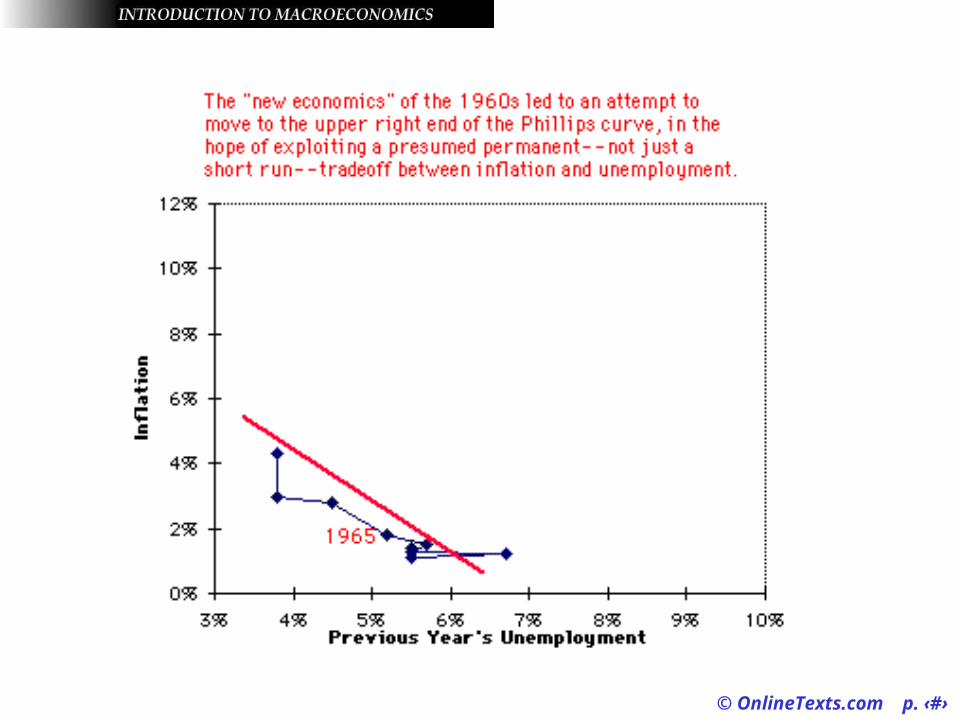
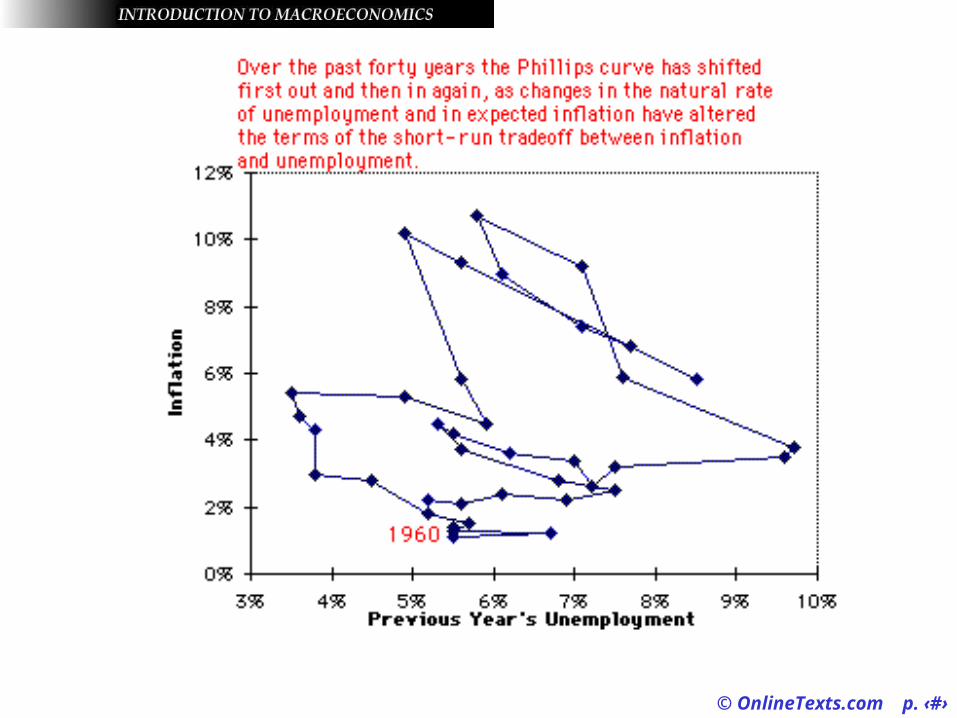
• Economists in the late 1950s and 1960s thought that all the Federal Reserve or government had to do was to pick the point on the short-run Phillips curve where they wanted the economy to be positioned.
• Less unemployment meant living with more inflation, and vice versa.
• Economists in the late 1950s and 1960s thought that all the Federal Reserve or government had to do was to pick the point on the short-run Phillips curve where they wanted the economy to be positioned.
• Less unemployment meant living with more inflation, and vice versa.
© OnlineTexts.com p. ‹#›
© OnlineTexts.com p. ‹#›
© OnlineTexts.com p. ‹#›
© OnlineTexts.com p. ‹#›
© OnlineTexts.com p. ‹#›
© OnlineTexts.com p. ‹#›
© OnlineTexts.com p. ‹#›
© OnlineTexts.com p. ‹#›
© OnlineTexts.com p. ‹#›
© OnlineTexts.com p. ‹#›
© OnlineTexts.com p. ‹#›
Breakdown of the Short-Run Phillips Curve
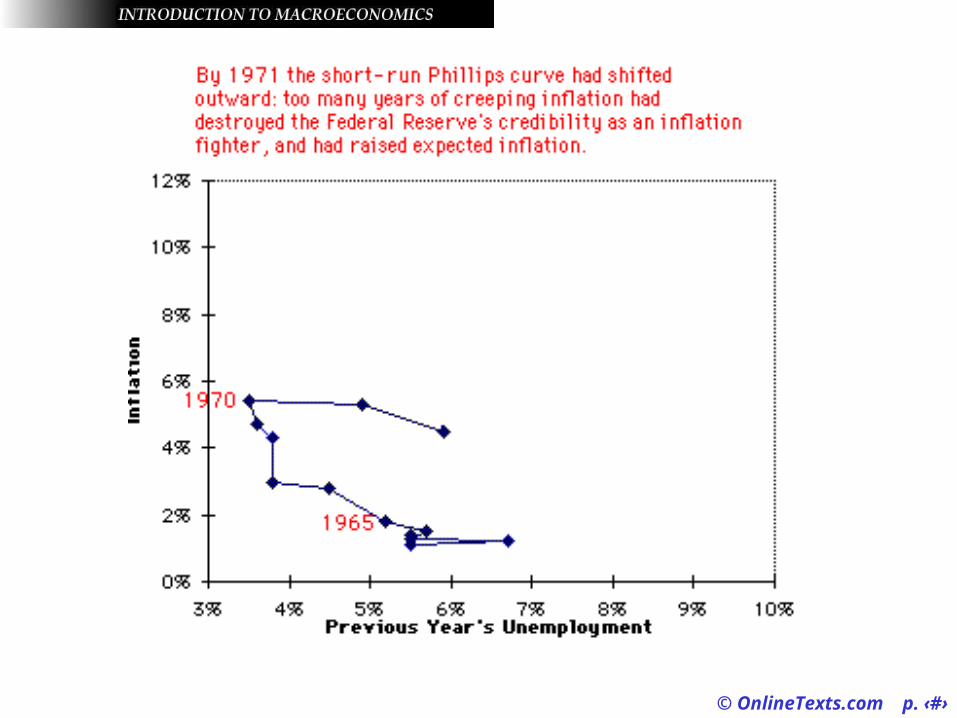
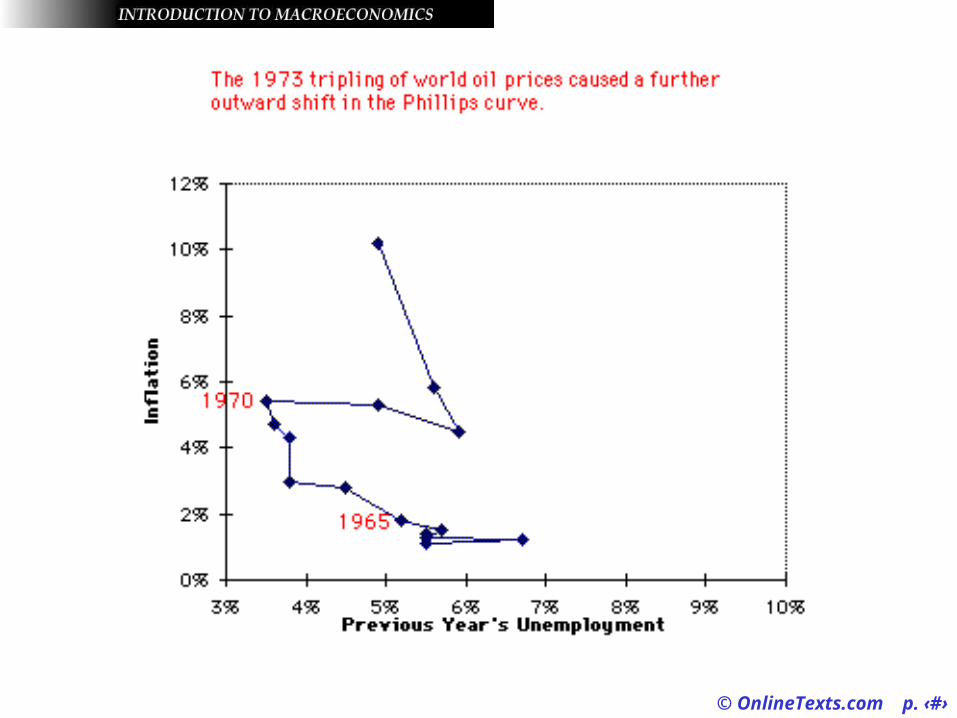
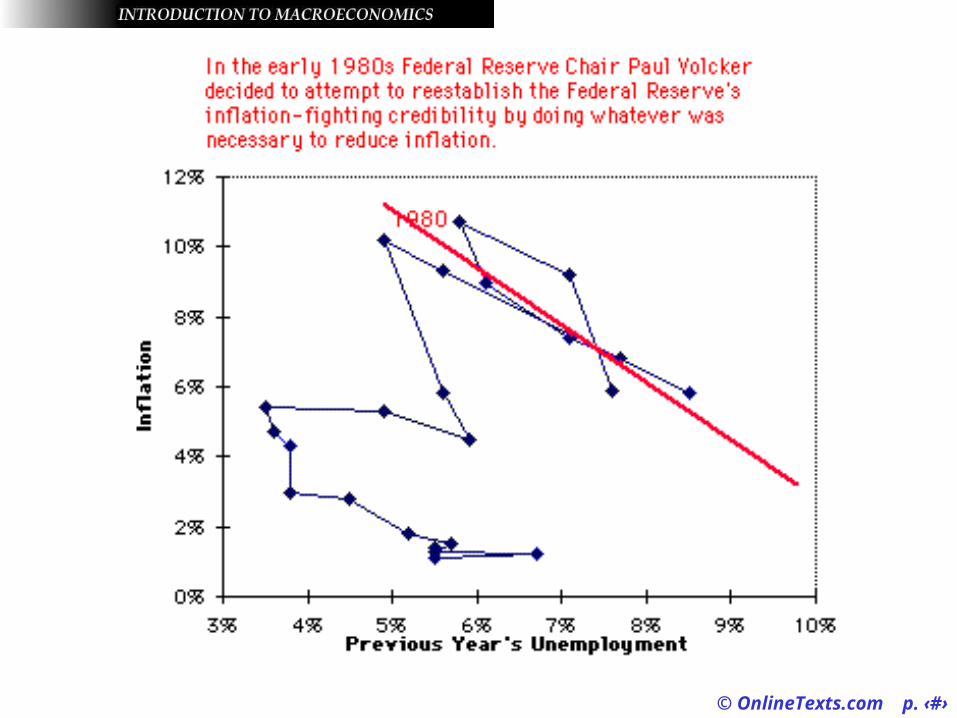
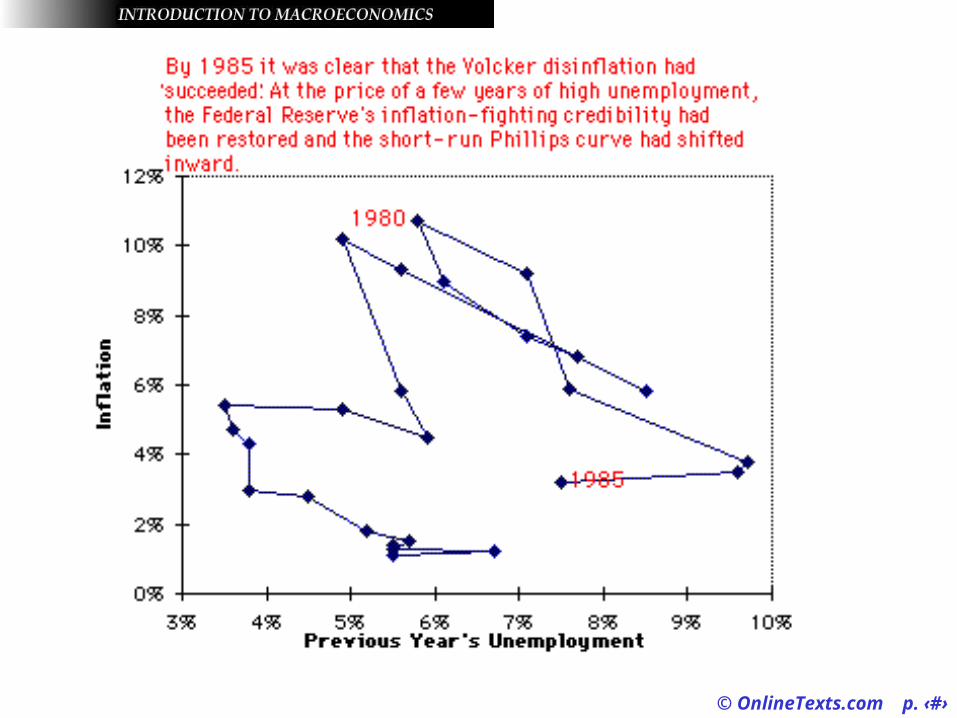
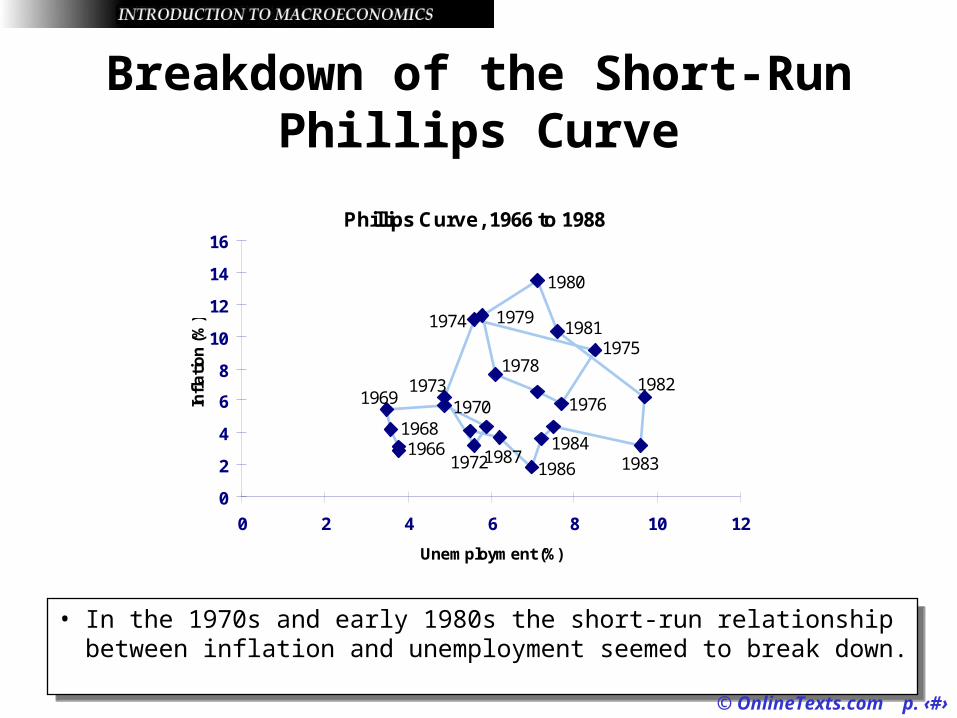
• In the 1970s and early 1980s the short-run relationship between inflation and unemployment seemed to break down.
• In the 1970s and early 1980s the short-run relationship between inflation and unemployment seemed to break down.
Phillips Curve, 1966 to 1988
1987 1983
1978
1974
197219661968
19691973
1970
1975
1976
1979
1980
1981
1982
1984
1986
0
2
4
6
8
10
12
14
16
0 2 4 6 8 10 12
Unemployment (%)
Infl
ati
on
(%
)
© OnlineTexts.com p. ‹#›
Breakdown of the Short-Run Phillips Curve
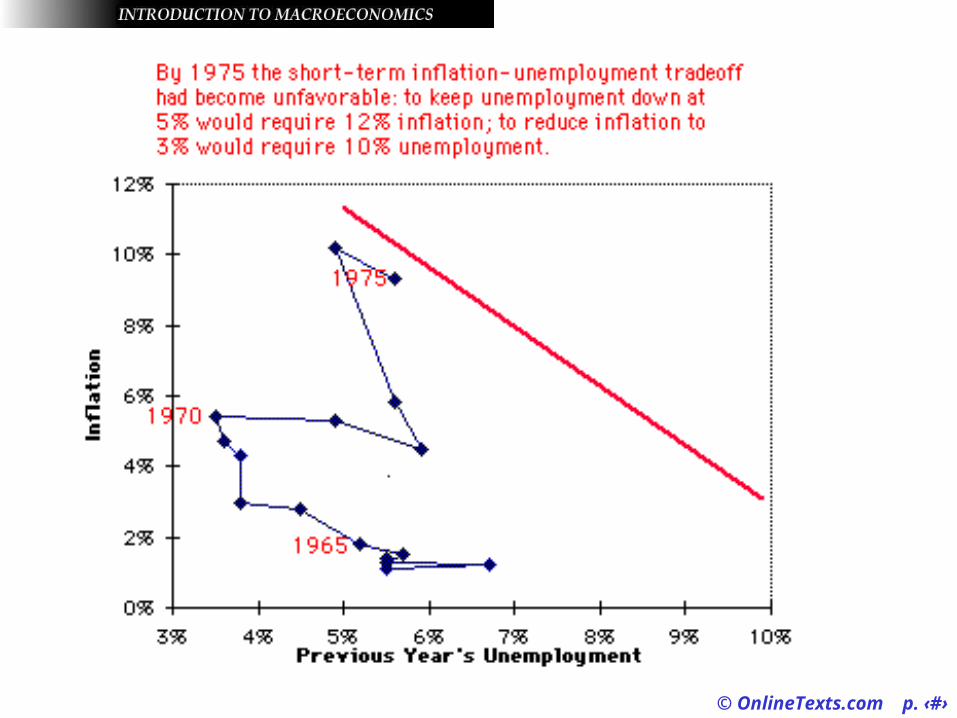
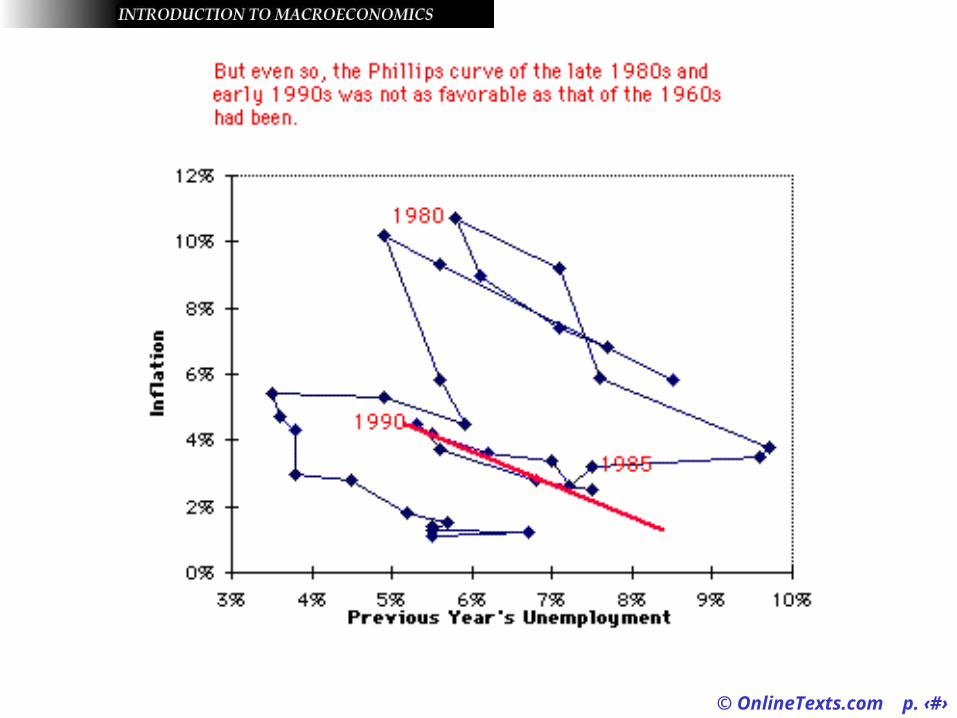
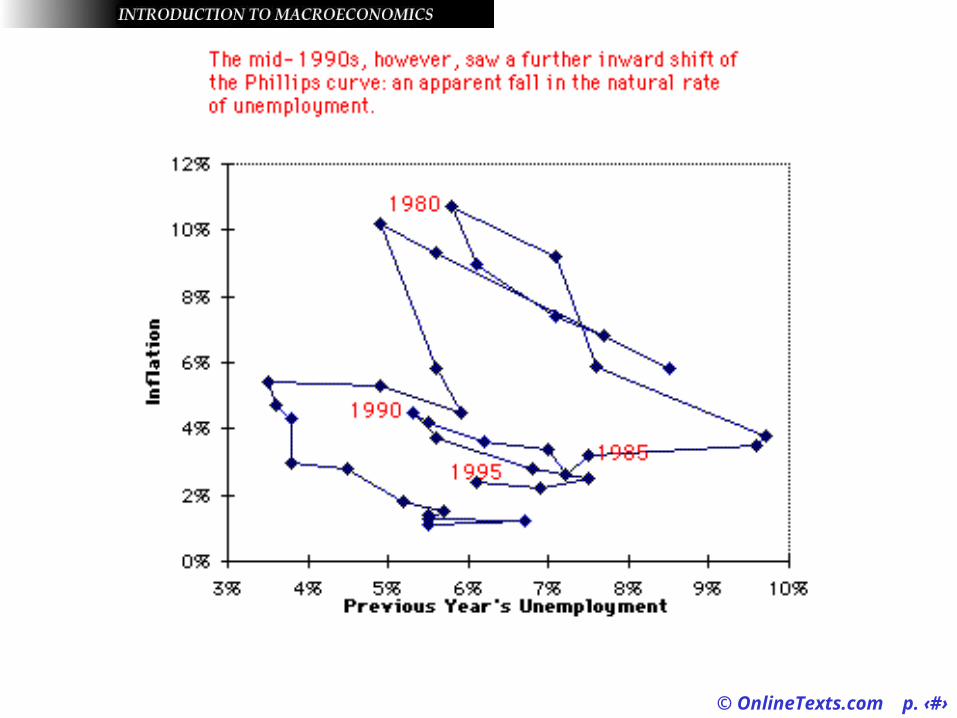
• A spiral pattern emerged in the Phillips curve.
• Economists were able to salvage the Phillips curve by realizing that a significant difference exists between the short-run and long-run relationships between inflation and unemployment.
• A spiral pattern emerged in the Phillips curve.
• Economists were able to salvage the Phillips curve by realizing that a significant difference exists between the short-run and long-run relationships between inflation and unemployment.
© OnlineTexts.com p. ‹#›
The Long-Run Phillips Curve
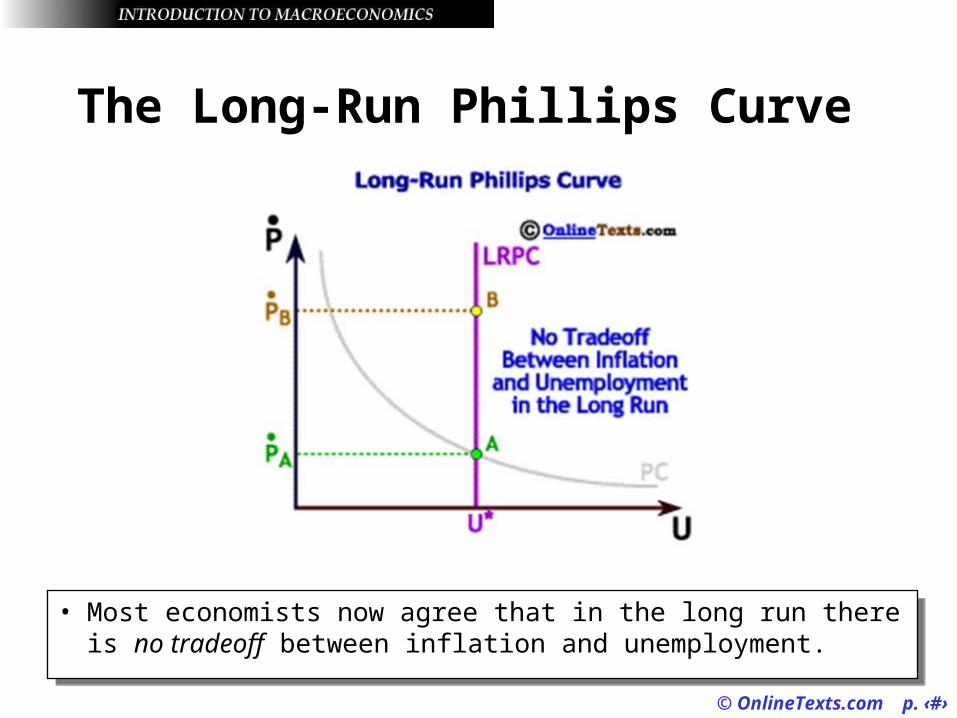
• Most economists now agree that in the long run there is no tradeoff between inflation and unemployment.
• Most economists now agree that in the long run there is no tradeoff between inflation and unemployment.
© OnlineTexts.com p. ‹#›
The Long-Run Phillips Curve
• The long-run Phillips curve is simply a vertical line at the natural rate of unemployment, U*.
• Any level of inflation is consistent with the natural rate of unemployment.
• The long-run Phillips curve is simply a vertical line at the natural rate of unemployment, U*.
• Any level of inflation is consistent with the natural rate of unemployment.
© OnlineTexts.com p. ‹#›
Aggregate Demand Shifts and the Phillips Curve
• We can "explain" both the short-run and long-run Phillips curves by using the Aggregate Demand/Aggregate Supply model that we developed in Chapter 8.
• We can "explain" both the short-run and long-run Phillips curves by using the Aggregate Demand/Aggregate Supply model that we developed in Chapter 8.
© OnlineTexts.com p. ‹#›
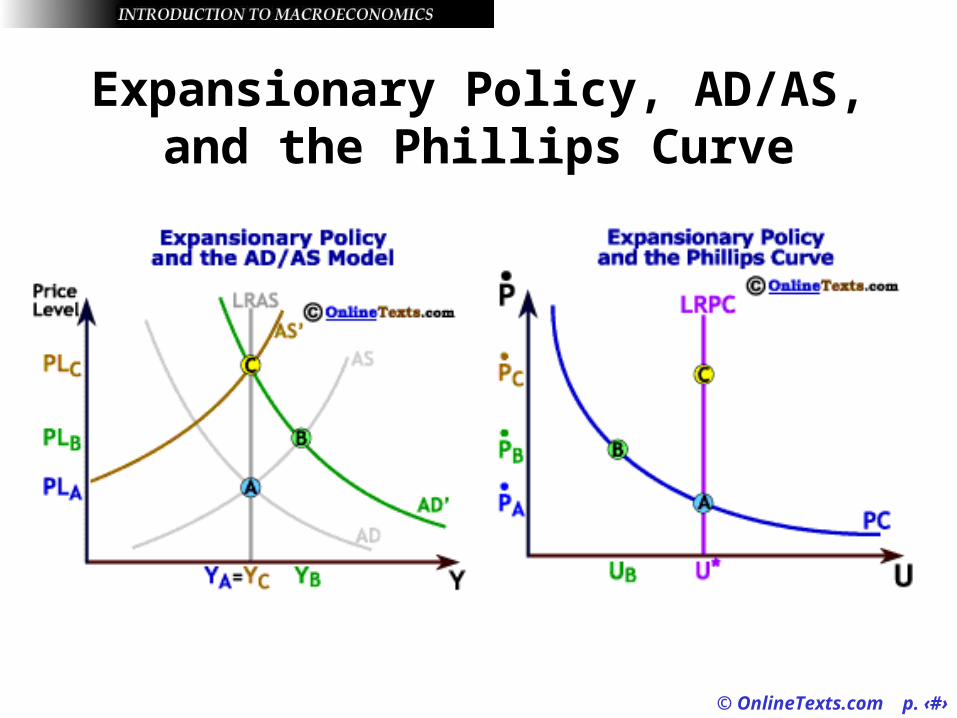
Expansionary Policy, AD/AS, and the Phillips Curve
© OnlineTexts.com p. ‹#›
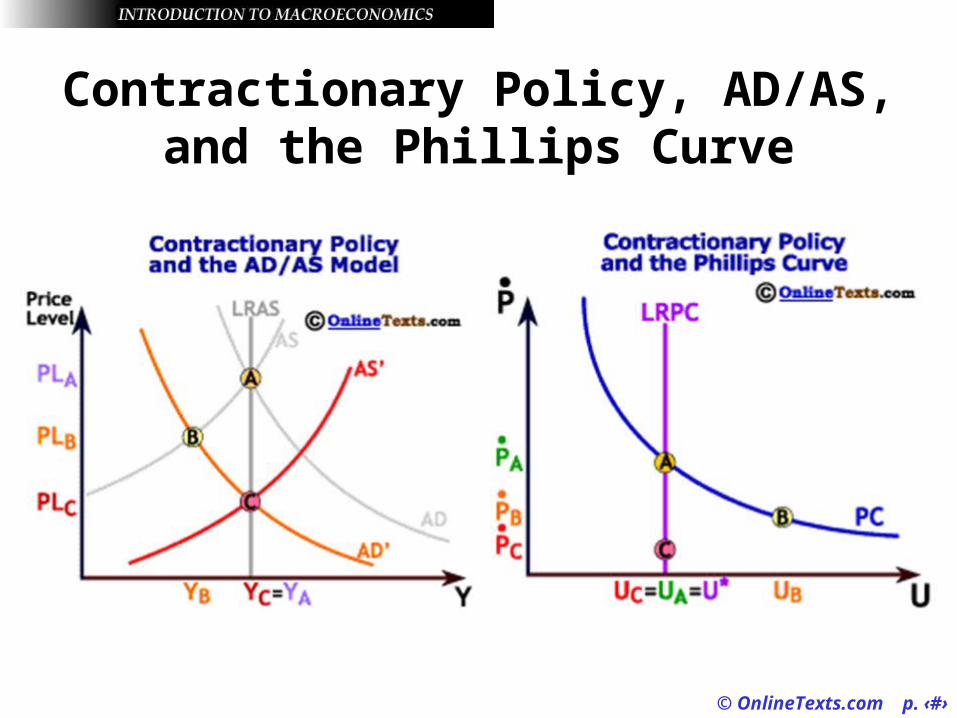
Contractionary Policy, AD/AS, and the Phillips Curve
© OnlineTexts.com p. ‹#›
The Role of Expectations
• The short-run tradeoff between inflation and unemployment is thought to work because people have an idea of what inflation expectations are going to be, and those expectations change slowly.
• Over time, workers learn that inflation has changed and they change their inflation expectations accordingly.
© OnlineTexts.com p. ‹#›
The Role of Expectations
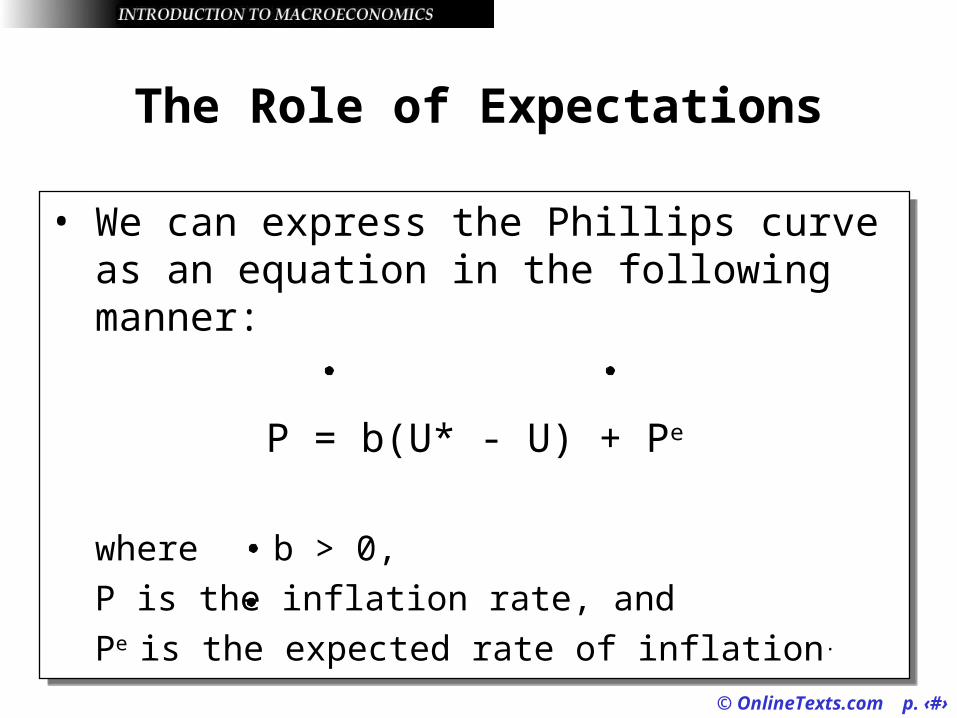
• We can express the Phillips curve as an equation in the following manner:
P = b(U* - U) + Pe
where b > 0,
P is the inflation rate, and
Pe is the expected rate of inflation.
• We can express the Phillips curve as an equation in the following manner:
P = b(U* - U) + Pe
where b > 0,
P is the inflation rate, and
Pe is the expected rate of inflation.
© OnlineTexts.com p. ‹#›
The Role of Expectations
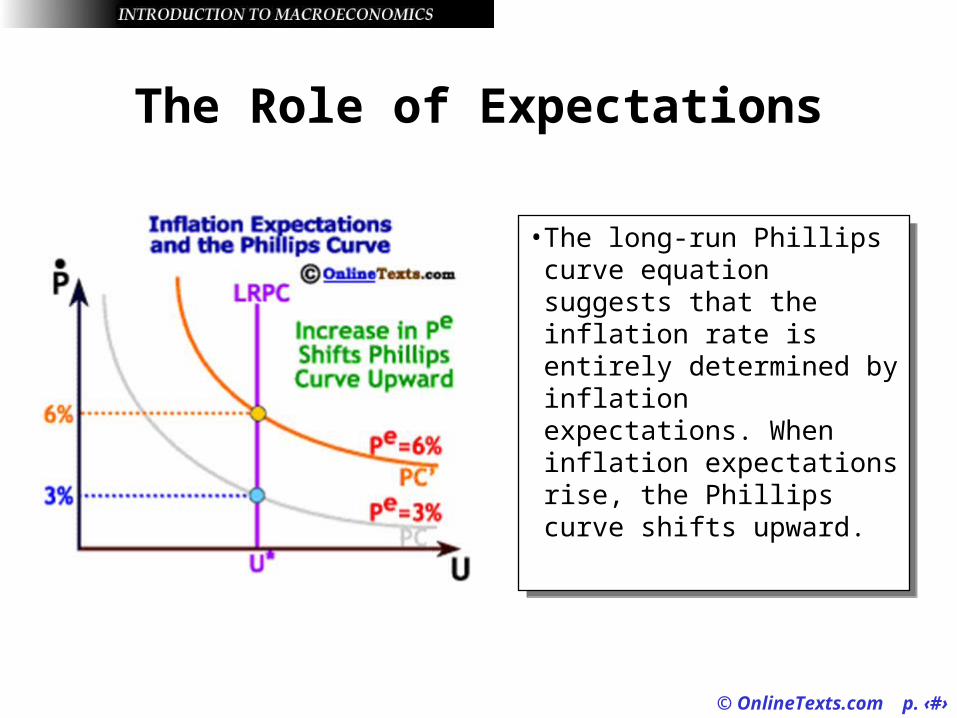
• The long-run Phillips curve equation suggests that the inflation rate is entirely determined by inflation expectations. When inflation expectations rise, the Phillips curve shifts upward.
• The long-run Phillips curve equation suggests that the inflation rate is entirely determined by inflation expectations. When inflation expectations rise, the Phillips curve shifts upward.
© OnlineTexts.com p. ‹#›
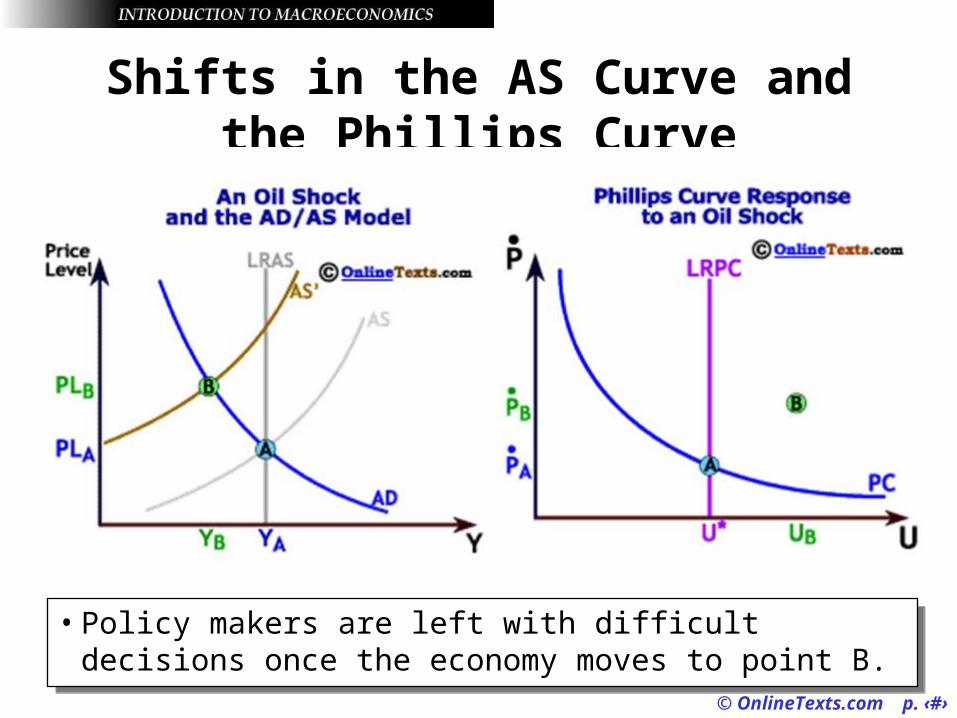
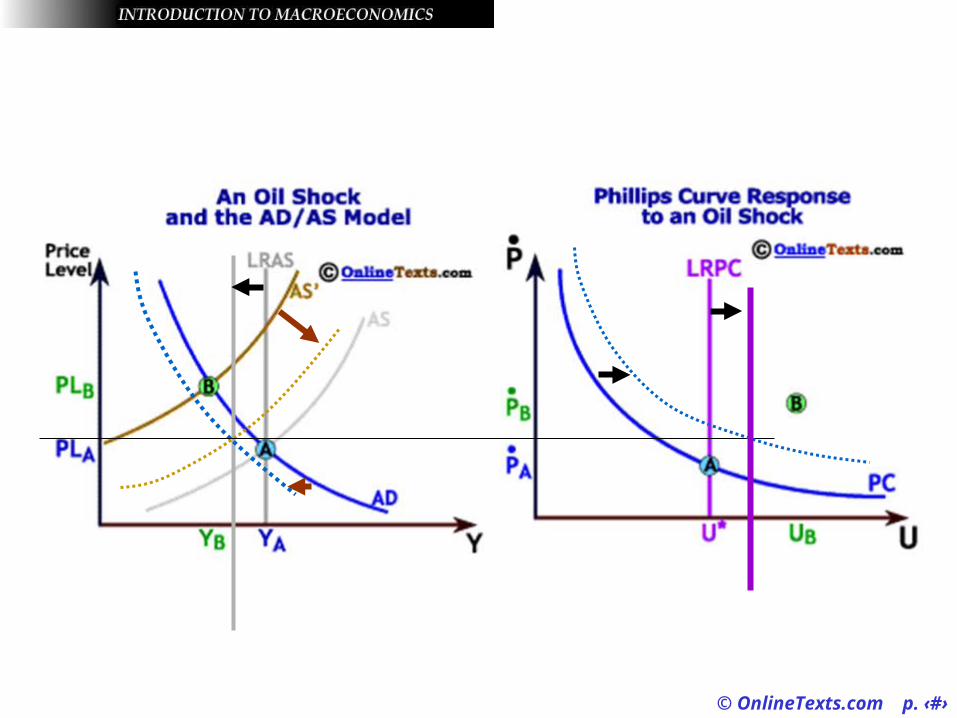
Shifts in the AS Curve and the Phillips Curve
• When the Aggregate Supply curve shifts, we can get very different results in the Phillips curve than when the Aggregate Demand curve shifts.
• An oil shock, for example, can produce stagflation.
• When the Aggregate Supply curve shifts, we can get very different results in the Phillips curve than when the Aggregate Demand curve shifts.
• An oil shock, for example, can produce stagflation.
© OnlineTexts.com p. ‹#›
Shifts in the AS Curve and the Phillips Curve
• Policy makers are left with difficult decisions once the economy moves to point B.
• Policy makers are left with difficult decisions once the economy moves to point B.
© OnlineTexts.com p. ‹#›
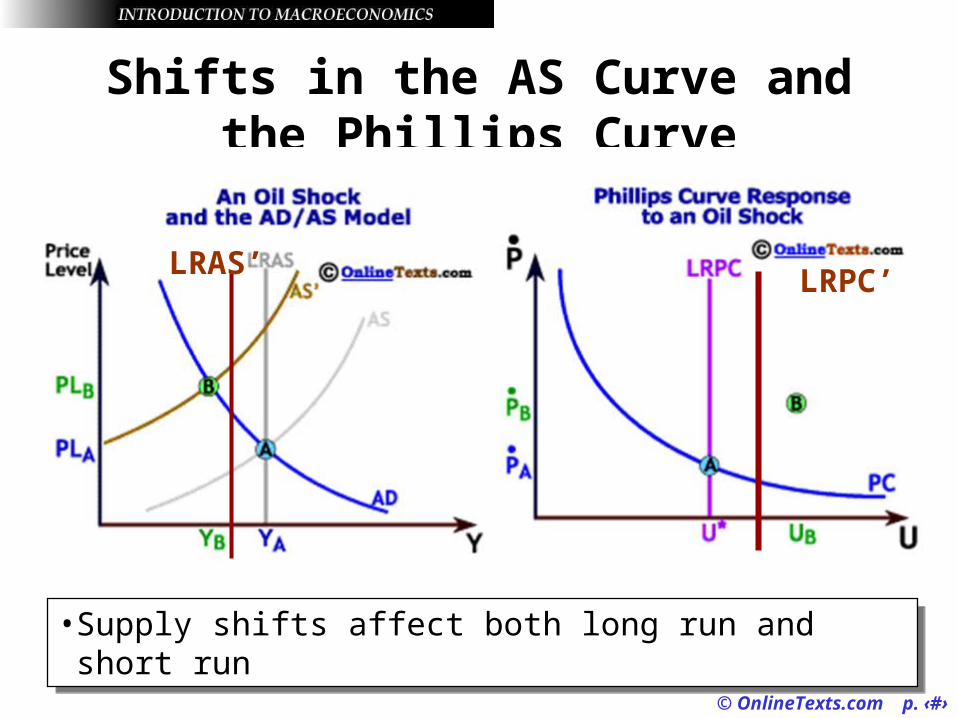
Shifts in the AS Curve and the Phillips Curve
• Supply shifts affect both long run and short run• Supply shifts affect both long run and short run
LRAS’LRPC’
© OnlineTexts.com p. ‹#›
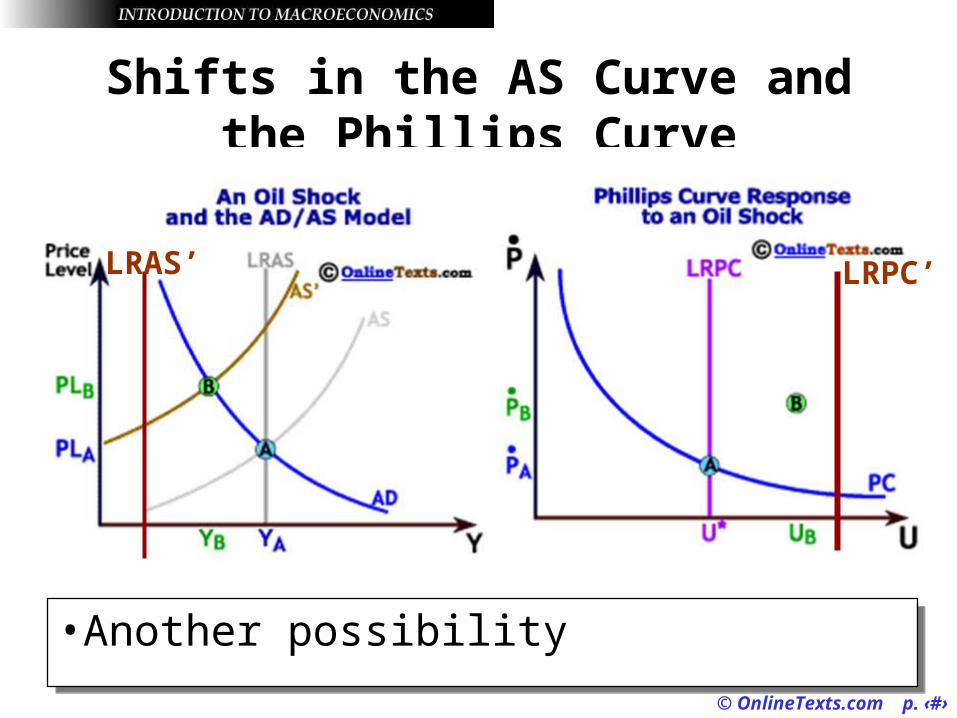
Shifts in the AS Curve and the Phillips Curve
• Another possibility• Another possibility
LRAS’ LRPC’
© OnlineTexts.com p. ‹#›
© OnlineTexts.com p. ‹#›
Long Run
• Point B may not be long run equilibrium. With unemployment, workers adjust their wage demands downward, shifting AS to the right to achieve equilibrium. But accepting lower wages shifts AD inward.
• As an external shock, oil prices, shifted short run AS, it will also shift long run AS. The equilibrium is less GDP and higher price levels.
© OnlineTexts.com p. ‹#›
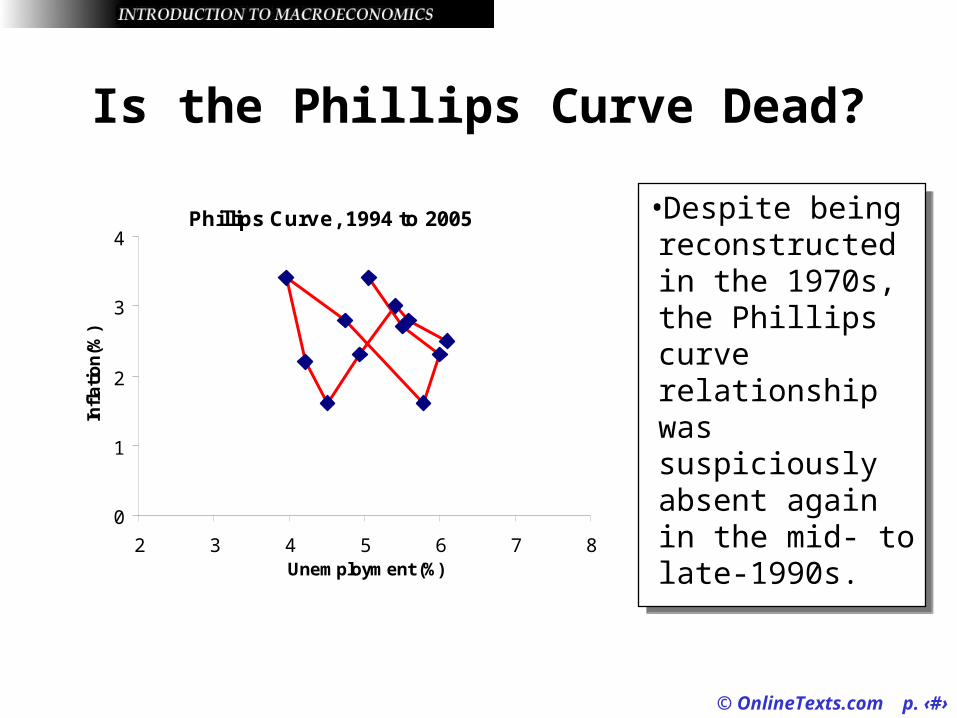
Is the Phillips Curve Dead?
•Despite being reconstructed in the 1970s, the Phillips curve relationship was suspiciously absent again in the mid- to late-1990s.
•Despite being reconstructed in the 1970s, the Phillips curve relationship was suspiciously absent again in the mid- to late-1990s.
Phillips Curve, 1994 to 2005
0
1
2
3
4
2 3 4 5 6 7 8Unemployment (%)
Infl
ati
on
(%))
1994
19951996
2000
1999
1998
2003
2002
1997
2001
2005
2004
© OnlineTexts.com p. ‹#›
© OnlineTexts.com p. ‹#›
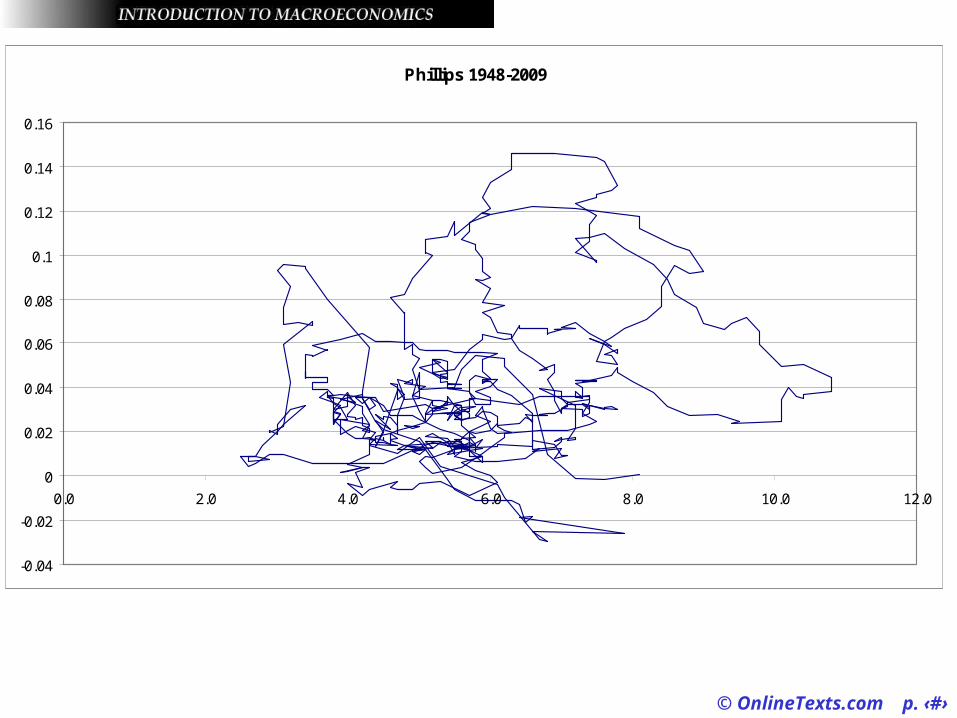
Phillips 1948-2009
-0.04
-0.02
0
0.02
0.04
0.06
0.08
0.1
0.12
0.14
0.16
0.0 2.0 4.0 6.0 8.0 10.0 12.0

© OnlineTexts.com p. ‹#›
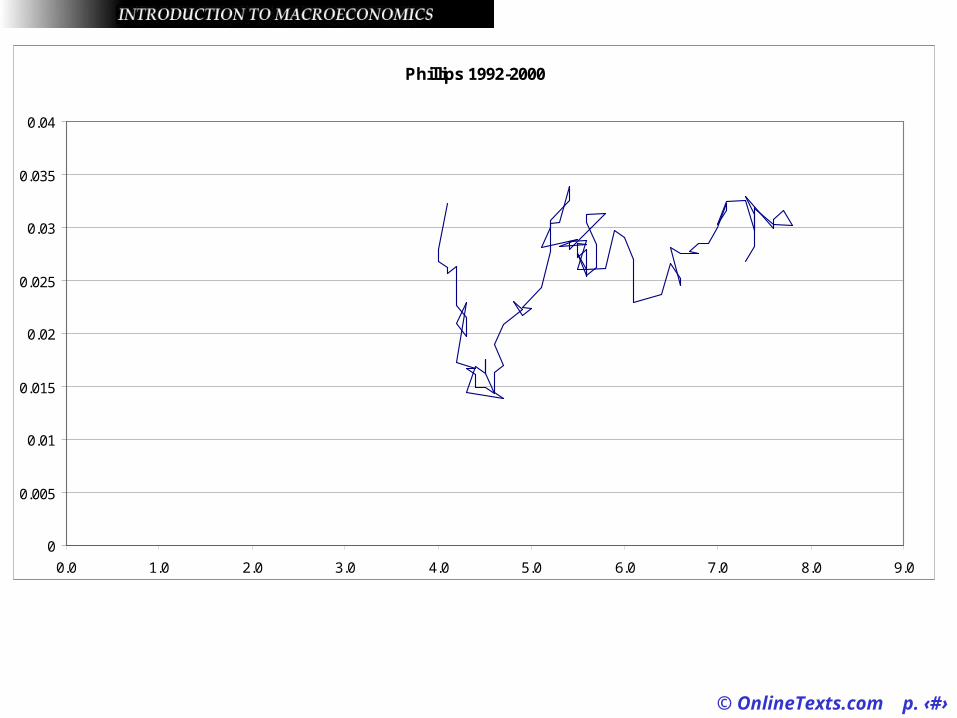
Phillips 1992-2000
0
0.005
0.01
0.015
0.02
0.025
0.03
0.035
0.04
0.0 1.0 2.0 3.0 4.0 5.0 6.0 7.0 8.0 9.0
© OnlineTexts.com p. ‹#›
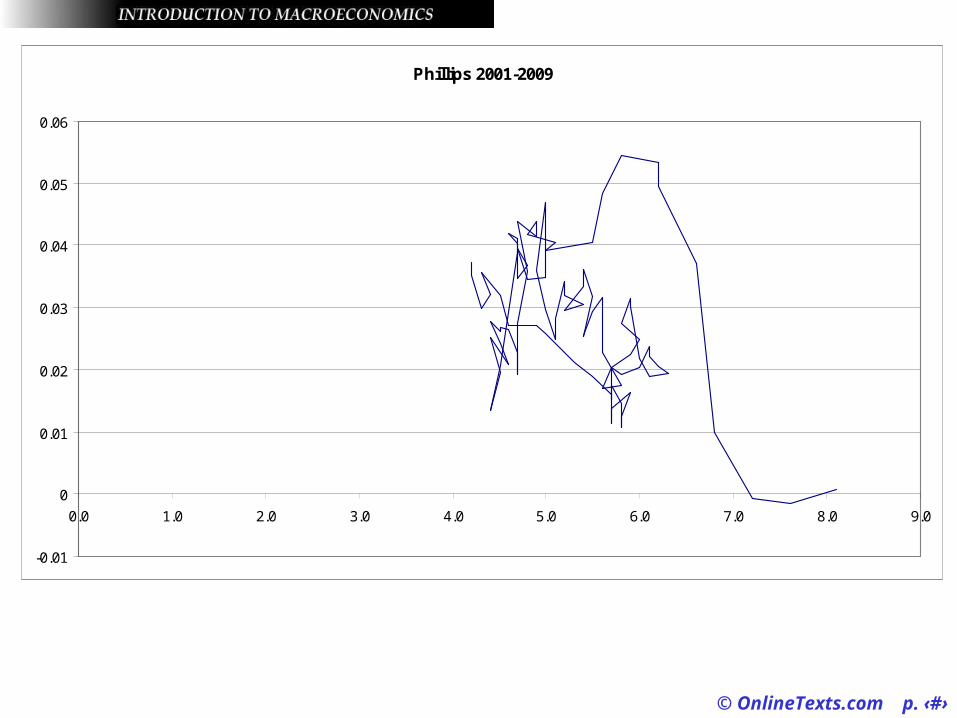
Phillips 2001-2009
-0.01
0
0.01
0.02
0.03
0.04
0.05
0.06
0.0 1.0 2.0 3.0 4.0 5.0 6.0 7.0 8.0 9.0
© OnlineTexts.com p. ‹#›
Phillips 1992-2000
0
0.005
0.01
0.015
0.02
0.025
0.03
0.035
0.04
0.0 1.0 2.0 3.0 4.0 5.0 6.0 7.0 8.0 9.0
© OnlineTexts.com p. ‹#›
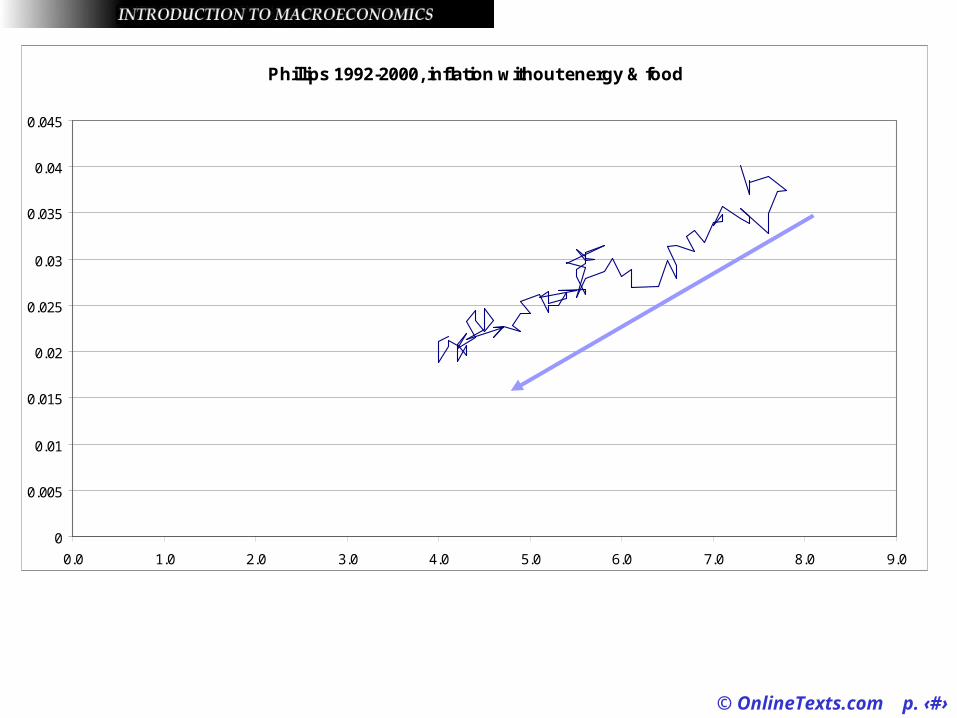
Phillips 1992-2000, inflation without energy & food
0
0.005
0.01
0.015
0.02
0.025
0.03
0.035
0.04
0.045
0.0 1.0 2.0 3.0 4.0 5.0 6.0 7.0 8.0 9.0
© OnlineTexts.com p. ‹#›
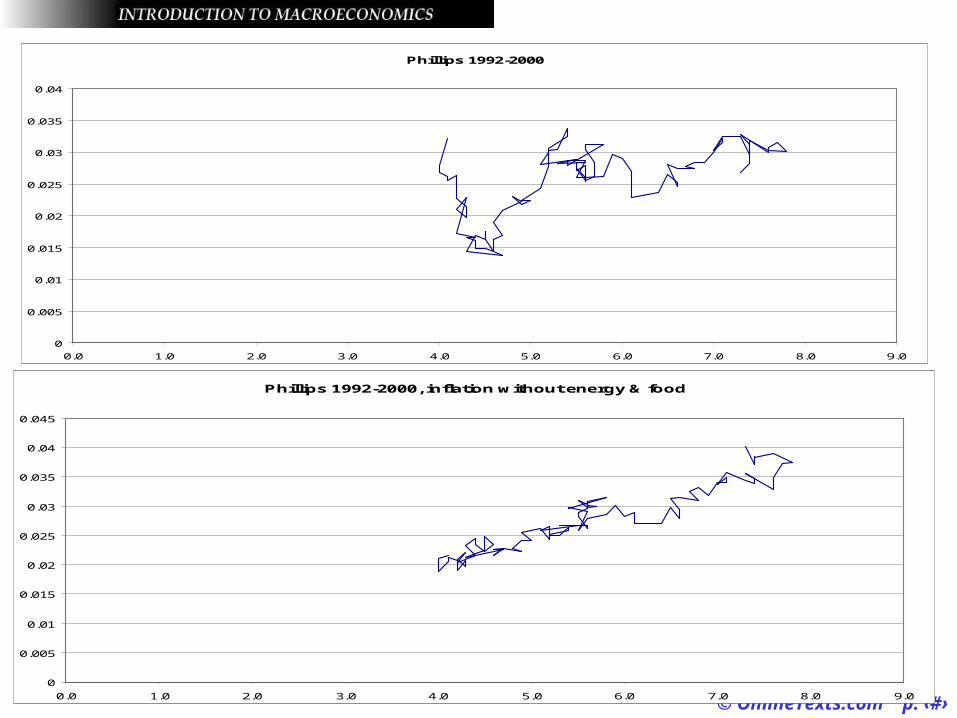
Phillips 1992-2000
0
0.005
0.01
0.015
0.02
0.025
0.03
0.035
0.04
0.0 1.0 2.0 3.0 4.0 5.0 6.0 7.0 8.0 9.0
Phillips 1992-2000, inflation without energy & food
0
0.005
0.01
0.015
0.02
0.025
0.03
0.035
0.04
0.045
0.0 1.0 2.0 3.0 4.0 5.0 6.0 7.0 8.0 9.0
© OnlineTexts.com p. ‹#›
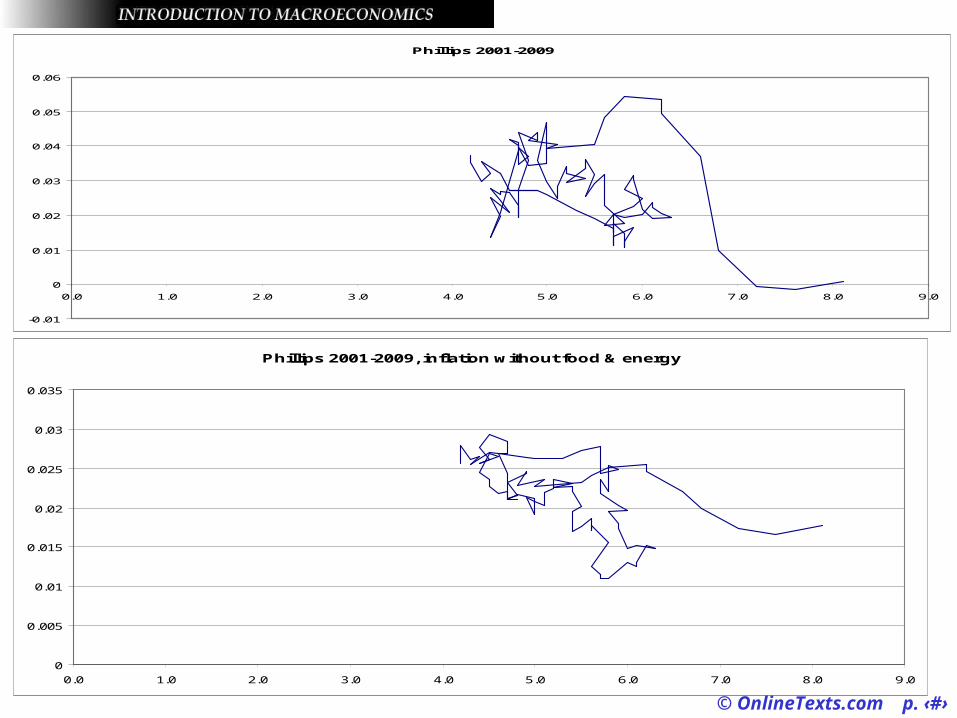
Phillips 2001-2009
-0.01
0
0.01
0.02
0.03
0.04
0.05
0.06
0.0 1.0 2.0 3.0 4.0 5.0 6.0 7.0 8.0 9.0
Phillips 2001-2009, inflation without food & energy
0
0.005
0.01
0.015
0.02
0.025
0.03
0.035
0.0 1.0 2.0 3.0 4.0 5.0 6.0 7.0 8.0 9.0
Is the Phillips Curve Dead?
• Two viewpoints on the relevance of the Phillips Curve:– The relationship between inflation and unemployment has
disappeared altogether.
– Special circumstances such as an increase in labor productivity account for the lack of a relationship. The relationship will return once these factors subside.
• One consensus that certainly has emerged is that the Phillips curve is not a reliable tool to forecast inflation or unemployment.
© OnlineTexts.com p. ‹#›