chapter 17 - california state university, northridgehcbus012/docs/230 solution fall...
TRANSCRIPT
Chapter 16“How Well Am I Doing?” Financial Statement Analysis
Solutions to Questions
16-1 Horizontal analysis examines how a particular item on a financial statement such as sales or cost of goods sold behaves over time. Vertical analysis involves analysis of items on an income statement or balance sheet for a single period. In vertical analysis of the income statement, all items are typically stated as a percentage of sales. In vertical analysis of the balance sheet, all items are typically stated as a percentage of total assets.
16-2 By looking at trends, an analyst hopes to get some idea of whether a situation is improving, remaining the same, or deteriorating. Such analyses can provide insight into what is likely to happen in the future. Rather than looking at trends, an analyst may compare one company to another or to industry averages using common-size financial statements.
16-3 Price-earnings ratios reflect investors’ expectations concerning future earnings. The higher the price-earnings ratio, the greater the growth in earnings investors expect. For this reason, two companies might have the same current earnings and yet have quite different price-earnings ratios. By definition, a stock with current earnings of $4 and a price-earnings ratio of 20 would be selling for $80 per share.
16-4 A company in a rapidly growing technological industry would probably have many opportunities to make investments at a rate of return higher than
stockholders could earn in other investments. From the stockholders’ perspective, it would be better for the company to invest in such opportunities than to pay out dividends. Thus, one would expect the company to have a low dividend payout ratio.
16-5 The dividend yield is the return on an investment in shares of stock from simply collecting dividends. The other source of return on an investment in stock is increases in market value. The dividend yield is computed by dividing the dividend per share by the current market price per share.
16-6 Financial leverage results from borrowing funds at an interest rate that differs from the rate of return on assets acquired using those funds. If the rate of return on the assets is higher than the interest rate at which the funds were borrowed, financial leverage is positive and stockholders gain. If the return on the assets is lower than the interest rate, financial leverage is negative and the stockholders lose.
16-7 If the company experiences wide fluctuations in earnings and net cash flows from operations, stockholders might be pleased that the company has no debt. In hard times, interest payments might be very difficult to meet.
On the other hand, if investments within the company can earn a rate of return that exceeds the interest rate on debt, stockholders would get the benefits
© The McGraw-Hill Companies, Inc., 2008. All rights reserved.Solutions Manual, Chapter 16 877

of positive leverage if the company took on debt.
16-8 The market value of a share of common stock often exceeds the book value per share. Book value represents the cumulative effects on the balance sheet of past activities, evaluated using historical prices. The market value of the stock reflects investors’ expectations about the company’s future earnings. For most companies, market value exceeds book value because investors anticipate future earnings growth.
16-9 A 2 to 1 current ratio might not be adequate for several reasons. First, the composition of the current assets may be heavily weighted toward slow-turning and difficult-to-liquidate inventory, or the inventory may contain large amounts of obsolete goods. Second, the receivables may be low quality, including large amounts of accounts that may be difficult to collect.
© The McGraw-Hill Companies, Inc., 2008878 Managerial Accounting, 12th Edition
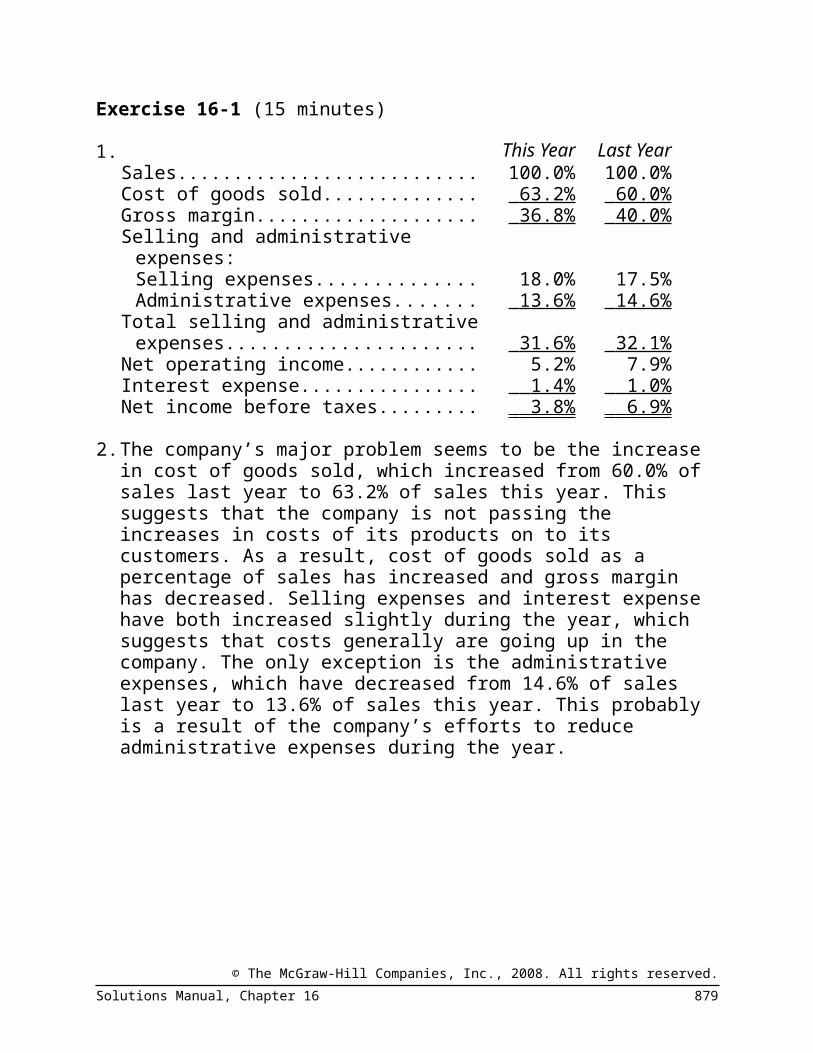
Exercise 16-1 (15 minutes)1. This Year Last Year
Sales.................................................... 100.0% 100.0%Cost of goods sold............................... 63.2% 60.0% Gross margin....................................... 36.8% 40.0% Selling and administrative expenses:
Selling expenses............................... 18.0% 17.5%Administrative expenses................... 13.6% 14.6%
Total selling and administrative ex-penses.............................................. 31.6% 32.1%
Net operating income.......................... 5.2% 7.9%Interest expense.................................. 1.4% 1.0% Net income before taxes..................... 3.8% 6.9%
2. The company’s major problem seems to be the increase in cost of goods sold, which increased from 60.0% of sales last year to 63.2% of sales this year. This suggests that the company is not passing the increases in costs of its products on to its customers. As a result, cost of goods sold as a percentage of sales has increased and gross margin has decreased. Selling expenses and interest expense have both increased slightly during the year, which suggests that costs generally are going up in the company. The only exception is the administrative expenses, which have decreased from 14.6% of sales last year to 13.6% of sales this year. This probably is a result of the company’s efforts to reduce administrative expenses during the year.
© The McGraw-Hill Companies, Inc., 2008. All rights reserved.Solutions Manual, Chapter 16 879

Exercise 16-2 (30 minutes)1. Calculation of the gross margin percentage:
2. Calculation of the earnings per share:
3. Calculation of the price-earnings ratio:
4. Calculation of the dividend payout ratio:
5. Calculation of the dividend yield ratio:
© The McGraw-Hill Companies, Inc., 2008. All rights reserved.880 Managerial Accounting, 12th Edition
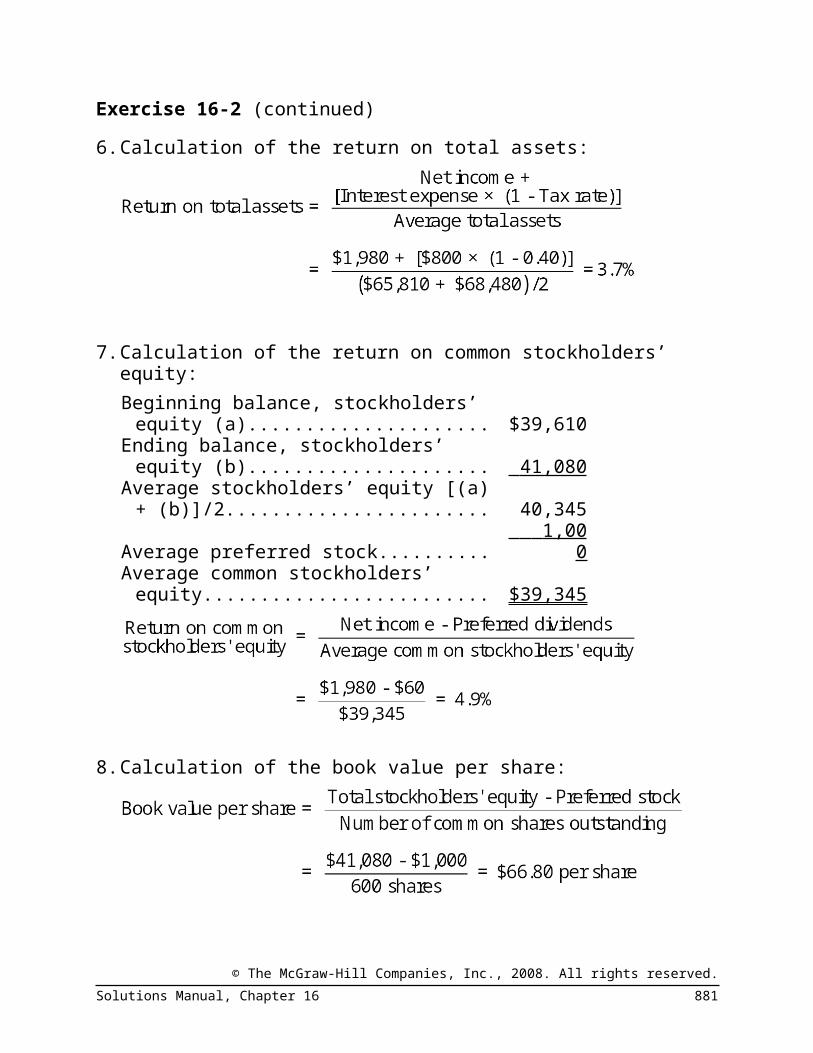
Exercise 16-2 (continued)6. Calculation of the return on total assets:
7. Calculation of the return on common stockholders’ equity:Beginning balance, stockholders’ eq-
uity (a)................................................ $39,610Ending balance, stockholders’ equity
(b)....................................................... 41,080 Average stockholders’ equity [(a) +
(b)]/2................................................... 40,345Average preferred stock........................ 1,000 Average common stockholders’ equity. $39,345
8. Calculation of the book value per share:
© The McGraw-Hill Companies, Inc., 2008. All rights reserved.Solutions Manual, Chapter 16 881

Exercise 16-3 (30 minutes)1. Calculation of working capital:
2. Calculation of the current ratio:
3. Calculation of the acid-test ratio:
4. Calculation of accounts receivable turnover:
© The McGraw-Hill Companies, Inc., 2008. All rights reserved.882 Managerial Accounting, 12th Edition

Exercise 16-3 (continued)5. Calculation of the average collection period:
6. Calculation of inventory turnover:
7. Calculation of the average sale period:
© The McGraw-Hill Companies, Inc., 2008. All rights reserved.Solutions Manual, Chapter 16 883

Exercise 16-4 (15 minutes)1. Calculation of the times interest earned ratio:
2. Calculation of the debt-to-equity ratio:
© The McGraw-Hill Companies, Inc., 2008. All rights reserved.884 Managerial Accounting, 12th Edition

Exercise 16-5 (15 minutes)1. The trend percentages are:
Year 5Year
4Year
3Year
2Year
1Sales............................... 125.0 120.0 110.0 105.0 100.0Current assets:
Cash.............................. 80.0 90.0 105.0 110.0 100.0Accounts receivable...... 140.0 124.0 108.0 104.0 100.0Inventory...................... 112.0 110.0 102.0 108.0 100.0
Total current assets......... 118.8 113.1 104.1 106.9 100.0Current liabilities............. 130.0 106.0 108.0 110.0 100.0
2. Sales: The sales are increasing at a steady rate, with a par-ticularly strong gain in Year 4.
Assets: Cash declined from Year 3 through Year 5. This may have been due to the growth in both inventories and accounts receivable. In particular, the accounts re-ceivable grew far faster than sales in Year 5. The de-cline in cash may reflect delays in collecting receiv-ables. This is a matter for management to investigate further.
Liabili-ties:
The current liabilities jumped up in Year 5. This was probably due to the buildup in accounts receivable in that the company doesn’t have the cash needed to pay bills as they come due.
© The McGraw-Hill Companies, Inc., 2008. All rights reserved.Solutions Manual, Chapter 16 885

Exercise 16-6 (20 minutes)1. Return on total assets:
2. Return on common stockholders’ equity:Net income....................................................... $470,000Preferred dividends: 7% × $800,000................ $56,000Average stockholders’ equity
($3,100,000 + $2,900,000)/2........................$3,000,00
0Average preferred stock ($800,000 +
$800,000)/2................................................... 800,00
0
Average common stockholders’ equity (b).......$2,200,00
0
3. The company has positive financial leverage, since the return on common stockholders’ equity (18.8%) is greater than the return on total assets (10.9%). This positive leverage arises from the long-term debt, which has an after-tax interest cost of only 8.4% [12% interest rate × (1 – 0.30)], and the preferred stock, which carries a dividend rate of only 7%. Both of these figures are smaller than the return that the company is earning on its total assets; thus, the difference goes to the common stockholders.
© The McGraw-Hill Companies, Inc., 2008. All rights reserved.886 Managerial Accounting, 12th Edition

Exercise 16-7 (15 minutes)1. Current assets
($80,000 + $460,000 + $750,000 + $10,000).....................................................
$1,300,000
Current liabilities ($1,300,000 ÷ 2.5)............ 520,000
Working capital..............................................$ 780,00
0
2.
3. a. Working capital would not be affected by a $100,000 payment on accounts payable:
Current assets ($1,300,000 – $100,000)......................................... $1,200,000
Current liabilities ($520,000 – $100,000)......................................... 420,000
Working capital................................... $ 780,000
b. The current ratio would increase if the company makes a $100,000 payment on accounts payable:
© The McGraw-Hill Companies, Inc., 2008. All rights reserved.Solutions Manual, Chapter 16 887

Exercise 16-8 (30 minutes)1. Gross margin percentage:
2. Current ratio:
3. Acid-test ratio:
4. Average collection period:
© The McGraw-Hill Companies, Inc., 2008. All rights reserved.888 Managerial Accounting, 12th Edition

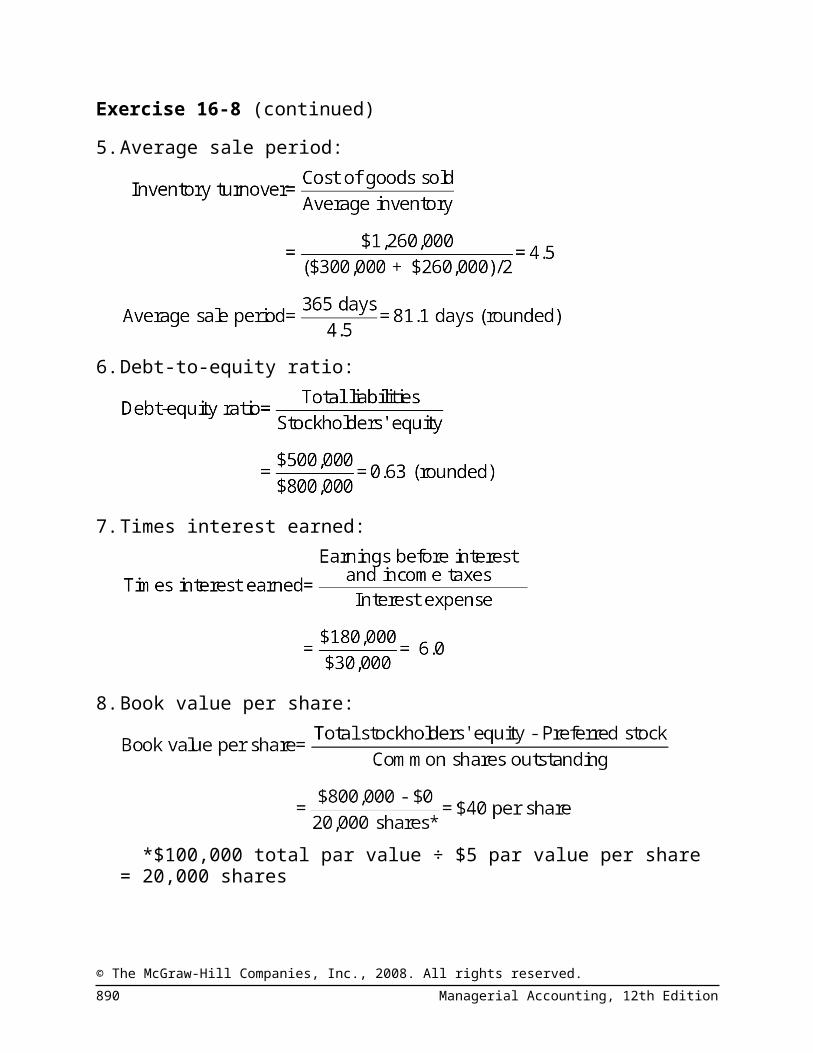
Exercise 16-8 (continued)5. Average sale period:
6. Debt-to-equity ratio:
7. Times interest earned:
8. Book value per share:
*$100,000 total par value ÷ $5 par value per share = 20,000 shares
© The McGraw-Hill Companies, Inc., 2008. All rights reserved.Solutions Manual, Chapter 16 889
Exercise 16-9 (20 minutes)1. Earnings per share:
2. Dividend payout ratio:
3. Dividend yield ratio:
4. Price-earnings ratio:
© The McGraw-Hill Companies, Inc., 2008. All rights reserved.890 Managerial Accounting, 12th Edition

Exercise 16-10 (20 minutes)1. Return on total assets:
2. Return on common stockholders’ equity:
3. Financial leverage was positive because the rate of return to the common stockholders (13.8%) was greater than the rate of return on total assets (10.5%). This positive leverage is traceable in part to the company’s current liabilities, which may carry no interest cost, and to the bonds payable, which have an after-tax interest cost of only 7%.
10% interest rate × (1 – 0.30) = 7% after-tax cost.
© The McGraw-Hill Companies, Inc., 2008. All rights reserved.Solutions Manual, Chapter 16 891

Problem 16-11 (60 minutes)This Year Last Year
1. a. Current assets (a)..............................$2,060,00
0$1,470,00
0Current liabilities (b).......................... 1,100,000 600,000 Working capital (a) − (b)................... $ 960,000 $ 870,000
b. Current assets (a)..............................$2,060,00
0$1,470,00
0
Current liabilities (b)..........................$1,100,00
0 $600,000Current ratio (a) ÷ (b)....................... 1.87 2.45
c.
Cash + marketable securities + ac-counts receivable + short-term notes (a)......................................... $740,000 $650,000
Current liabilities (b)..........................$1,100,00
0 $600,000Acid-test ratio (a) ÷ (b)..................... 0.67 1.08
d. Sales on account (a)..........................$7,000,00
0$6,000,00
0Average receivables (b)..................... $525,000 $375,000Accounts receivable turnover (a) ÷
(b)................................................... 13.3 16.0Average collection period: 365 days
÷ accounts receivable turnover...... 27.4 days 22.8 days
e. Cost of goods sold (a)........................$5,400,00
0$4,800,00
0
Average inventory (b)........................$1,050,00
0 $760,000Inventory turnover ratio (a) ÷ (b)...... 5.1 6.3Average sale period:
365 days ÷ inventory turnover....... 71.6 days 57.9 days
f. Total liabilities (a)..............................$1,850,00
0$1,350,00
0
© The McGraw-Hill Companies, Inc., 2008. All rights reserved.892 Managerial Accounting, 12th Edition

Stockholders’ equity (b)....................$2,150,00
0$1,950,00
0Debt-to-equity ratio (a) ÷ (b)............ 0.86 0.69
g.Net income before interest and
taxes (a).......................................... $630,000 $490,000Interest expense (b).......................... $90,000 $90,000Times interest earned (a) ÷ (b)......... 7.0 5.4
© The McGraw-Hill Companies, Inc., 2008. All rights reserved.Solutions Manual, Chapter 16 893

Problem 16-11 (continued)2. a. Modern Building Supply
Common-Size Balance SheetsThis Year Last Year
Current assets:Cash.................................. 2.3% 6.1%Marketable securities........ 0.0% 1.5%Accounts receivable, net... 16.3% 12.1%Inventory.......................... 32.5% 24.2%Prepaid expenses.............. 0.5% 0.6%
Total current assets............. 51.5% 44.5%Plant and equipment, net.... 48.5% 55.5% Total assets......................... 100.0% 100.0%Liabilities:
Current liabilities............... 27.5% 18.2%Bonds payable, 12%......... 18.8% 22.7%
Total liabilities..................... 46.3% 40.9% Stockholders’ equity:
Preferred stock, $50 par, 8%.................................. 5.0% 6.1%
Common stock, $10 par.... 12.5% 15.2%Retained earnings............. 36.3% 37.9%
Total stockholders’ equity. . . 53.8% 59.1% Total liabilities and equity.... 100.0% 100.0%Note: Columns may not total down due to rounding.
© The McGraw-Hill Companies, Inc., 2008. All rights reserved.894 Managerial Accounting, 12th Edition

Problem 16-11 (continued)b. Modern Building Supply
Common-Size Income StatementsThis Year Last Year
Sales............................................ 100.0% 100.0%Cost of goods sold....................... 77.1% 80.0% Gross margin............................... 22.9% 20.0%Selling and administrative ex-
penses....................................... 13.9% 11.8% Net operating income.................. 9.0% 8.2%Interest expense.......................... 1.3% 1.5% Net income before taxes............. 7.7% 6.7% Income taxes............................... 3.1% 2.7% Net income.................................. 4.6% 4.0%
3. The following points can be made from the analytical work in parts (1) and (2) above:The company has improved its profit margin from last year. This is attributable to an increase in gross margin, which is offset somewhat by an increase in operating expenses. In both years the company’s net income as a percentage of sales equals or exceeds the industry average of 4%.Although the company’s working capital has increased, its current position actually has deteriorated significantly since last year. Both the current ratio and the acid-test ratio are well below the industry average, and both are trending downward. (This shows the importance of not just looking at the working capital in assessing the financial strength of a company.) Given the present trend, it soon will be impossible for the company to pay its bills as they come due.
© The McGraw-Hill Companies, Inc., 2008. All rights reserved.Solutions Manual, Chapter 16 895

Problem 16-11 (continued)The drain on the cash account seems to be a result mostly of a large buildup in accounts receivable and inventory. This is evident both from the common-size balance sheet and from the financial ratios. Notice that the average collection period has increased by 4.6 days since last year, and that it is now 9 days over the industry average. Many of the company’s customers are not taking their discounts, since the average collection period is 27 days and collection terms are 2/10, n/30. This suggests financial weakness on the part of these customers, or sales to customers who are poor credit risks. Perhaps the company has been too aggressive in expanding its sales.The inventory turnover was only 5 times this year as compared to over 6 times last year. It takes three weeks longer for the company to turn its inventory than the average for the industry (71 days as compared to 50 days for the industry). This suggests that inventory stocks are higher than they need to be.The loan should be approved on the condition that the company take immediate steps to get its accounts receivable and inventory back under control. This would mean more rigorous checks of creditworthiness before sales are made and perhaps declining credit to slow paying customers. It would also mean a sharp reduction of inventory levels to a more manageable size. If these steps are taken, it appears that sufficient funds could be generated to repay the loan in a reasonable period of time.
© The McGraw-Hill Companies, Inc., 2008. All rights reserved.896 Managerial Accounting, 12th Edition

Problem 16-12 (60 minutes)1. a. This Year Last Year
Net income...................................... $324,000 $240,000Less preferred dividends.................. 16,000 16,000 Net income remaining for common
(a).................................................. $308,000 $224,000Average number of common shares
(b).................................................. 50,000 50,000Earnings per share (a) ÷ (b)............ $6.16 $4.48
b. Dividends per share (a)*.................. $2.16 $1.20Market price per share (b)............... $45.00 $36.00Dividend yield ratio (a) ÷ (b)........... 4.8% 3.33%*$108,000 ÷ 50,000 shares = $2.16;
$60,000 ÷ 50,000 shares = $1.20
c. Dividends per share (a)................... $2.16 $1.20Earnings per share (b)..................... $6.16 $4.48Dividend payout ratio (a) ÷ (b)....... 35.1% 26.8%
d. Market price per share (a)............... $45.00 $36.00Earnings per share (b)..................... $6.16 $4.48Price-earnings ratio (a) ÷ (b)........... 7.3 8.0Investors regard Modern Building Supply less favorably than other companies in the industry. This is evidenced by the fact that they are willing to pay only 7.3 times current earnings for a share of the company’s stock, as compared to 9 times current earnings for other companies in the industry. If investors were willing to pay 9 times current earnings for Modern Building Supply’s stock, then it would be selling for about $55 per share (9 × $6.16), rather than for only $45 per share.
© The McGraw-Hill Companies, Inc., 2008. All rights reserved.Solutions Manual, Chapter 16 897

Problem 16-12 (continued)e. This Year Last Year
Total stockholders’ equity.............. $2,150,000$1,950,00
0Less preferred stock...................... 200,000 200,000
Common stockholders’ equity (a). $1,950,000$1,750,00
0Number of common shares out-
standing (b)................................ 50,000 50,000Book value per share (a) ÷ (b)...... $39.00 $35.00A market price in excess of book value does not mean that the price of a stock is too high. Market value is an indication of investors’ perceptions of future earnings and/or dividends, whereas book value is a result of already completed transactions.
2. a. This Year Last Year
Net income.................................... $ 324,000$ 240,00
0Add after-tax cost of interest paid:
[$90,000 × (1 – 0.40)]................ 54,000 54,000
Total (a)......................................... $ 378,000 $ 294,00
0
Average total assets (b)................ $3,650,000$3,000,00
0Return on total assets (a) ÷ (b)..... 10.4% 9.8%
b. This Year Last Year
Net income.................................... $ 324,000$ 240,00
0Less preferred dividends............... 16,000 16,000 Net income remaining for com-
mon (a)....................................... $ 308,000 $ 224,00
0Average total stockholders’ eq-
uity*............................................ $2,050,000$1,868,00
0Less average preferred stock........ 200,000 200,000 Average common stockholders’
equity (b).................................... $1,850,000$1,668,00
0© The McGraw-Hill Companies, Inc., 2008. All rights reserved.898 Managerial Accounting, 12th Edition

*1/2($2,150,000 + $1,950,000); 1/2($1,950,000 + $1,786,000).
Return on common stockholders’ equity (a) ÷ (b)........................... 16.6% 13.4%
© The McGraw-Hill Companies, Inc., 2008. All rights reserved.Solutions Manual, Chapter 16 899

Problem 16-12 (continued)c. Financial leverage is positive in both years, since the return
on common equity is greater than the return on total assets. This positive financial leverage is due to three factors: the preferred stock, which has a dividend of only 8%; the bonds, which have an after-tax interest cost of only 7.2% [12% interest rate × (1 – 0.40) = 7.2%]; and the accounts payable, which may bear no interest cost.
3. We would recommend keeping the stock. The stock’s downside risk seems small, since it is selling for only 7.3 times current earnings as compared to 9 times earnings for other companies in the industry. In addition, its earnings are strong and trending upward, and its return on common equity (16.6%) is extremely good. Its return on total assets (10.4%) compares favorably with that of the industry.The risk, of course, is whether the company can get its cash problem under control. Conceivably, the cash problem could worsen, leading to an eventual reduction in profits through inability to operate, a reduction in dividends, and a precipitous drop in the market price of the company’s stock. This does not seem likely, however, since the company can easily control its cash problem through more careful management of accounts receivable and inventory. If this problem is brought under control, the price of the stock could rise sharply over the next few years, making it an excellent investment.
© The McGraw-Hill Companies, Inc., 2008. All rights reserved.900 Managerial Accounting, 12th Edition

Problem 16-13 (30 minutes)1. a. Computation of working capital:
Current assets:Cash..................................... $ 70,000Marketable securities........... 12,000Accounts receivable, net...... 350,000Inventory.............................. 460,000Prepaid expenses................. 8,000
Total current assets (a)........... 900,000 Current liabilities:
Accounts payable................. 200,000Accrued liabilities................. 60,000Notes due in one year.......... 100,000
Total current liabilities (b)....... 360,000 Working capital (a) − (b)......... $540,000
b. Computation of the current ratio:
c. Computation of the acid-test ratio:
© The McGraw-Hill Companies, Inc., 2008. All rights reserved.Solutions Manual, Chapter 16 901

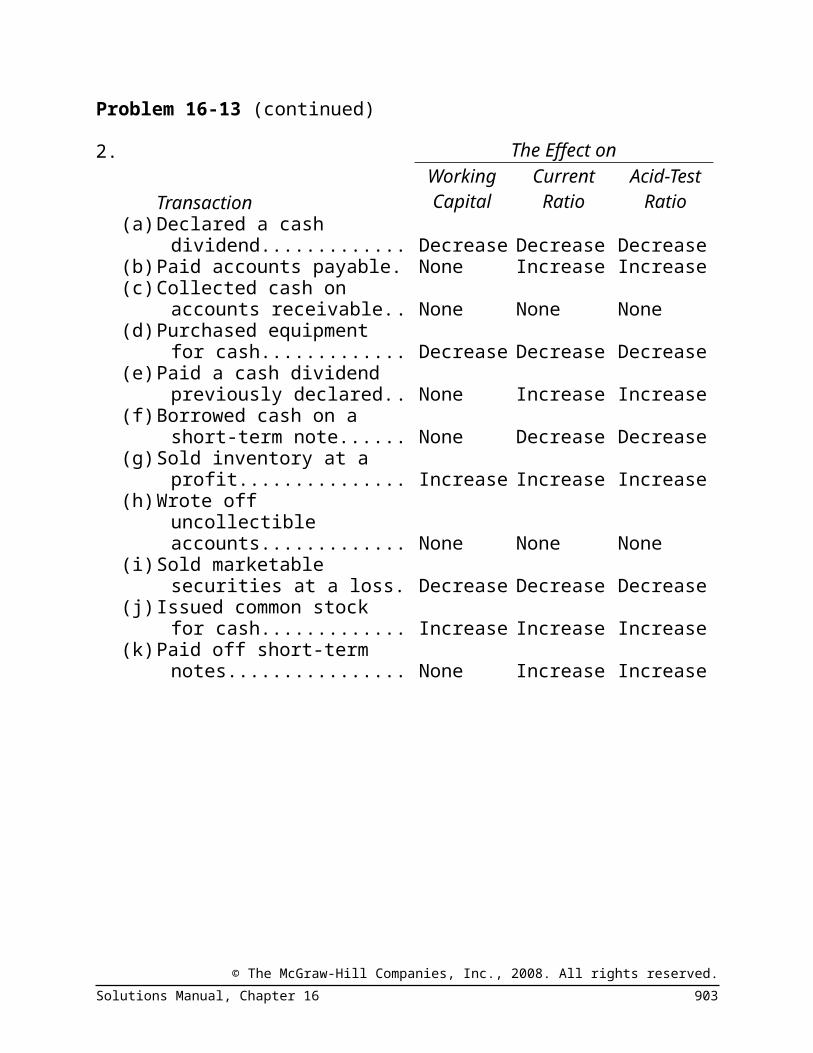
Problem 16-13 (continued)2. The Effect on
Working Current Acid-TestTransaction Capital Ratio Ratio
(a) Declared a cash dividend. . Decrease Decrease Decrease(b) Paid accounts payable....... None Increase Increase(c) Collected cash on ac-
counts receivable............ None None None(d) Purchased equipment for
cash................................ Decrease Decrease Decrease(e) Paid a cash dividend pre-
viously declared.............. None Increase Increase(f) Borrowed cash on a short-
term note........................ None Decrease Decrease(g) Sold inventory at a profit... Increase Increase Increase(h) Wrote off uncollectible ac-
counts............................. None None None(i) Sold marketable securi-
ties at a loss.................... Decrease Decrease Decrease(j) Issued common stock for
cash................................ Increase Increase Increase(k) Paid off short-term notes... None Increase Increase
© The McGraw-Hill Companies, Inc., 2008. All rights reserved.902 Managerial Accounting, 12th Edition
Problem 16-14 (90 minutes)1. a. This Year Last Year
Net income...................................... $ 280,000$ 168,00
0Add after-tax cost of interest:
$120,000 × (1 – 0.30)................... 84,000
$100,000 × (1 – 0.30)................... 70,00
0
Total (a)........................................... $ 364,000 $ 238,00
0
Average total assets (b).................. $5,330,000$4,640,00
0Return on total assets (a) ÷ (b)....... 6.8% 5.1%
b. Net income...................................... $ 280,000$ 168,00
0
Less preferred dividends................. 48,000 48,00
0Net income remaining for common
(a)................................................. $ 232,000 $ 120,00
0
Average total stockholders’ equity. . $3,120,000$3,028,00
0
Less average preferred stock.......... 600,000 600,00
0
Average common equity (b)............ $2,520,000$2,428,00
0Return on common stockholders’
equity (a) ÷ (b)............................. 9.2% 4.9%
c. Leverage is positive for this year because the return on com-mon equity (9.2%) is greater than the return on total assets (6.8%). For last year, leverage is negative because the return on the common equity (4.9%) is less than the return on total assets (5.1%).
2. a. Net income remaining for common [see above] (a).............................. $232,000 $120,000
Average number of common shares 50,000 50,000© The McGraw-Hill Companies, Inc., 2008. All rights reserved.
Solutions Manual, Chapter 16 903

outstanding (b).............................Earnings per share (a) ÷ (b)............ $4.64 $2.40
b. Dividends per share (a)................... $1.44 $0.72Market price per share (b)............... $36.00 $20.00Dividend yield ratio (a) ÷ (b)........... 4.0% 3.6%
© The McGraw-Hill Companies, Inc., 2008. All rights reserved.904 Managerial Accounting, 12th Edition

Problem 16-14 (continued)This Year Last Year
c. Dividends per share (a)................... $1.44 $0.72Earnings per share (b)..................... $4.64 $2.40Dividend payout ratio (a) ÷ (b)....... 31.0% 30.0%
d. Market price per share (a)................ $36.00 $20.00Earnings per share (b)...................... $4.64 $2.40Price-earnings ratio (a) ÷ (b)............ 7.8 8.3Notice from the data given in the problem that the typical P/E ratio for companies in Hedrick’s industry is 10. Hedrick Company presently has a P/E ratio of only 7.8, so investors appear to regard it less well than they do other companies in the industry. That is, investors are willing to pay only 7.8 times current earnings for a share of Hedrick Company’s stock, as compared to 10 times current earnings for a share of stock for the typical company in the industry.
e. Stockholders’ equity........................ $3,200,000$3,040,00
0Less preferred stock........................ 600,000 600,000
Common stockholders’ equity (a).... $2,600,000$2,440,00
0Number of common shares out-
standing (b).................................. 50,000 50,000Book value per share (a) ÷ (b)........ $52.00 $48.80Note that the book value of Hedrick Company’s stock is greater than its market value for both years. This does not necessarily indicate that the stock is selling at a bargain price. Market value is an indication of investors’ perceptions of future earnings and/or dividends, whereas book value is a result of already completed transactions.
f. Gross margin (a).............................. $1,050,000 $860,000
Sales (b).......................................... $5,250,000$4,160,00
0Gross margin percentage (a) ÷ (b).. 20.0% 20.7%
© The McGraw-Hill Companies, Inc., 2008. All rights reserved.Solutions Manual, Chapter 16 905

Problem 16-14 (continued)3. a. This Year Last Year
Current assets (a)..............................$2,600,00
0$1,980,00
0
Current liabilities (b).......................... 1,300,000 920,00
0
Working capital (a) − (b)...................$1,300,00
0$1,060,00
0
b.Current assets (a)..............................
$2,600,000
$1,980,000
Current liabilities (b)..........................$1,300,00
0 $920,000Current ratio (a) ÷ (b)....................... 2.0 2.15
c. Cash + marketable securities + ac-counts receivable + short-term notes (a).........................................
$1,220,000
$1,120,000
Current liabilities (b)..........................$1,300,00
0 $920,000Acid-test ratio (a) ÷ (b)..................... 0.94 1.22
d.Sales on account (a)..........................
$5,250,000
$4,160,000
Average receivables (b)..................... $750,000 $560,000Accounts receivable turnover (a) ÷
(b)................................................... 7.0 7.4Average collection period: 365 days
÷ accounts receivable turnover...... 52 days 49 days
e.Cost of goods sold (a)........................
$4,200,000
$3,300,000
Average inventory balance (b)..........$1,050,00
0 $720,000Inventory turnover ratio (a) ÷ (b)...... 4.0 4.6Average sales period: 365 days ÷
inventory turnover ratio.................. 91 days 79 days
f. Total liabilities (a).............................. $2,500,00 $1,920,00
© The McGraw-Hill Companies, Inc., 2008. All rights reserved.906 Managerial Accounting, 12th Edition

0 0
Stockholders’ equity (b)....................$3,200,00
0$3,040,00
0Debt-to-equity ratio (a) ÷ (b)............ 0.78 0.63
g. Net income before interest and in-come taxes (a)................................ $520,000 $340,000
Interest expense (b).......................... $120,000 $100,000Times interest earned (a) ÷ (b)......... 4.3 3.4
© The McGraw-Hill Companies, Inc., 2008. All rights reserved.Solutions Manual, Chapter 16 907

Problem 16-14 (continued)4. As stated by Marva Rossen, both net income and sales are up
from last year. The return on total assets has improved from 5.1% last year to 6.8% this year, and the return on common equity is up to 9.2% from 4.9% the year before. But this appears to be the only bright spot. Virtually all other ratios are below what is typical for the industry, and, more important, they are trending downward. The deterioration in the gross margin percentage, while not large, is worrisome. Sales and inventories have increased substantially, which should ordinarily result in an improvement in the gross margin percentage as fixed costs are spread over more units. However, the gross margin percentage has declined.Notice particularly that the average collection period has lengthened to 52 days—about three weeks over the industry—and that the inventory turnover is 50% longer than the industry. The increase in sales may have been obtained at least in part by extending credit to high-risk customers. Also notice that the debt-to-equity ratio is rising rapidly. If the $1,000,000 loan is granted, the ratio will rise further to 1.09.In our opinion, what the company needs is more equity—not more debt. Therefore, the loan should not be approved. The company should be encouraged to issue more common stock.
© The McGraw-Hill Companies, Inc., 2008. All rights reserved.908 Managerial Accounting, 12th Edition

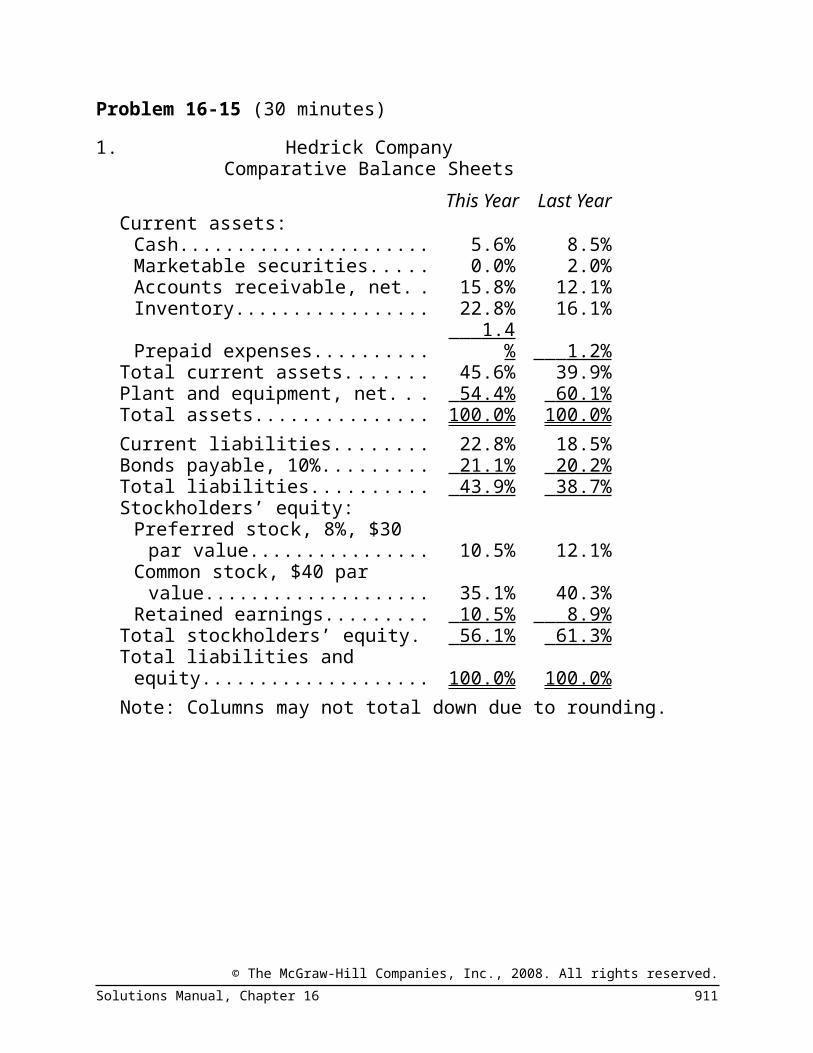
Problem 16-15 (30 minutes)1. Hedrick Company
Comparative Balance SheetsThis Year Last Year
Current assets:Cash.......................................... 5.6% 8.5%Marketable securities................ 0.0% 2.0%Accounts receivable, net........... 15.8% 12.1%Inventory................................... 22.8% 16.1%Prepaid expenses...................... 1.4% 1.2%
Total current assets..................... 45.6% 39.9%Plant and equipment, net............ 54.4% 60.1% Total assets.................................. 100.0% 100.0%Current liabilities......................... 22.8% 18.5%Bonds payable, 10%.................... 21.1% 20.2% Total liabilities.............................. 43.9% 38.7% Stockholders’ equity:
Preferred stock, 8%, $30 par value....................................... 10.5% 12.1%
Common stock, $40 par value. . 35.1% 40.3%Retained earnings..................... 10.5% 8.9%
Total stockholders’ equity............ 56.1% 61.3% Total liabilities and equity............ 100.0% 100.0%Note: Columns may not total down due to rounding.
© The McGraw-Hill Companies, Inc., 2008. All rights reserved.Solutions Manual, Chapter 16 909
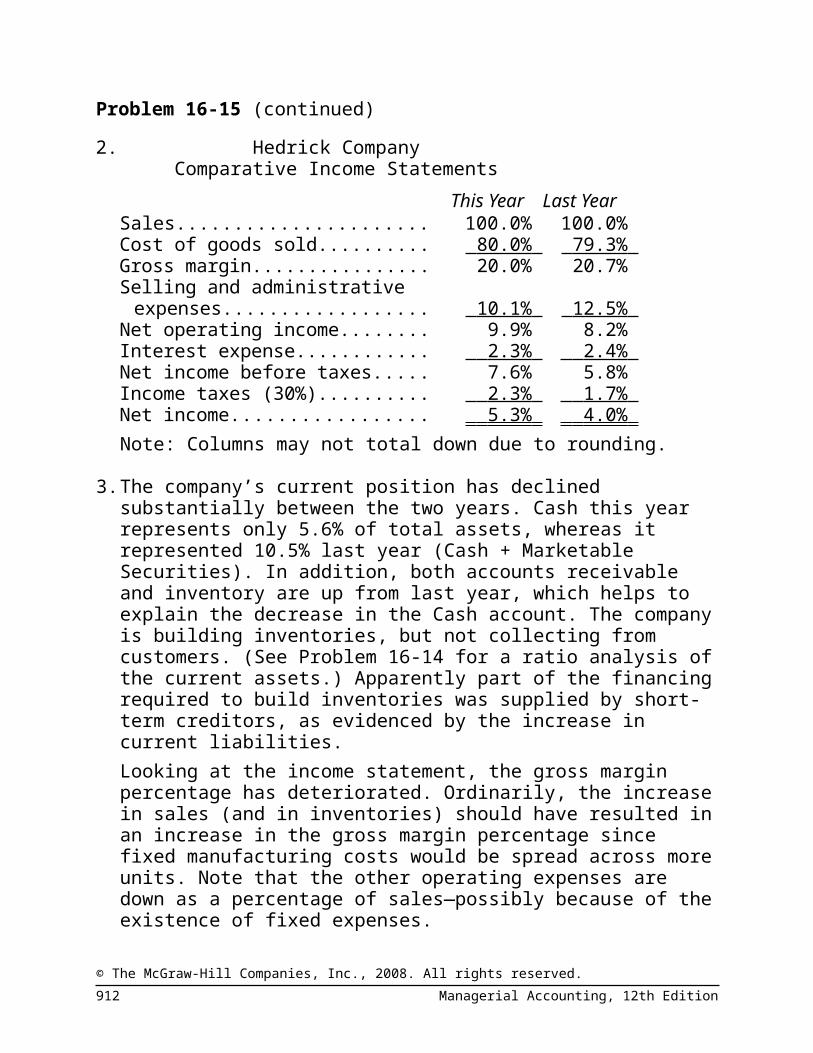
Problem 16-15 (continued)2. Hedrick Company
Comparative Income StatementsThis Year Last Year
Sales............................................ 100.0% 100.0%Cost of goods sold........................ 80.0% 79.3% Gross margin............................... 20.0% 20.7%Selling and administrative ex-
penses....................................... 10.1% 12.5% Net operating income.................. 9.9% 8.2%Interest expense.......................... 2.3% 2.4% Net income before taxes.............. 7.6% 5.8%Income taxes (30%)..................... 2.3% 1.7% Net income.................................. 5.3% 4.0% Note: Columns may not total down due to rounding.
3. The company’s current position has declined substantially between the two years. Cash this year represents only 5.6% of total assets, whereas it represented 10.5% last year (Cash + Marketable Securities). In addition, both accounts receivable and inventory are up from last year, which helps to explain the decrease in the Cash account. The company is building inventories, but not collecting from customers. (See Problem 16-14 for a ratio analysis of the current assets.) Apparently part of the financing required to build inventories was supplied by short-term creditors, as evidenced by the increase in current liabilities.Looking at the income statement, the gross margin percentage has deteriorated. Ordinarily, the increase in sales (and in inventories) should have resulted in an increase in the gross margin percentage since fixed manufacturing costs would be spread across more units. Note that the other operating expenses are down as a percentage of sales—possibly because of the existence of fixed expenses.
© The McGraw-Hill Companies, Inc., 2008. All rights reserved.910 Managerial Accounting, 12th Edition
Problem 16-16 (45 minutes)1. De-
creaseSale of inventory at a profit will be reflected in an in-crease in retained earnings, which is part of stock-holders’ equity. An increase in stockholders’ equity will result in a decrease in the ratio of assets pro-vided by creditors as compared to assets provided by owners.
2. No ef-fect
Purchasing land for cash has no effect on earnings or on the number of shares of common stock out-standing. One asset is exchanged for another.
3. Increase A sale of inventory on account will increase the quick assets (cash, accounts receivable, marketable securities) but have no effect on the current liabili-ties. For this reason, the acid-test ratio will increase.
4. No ef-fect
Payments on account reduce cash and accounts payable by equal amounts; thus, the net amount of working capital is not affected.
5. De-crease
When a customer pays a bill, the accounts receiv-able balance is reduced. This increases the accounts receivable turnover, which in turn decreases the av-erage collection period.
6. De-crease
Declaring a cash dividend will increase current liabil-ities, but have no effect on current assets. There-fore, the current ratio will decrease.
7. Increase Payment of a previously declared cash dividend will reduce both current assets and current liabilities by the same amount. An equal reduction in both cur-rent assets and current liabilities will always result in an increase in the current ratio, so long as the current assets exceed the current liabilities.
8. No ef-fect
Book value per share is not affected by the current market price of the company’s stock.
© The McGraw-Hill Companies, Inc., 2008. All rights reserved.Solutions Manual, Chapter 16 911
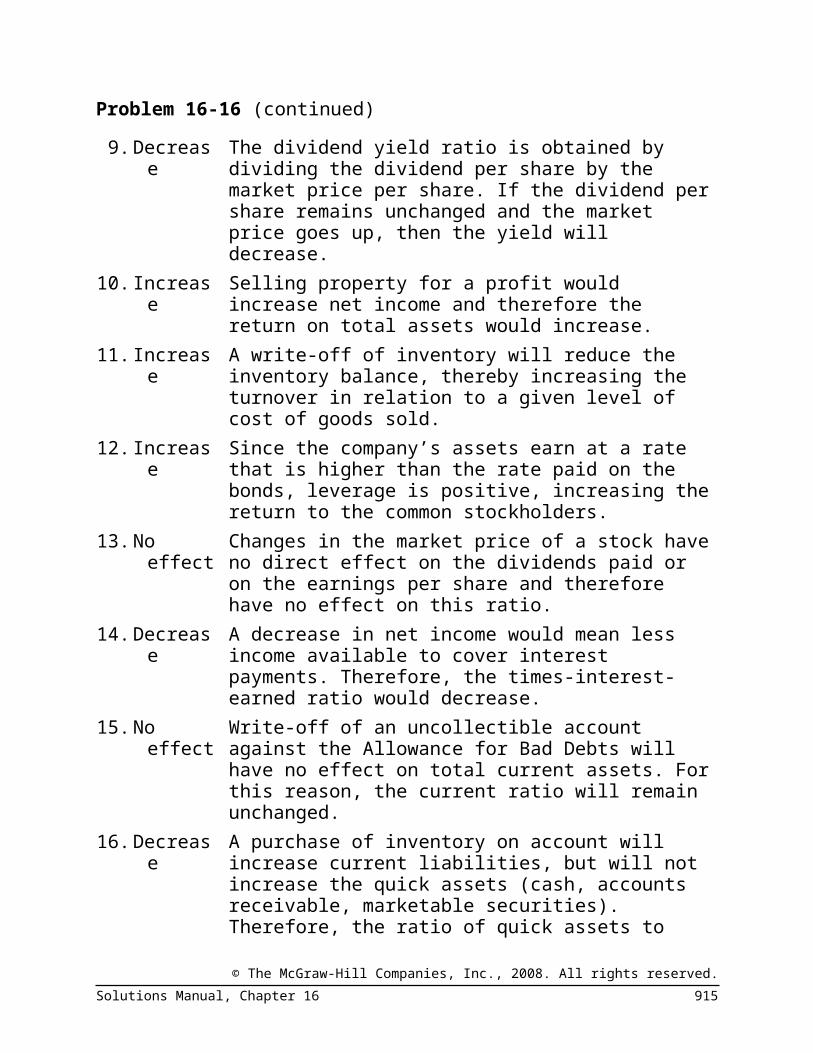
Problem 16-16 (continued)9. De-
creaseThe dividend yield ratio is obtained by dividing the dividend per share by the market price per share. If the dividend per share remains unchanged and the market price goes up, then the yield will decrease.
10. Increase Selling property for a profit would increase net in-come and therefore the return on total assets would increase.
11. Increase A write-off of inventory will reduce the inventory balance, thereby increasing the turnover in relation to a given level of cost of goods sold.
12. Increase Since the company’s assets earn at a rate that is higher than the rate paid on the bonds, leverage is positive, increasing the return to the common stock-holders.
13. No ef-fect
Changes in the market price of a stock have no di-rect effect on the dividends paid or on the earnings per share and therefore have no effect on this ratio.
14. De-crease
A decrease in net income would mean less income available to cover interest payments. Therefore, the times-interest-earned ratio would decrease.
15. No ef-fect
Write-off of an uncollectible account against the Al-lowance for Bad Debts will have no effect on total current assets. For this reason, the current ratio will remain unchanged.
16. De-crease
A purchase of inventory on account will increase current liabilities, but will not increase the quick as-sets (cash, accounts receivable, marketable securi-ties). Therefore, the ratio of quick assets to current liabilities will decrease.
17. Increase The price-earnings ratio is obtained by dividing the market price per share by the earnings per share. If the earnings per share remains unchanged, and the market price goes up, then the price-earnings ratio will increase.
18. De- Payments to creditors will reduce the total liabilities © The McGraw-Hill Companies, Inc., 2008. All rights reserved.912 Managerial Accounting, 12th Edition

crease of a company, thereby decreasing the ratio of total debt to total equity.
© The McGraw-Hill Companies, Inc., 2008. All rights reserved.Solutions Manual, Chapter 16 913

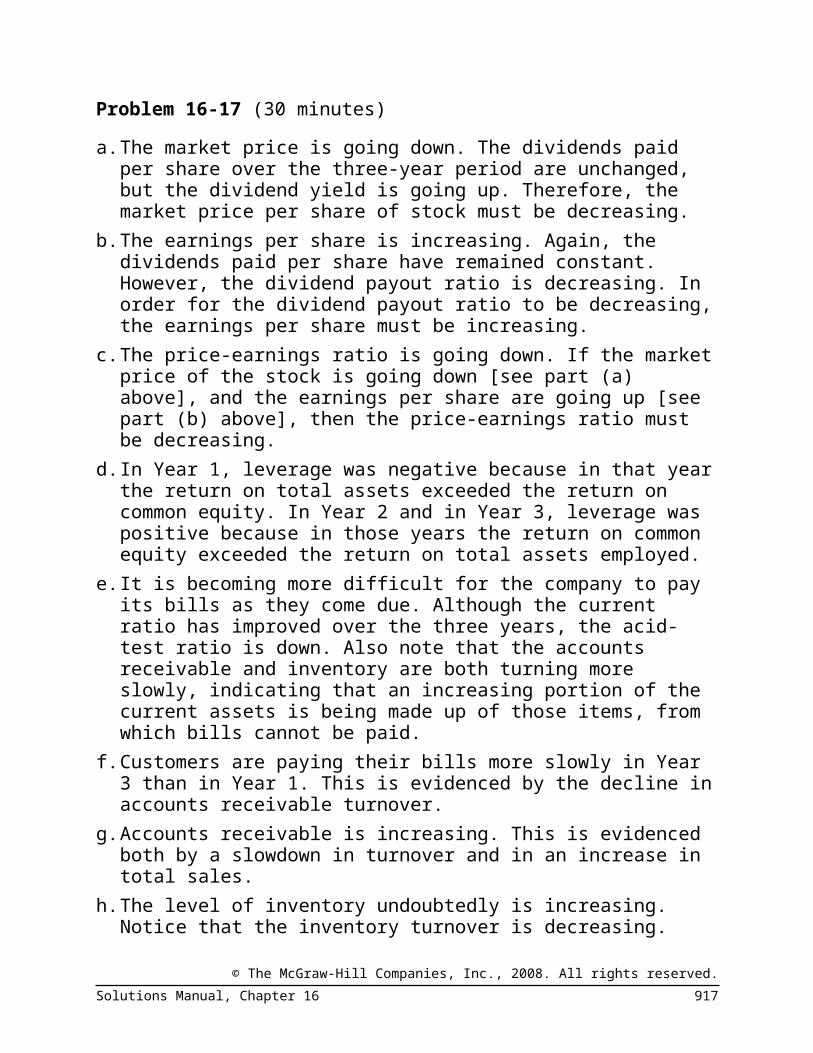
Problem 16-17 (30 minutes)a. The market price is going down. The dividends paid per share
over the three-year period are unchanged, but the dividend yield is going up. Therefore, the market price per share of stock must be decreasing.
b. The earnings per share is increasing. Again, the dividends paid per share have remained constant. However, the dividend payout ratio is decreasing. In order for the dividend payout ratio to be decreasing, the earnings per share must be increasing.
c. The price-earnings ratio is going down. If the market price of the stock is going down [see part (a) above], and the earnings per share are going up [see part (b) above], then the price-earnings ratio must be decreasing.
d. In Year 1, leverage was negative because in that year the return on total assets exceeded the return on common equity. In Year 2 and in Year 3, leverage was positive because in those years the return on common equity exceeded the return on total assets employed.
e. It is becoming more difficult for the company to pay its bills as they come due. Although the current ratio has improved over the three years, the acid-test ratio is down. Also note that the accounts receivable and inventory are both turning more slowly, indicating that an increasing portion of the current assets is being made up of those items, from which bills cannot be paid.
f. Customers are paying their bills more slowly in Year 3 than in Year 1. This is evidenced by the decline in accounts receivable turnover.
g. Accounts receivable is increasing. This is evidenced both by a slowdown in turnover and in an increase in total sales.
h. The level of inventory undoubtedly is increasing. Notice that the inventory turnover is decreasing. Even if sales (and cost of goods sold) just remained constant, this would be evidence of a larger average inventory on hand. However, sales are not constant but rather are increasing. With sales increasing (and undoubtedly cost of goods sold also increasing), the average
© The McGraw-Hill Companies, Inc., 2008. All rights reserved.914 Managerial Accounting, 12th Edition
level of inventory must be increasing as well in order to service the larger volume of sales.
© The McGraw-Hill Companies, Inc., 2008. All rights reserved.Solutions Manual, Chapter 16 915

Problem 16-18 (45 minutes)1. The loan officer stipulated that the current ratio prior to
obtaining the loan must be higher than 2.0, the acid-test ratio must be higher than 1.0, and the interest on the loan must be no more than one-fourth of net operating income. These ratios are computed below:
The company would not qualify for the loan because both its current ratio and its acid-test ratio are too low.
© The McGraw-Hill Companies, Inc., 2008. All rights reserved.916 Managerial Accounting, 12th Edition
Problem 16-18 (continued)2. By reclassifying the $68 thousand net book value of the old
equipment as inventory, the current ratio would improve, but the acid-test ratio would be unaffected. Inventory is considered a current asset for purposes of computing the current ratio, but is not included in the numerator when computing the acid-test ratio.
Even if this tactic had succeeded in qualifying the company for the loan, we strongly advise against it. Inventories are assets the company has acquired to sell to customers in the normal course of business. Used production equipment is not inventory—even if there is a clear intention to sell it in the near future. The loan officer would not expect used equipment to be included in inventories; doing so would be intentionally misleading.
© The McGraw-Hill Companies, Inc., 2008. All rights reserved.Solutions Manual, Chapter 16 917

Problem 16-18 (continued)Nevertheless, the old equipment is an asset that could be turned into cash. If this were done, the company would immediately qualify for the loan since the $68 thousand in cash would be included in the numerator in both the current ratio and in the acid-test ratio.
However, other options may be available. The old equipment is being used to relieve bottlenecks in the heat-treating process and it would be desirable to keep this standby capacity. We would advise Jurgen to fully and honestly explain the situation to the loan officer. The loan officer might insist that the equipment be sold before any loan is approved, but she might instead grant a waiver of the current ratio and acid-test ratio requirements on the basis that they could be satisfied by selling the old equipment. Or she may approve the loan on the condition that the equipment is pledged as collateral. In that case, Jurgen would only have to sell the equipment if he would otherwise be unable to pay back the loan.
© The McGraw-Hill Companies, Inc., 2008. All rights reserved.918 Managerial Accounting, 12th Edition

Problem 16-19 (60 minutes or longer)Tanner Company
Income StatementFor the Year Ended December 31
KeySales.................................................. $2,700,000Cost of goods sold............................. 1,800,000 (h)Gross margin..................................... 900,000 (i)Selling and administrative expenses. 585,000 (j)Net operating income........................ 315,000 (a)Interest expense................................ 45,000 Net income before taxes................... 270,000 (b)Income taxes (40%)........................... 108,000 (c)Net income........................................ $ 162,000 (d)
Tanner CompanyBalance SheetDecember 31
Current assets:Cash................................................ $ 80,000 (f)Accounts receivable, net................. 200,000 (e)Inventory......................................... 320,000 (g)
Total current assets........................... 600,000 (g)Plant and equipment......................... 900,000 (q)Total assets........................................ $1,500,000 (p)Current liabilities............................... $ 250,000Bonds payable, 10%.......................... 450,000 (k)Total liabilities.................................... 700,000 (l)Stockholders’ equity:
Common stock, $2.50 par value..... 100,000 (m)Retained earnings........................... 700,000 (o)
Total stockholders’ equity.................. 800,000 (n)Total liabilities and equity.................. $1,500,000 (p)
© The McGraw-Hill Companies, Inc., 2008. All rights reserved.Solutions Manual, Chapter 16 919

Problem 16-19 (continued)Computation of missing amounts (other computational sequences are possible):
b. Net income before taxes = $315,000 – $45,000 = $270,000.
c. Income taxes = $270,000 × 40% tax rate = $108,000.
d. Net income = $270,000 – $108,000 = $162,000.
e.
Therefore, the average accounts receivable balance for the year must have been $180,000. The beginning balance was $160,000, so the ending balance must have been $200,000.
© The McGraw-Hill Companies, Inc., 2008. All rights reserved.920 Managerial Accounting, 12th Edition

Problem 16-19 (continued)f.
g.
h.
© The McGraw-Hill Companies, Inc., 2008. All rights reserved.Solutions Manual, Chapter 16 921

Problem 16-19 (continued)i. Gross margin = $2,700,000 – $1,800,000
j. Net operating income = Gross margin – Selling and administrative expenses
$315,000 = $900,000 – Selling and administrative expensesSelling and administrative expenses = $900,000– $315,000 = $585,000.
k. The interest expense for the year was $45,000 and the interest rate was 10%, so the bonds payable must total $450,000.
l. Total liabilities = $250,000 + $450,000 = $700,000.
m.
The stock is $2.50 par value per share, so the total common stock must be $100,000.
n.
© The McGraw-Hill Companies, Inc., 2008. All rights reserved.922 Managerial Accounting, 12th Edition

Problem 16-19 (continued)o. Total stockholders’ equity = Common stock + Retained earnings
$800,000 = $100,000 + Retained earningsRetained earnings = $800,000 − $100,000 = $700,000
p. Total assets = Total liabilities + Total stockholders’ equityTotal assets = $700,000 + $800,000 = $1,500,000. This answer can also be obtained through the return on total assets ratio:
Therefore the average total assets must be $1,350,000. The total assets at the beginning of the year were $1,200,000, so the total assets at the end of the year must have been $1,500,000 (which would also equal the total of the liabilities and the stockholders’ equity).
q. Total assets = Total current assets + Plant and equipment$1,500,000 = $600,000 + Plant and equipmentPlant and equipment = $1,500,000 − $600,000 = $900,000
© The McGraw-Hill Companies, Inc., 2008. All rights reserved.Solutions Manual, Chapter 16 923

Research and Application 16-20 (240 minutes)1. The 5-year horizontal analysis in dollar and percentage form is summarized below (dollar
amounts are in millions):2004 2003 2002 2001 2000
Sales............................................... $45,682 $40,928 $36,519
$32,602
$29,462
Earnings from continuing opera-tions............................................. $1,885 $1,619 $1,376 $1,101 $962
2004 2003 2002 2001 2000Sales............................................... 155% 139% 124% 111% 100%Earnings from continuing opera-
tions............................................. 196% 168% 143% 114% 100%The data reveal that Target has increased sales by 55% over the last five years. More importantly, the sales growth has been profitable; Target’s earnings from continuing operations have increased 96% over the same time period. Also, Target has consistently improved its performance. There were no unexpected drops in sales or earnings. This type of consistency is valued by investors.
© The McGraw-Hill Companies, Inc., 2008. All rights reserved.924 Managerial Accounting, 12th Edition

Research and Application 16-20 (continued)2. The common size comparative balance sheet is shown below (dollar amounts are in
millions):Target Corporation
Common-Size Comparative Balance SheetJanuary 29, 2005 and January 31, 2004
Common-Size Percentages
2004 2003 2004 2003AssetsCurrent assets:
Cash and cash equivalents.................... $ 2,245 $ 708 7.0% 2.3%Accounts receivable, net....................... 5,069 4,621 15.7% 14.7%Inventory............................................... 5,384 4,531 16.7% 14.4%Other current assets............................. 1,224 1,000 3.8% 3.2%Current assets—discontinued................ 0 2,092 0% 6.7% Total current assets.............................. 13,922 12,952 43.1% 41.2%
Property and equipment:Land...................................................... 3,804 3,312 11.8% 10.5%Buildings and improvements................. 12,518 11,022 38.8% 35.1%Fixtures and equipment........................ 4,988 4,577 15.4% 14.6%Construction-in-progress....................... 962 969 3.0% 3.1%Accumulated depreciation.................... ( 5,412 ) ( 4,727 ) ( 16.8%) ( 15.0% )
Property and equipment, net................... 16,860 15,153 52.2% 48.2%Other non-current assets......................... 1,511 1,377 4.7% 4.4%Non-current assets—discontinued........... 0 1,934 0.0% 6.2% Total assets............................................. $32,29 $31,41 100.0% 100.0%
© The McGraw-Hill Companies, Inc., 2008. All rights reserved.Solutions Manual, Chapter 16 925

3 6
© The McGraw-Hill Companies, Inc., 2008. All rights reserved.926 Managerial Accounting, 12th Edition

Research and Application 16-20 (continued)Common-Size Percentages
2004 2003 2004 2003Liabilities and shareholders’ in-
vestmentCurrent liabilities:
Accounts payable.................................. $ 5,779 $ 4,956 17.9% 15.8%Accrued liabilities.................................. 1,633 1,288 5.1% 4.1%Income taxes payable........................... 304 382 0.8% 1.2%Current portion of long-term debt......... 504 863 1.6% 2.7%Current liabilities—discontinued............ 0 825 0.0% 2.6%
Total current liabilities............................. 8,220 8,314 25.5% 26.5%Long-term debt..................................... 9,034 10,155 28.0% 32.3%Deferred income taxes.......................... 973 632 3.0% 2.0%Other noncurrent liabilities................... 1,037 917 3.2% 2.9%Noncurrent liabilities—discontinued...... 0 266 0.0% 0.9%
Total liabilities......................................... 19,264 20,284 59.7% 64.6% Shareholders’ investment:
Common stock...................................... 74 76 0.2% 0.2%Additional paid-in-capital...................... 1,810 1,530 5.6% 4.9%Retained earnings................................. 11,148 9,523 34.5% 30.3%Accumulated other income................... ( 3 ) 3 ( 0.0% ) 0.0%
Total shareholders’ investment............... 13,029 11,132 40.3% 35.4% Total liabilities and shareholders’ in-
vestment...............................................$32,29
3$31,41
6100.0% 100.0%
© The McGraw-Hill Companies, Inc., 2008. All rights reserved.Solutions Manual, Chapter 16 927

Research and Application 16-20 (continued)3. Target uses sales for its vertical analysis of profitability. This
can be confirmed by verifying how Target computed its gross margin rates (31.2% for 2004 and 30.6% for 2003) and selling, general and administrative (SG&A) expense rates (21.4% for 2004 and 21.2% for 2003) that are shown on pages 17-18 of the annual report. The computations are shown below:
2004 2003Sales............................ $45,682 $40,928Cost of sales................ 31,445 28,389 Gross margin............... $14,237 $12,539Gross margin............... $14,237 $12,539Sales............................ ÷
$45,682÷
$40,928Gross margin rate........ 31.2% 30.6%SG&A expense............. $9,797 $8,657Sales............................ ÷
$45,682÷
$40,928SG&A rate.................... 21.4% 21.2%
Target uses sales instead of total revenues as a base because total revenues include net credit card revenues. Page 17 of the annual report says “Net credit card revenues represent income derived from finance charges, late fees and other revenues from use of our Target Visa and proprietary Target Card.” These sources of revenue do not relate to the company’s primary business operations. Computing common-size income statement percentages using total revenue as the baseline could potentially distort conclusions about operational performance.
4. The calculations for these ratios are shown below (all numbers except per share information and percentages are in millions):Earnings per share: 2004Earnings from continuing operations.................... $1,885Average number of common shares outstanding. ÷
903.8Earnings per share—continuing operations.......... $2.09
© The McGraw-Hill Companies, Inc., 2008. All rights reserved.928 Managerial Accounting, 12th Edition

*Target did not have any preferred stock out-standing
© The McGraw-Hill Companies, Inc., 2008. All rights reserved.Solutions Manual, Chapter 16 929

Research and Application 16-20 (continued)Price-earnings ratio: 2004Market price per share......................................... $49.49Earnings per share—continuing operations.......... ÷ $2.09Price-earnings ratio.............................................. 23.68
Dividend payout ratio:Dividends per share.............................................. $0.31Earnings per share—continuing operations.......... ÷ $2.09Dividend payout ratio........................................... 14.8%
Dividend yield ratio:Dividends per share.............................................. $0.31Market price per share......................................... ÷
$49.49Dividend yield ratio.............................................. 0.6%
Return on total assets:Earnings from continuing operations ................... $1,885Add back interest expense: $570 × (1 − 0.378*). 355 Total (a)................................................................ $2,240Average total assets ($31,416 + $32,293)/2 (b). . $31,855Return on total assets (a) ÷ (b)............................ 7.0%*Provision for income taxes ($1,146) divided by
earnings before income taxes ($3,031) = 37.8%.
Return on common stockholders’ equity:Earnings from continuing operations.................... $1,885Average common stockholders’ equity
($13,029 + $11,132)/2.......................................÷
$12,081Return on common stockholders’ equity.............. 15.6%
Book value per share:Common stockholders’ equity.............................. $13,029Number of common shares outstanding............... ÷ 890.6Book value per share............................................ $14.63
© The McGraw-Hill Companies, Inc., 2008. All rights reserved.930 Managerial Accounting, 12th Edition

Research and Application 16-20 (continued)5. The calculations for these ratios are shown below (all dollar
figures are in millions):
Working capital: 2004Current assets.................................... $13,922Current liabilities................................ 8,220 Working capital................................... $ 5,702
Current ratio:Current assets.................................... $13,922Current liabilities................................ ÷
$8,220Current ratio....................................... 1.69
Acid-test ratio:“Quick” assets ($2,245 + $5,069)...... $7,314Current liabilities................................ ÷
$8,220Acid-test ratio..................................... 0.89
Inventory turnover:Cost of sales....................................... $31,445Average inventory ($5,384 +
$4,531)/2..........................................÷
$4,958Inventory turnover.............................. 6.34
Average sales period:Number of days in a year................... 365 daysInventory turnover.............................. ÷ 6.34Average sale period in days................ 57.6
days
Note to instructors: The accounts receivable turnover and average collection period are not calculated because it is impossible to determine the portion of Target’s total sales that are credit sales.
© The McGraw-Hill Companies, Inc., 2008. All rights reserved.Solutions Manual, Chapter 16 931

Research and Application 16-20 (continued)6. The calculations for these ratios are shown below (all dollar
figures are in millions):
Times interest earned ratio: 2004Earnings before interest expense and income
taxes..............................................................$3,601
Interest expense............................................... ÷ $570Times interest earned...................................... 6.3
Debt-to-equity ratio:Total liabilities.................................................. $19,264Stockholder’s equity......................................... ÷
$13,029Debt-to-equity ratio.......................................... 1.48
7. Target has better liquidity than Wal-Mart as measured by the current and acid-test ratios. Target turns over its inventory less frequently than Wal*Mart which is renowned for its supply chain management practices. While Wal*Mart’s times interest earned ratio is much higher than Target’s, both companies provide sufficient comfort to their long-term creditors in this regard. The companies have comparable debt-to-equity ratios. Target’s return on total assets is lower than Wal-Mart’s; however, Target’s slightly higher price-earnings ratio suggests that investors believe Target has modestly stronger earnings growth prospects than Wal-Mart.
© The McGraw-Hill Companies, Inc., 2008. All rights reserved.932 Managerial Accounting, 12th Edition