chapter 2 description of alternatives - united states army
TRANSCRIPT

Chapter 2 • Description of Alternatives
March 2013 2-31
2.4 Description of the No Action and Action Alternatives The alternatives described below represent a range of scenarios that could be implemented at Eufaula Lake to revise SMP shoreline allocations and MP land use classifications, change policies related to vegetation management along the shoreline, and grant site-specific zoning requests and requests for leases of government property. In addition to fulfilling NEPA requirements, analysis of the No Action and action alternatives described below represent a broad range of potential outcomes and associated environmental impacts that could occur as a result of potential zoning and policy changes.
Each action alternative described in Section 2.4 considers rezoning areas of the USACE-owned shoreline. The No Action Alternative would maintain the current shoreline allocations found in the 1998 SMP and the existing baseline condition of land management.
2.4.1 Summary of Alternatives 2.4.1.1 Shoreline Allocations and Land Use Classifications by Alternative The following tables and graphs present a summary of shoreline allocations and vegetation management policy options under the No Action and action alternatives. Table 2-7 and Figure 2-18 summarize the overall miles of shoreline in each shoreline allocation for each alternative. Table 2-7 also shows the percent change as compared to the No Action Alternative. Table 2-8 summarizes the MP land use classifications in acres for each alternative and the percent change as compared to the No Action Alternative.
Alternatives 1 and 2 would generally result in an increase in Protected allocations and a decrease in Limited Development allocations. Alternative 1 would result in the greatest decrease in Limited Development. Alternatives 3 and 4 would result in an increase in Limited Development allocations with a corresponding decrease in Protected allocations. Alternative 4 would result in the greatest increase in Limited Development. The Preferred Alternative would slightly decrease the amount of Limited Development shoreline compared to the No Action Alternative. The Preferred Alternative and Alternative 4 are the only alternatives that would result in a change in Public Recreation allocation as they would both increase the shoreline miles allocated to Public Recreation.

Chapter 2 • Description of Alternatives
March 2013 2-32
Table 2-7. SMP Shoreline Allocations (miles) by Alternative Compared to the No Action Alternative
Shoreline Designation
No Action Preferred Alternative Alternative 1 Alternative 2 Alternative 3 Alternative 4
Miles1 Miles1 Percent Change2 Miles1
Percent Change2 Miles1
Percent change2 Miles1
Percent change2 Miles1
Percent change2
Limited Development 273 265 -3 42 -85 182 -33 367 +34 480 +76
Protected3 431 432 0 661 +53 521 +21 335 -22 217 -50
Unencumbered 214 215 0 444 +107 304 +42 118 -45 0 -100
Encumbered 217 217 0 217 0 217 0 217 0 217 0
Public Recreation 103 1114 +8 1054 +2 1054 +2 1054 +2 1114 +8
Prohibited 1 1 0 1 0 1 0 1 0 1 0
Legend:
Decrease in shoreline allocation
Increase in shoreline allocation
No change in shoreline allocation
1 - Miles of USACE-owned shoreline
2 - Percent change as compared to the No Action Alternative, which is the existing condition
3 – Encumbered Protected shorelands are those areas that USACE has leased or licensed to another agency or organization. Most of these are lands that are licensed to ODWC for fishing and hunting purposes.
4 – A map correction to correctly account for Onapa Cove under the action alternatives would result in an increase of two miles of shoreline allocated to Public Recreation. Additional increases in Public Recreation under Alternative 4 and the Preferred Alternative would be due to changes at Carlton Landing and for individual zoning requests.
Note: There are slight variations in the total miles between alternatives due to the size of the study area and imprecision in the input data which result minor differences in registration between the GIS map layers used in the development of each alternative.

Chapter 2 • Description of Alternatives
March 2013 2-33
Figure 2-18. SMP Shoreline Allocations (Miles) by Alternative
0
100
200
300
400
500
600
700
No Action Alternative 1 Alternative 2 Alternative 3 Alternative 4 PreferredAlternative
Limited Development
Protected
Public Recreation
Prohibited

Chapter 2 • Description of Alternatives
March 2013 2-34
Table 2-8. MP Land Use Classifications (acres) by Alternative Compared to the No Action Alternative
Land Use Classifications (SMP Shoreline
Designation)
No Action
Preferred Alternative Alternative 1 Alternative 2 Alternative 3 Alternative 4
Acres1 Acres1 Percent Change2 Acres1
Percent Change2 Acres1
Percent change2 Acres1
Percent change2 Acres1
Percent change2
Operations (Prohibited) 133 133 0 133 0 133 0 133 0 133 0
High Density Recreation (Public Recreation) 10,3533 10,663 +3 10,353 0 10,353 0 10,353 0 10,656 +3
Wildlife Management (Protected) 29,892 31,5694 +6 29,892 0 29,892 0 29,892 0 29,892 0
Vegetation Management (Protected) 0 1355 +100 0 0 0 0 0 0 0 -100
Environmentally Sensitive Areas (Protected) 70 70 0 70 0 70 0 70 0 0 -100
Low Density Recreation (Protected) 15,659 15,045 -5 22,998 +47 18,658 +19 9,522 -39 0 -100
Low Density Recreation (Limited Development) 10,114 7,872 -22 1,073 -89 5,330 -47 14,708 +45 22,872 +126
Future/Inactive Recreation (Protected) 4743 993 -79 474 0 474 0 216 -54 0 -100
Easement Lands (Flowage easements) 31,667 31,667 0 31,667 0 31,667 0 31,667 0 31,667 0
Legend: Decrease in land classification allocation No change in land classification allocation Increase in land classification allocation 1 - Acres of government lands between the shoreline (at conservation pool) and the upland boundary of the USACE-owned lands; except for easement lands which are areas
upland from the lands owned in fee simple and are lands over which USACE only holds an easement for certain flood management activities. 2 - Percent change as compared to the No Action Alternative, which is the existing condition. 3 – Under the current MP there are four areas totaling 474 acres that are designated as High Density Recreation; however, these areas have not been developed and are
managed as though they were classified “Future/Inactive Recreation”. They are shown under Future/Inactive Recreation. These areas include Roundtree Landing, Big Ridge, Canadian Landing, and Duchess Creek. Under the Preferred Alternative, only Duchess Creek would remain in this designation.
4 – An area on the South Canadian river that was water at the time of the 1998 SMP has silted in and this new land area is included in the ODWC lease area in the Preferred Alternative.
5 – An area at Dam Site North would be designated for protection of American Burying Beetle habitat under the Preferred Alternative. Note: There are slight variations in the total acres between alternatives due to the size of the study area and imprecision in the input data which result minor differences in
registration between the GIS map layers used in the development of each alternative.

Chapter 2 • Description of Alternatives
March 2013 2-35
2.4.1.2 Vegetation Management Zone Policies by Alternative All of the proposed buffer vegetation management zone policies would provide for protection of shoreline vegetation and soils within specified distances of the shoreline. Each vegetation management zone is characterized by a specific buffer width and these policies would only apply to Limited Development allocated shoreline areas. Vegetation modification may be allowed in areas adjacent to Protected shorelines, but this is limited to firebreaks and minor clearing that may be needed for informal access paths. Therefore, the proposed vegetation management zone policies, which would require the preservation of a buffer of natural vegetation between the water and the extent of the area being mowed, would only apply to areas adjacent to Limited Development shorelines.
The miles of shoreline within each zone are summarized by alternative in Table 2-9 and by acres in Table 2-10. The miles and acreages in each zone would vary by alternative in relation to the amount of Limited Development shoreline allocations under each alternative. Table 2-10 shows the number of acres of USACE-owned lands over which each buffer zone is applied. Therefore, a portion of this area could be mowed or have other vegetation management practices applied to it with an approved vegetation management permit. A discussion of the benefits of vegetated buffers is found in Appendix I at the end of the Category A comment responses in a section titled “Benefits of Vegetated Buffers”. The vegetation management zone policy would not apply to the No Action Alternative, so it is not included in Table 2-9 or 2-10.
Table 2-9. Vegetation Management Zones by Action Alternative (miles of shoreline)1
Proposed Buffer Width(feet) 2 Fire-break only 3
No Mowing Total 20 30 35 45 55 60 70 80 95
Alternative 1 (extended)
N/A N/A N/A 0 1 0 37 2 1 0 1 42
Alternative 2 (extended)
N/A N/A N/A 0 6 0 159 6 9 1 1 182
Alternative 3 (baseline)
0 11 0 312 7 N/A 24 N/A N/A 1 12 367
Alternative 4 (baseline)
0 20 0 396 7 N/A 41 N/A N/A 5 11 480
Preferred Alternative
N/A N/A N/A 265 N/A N/A N/A N/A N/A N/A N/A 265
N/A = Not Applicable – this buffer width does not occur under this alternative
1 – Vegetation Management Zone policy only applies to shorelines designated as Limited Development.
2 - Buffer widths are based on a combination of slope, soil type, and vegetation cover as described in Section 2.3.2. Buffers would be measured inland from the natural vegetation line above the normal conservation pool elevation.
3 – Permits for all vegetation management are issued on a case by case basis including for the creation of firebreaks. Firebreak width would be determined based on a review of site specific conditions.

Chapter 2 • Description of Alternatives
March 2013 2-36
Table 2-10. Vegetation Management Zones by Action Alternative (acres) 1
Proposed Buffer Width (feet) 2 Fire-break only 3
No Mowing Total 20 30 35 45 55 60 70 80 95
Alternative 1 (extended buffers)
N/A N/A N/A 0 14 0 932 60 37 0 30 1,073
Alternative 2 (extended buffers)
N/A N/A N/A 0 159 0 4,288 432 338 47 66 5,330
Alternative 3 (baseline buffers)
0 352 0 10,459 441 N/A 1,318 N/A N/A 141 1,997 14,708
Alternative 4 (baseline buffers)
0 1,075 0 15,495 580 N/A 2,980 N/A N/A 661 2,081 22,872
Preferred Alternative N/A N/A N/A 7,798 N/A N/A N/A N/A N/A N/A N/A 7,798
N/A = Not Applicable – this buffer width does not occur under this alternative
1 – Vegetation Management Zone policy only applies to shorelines designated as Limited Development.
2 - Buffer widths are based on a combination of slope, soil type, and vegetation cover as described in Section 2.3.2. Buffers would be measured inland from the natural vegetation line above the normal conservation pool elevation.
3 – Permits for all vegetation management are issued on a case by case basis including for the creation of firebreaks. Firebreak width would be determined based on a review of site specific conditions.
Where the government lands are a very narrow band that does not have sufficient width to accommodate either the applicable buffer zone or a standard fire break, the allowable shoreline vegetation modifications would be evaluated on a case by case basis. “Firebreaks” allowed under a shoreline use permit for vegetation modification would only allow mowing, clearing of trees less than 3 inches in diameter, and limbing of trees up to 8 feet above the ground. In addition, where high quality habitat occurs that could be impacted by vegetation modification, mowing may be restricted to no more than the first 30- feet of government land immediately adjacent to the private property for fire break purposes only. This would also be determined on a case by case basis.
2.4.1.3 Potential Boat Docks by Alternative One of the key components in determining impacts is the number and density of boat docks. Private boat docks may only be permitted along shorelines allocated as Limited Development. The shoreline management regulations limit the amount of shoreline that can be developed to 50 percent of the area allocated as Limited Development (36 CFR 327.30). Therefore, the number of shoreline miles is first divided in half before calculating the maximum number of docks that could potentially be constructed.
The current SMP further requires boat docks to be placed a minimum of 50 feet from other docks. Although in reality, the average distance between docks tends to be greater than 50 feet because of factors such as irregular shorelines or shallow water depths; this 50-foot spacing provides a maximum density for consideration of potential effects under the No Action Alternative and Alternatives 1, 2,3, and 4. The Preferred Alternative would change this minimum spacing to 75 feet.

Chapter 2 • Description of Alternatives
March 2013 2-37
The average boat dock width at Eufaula Lake is 31.8 feet. If the docks are spaced 50 feet apart, then there would be a minimum of 81.8 feet of shoreline length per boat dock. The maximum potential number of boat docks by alternative is then calculated as follows:
Miles of shoreline allocated as Limited Development divided by 2
1 mile = 5,280 feet
Average dock width at Eufaula Lake = 31.8 feet
Required dock spacing = 50 feet between docks (75 feet under the Preferred Alternative)
Minimum amount of space per dock = 81.8 feet (106.8 feet under the Preferred Alternative)
Maximum number of docks = Feet of Limited Development Shoreline/minimum space per dock
Table 2-11 summarizes the maximum potential number of boat docks that could theoretically be constructed under each alternative. The actual number would be considerably less due to the physical constraints of the shoreline. Under the Preferred Alternative, not all of the shoreline designated as Limited Development may be suitable for docks. Shoreline use permits for private floating facilities would continue to be issued on a case-by-case basis depending on site specific conditions at the time of the application. The analysis on all alternatives in this EIS assumes a “worst case” scenario that all Limited Development shorelines allocated under each alternative could have the maximum potential number of docks constructed.
Table 2-11. Maximum Potential Number of Private Boat Docks Under Each Alternative
Alternative
Limited Development
Shoreline (miles)
Miles Available for Dock
Construction
Limited Development
Shoreline (feet) Maximum Number
of Docks 1 No Action 273 136.5 720,720 8,810 Alternative 1 42 21 110,880 1,355 2 Alternative 2 182 91 480,480 5,873 Alternative 3 367 183.5 968,880 11,844 Alternative 4 480 240 1,267,200 15,491 Preferred Alternative 265 132.5 699,600 6,550 1 - The maximum potential number of docks that could be built under each alternative is based on an average width of 31.8 feet and a minimum dock spacing of 50 feet except under the Preferred Alternative which is based on a minimum spacing of 75 feet.
2 – Although this value is less than the total number of existing docks, over half of the existing docks (908) are located outside of areas that would be designated as Limited Development under Alternative 1. A closer analysis of the individual segments that would be allocated as Limited Development under Alternative 1 reveals that an additional 605 docks could be constructed along the Limited Development shorelines under Alternative 1 for a total potential number of 2,278 docks.
In addition, the rate at which new boat docks are constructed needs to be considered in determining a reasonable future number of boat docks. Many USACE lakes experience a slow initial growth in the number of docks and then as the area becomes established and the housing market matures, the rate at which new docks are constructed increases. At Eufaula Lake, the number of boat docks at several points in

Chapter 2 Description of Alternatives
March 2013 2‐38
time is shown in Table 2‐12 and the average number of boat docks per year is shown for each time period.
It appears that the number of docks constructed experienced a surge in the early 1980s, but that the rate
of new construction has increased at a much lower 10 percent over the past two decades. Assuming that
this trend continues, it is possible to make a prediction about how long it might take to achieve full build
out and about the number of boat docks that might be reasonably expected in the near future of 20 years.
Table 2‐12. Historical Growth in Boat Dock Numbers
Year1
Number of Boat
Docks
Average Number
Constructed Per Year
from Prior Date Increase in Rate
1976 365
1981 452 17.4
1986 630 35.6 100%
1998 1100 39.2 10%
2011 1673 44.1 12%
1‐ The years evaluated include the values reported in each SMP revision plus the number of current docks as of 2011.
Table 2‐13. Predicted Growth in Boat Docks over Next 20 Years
Year
Average Number
Constructed Per Year 1
Predicted Number of
Boat Docks
2016 48.5 1,916
2021 53.4 2,183
2026 58.7 2,477
2031 64.6 2,800
1 – assumes that the rate at which boat docks are constructed continues to increase according to historic trends.
Another method of calculating potential growth is to use the historical residential growth rate of 3
subdivisions per year with a total of approximately 123 lots per year. Over the next 20 years, this would
result in 2,460 new lots, not all of which would be waterfront lots with the potential to construct docks.
However, consistent with historical development patterns in the study area, it is reasonable to assume that
many of those potential subdivisions would be sited adjacent to the lake in order to take advantage of the
amenities offered by lake access and the potential for docks. Using the historical growth rate of residential
development, the potential number of new docks over the next 20 years would be similar to the value
calculated based on historical trends in the number of dock permits issued.
Over a longer time frame, such as the next 100 years, historical patterns of residential growth would result
in fewer potential docks constructed than are predicted using historical trends in dock approval rates. This
means that using the dock approval rates results in a faster “build out” to the maximum number of
potential docks. A faster build out would place greater stress on the resource categories evaluated sooner
than would occur if the residential growth rate is applied. Therefore, the historical rate of dock approvals
will be used as the more conservative measure of potential impacts.
2.4.2 No Action Alternative NEPA requires the alternatives analysis to include the No Action Alternative (40 CFR 1502.14(d)). With
respect to the SMP revision and MP supplement, "no action" would mean "no change" from current
management direction or level of management intensity. Under the No Action Alternative, there would be
Chapter 2 • Description of Alternatives
March 2013 2-39
no change to the existing shoreline allocations or land use classifications under the MP, none of the pending zoning requests would be granted, there would be no change to the vegetation management policies, and the MP would continue to be out-of-date with respect to the SMP. With respect to the proposed development project at Carlton Landing, “no action” would mean that the grant of a lease would not be approved and proposed public shoreline recreational facilities on government lands would not be permitted. This would have implications for the proposed development on the private lands. Thus, the No Action Alternative represents the future state of the environment without any of the alternatives. The No Action Alternative is evaluated in detail in this EIS. This No Action Alternative serves as the baseline for comparison when assessing the potential impacts of the other alternatives.
The No Action Alternative includes the following main components:
Existing shoreline allocations under the SMP would not change.
MP land use classifications maps would not be revised to be consistent with the 1998 SMP shoreline allocations. Although the maps would not be revised, land would continue to be managed as though the MP were consistent with the 1998 SMP. This is the existing baseline condition with respect to land management.
Existing vegetation management policies would not change.
The lease request for a marina and other public recreation facilities at Carlton Landing would not be approved.
No action would be taken on the individual zoning requests to change shoreline allocations.
2.4.2.1 Shoreline Allocations and Land Use Classifications Under the No Action Alternative, the existing distribution of shoreline allocations would remain unchanged. None of the individual zoning requests would be approved and the rezone request related to proposed shoreline development at Carlton Landing would also not be approved with associated consequences for the proposed development on adjacent private lands (described in further detail below).
The miles of each shoreline allocation under the No Action Alternative are summarized in Table 2-1. Land use classifications under the MP and the number of acres under the baseline condition are provided in Table 2-2. Existing shoreline allocations would not change under the No Action Alternative. The MP maps would not be revised and so would remain inconsistent with the 1998 SMP and existing land management.
The location and extent of each shoreline allocation is shown on Figures 2-1 through 2-7, which are located earlier in this Chapter.
The areas allocated as Limited Development would be the areas where the greatest potential for shoreline effects would occur. The Limited Development areas are where private shoreline uses such as boat docks may be allowed and/or where shoreline vegetation may be modified with a shoreline use permit. Currently there are 1,673 private and community docks along Limited Development shorelines. Under the No Action Alternative, which would maintain the current 273 miles of Limited Development allocated shoreline, there could be a potential maximum of 8,810 docks. While the actual number would likely be considerably less due to the physical constraints of the shoreline, this maximum build out scenario

Chapter 2 • Description of Alternatives
March 2013 2-40
illustrates that there is considerable potential for growth in the number of docks under the No Action Alternative.
Using the historical growth rate of 10 percent applied to the average number of docks constructed over each five year period to project future growth in dock numbers, the maximum potential number of docks allowed under the No Action Alternative would be reached in just over 70 years. While USACE lakes typically start with a slow build up in the numbers of boat docks followed by what seems like an exponential increase, a growth rate that continues to compound over a span of 70 years or more is also probably unrealistic. Therefore, it is likely that full build-out would take much longer than estimated here.
Another limitation on the total number of boat docks and/or the timing at which that number might be reached is the processing time needed to review and approve shoreline permits. Under the projected growth rate in permit applications, the Eufaula Lake Project Office would need to process almost 170 new applications a year during the final decade. This is almost four times more than the number of new permits for docks that are currently processed annually. This would require a large number of staff to process the new applications in addition to dock renewal permits and to conduct required inspections (approximately 20 percent of existing dock permits are renewed each year). Given that these staffing levels are probably unrealistic, the potential to reach a milestone of over 8,800 docks in approximately 70 years is unlikely.
2.4.2.2 Vegetation Management Policies Under the No Action Alternative, there would be no change to the existing vegetation modification policies. Under existing conditions, in the 1998 SMP, permit applications for modification of vegetation along the shoreline are considered on a case by case basis by the Lake Manager. When issued, a vegetation modification permit may allow mowing of an area from the private property to the shoreline within the width of the private property extended onto the public land. When there is significant wildlife or scenic/aesthetic areas that could be impacted by mowing, the mowing is required to be restricted to no more than a 30-foot strip of public property adjacent to the private property. Current regulations restrict the removal of any flowering trees or shrubs, regardless of the size, as well as trees or shrubs larger than 4 inches in diameter.
Policies related to land-based shoreline uses, and erosion control activities under the No Action Alternative would remain the same as those outlined in the 1998 SMP. Policies related to the trimming of trees and the burning of dead or downed timber would also remain unchanged.
2.4.2.3 Proposed Carlton Landing Development (No Action Alternative) As described above, the No Action Alternative would result in no change to the existing SMP allocations or MP land classifications around Eufaula Lake. Additionally, under the No Action Alternative, the lease agreement required for construction and operation of the proposed marina and other public recreation facilities at Carlton Landing would not be granted by USACE.
Under the existing conditions, USACE-owned land along the shoreline in the area of Carlton Landing (including Roundtree Landing) is designated as Protected (approximately 5.8 miles of shoreline and 301 acres) (Figure 2-3). The MP land use classification is partially High Density Recreation (258 acres), which is in conflict with the SMP allocation, and partially Low Density Recreation (43 acres), which is consistent with the SMP. Current management treats the area as though it were classified Future/Inactive Recreation

Chapter 2 • Description of Alternatives
March 2013 2-41
which is consistent with the SMP designation. Under the No Action Alternative, the shoreline allocation, the land use classification, and the current management practice would not change.
Limited Development shoreline areas and some docks exist across Longtown Arm on the south side of the lake from the Carlton Landing development. Some of this area on the south side of Longtown Arm is also owned by Humphreys Partners 2009 LLC and currently contains a dock that is being used by the Carlton Landing development. With implementation of the No Action Alternative, the proposed Carlton Landing development request to change the shoreline allocation along Roundtree Landing and on the north side of Longtown Arm in the vicinity of Carlton Landing from Protected to Public Recreation would not be approved by USACE. The existing dock on the south side of Longtown Arm would remain and there would continue to be the possibility for permitting of additional private docks on the south side of the arm (Area L on Figure 2-11). In addition, the boat valet service connecting the north and south sides of Longtown Arm would remain.
The private lands in the vicinity of the proposed “town center” for Carlton Landing extend below the shoreline elevation of 585 feet above mean sea level. Therefore, public use of and access to the shoreline in this area would not be regulated under the SMP; although the Protected shoreline designation would not allow docks to be constructed in this area (Area F on Figure 2-11). The town center area comprises approximately 4 percent (approximately 0.25 miles) of the overall shoreline bordering Carlton Landing (Humphreys 2011).
Implementation of the No Action Alternative and continuation of existing zoning, would allow for continued access to one boat dock on the south side of Longtown Creek which currently provides for approximately 15 boat slips. This would accommodate lake and boating access for approximately 15 to 20 Carlton Landing homes compared to the 275-300 boat slip marina proposed under full build-out (described in Alternative 4). While there would be the possibility of constructing another dock on the south side of Longtown Creek to accommodate additional individual boat slips, the limited access would make them less attractive to homeowners on the north side of the lake and the number of boats that could be accommodated would be considerably less than with the proposed marina. In addition, the public benefits of the proposed marina facilities would not be realized, further limiting public recreational opportunities in this part of the lake.
Under the No Action Alternative, residential and commercial development on the adjacent private lands would be limited to the first phase, which began in early 2011. The first lots under development are those closest to the lake on the north side of Longtown Creek (southeastern part of Carlton Landing’s master plan area). Figure 2-8 shows the general layout of Carlton Landing. The first phase of development is planned to consist of approximately 170 residential lots, a conference and retreat facility, community parks and green spaces, one community swimming pool, and commercial/multi-family areas. Some of the residential lots (approximately 4 to 10) would be developed with multifamily units, making the number of residential units greater than the total number of lots. The commercial/multi-family development would consist of a mixture of mixed-use condominium or apartment units, live-work units, and 2-bedroom units that could be split into two separate units, for a total potential of 152 multifamily units.
As described above, the continuation of existing zoning under the No Action Alternative would not allow for boating access from the current master plan community area. As boating access from this area would be one of the main attractions for interested home buyers, it is assumed that implementation of the No Action Alternative would limit development at Carlton Landing, as described above, to the initial 170 lots.

Chapter 2 • Description of Alternatives
March 2013 2-42
In addition, the shoreline would not be developed or available to the public for recreational activities such as walking, camping, swimming, horseback riding, and bicycling. The USACE-owned lands would continue to provide habitat for wildlife and fishing access.
The majority of the development on the adjacent private lands under the No Action Alternative is planned to be residential (up to 170 lots total). Commercial activity would be limited to work-from-home businesses, restaurants that could fit into single-family residential building types, and commercial kiosks/food trucks. This would limit the ability of the development to provide the full range of proposed community amenities such as private security and a concentration of businesses that would allow many residents to live within walking distance of services.
2.4.3 Preferred Alternative The Preferred Alternative represents a balance between Limited Development and Protected shorelines. While the proportions are not very different from the No Action Alternative, the locations of the various allocations are informed by the analysis that was conducted in the Draft EIS and its associated technical studies and by public and agency input. This alternative would change the MP land use classifications to be consistent with the SMP designations, correct mapping errors discovered during this review, and to designate specific areas to offset potential impacts on the American Burying Beetle, an endangered species. The Preferred Alternative includes the following main components:
Limited Development shoreline allocations would be slightly reduced compared to the No Action Alternative and the MP land classification “low density recreation” would be applied to those areas.
MP land use classification maps would be revised to be consistent with the SMP shoreline allocations.
The vegetation management policies would be changed to require a 45-foot vegetation buffer along the shoreline. This policy would take effect immediately for new shoreline permit applications and would be phased in over a five-year period for existing permits.
The Preferred Alternative is the only alternative that would change the dock access requirements. Under the Preferred Alternative, access would be measured from the center of a lot to the closest point on the shoreline. A dock could be approved there or within 125 feet either side of that location, depending on local conditions.
Dock spacing under the Preferred Alternative would be changed to a minimum of 75 feet between docks.
The request for Public Recreation shoreline allocation at Carlton Landing would be approved.
The lease request for a marina and other recreational amenities at Carlton Landing would be granted.
Most individual zoning requests would be approved.
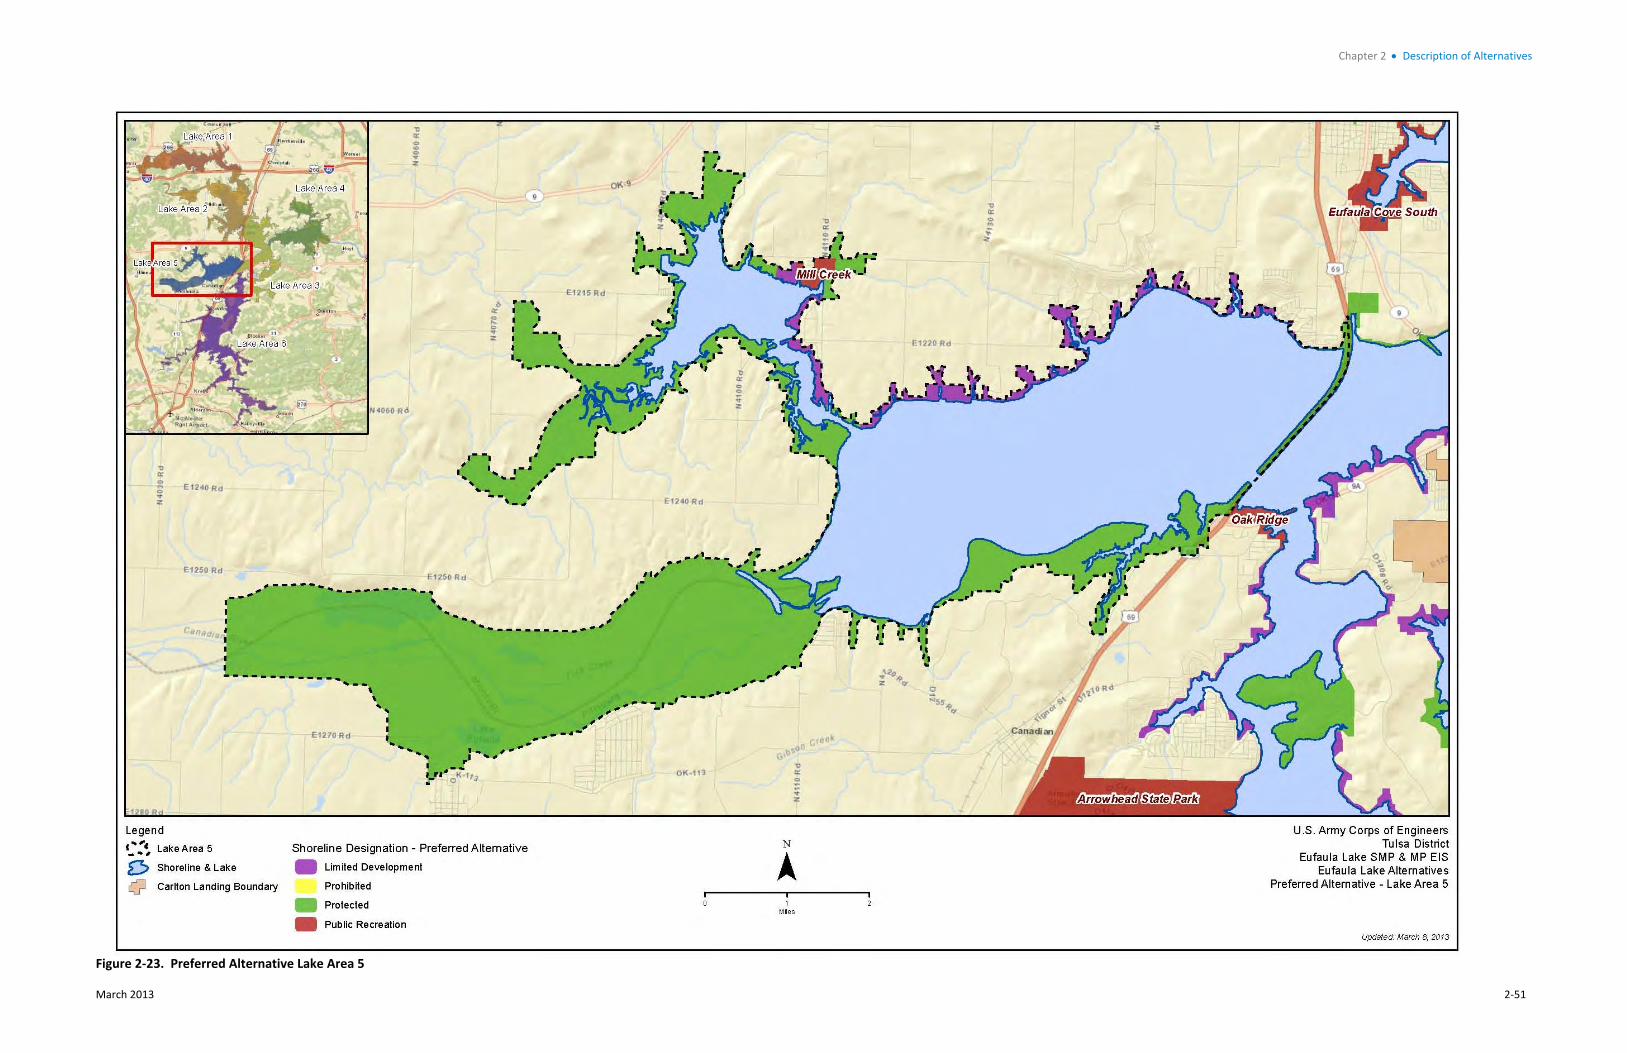
2.4.3.1 Shoreline Allocations and Land Use Classifications The Preferred Alternative would slightly reduce the amount of shoreline allocated to Limited Development and increase the amount of Public Recreation shoreline. Figures 2-19 through 2-25 illustrate the SMP shoreline allocations proposed under the Preferred Alternative. Figures showing the corresponding MP land use allocations are shown in Appendix L. Although the shoreline allocations and land use

Chapter 2 • Description of Alternatives
March 2013 2-43
classifications under the Preferred Alternative would be very similar to those under the No Action Alternative, a key difference between the two alternatives would be the different shoreline allocations at Carlton Landing, implementation of vegetation buffers (see Section 2.4.3.2), and mitigation measures as described in Chapters 4 and 6 under the Preferred Alternative.
Under the Preferred Alternative, Limited Development shoreline miles would be reduced from 273 to 265 miles and Protected shoreline miles would change from 431 miles to 432 miles (Table 2-7). The total acres classified as Low Density Recreation in the MP would also be reduced slightly to 17,800 acres (Table 2-8). The shoreline miles allocated to Public Recreation would increase to 111 to properly account for Onapa Cove and the revision at Carlton Landing. Undeveloped High Density Recreation areas would be reclassified in the revised MP as Future/Inactive Recreation and adjustments would be made to the Wildlife Management and Environmentally Sensitive Areas classifications to account for shoreline alterations, former mapping errors, and American Burying Beetle habitat protection. There would be no change in Prohibited allocations (Tables 2-7 and 2-8).
The Preferred Alternative would convert 6 miles of Protected shoreline at Carlton Landing to Public Recreation and 2 miles of Limited Development shoreline at Onapa Cove to Public Recreation. Approximately 11 miles of shoreline would be changed from Protected to Limited Development at the individual zoning request locations that would be approved under this alternative (Section 2.4.3.6).
Approximately 19 miles of Limited Development shoreline would be converted to Protected based on suitability for docks. Dock suitability is described under Alternative 2 in Section 2.4.5.1. When compared to Alternative 2, which would convert all areas that are unsuitable for docks to Protected allocations, the Preferred Alternative would maintain about 60 miles of shoreline as Limited Development although those shorelines may not be suitable for docks. Shoreline use permits for private floating facilities would continue to be issued on a case-by-case basis depending on site specific conditions at the time of the application. The analysis on all alternatives in this EIS assumes a “worst case” scenario that all Limited Development shorelines allocated under each alternative could have the maximum potential number of docks constructed.
Under the Preferred Alternative, which would decrease the Limited Development allocated shoreline to 265 miles, there could be a potential maximum of 6,550 docks. This number is based on the proposed dock spacing of 75 feet rather than the 50-foot spacing used in calculating maximum potential dock numbers under the other alternatives. While the actual number of docks would likely be considerably less due to the physical constraints of the shoreline, this maximum build out scenario illustrates that there is substantial potential for growth in the number of docks under the Preferred Alternative as compared to the existing condition.
Using the projected growth rate in permit applications to project future growth in dock numbers, the maximum potential number of docks allowed under the Preferred Alternative would be reached in slightly less than 65 years. The potential maximum number of docks under the Preferred Alternative is about 26 percent less than the potential full build out of the No Action Alternative.
Another limitation on the total number of boat docks and/or the timing at which that number might be reached is the processing time needed to review and approve shoreline permits. Under the projected growth rate in permit applications, the Eufaula Lake Project Office would need to process about 170 new applications per year during the final decade. This is over four times more than the number of new dock

Chapter 2 Description of Alternatives
March 2013 2‐44
permits that are currently processed annually. This would require a large number of staff to process the
new applications in addition to dock renewal permits and to conduct required inspections. Given that
these staffing levels are probably unrealistic, the potential to reach a milestone of over 6,500 docks in
approximately 65 years is unlikely.
2.4.3.2 Vegetation Management Policies
Under this alternative, a vegetation buffer of 45 feet would be applied to all approved vegetation
modification permits. The buffer would extend 45 feet inland from the from the natural vegetation line
above the normal conservation pool elevation. In order to limit effects on water quality, vegetation, and
wildlife habitat, vegetation management activities would be limited to government land outside of these
buffer zones. Where high quality habitat occurs that could be impacted by vegetation modification,
mowing may be restricted to no more than the first 30‐ feet of government land immediately adjacent to
the private property for fire break purposes only.
The Preferred Alternative would implement this policy change immediately for any new vegetation
modification requests. However, there would be a five year transition program for all existing permit
holders. That way USACE can assure that any written commitments to existing permit holders are honored
until their permit expires. Current permits that expire in 2018 or beyond would be required to incorporate
a buffer zone. Under the Preferred Alternative, woody vegetation within the buffer less than 3 inches in
diameter would still be allowed to be removed, and trees could be limbed up to one third of the tree
height to a maximum of 8 feet.
2.4.3.4 Dock Access Requirements
Under the current SMP, newly approved floating facilities are required to be placed within 500 feet of their direct access. Private property lines are extended to the water’s edge and the 500 foot limit is measured
from this location. Under the proposed revision, access would be measured from the center of the
common boundary to the closest point on the shoreline. A dock could be approved at this location. A dock
may be approved within 125 feet to either side of this location if minimum spacing requirements are not
met, a hazard condition exists at that location, or if the location is not suitable but suitable shoreline exists
within 125 feet. As under the current SMP, the exact location for dock placement is determined by the
Lake Manager with consideration being given to the allocation of space for future applicants. This
proposed policy change is not anticipated to have any effect on any of the resource categories and so it will
not be discussed further in the EIS.
2.4.3.5 Proposed Carlton Landing Development (Preferred Alternative)
Under the Preferred Alternative, the USACE‐owned shoreline along Carlton Landing shoreline and to the
north of the proposed development would be changed from Protected to Public Recreation (Figure 2‐21).
The MP classification would remain High Density Recreation and the management practice for the area
would change from Multiple Resource Management – Future/Inactive Recreation to High Density
Recreation. This change would affect 256 acres and another 43 acres of Low Density Recreation would
change to High Density Recreation for a total area of 299 acres. This differs from the proposal under
Alternative 4 because 2 acres would be set aside for protection of cultural resources. Approximately 5.8
miles of shoreline would be converted from Protected to Public Recreation (including on Roundtree
Landing). There would be no changes to the Limited Development‐designated areas along the south side

Chapter 2 • Description of Alternatives
March 2013 2-45
of Longtown Arm. Additionally, the associated lease necessary for the construction and operation of a marina and other public shoreline recreational facilities would be approved.
Under the Preferred Alternative, it is anticipated that there would be full build-out of the proposed public recreational facilities and uses on USACE lands along the shoreline; all of the amenities summarized in Table 2-5 would be developed, including the proposed 275 to 300 boat slip marina and the nature center. The marina is proposed to begin operations in 2014.
Following the approval of the rezone and issuance of a lease for the use of government land, it is anticipated that development of Carlton Landing on adjacent private lands would likely proceed as proposed by the developer. As described under the No Action Alternative, the first stage of development, located in the southeastern corner of the Carlton Landing development area, closest to the town center, began in early 2011 and includes construction of utilities to up to 170 lots. The first stage of development on these private lands would include a conference and retreat facility; community parks and common green spaces; and mixed-use commercial and multi-family buildings, including live/work and fractional ownership units. Completion of this first stage of residential development would be anticipated to take five to seven years.
Subsequent stages of development on the adjacent private lands would be anticipated to extend northwest from the shoreline of Eufaula Lake and would eventually include development of the 2,570 homes as summarized in Table 2-4 in the 1,650 acre master plan area. As described in Section 2.3.3, full build-out of the 1,650 acre development would also include a Kindergarten through twelfth grade school, an organic farm, a town center, community pools, public open spaces, and dog parks. Residential and mixed-use development on the adjacent private lands would be expected to be fully constructed and sold at a rate of approximately 79 lots per year over a 25 to 30 year timeframe depending on market demand.
2.4.3.6 Individual Zoning Requests under the Preferred Alternative Individual zoning requests to change Protected shoreline areas to Limited Development allocations may be approved under the Preferred Alternative if the shoreline area is not encumbered with an existing license agreement with another agency or organization and the area is suitable for docks. The following individual zoning requests would be approved under the Preferred Alternative. In addition, the request to change a small area of Limited Development to Public Recreation in Eufaula (Zoning Request #3) would be considered for approval under this alternative. Each request is described in detail in Section 2.3.4.
Zoning Request #3 – Lake Eufaula Association: This request is to change a Limited Development area to Public Recreation. This zoning change would affect approximately 0.3 miles of shoreline and 9 acres of government land.
Zoning Request #8 – Falcon Tree: This request is to change approximately two miles of Protected shoreline area to Limited Development.
Zoning Request #11 – Stone Ridge Estates: This request is to change over 2.7 miles of Protected shoreline area to Limited Development. This request would only be partially approved under the Preferred Alternative as much of the shoreline included in the request is not suitable for docks. In addition, a portion of the shoreline included in the request is adjacent to the bridge abutment for Highway 9. These areas would not be rezoned under the Preferred Alternative.

Chapter 2 • Description of Alternatives
March 2013 2-46
Zoning Request #13 – Fame Creek: This request is to change almost 6 miles of Protected shoreline area to Limited Development. This request would only be partially approved under the Preferred Alternative as much of the shoreline included in the request is not suitable for docks.
Zoning Requests #4, 5, 6, 7, and 10 that request maintenance of the existing Limited Development shoreline allocations in the vicinity of the requestors would be implemented under the Preferred Alternative as these shorelines would remain allocated as Limited Development.
Zoning Request #2 would not be approved because the proposed location is to be established for American burying beetle habitat protection. As a result of consultation with the USFWS on potential impacts of the proposed changes in shoreline zoning around the lake on beetle habitat, USFWS is requesting replacement of any habitat destroyed greater than 1.2 acres. This designation would provide approximately 135 acres of land that can be utilized to offset any Corps activities that may impact beetle habitat in other locations of the lake.
Zoning Request #9 would not be approved because the area is being considered for the expansion of the City of Eufaula’s lease and existing users would have priority.
Zoning Request #12 would not be approved because the proposed dock location is adjacent to US Highway 69. Since the shoreline management program begun it has been a long standing policy to not approve docks adjacent to major highways. 36 CFR 327.30 specifically requires USACE to protect the shoreline for public enjoyment, which includes view corridors. USACE has always interpreted that to mean that docks should not be allowed along major highways. As described in Section 4.5, scenic vistas from bridges and causeways have been identified by USACE as being of particular importance. These vistas offer views of varying terrain, geologic formations, and vegetation cover that are unique as compared to the surrounding plains. These scenic vistas are considered to be priority visual elements for Eufaula Lake.

Chapter 2 • Description of Alternatives
March 2013 2-47
Figure 2-19. Preferred Alternative Lake Area 1

Chapter 2 • Description of Alternatives
March 2013 2-48
Figure 2-20. Preferred Alternative Lake Area 2

Chapter 2 • Description of Alternatives
March 2013 2-49
Figure 2-21. Preferred Alternative Lake Area 3

Chapter 2 • Description of Alternatives
March 2013 2-50
Figure 2-22. Preferred Alternative Lake Area 4
Chapter 2 • Description of Alternatives
March 2013 2-51
Figure 2-23. Preferred Alternative Lake Area 5

Chapter 2 • Description of Alternatives
March 2013 2-52
Figure 2-24. Preferred Alternative Lake Area 6A

Chapter 2 • Description of Alternatives
March 2013 2-53
Figure 2-25. Preferred Alternative Lake Area 6B